Abstract
Public transport companies are aware that the success of their operations largely depends on the proper sizing and optimization of their processes. Among the key activities are the maintenance and repair of the vehicle fleet. This paper presents the application of mathematical optimization methods from the field of operations research to improve the efficiency of service workshops for bus maintenance and repair. Based on an analysis of collected data using queueing theory, the authors assessed the current system performance and found that the queueing system still has spare capacity and could be downsized, which aligns with the company’s management goals. Specifically, the company plans to reduce the number of bus repair service stations (servers in a queueing system). The main question is whether the system will continue to function effectively after this reduction. Three specific downsizing solutions were proposed and evaluated using queueing theory methods: extending the daily operating hours of the workshops, reducing the number of arriving buses, and increasing the productivity of a service station (server). The results show that, under high system load, only those solutions that increase the productivity of individual service stations (servers) in the queueing system provide optimal outcomes. Other solutions merely result in longer queues and associated losses due to buses waiting for service, preventing them from performing their intended function and causing financial loss to the company.
1. Introduction
Various companies operating in different sectors of the economy are aware that the success of their business depends on the proper dimensioning of their activities. The correct dimensioning of operations (production) is influenced by several factors, such as: revenue, profit, costs, spatial limitations, quality and quantity of available workforce, monetary policies of the state, etc.
The role of operations research in this regard is primarily to assist in optimal decision-making for the establishment or reorganization of business operations within a company. In today’s world, the focus is primarily on finding the optimal balance between a company’s costs and profits. This problem is particularly relevant for large state or municipal companies, whose production capacities are still dimensioned for maximum revenue, rather than for maximum profit.
A similar situation applies to the bus company addressed in this article, which has overdimensioned service workshops. The bus company is owned by the municipality, and the company’s service workshops are located in a location that is highly attractive to other investors. For this reason, the company has decided to sell part of the workshops used for bus repairs. Since this decision is primarily of a business nature, the company’s management and transportation experts began to ask themselves what impact this business decision would have, as it would significantly affect the bus company’s operational processes. The main question arising from this is whether the capacity of the remaining service workshops will be sufficient to meet current needs. As a result, they commissioned a study, which was conducted by the authors of this research, and the results are presented here.
The objective of the research is to provide appropriate solutions for the operation of the service workshops in the newly created situation, based on the results of the mathematical method.
Many authors have already dealt with the mathematical modeling of bus maintenance systems, but they did not use queueing theory methods. Savsar M. developed a simulation model based on several processes occurring in a bus maintenance workshop. These processes include the arrival and decision process, assigning repair distributions and resource quantities, the repair process, counting the buses repaired, and the time in the system [1]. Hangany A. and Shafahi Y. addressed the problem of planning bus maintenance activities. They used mathematical programming and took into account the daily operational schedule for all buses, along with the available resources for maintenance. They then attempted to design daily schedules for inspections and maintenance of buses with minimal interruptions in bus operations [2]. Maze T.H. and Allen R.C., through a survey completed by 92 bus maintenance managers, developed a system for measuring the performance of service workshops [3]. Landowski B. developed a model for operation and maintenance processes in public transport, which he analyzed as a stochastic process and described as a homogeneous Markov process [4].
In the review of previous research and the scientific literature, no studies were found where queueing theory was used to optimize the operations of service workshops for bus repairs. This is likely due to the difficulty in obtaining data from companies, as the vehicle servicing and repair times, as well as the waiting times of vehicles in line before entering the workshops, are considered business secrets. These factors directly influence the business success of companies involved in vehicle maintenance. As a result, companies are reluctant to release this data for public use. The same applies to this study, as the authors are not allowed to disclose the name of the company or the city where the research was conducted.
The closest study related to the maintenance of buses using queueing theory was conducted by Young-neng Xu and others, who focused on the optimization of maintenance for urban rail transit vehicles [5]. Further research was conducted to optimize workshops where critical components were sent for repair and servicing [6]. Other studies on maintenance optimization include research by Han, Qing Tian, et al., who studied maintenance optimization for an aircraft carrier, where maintenance tasks need to be highly optimized due to significant spatial constraints on the ship [7]. Similarly, Bebic, D., et al. conducted a similar study on ship maintenance [8]. In a broader context, outside of vehicle maintenance, a study using queueing theory was conducted to assist with planning, managing, and controlling workforce allocation at different service levels in distributed multi-phase maintenance processes for software [9].
Queueing theory is also widely used in the field of transportation. In road traffic, delays and queue lengths on highways, particularly at toll stations, have been evaluated [10,11,12,13,14]. In the case of bus transportation, queueing theory has been applied to bus stops [15,16,17,18]. In recent years, numerous studies have focused on queue management at electric vehicle charging stations for buses [19,20,21,22] and cars [23,24,25,26,27]. These mathematical optimization methods are also used for traffic planning in cities [28], including the optimization of green traffic waves [29]. Queueing theory is also applied in the optimization of railway traffic [30], airports [31], such as for baggage screening queues [32], taxi traffic [33,34], and even cable car traffic [35]. Furthermore, queueing theory is applied in optimizing other areas, such as warehousing [36], manufacturing [37], and other activities where queues occur. These applications show that queueing theory can be a valuable tool in improving the efficiency of maintenance operations in various transport sectors, including buses.
For the purposes of this research, a method from the field of operations research will be applied. First, the existing state of operations in the bus company’s service workshops will be analyzed, where data was obtained through the review of repair and maintenance records of the buses and through an interview with the workshop manager, who provided the necessary data for the calculations.
Next, queueing theory will be used to analyze the future state, where the operations in the workshops will be optimized, and various solutions will be proposed. For easier calculation using queueing theory, a tabular calculation was made in Microsoft Excel, where the necessary equations for the calculations were inserted.
This paper seeks to extend that body of knowledge by applying a classic multi-server queueing model to a bus company’s service workshops. Through this approach, we aim to provide insight into how such models can be used for practical business decisions regarding workshop downsizing while ensuring optimal operational efficiency.
Our focus is on a specific industrial application, namely the analysis of bus maintenance operations in service workshops. We used standard M/M/k models to assess the impact of reducing service station capacity. Nonetheless, we acknowledged the critical limitations of these models, such as the assumptions of Poisson arrivals and station homogeneity [15,16,20].
Future work will need to include real-time, timestamped data and advanced simulation methods to enable more accurate predictions and system optimization [24,26].
2. Materials and Methods
Based on the works of various authors who have addressed and presented queueing theory in their books [38,39,40,41,42], the authors of this article have studied queueing theory.
Queueing theory examines the quantitative properties of the organization of mass phenomena (processes). Massiveness and stochasticity are the fundamental properties studied by queueing theory. As such, this method is based on probability calculations and statistical analysis.
The foundations of queueing theory were established by the Scandinavian scientist Erlang, who studied the problems of telephone networks. This scientific discipline is now widely used in various fields, such as healthcare, manufacturing processes, banking, transportation, military activities, etc.
The basic structure of a queueing system consists of:
- -
- Arrival of users,
- -
- Queue of waiting users,
- -
- Service,
- -
- Departure of users.
Queueing theory determines the relationship between the properties of arrivals, waiting for service, service, customer behavior in the system, and user departures. The efficiency of a queueing system, depending on the characteristics of the problem and the goal of the problem, is expressed through various parameters, such as: the average number of users arriving per unit of time; the average number of users that can be served per unit of time; the average number of users departing from the system; the probability that users will be served immediately upon arrival; the average waiting time for service; the average number of users waiting for service; the average time users spend in the system; the ratio of the average number of served users to the average number of arriving users (relative throughput of the system); the average number of busy servers; the average utilization rate of working time.
The basic input data from which the analysis is derived are:
λ—arrival rate (intensity) of arrivals,
μ—service rate (intensity) per server,
k—number of servers.
The arrival rate and the service rate are the fundamental properties of a queueing system. They determine the organization of the system. It is sufficient for only one parameter to be stochastic.
Depending on the size and characteristics of the queueing system, we distinguish between:
- -
- Single-server queueing system,
- -
- Multi-server queueing system,
- -
- Closed queueing system,
- -
- Multi-server closed queueing system.
In a closed queueing system, the arrival rate is dependent on the system’s state. The system consists of a finite number of units, which can cease to operate at any given moment. For a unit that has stopped functioning to be reactivated, service is required. A characteristic of this system is the limited number of arrival producers.
In most cases, the arrival rate follows the Poisson distribution law of arrival probabilities.
Pn(t)—the probability of n arrivals in a time interval t,
λ—the average number of arrivals expected in that time interval (arrival rate or intensity),
For the event flow to be treated as Poisson, the following conditions must be met:
- The probability Pn(t) depends on the length of the time interval and the number of Arrivals
- The probability Pn(t) is independent of the number of arrivals before the time interval t,
- In a sufficiently small time interval, two or more arrivals cannot occur simultaneously.
Therefore, it holds that:
In the case where the time interval is one time unit (t = 1), the Poisson distribution takes the following form:
From this, it follows that the probability of no arrivals occurring in the time interval t0 is:
This probability is equal to the probability that the interval between two consecutive arrivals will be greater than or equal to t0, so the distribution function of the time interval between two consecutive arrivals can be written as:
or distribution law:
The mean value of the time interval between two arrivals is:
and the variance:
In most queuing systems, the goal is to reduce the service time, which is most accurately described by the exponential distribution with the following probability distribution function:
or distribution law:
In multi-server queuing systems, multiple customers can be served simultaneously. Figure 1 illustrates such a system. If the system is capable of serving up to k customers at the same time, it is referred to as a k-server queuing system.
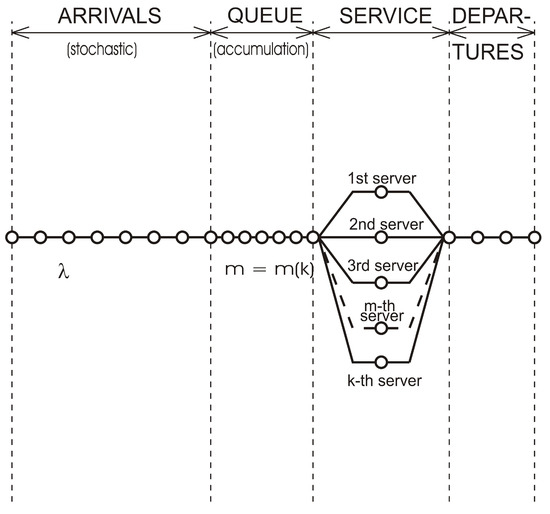
Figure 1.
Multi-server Queueing System.
An important parameter in queueing systems is the utilization factor. In multi-server queueing systems, we distinguish between:
- Utilization factor per server:
- Utilization factor of the system:
If ρ* < 1, the system is able to serve the customers, although some congestion may still occur. However, if ρ* > 1, the queue grows without bound and congestion increases indefinitely.
Other important performance indicators of a multi-server queuing system:
- The probability that there are no users in the system:
- Probability that there are n users in the system:
- Average number of users being served:
- Average number of users waiting for service:
- Average number of users in the system (waiting + being served):
- Average waiting time of a user before service:
- Average time a user spends in the system (waiting + being served):
3. Results—Solving a Real-World Case of Queueing Theory in the Bus Company’s Maintenance Workshops
Since the authors of this article promised the management of the company that the name of the company and the city, the workshop where the research was conducted, will not be disclosed in the publication of the research, the data provided below pertains to the maintenance workshop of a bus company with around 220 buses. The data was obtained from the head of the maintenance workshop.
3.1. Problem Description
The bus company’s service workshops have 60 workstations in larger facilities. These workstations are mainly service stations (servers) and lifts for vehicle repairs. On average, there are two mechanics per service station. The workshops are open for an average of 12 h per working day. In these service workshops, 220 domestic buses are serviced, including 57 urban buses and 163 suburban and intercity buses. All buses belong to the company that owns the workshops (domestic buses).
For maintenance, servicing, and repairs, an urban bus requires 1350 working hours per year, while a suburban or intercity bus requires 950 working hours. The average number of bus visits per day is 65. The workshops were originally designed to maintain, service, and repair 500 buses, so their current capacity is too large. Currently, these workshops carry out 60,000 working hours for external clients, but this is insufficient. The profit loss for the company if a bus is out of service for one day is approximately 580 EUR.
Maintenance and repairs are currently carried out at 60 service stations distributed across three buildings. The first building has 25 service stations, the second has 14, and the third has 21 service stations. Each service station has its own entrance and exit to the building, allowing buses to enter and leave independently of one another. Between these buildings, there is a large parking area where buses can wait for service (Figure 2).
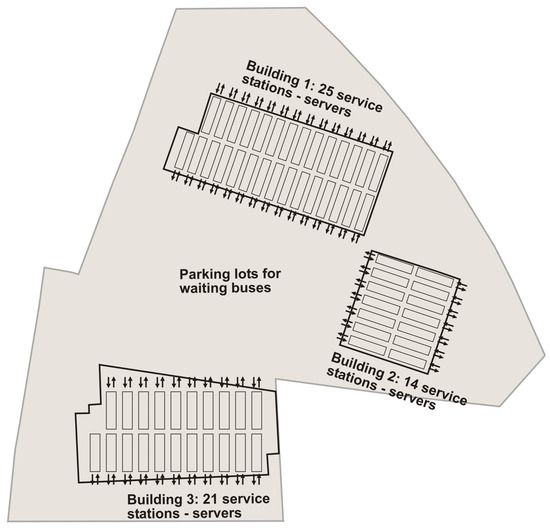
Figure 2.
Layout of maintenance workshops with service stations distributed across three buildings.
Since the company plans to sell Building 3, which contains 21 service stations, it will reduce the number of service stations from 60 to 39.
3.2. Analysis of the Current Situation
From Figure 2, we can see that when buses enter the system and wait in the parking lot, they can choose any of the 60 service stations, as each has its own entrance to the building. Buses can leave the system independently of one another. This ensures the highest efficiency of the maintenance workshops.
In this case, it is a multi-server queuing system, whose model [38] is shown in Figure 3. Buses (users) enter the system at a single point, and this queuing system has one common queue from which all 60 servers (service stations) are fed. Then, buses exit the system through a single exit.
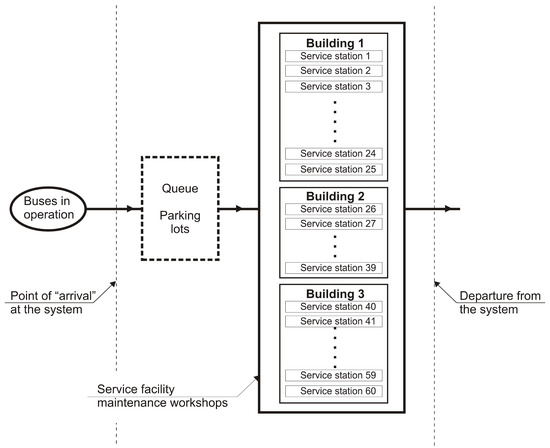
Figure 3.
Model of the 60-server queuing system.
Since we did not obtain data on the exact times when the buses arrived at the service, we used a Poisson distribution to model the bus arrivals in our study.
The current situation will be analyzed using a multi-server queuing system, which has 60 service stations (servers) as shown in Figure 3. Data was obtained from the head of the technical workshops.
- Number of service stations (servers): k = 60
- Number of workers per service station: d = 2
- Number of company buses: m = 220
- Number of city buses: m1 = 57
- Number of suburban or intercity buses: m2 = 163
- Number of working hours required for the maintenance, servicing, and repair of a city bus: hd1 = 1350 h/year
- Number of working hours required for the maintenance, servicing, and repair of a suburban or intercity bus: hd2 = 950 h/year
- Average number of visits for company buses: λd = 65 visits/day
- Workshop working hours: td = 12 h/day
- Number of working hours performed for external clients: hdz = 60,000 h/year
- Number of working days per year: l = 252 days
- Profit loss if a bus is out of service: j = 580 EUR/day
Calculation of input parameters for the multi-server queuing system:
- Average number of working hours per bus:
- Average number of hours a bus spends on maintenance, servicing, and repair in the workshops:
- Number of workshop hours occupied by 220 in-house buses:
- Service time per one bus visit:
- Number of working hours completed in the workshops in one year:
- Arrival rate (for internal and external buses):
- Service rate (service intensity) per service station (server):
The basic parameters (λ, μ, k) were entered into a computer subprogram for calculating a multi-server queuing system, developed in Microsoft Excel.
Results:
- Service factor per service station: ρ = 48.16
- System service factor: ρ* = 0.802
- Average number of buses waiting for service: Q = 0.268
- The average number of buses currently being serviced: S = 48.135
- Average number of buses in the system: T = 48.403
- Average waiting time for service: W* = 2 min, 22 s
- Average time a customer (bus) spends in the system (waiting + service): W = 7 h, 5 min, 48 s
- Utilization of working time:
- If one bus operates on average 16 h a day, the loss of profit for one bus per hour is: 580/16 = 36.25 EUR. Based on this, the loss of profit can be calculated if there are on average S = 48.1353 buses in the service workshops with an average W = 7.058 h.
3.3. Analysis of the Future State with Possible Solutions
The future state refers to the situation when the building with 21 service stations will be sold. In this case, the queueing system will have 60 − 21 = 39 service stations (servers). All other data remains the same as in Section 3.2.
- Arrival rate (for internal and external buses): λ = 81.83 visits/day
- Service rate (service intensity) per service station: μ = 1.7 visits/day
- Number of service stations in the queuing system: k = 39
- Calculation of the system service factor:
Since the system’s service factor ρ* > 1, the accumulation of waiting users for service will increase without limit. This means that the 39 service stations (servers) of the queuing system will not be sufficient for the current load of the service workshop.
For the queuing system to be properly operable and the problem solvable, the service factor of the system must be less than 1 (ρ* < 1). From Equation (29), it is evident that this can be achieved in two ways:
- Increase μ by increasing the number of working hours per day,
- Reduce λ by not accounting for the 60,000 working hours performed for external clients. The workshops will service and repair only domestic buses.
The problem can also be solved by increasing the productivity of the service station (server). This can be performed in two ways:
- Increase the productivity of the worker. This reduces the annual number of standard working hours required for repairs, servicing, and maintenance of the bus (which is not recommended as it may reduce the safety of the completed work),
- Combine individual operations in servicing or repairing buses at each service station. This allows multiple workers to perform different tasks simultaneously at each service station, thereby reducing the time the bus spends in the service workshops.
3.3.1. Increase in the Number of Working Hours per Day
The possibility for the system to be solvable increases with the number of working hours per day. Instead of 12 h, 16 h will be worked (in two shifts).
Data:
k = 39; hdz = 60,000 h/year
d = 2; l = 252 days/year
m = 220; hd = 1053.6 h/year
m1 = 75; h = 525.8 h/year
m2 = 163; h220 = 115,896 h/year
hd1 = 1350 h/year; ta = 7.075 h
hd2 = 950 h/year; hdl = 291,800 h/year
λd = 65 visits/day; td = 16 h/day (The data that has changed:)
- Arrival rate (for internal and external buses): λ = 81.83 visits/day
- Service rate (service intensity) per service station:
- Number of service stations (servers) in the queuing system: k = 39
The basic data (λ, μ, k) has been re-entered into a computer program for calculating a multi-server queuing system created in Microsoft Excel. The tabular calculation display is shown in Table 1.

Table 1.
Output from the computer program (in EXCEL) for calculating the queuing system.
Since the results W and W* are related to the workday, which has 16 working hours, the correct result is as follows:
Utilization of working time:
The loss of profit, if the system contains an average of S = 36.2079 buses and an average of W = 8.47 h (the calculation is performed using Equation (28)), is:
3.3.2. Workshops Serve Only Domestic Buses
In this case, the arrival rate is reduced, and we have λ = λd per day. The 60,000 working hours for external customers (for buses that are not owned by the company) are not taken into account in the calculation.
Using the equations from Section 3.2, the following data is obtained:
k = 39; hdz = 0 h/year
d = 2; l = 252 days/year
m = 220; hd = 1053.6 h/year
m1 = 75; h = 525.8 h/year
m2 = 163; h220 = 115896 h/year
hd1 = 1350 h/year; ta = 7.075 h
hd2 = 950 h/year; hdl = 231,800 h/year
λ = λd = 65 visits/day; td = 12 h/year
μ = 1.7 visits/day
The basic data (λ, μ, k) have been inserted into a computer program for calculating the multi-server queuing system, and the following results were obtained:
Q = 42.9704681
S = 38.2352941
T = 81.2057622
W* = 0.66108412
W = 1.24931942
Since the results W and W* are related to a working day of 12 h, the correct result is as follows:
Utilization of working time:
The loss of profit, if the system contains an average of S = 38.2057 buses and an average W = 14.991 h (calculated using Equation (28)), is as follows:
3.3.3. Increasing the Productivity of the Service Station (Server)
If the number of standard hours required for the repair of a bus hd (number of working hours per year) is reduced, the arrival rate λ also decreases. According to Equation (30), this makes the queuing system stable again (resulting in a finite queue).
The queuing system is analyzed by varying the number of working hours needed for repair, maintenance, and servicing of a single bus per year. This causes a change in the basic input parameters of the queuing system, which are then successively entered into the subprogram for calculating the multi-server queuing system. The equations from Section 3.2 are also used. The results are presented in Table 2 and Table 3.
Table 2.
Results of a multi-server queuing system if the productivity of the workstation is increased- part 1.
Table 3.
Results of a multi-server queuing system if the productivity of the workstation is increased- part 2.
Data:
- Number of service stations (servers): k = 39
- Number of workers per service station: d = 2
- Number of company buses: m = 220
- Number of city buses: m1 = 57
- Number of suburban or intercity buses: m2 = 163
- Workshop working hours: td = 12 h/day
- Number of working hours performed for external clients: hdz = 60,000 h/year
- Number of working days per year: l = 252 days
- Profit loss if a bus is out of service: j = 580 EUR/day
In the case where the work in the maintenance workshops is reorganized in such a way that individual maintenance operations are combined at a single service station and three workers (previously two) work simultaneously at that station, the productivity of the service station increases by Cp = 50%. As seen in Table 2, in this case, a single visit of a bus to the maintenance workshop is reduced to ta = 4.7 h, and the waiting time for service is reduced to W* = 0.5831. Consequently, the loss of profit due to bus downtime in the maintenance workshops is only EUR 7680.
The diagram in Figure 4 shows how the duration of a single bus visit and the total time a bus spends in the system change depending on the average number of working hours per year per bus. The data is taken from Table 2 and Table 3.
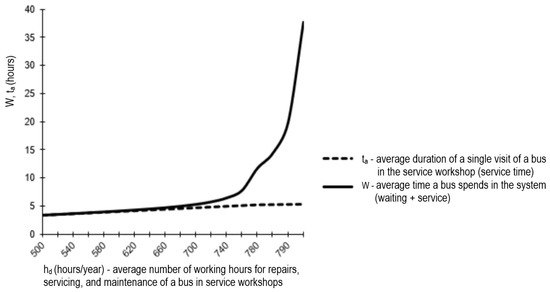
Figure 4.
Dependence of the duration of a bus visit and the bus’s stay in the system on the normative repair hours for one bus.
If the average number of working hours for repairs, servicing, and maintenance of a bus in service workshops (hd) is reduced from 790 to 620 h per year, the duration of a single bus visit ta linearly decreases from 5.3 to 4.03 h. Consequently, the total time a bus spends in the service workshops W decreases from 19.8 to 4.1 h. However, this reduction is no longer linear. In this case, ta is reduced by 24%, while W is reduced by as much as 79%. As a result, the cost due to the bus being out of service is also reduced by 79%, amounting to only EUR 5239.49 (Table 2 and Table 3).
4. Discussion
The optimization of operations in the analyzed service workshops of a bus company is justified in terms of reducing production space (service workshops), as this increases the efficiency of space utilization with the same volume of work. If the company decides to eliminate 21 of the existing 60 service stations, the current system would no longer be able to maintain the same number of buses as before. Therefore, three potential solutions were proposed to enable the company to continue maintaining its fleet using the remaining 39 service stations.
The first solution, which involves increasing the daily working time from 12 to 16 h, would result in an average of 36.2 buses being present in the system for 8.47 h. This would lead to approximately EUR 11,117 in lost profit due to buses being out of operation (unable to transport passengers during this time). The average waiting time for service would be 1 h and 23 min.
The second solution keeps the working day at 12 h, as before, but limits service exclusively to the company’s own fleet (internal buses), discontinuing services for external clients and forfeiting the corresponding revenue. In this case, about 38 buses would be in the system for an average of 14.9 h, resulting in EUR 20,760 in losses due to idle buses. This outcome is less favorable, as the average waiting time for service increases to 7.56 h.
The third solution involves increasing the productivity of each service station by 50%. Instead of two workers per station, an additional worker is assigned so that three workers operate simultaneously. Tasks at the service station are reorganized by merging individual service operations. As a result, the total time a bus spends in the system is reduced to 4.7 h, and losses amount to only EUR 7680, as only 32.4 buses are on average unavailable for passenger transport during servicing. The average waiting time for service in this case is just 0.89 h.
The optimal solution is the third one, as it does not reduce the volume of work but significantly lowers production costs. Additionally, the losses due to buses being out of service are the smallest, and most importantly, the waiting time for service is drastically reduced.
Based on the analysis of the three proposed solutions for organizing work in the service workshops, the following additional conclusions can be made:
- A high utilization of working hours does not necessarily lead to the best solution, as high utilization also increases waiting times for service (see Table 2 and Table 3). From this perspective, the first solution (increasing the number of working hours per day) is better than the second (servicing only internal buses).
- The second solution, in which the company forfeits 60,000 working hours per year due to workshop downsizing (cost reduction), is not optimal. Why should workshops not also serve external clients if there is demand?
- If the value of the system service factor ρ* is close to 1, even a small reduction in service time (ta) significantly reduces the waiting time for a bus to receive service. Therefore, it is more reasonable to optimize the service station workflow.
- In the case of merging service operations at individual service stations, the throughput of the queuing system increases, and as a result, profit losses due to buses being out of service decrease.
Author Contributions
Conceptualization, S.T. and D.S.; methodology, S.T.; software, S.T.; validation, S.T. and D.S.; formal analysis, S.T.; investigation, S.T. and D.S.; resources, S.T.; data curation, S.T.; writing—original draft preparation, S.T.; writing—review and editing, S.T. and D.S.; visualization, S.T.; supervision, S.T. and D.S.; project administration, D.S.; funding acquisition, S.T. and D.S. All authors have read and agreed to the published version of the manuscript.
Funding
This research received no external funding.
Data Availability Statement
The original contributions presented in the study are included in the article; further inquiries can be directed to the corresponding author.
Conflicts of Interest
The authors declare no conflicts of interest.
References
- Savsar, J. Modeling and simulation of maintenance operations at Kuwait public transport company. Kuwait J. Sci. 2013, 40, 115–129. [Google Scholar]
- Hangani, A.; Shafahi, Y. Bus maintenance systems and maintenance scheduling: Model formulations and solutions. Transp. Res. Part A Policy Pract. 2002, 36, 453–482. [Google Scholar] [CrossRef]
- Maze, T.H.; Cook, A.R. Theory and Practice of Transit Bus Maintenance Performance Measurement. Transp. Res. Rec. 1987, 1140, 18–29. [Google Scholar]
- Landowski, B. Method of modelling operation and maintenance processes in public transport systems using a certain class of stochastic processes. MATEC Web Conf. 2021, 332, 01005. [Google Scholar] [CrossRef]
- Xu, J.; Qiao, Q.; Wu, R.; Zhou, Z. Advanced maintenance cycle optimization of urban rail transit vehicles. Adv. Mech. Eng. 2019, 11, 1687814019827113. [Google Scholar] [CrossRef]
- Buyukkaramikli, N.; Ooijen, H.; Bertrand, J. Integrating inventory control and capacity management at a maintenance service provider. Ann. Oper. Res. 2015, 231, 185–206. [Google Scholar] [CrossRef]
- Han, Q.T.; Cao, W.J.; Zhang, Y. Research on Maintenance Resources Distribution Based on Queuing Theory. Appl. Mech. Mater. 2012, 239–240, 1428–1431. [Google Scholar] [CrossRef]
- Bebic, D.; Stazic, L.; Komar, I. Ships Shore Service Optimization Using the Queueing Theory. Int. J. Simul. Model. 2019, 18, 596–607. [Google Scholar] [CrossRef]
- Antoniol, G.; Cimitile, A.; Di Lucca, G.A.; Di Penta, M. Assessing staffing needs for a software maintenance project through queuing simulation. IEEE Trans. Softw. Eng. 2004, 30, 43–58. [Google Scholar] [CrossRef]
- Son, J. Developing a model for estimating delays at two-lane highway work zones. KSCE J. Civ. Eng. 1999, 3, 81–88. [Google Scholar] [CrossRef]
- Cassidy, M.J.; Haan, L.D. Proposed Model for Predicting Motorist Delays at Two-Lane Highway Work Zones. J. Transp. Eng. 1993, 119, 27–42. [Google Scholar] [CrossRef]
- Sihotang, E.; Sugito; Mustafid; Ispriyanti, D.; Prahutama, A.; Rachman, A. Analysis of queue and performance of automatic toll booths with a normal distribution (case study: Automatic booths toll gate muktiharjo). J. Phys. Conf. Ser. 2020, 1524, 012093. [Google Scholar] [CrossRef]
- Petrović, A.; Nikolić, M.; Bugarić, U.; Delibašić, B.; Lio, P. Controlling highway toll stations using deep learning, queuing theory, and differential evolution. Eng. Appl. Artif. Intell. 2023, 119, 105683. [Google Scholar] [CrossRef]
- Zahedieh, F.; Lee, C. Impacts of a Toll Information Sign and Toll Lane Configuration on Queue Length and Collision Risk at a Toll Plaza with a High Percentage of Heavy Vehicles. Vehicles 2024, 6, 1249–1267. [Google Scholar] [CrossRef]
- Wang, T.; Huang, L.; Tian, J.; Zhang, J.; Yuan, Z.; Zheng, J. Bus dwell time estimation and overtaking maneuvers analysis: A stochastic process approach. Transp. Res. Part E Logist. Transp. Rev. 2024, 186, 103577. [Google Scholar] [CrossRef]
- Yongzheng, K.; Aixin, C.; Zhen, Z. Optimization Research of Bus Stops that Are Based on Berths. In Proceedings of the 2015 International Conference on Electrical and Information Technologies for Rail Transportation; Lecture Notes in Electrical Engineering; Springer: Berlin/Heidelberg, Germany, 2016; Volume 378. [Google Scholar] [CrossRef]
- Wang, C.; Chen, W.; Xu, Y.; Ye, Z. Modeling Bus Capacity for Bus Stops Using Queuing Theory and Diffusion Approximation. Transp. Res. Rec. J. Transp. Res. Board 2021, 1524, 012093. [Google Scholar] [CrossRef]
- Sun, F.; Sun, L.; Sun, S.; Wang, D. Study on the Calculation Models of Bus Delay at Bays Using Queueing Theory and Markov Chain. Comput. Intell. Neurosci. 2015, 2015, 750304. [Google Scholar] [CrossRef]
- Liu, Z.; Ma, X.; Zhou, S.; Liu, X. Optimizing shared charging services at sustainable bus charging hubs: A queue theory integration approach. Renew. Energy 2024, 237, 121860. [Google Scholar] [CrossRef]
- Chen, W.; Qui, K.; Zhang, S.; Zhou, J.; Zhang, W. Queuing theory guided performance evaluation and energy optimization for a reconfigurable high speed device interconnected bus. Sustain. Comput. Inform. Syst. 2019, 22, 179–190. [Google Scholar] [CrossRef]
- Meng, F.; Pei, W.; Zhang, Q.; Zhang, Y.; Ma, B.; Li, L. Research on the capacity of charging stations based on queuing theory and energy storage scheduling optimization sharing strategy. J. Energy Storage 2024, 96, 112673. [Google Scholar] [CrossRef]
- Najafi, A.; Gao, K.; Parishwad, O.; Tsaousoglou, G.; Jin, S.; Yi, W. Integrated optimization of charging infrastructure, electric bus scheduling and energy systems. Transp. Res. Part D Transp. Environ. 2025, 141, 104664. [Google Scholar] [CrossRef]
- Pourvaziri, H.; Sarhadi, H.; Azad, N.; Afshari, H.; Taghavi, M. Planning of electric vehicle charging stations: An integrated deep learning and queueing theory approach. Transp. Res. Part E Logist. Transp. Rev. 2024, 186, 103568. [Google Scholar] [CrossRef]
- Wu, H.; Calderon, A.D. A Study on the Construction of Charging Stations on Freeways Using a Road Section Power Consumption Model. In Proceedings of the 8th International Conference on Green Energy and Applications (ICGEA), Singapore, 14–16 March 2024; pp. 72–79. [Google Scholar] [CrossRef]
- Kumar, N.; Kumar, T.; Nema, S.; Thakur, T. A comprehensive planning framework for electric vehicles fast charging station assisted by solar and battery based on Queueing theory and non-dominated sorting genetic algorithm-II in a co-ordinated transportation and power network. J. Energy Storage 2022, 49, 104180. [Google Scholar] [CrossRef]
- Saldarini, A.; Miraftabzadeh, S.M.; Brenna, M.; Longo, M. Strategic Approach for Electric Vehicle Charging Infrastructure for Efficient Mobility along Highways: A Real Case Study in Spain. Vehicles 2023, 5, 761–779. [Google Scholar] [CrossRef]
- Varshney, S.; Panda, K.P.; Gupta, G.; Shah, M.; Srinivas, B.A.; Bajaj, M.; Blazek, V.; Prokop, L. Stochastic modeling of electric vehicle infrastructure using queueing-theoretical approach. Results Eng. 2025, 25, 104149. [Google Scholar] [CrossRef]
- Sun, L.; Song, R. Improving Efficiency in Congested Traffic Networks: Pareto-Improving Reservations through Agent-Based Timetabling. Sustainability 2022, 14, 2211. [Google Scholar] [CrossRef]
- Wang, X.; Wu, X.; Liu, J. Optimization Models of Actuated Control Considering Vehicle Queuing for Sustainable Operation. Sustainability 2022, 14, 8998. [Google Scholar] [CrossRef]
- Wang, W.; Ji, Y.; Zhao, Z.; Yin, H. Simulation Optimization of Station-Level Control of Large-Scale Passenger Flow Based on Queueing Network and Surrogate Model. Sustainability 2024, 16, 7502. [Google Scholar] [CrossRef]
- Jia, W.; Huang, Y.; Zhao, Q.; Qi, Y. Modeling taxi drivers’ decisions at airport based on queueing theory. Res. Transp. Econ. 2022, 92, 101093. [Google Scholar] [CrossRef]
- Yang, M. Security Check Model Based on Queuing Theory. In Proceedings of the 7th International Conference on Education, Management, Information and Computer Science (ICEMC 2017), Shenyang, China, 16–18 June 2017. [Google Scholar] [CrossRef][Green Version]
- Wen, S.W.; Tang, T.Q.; Zhang, J.; Qin, M.X.; Huang, H.J. Information-based taxi-passenger matching management in transportation hubs: A double-ended queuing perspective. Transp. Res. Part E Logist. Transp. Rev. 2025, 197, 104096. [Google Scholar] [CrossRef]
- Król, A.; Król, M. A Stochastic Simulation Model for the Optimization of the Taxi Management System. Sustainability 2019, 11, 3838. [Google Scholar] [CrossRef]
- Flesser, M.; Shalaby, A.; Friedrich, B. Integration of urban aerial cable cars into public transit: Operational capacity limits due to passenger queuing at stations. J. Public Transp. 2024, 26, 100094. [Google Scholar] [CrossRef]
- Drent, M.; Arts, J. Expediting in Two-Echelon Spare Parts Inventory Systems. Manuf. Serv. Oper. Manag. 2020, 23, 6. [Google Scholar] [CrossRef]
- Ademujimi, T.; Prabhu, V. Model-Driven Bayesian Network Learning for Factory-Level Fault Diagnostics and Resilience. Sustainability 2024, 16, 513. [Google Scholar] [CrossRef]
- Larson, R.C.; Odoni, A.R. Urban Operations Research. Prentice-Hall, New York 1981, Massachusetts Institute of Technology. Available online: https://web.mit.edu/urban_or_book/www/book/ (accessed on 11 April 2025).
- Benjamin, J.R.; Cornell, C.A. Probability, Statistics and Decision for Civil Engineers; McGraw-Hill, Cop.: New York, NY, USA, 1970. [Google Scholar]
- Bronson, R. Schaum’s Outline of Theory and Problems of Operations Research; McGraw-Hill, Cop.: New York, NY, USA, 1982. [Google Scholar]
- Pauše, Ž. Vjerojatnost (Informacija, Stohastični Procesi); Školska Knjiga: Zagreb, Croatia, 1985. [Google Scholar]
- Petrić, J.; Šarenac, L.; Kojić, Z. Operaciona Istraživanja II (Zbirka Rešenih Zadataka); Naučna Knjiga: Beograd, Serbia, 1984. [Google Scholar]


Disclaimer/Publisher’s Note: The statements, opinions and data contained in all publications are solely those of the individual author(s) and contributor(s) and not of MDPI and/or the editor(s). MDPI and/or the editor(s) disclaim responsibility for any injury to people or property resulting from any ideas, methods, instructions or products referred to in the content. |
© 2025 by the authors. Licensee MDPI, Basel, Switzerland. This article is an open access article distributed under the terms and conditions of the Creative Commons Attribution (CC BY) license (https://creativecommons.org/licenses/by/4.0/).