Abstract
This study developed and validated an integrated theoretical framework combining the Theory of Planned Behavior (TPB) and the Technology Acceptance Model (TAM) to investigate how driving assistance technologies (DATs) influence risky driving behaviors among young urban Chinese drivers. Based on this framework, we proposed and tested several hypotheses regarding the effects of psychological and technological factors on risky driving intentions and behaviors. A survey was conducted with 495 young drivers in Shaoguan, Guangdong Province, examining psychological factors, technology acceptance, and their influence on risky driving behaviors. Structural equation modeling revealed that the integrated TPB-TAM explained 58.3% of the variance in behavioral intentions and 42.6% of the variance in actual risky driving behaviors, significantly outperforming single-theory models. Attitudes toward risky driving (β = 0.287) emerged as the strongest TPB predictor of behavioral intentions, while perceived usefulness (β = −0.172) and perceived ease of use (β = −0.113) of driving assistance technologies negatively influenced risky driving intentions. Multi-group analysis identified significant gender and driving experience differences. Logistic regression analyses demonstrated that model constructs significantly predicted actual traffic violations and accidents. These findings provide theoretical insights into risky driving determinants and practical guidance for developing targeted interventions and effective traffic safety policies for young drivers in urban China.
1. Introduction
As urbanization accelerates globally, traffic safety has become a focal point of concern. This is particularly true in China, where increasing traffic density in urban areas poses significant challenges to road safety [1]. With the increasing number of motor vehicles in China, there are concerns about traffic safety, particularly regarding young drivers [2]. Young drivers, especially those in urban settings, are often considered a high-risk group due to their lack of experience or propensity for risky behaviors [3]. This results in young drivers being more likely to engage in unsafe behaviors, often resulting in serious injury and death. In China, male drivers under 30 years old are the groups with a high incidence of fatigue driving accidents [4]. As technology advances, driving assistance systems (DASs) have been developed to improve driving safety. Researchers suggest that to maximize the benefits of DASs, it is important to focus on the unique needs of specific driver groups, such as younger drivers [5]. Tailoring DASs to meet these needs could help reduce traffic-related fatalities more effectively. Understanding the driving behaviors of this demographic is crucial for developing effective traffic safety policies and interventions.
Although previous studies have explored risky driving behaviors among young drivers, the mechanisms of how DATs and psychological factors jointly influence risky driving behaviors in the rapidly developing urban environment of China remain unclear. In particular, how urban young drivers perceive and accept these technologies, and how this acceptance affects their risky driving behaviors, has not been systematically studied [6].
Current research predominantly employs technological methods, such as on-board sensors and advanced monitoring systems, to identify patterns of risky driving behaviors [7]. Techniques like machine learning and deep learning are instrumental in analyzing behavioral data to predict dangerous driving tendencies [8]. However, the reliance on simulation studies and the potential discrepancies introduced by sensor limitations suggests a gap in capturing the real-world complexities of driver behavior [9]. These studies provide valuable insights but often overlook the nuanced interplay of psychological factors that influence driving behaviors.
Moreover, psychological factors play a crucial role in influencing driving behaviors, yet they are often underexplored. Some researchers have also discussed the psychological influences of dangerous driving behavior, such as analyzing dangerous driving behavior through TPB [10,11]. The model assumes that intentions are derived from three aspects: attitudes toward behavior, subjective norms, and perceived behavioral control, intentions will eventually influence behavior [12]. The TPB model is the most common approach used in transportation studies to review the intention of choosing the mode of travel [13]. While these models offer valuable insights into behavioral intentions, their integration has rarely been applied to understand the driving behaviors of young urban drivers in China comprehensively.
Nevertheless, TPB still has limitations in the adoption of new technologies [14]. With the rapid development of DATs such as automatic emergency braking systems and lane keeping assist systems, as well as primary and secondary safety systems, studying young drivers’ acceptance of these new technologies has become key to understanding and predicting their risky driving behaviors [15,16]. Past research on risky driving behavior often relies on single theoretical models, such as the TPB or the Health Belief Model (HBM). While these models provide a framework for understanding driving behaviors to some extent, their explanatory power is limited and may not fully cover the complexity of driving behaviors [17]. Therefore, recent scholars claim that adding the TAM on the basis of the TPB can better explain people’s behavioral intentions when using new technologies [1]. TAM suggests that an individual’s intention to use technology is primarily determined by two specific beliefs: perceived ease of use and perceived usefulness. These beliefs not only influence behavioral intentions but are also closely related to subsequent actual usage behaviors [18].
Both the TPB and the TAM are derived from the Theory Of Reasoned Action, but they focus on slightly different aspects. This distinction allows the two models to be theoretically compatible and complementary. However, some scholars have pointed out that although hybrid models provide a more comprehensive description of potential users’ behavioral intentions toward technology, they may not significantly enhance explanatory power [19]. There are few studies that systematically investigate the impact of young drivers on risky driving behaviors using an integrated model combining TPB and TAM. Therefore, this study aims to bridge this gap by employing a combined TPB and TAM framework to investigate the risky driving behaviors of young drivers in urban China more holistically and further investigate whether this integrated model can improve the explanatory power for risky driving behaviors.
Additionally, existing research has primarily concentrated on the behavioral patterns of young drivers in Western countries, with comparatively less emphasis placed on developing nations such as China. Especially in urban settings, diverse socio-cultural backgrounds and traffic conditions can result in different expressions of risky behaviors [20]. This study endeavors to bridge this gap by utilizing quantitative analytical methods to systematically evaluate the risky driving behaviors of young drivers in urban China. It aims not only to characterize the patterns of such behaviors but also to delve into the underlying psychological mechanisms. By integrating the TPB model with TAM, this research seeks to provide a thorough understanding that could facilitate the development of targeted interventions. The research findings can be utilized by relevant authorities to formulate effective interventions aimed at reducing risky driving behaviors among young drivers, thereby decreasing the number of traffic accidents involving young drivers.
The structure of this study is organized as follows: Section 2 provides a review of the relevant literature on risky driving behaviors and the theories of TPB and TAM. Section 3 outlines the theoretical framework and research hypotheses. Section 4 details our questionnaire design and data collection methods. Section 5 presents the data analysis and results. Finally, Section 6 offers a comprehensive discussion, explicates the findings, and summarizes the research.
2. Literature Review
2.1. Risky Driving Behavior
Risky driving behaviors constitute a major social problem. In fatal accident statistics, drivers aged 16 to 25 have consistently accounted for a high proportion, and compared to older drivers, they are more likely to engage in a range of intentional risky driving behaviors [21]. Intervention measures targeting this age group show great potential for improving traffic safety. Research indicates that the maturation process of executive functions from adolescence to early adulthood significantly affects the decision-making processes of young drivers, potentially leading to risky driving behaviors and increased collision risk [22]. A study using driving simulators explored the relationships between mental workload, age, and risky driving behaviors, revealing that moderate scenario complexity best highlights differences in driving ability [23]. These findings suggest that the cognitive development and decision-making abilities of young drivers are closely related to their risky driving behaviors.
Multiple studies have found that personality traits such as impulsivity, sensation seeking, and sensitivity to rewards significantly influence risky and aggressive driving behaviors among young drivers, highlighting the importance of designing tailored intervention measures based on individual personality differences [24,25] found a negative correlation between emotional competence and attitudes toward risky driving, emphasizing the importance of emotional competence in prevention programs, especially in improving driving safety, and suggesting that emotional competence training should be part of driving education.
For young people, driving serves various socio-psychological functions, such as gaining independence, feeling free, and satisfying the need to socialize with friends [26]. This study points out that young drivers who drive for socio-psychological reasons report more risky behaviors, including speeding and following the vehicle ahead. A survey of 680 young drivers in Central Florida identified attitudes toward speeding, distraction, and demographic characteristics as important factors affecting their involvement in negligent collisions or traffic violations, with “rushing for time” and “racing with other vehicles” listed as the main reasons for risky driving behaviors [27]. Other scholars have also found that a large number of young drivers drive under the influence of alcohol and have intentions to evade police, speed, and engage in other risky driving behaviors [28].
Some researchers have found that emotions and risk perception are independent predictors of risky driving behaviors, with positive emotions and perceived risk being stronger predictors of risky driving behaviors among young drivers [29]. However, the universality of factors commonly assumed to influence risky driving behaviors has not been adequately tested. Psychological factors are also one of the important factors in measuring risky driving behaviors [30]. While emotions and risk perception may play a role in shaping risky driving, the present study focuses specifically on the interplay between psychological determinants (as captured by TPB) and technology acceptance (as modeled by TAM). Future research may further explore how these affective and perceptual factors interact with technology-related attitudes in influencing risky driving.
Although these studies provide important insights, they primarily rely on simulated or self-reported data in Western contexts, which may differ from actual driving behaviors in the urban environment of China. Moreover, these studies often examine various factors in isolation, failing to integrate multiple influencing factors to comprehensively understand risky driving behaviors. As suggested by Fernandes et al. [31], future research and practice should focus on multi-factor frameworks of risky driving behaviors.
2.2. The Theory of Planned Behavior
The TPB, developed by Ajzen, has been widely employed in transportation research to understand and predict driver behavior. As briefly mentioned in the introduction, TPB posits that behavioral intentions are determined by three key factors: attitudes toward the behavior, subjective norms, and perceived behavioral control [12]. These behavioral intentions subsequently influence actual behavior. In the context of driving, attitudes reflect individuals’ positive or negative evaluations of risky driving behaviors, subjective norms represent perceived social pressure to engage in or abstain from such behaviors, and perceived behavioral control indicates individuals’ perceptions of their ability to execute specific driving behaviors [32].
Numerous studies have applied TPB to investigate risky driving behaviors across various contexts. For instance, researchers have used TPB to examine speeding behaviors, finding that attitudes, subjective norms, and perceived behavioral control significantly predict intentions to speed [33]. Similarly, TPB has been utilized to understand other risky driving behaviors such as drunk driving, mobile phone use while driving, and aggressive driving [34]. In the Chinese context, several studies have employed TPB to investigate driving behaviors. For example, Li et al. [35] found that TPB components significantly predicted Chinese drivers’ intentions to engage in aggressive driving behaviors. However, these studies have primarily focused on the general driving population rather than young urban drivers specifically.
While TPB provides a robust framework for understanding behavioral intentions, it has certain limitations. Critics argue that TPB may not fully capture the emotional and habitual aspects of behavior [36]. Additionally, in the context of increasingly technologically equipped vehicles, TPB alone may not sufficiently explain young drivers’ interactions with driving assistance systems that potentially influence risky driving behaviors. This limitation necessitates the integration of additional theoretical frameworks, such as the Technology Acceptance Model, to comprehensively understand young drivers’ behaviors in modern driving environments.
2.3. Technology Acceptance Model
The TAM, introduced by Davis [37], has emerged as one of the most influential models for explaining user acceptance and usage of technology. As briefly mentioned in the introduction, TAM posits that technology adoption is primarily determined by two key factors: perceived usefulness and perceived ease of use [38]. Perceived usefulness refers to the degree to which a person believes that using a particular technology would enhance their performance, while perceived ease of use refers to the degree to which a person believes that using a particular technology would be free from effort. In the context of driving, TAM has been applied to understand drivers’ acceptance and usage of various driving technologies, such as ADASs, autonomous vehicles, and in-vehicle information systems. Recent studies have started to explore the application of TAM in understanding young drivers’ technology acceptance behaviors. For example, Buckley et al. [39] investigated young drivers’ acceptance of in-vehicle monitoring technologies, finding that perceived usefulness significantly predicted acceptance. However, they also noted that privacy concerns were a significant barrier to acceptance among young drivers, suggesting the need to consider additional factors beyond the core TAM constructs.
Despite its widespread application, TAM has several limitations. Critics argue that it may oversimplify the technology adoption process by focusing primarily on utilitarian aspects while neglecting social and emotional factors [40]. Additionally, TAM was originally developed in organizational contexts and may require adaptation for consumer technologies, particularly in transportation settings [41]. These limitations highlight the potential benefits of integrating TAM with other theoretical frameworks, such as TPB, to provide a more comprehensive understanding of young drivers’ behaviors in relation to driving technologies. Recent work by Rahman et al. [42,43] systematically compared TPB, TAM, and the Unified Theory of Acceptance and Use of Technology (UTAUT) in the context of drivers’ acceptance of ADASs. Their studies demonstrated that TAM and UTAUT can improve explanatory power for technology adoption compared to TPB alone, and they summarized relevant empirical studies in this domain. However, most existing research focuses on drivers’ intention to adopt technology, rather than how technology acceptance may interact with risky driving intentions or actual risky driving behavior, especially among young drivers in rapidly developing countries. The current study therefore extends this line of inquiry by examining whether and how positive perceptions of DATs indirectly reduce risky driving intentions and behaviors in an urban Chinese context.
The integration of TPB and TAM offers a promising approach to understanding young drivers’ risky behaviors in urban China, where rapid technological advancement and urbanization are simultaneously influencing driving environments. By combining these complementary frameworks, this study aims to capture both the psychological determinants of behavioral intentions and the technological factors affecting young drivers’ interactions with modern vehicles and driving assistance systems. To address these gaps, the next chapter proposes an integrated theoretical framework, combining the core constructs of TPB and TAM, and develops specific research hypotheses based on this integrated framework to systematically examine the risky driving behaviors of young urban drivers in China and their influencing mechanisms.
3. Theoretical Framework and Research Hypotheses
Based on the literature review of risky driving behaviors, TPB, and TAM, this section presents the integrated theoretical framework and develops research hypotheses aimed at investigating risky driving behaviors among young urban drivers in China.
3.1. Integrated Theoretical Framework
The present study proposes an integrated framework that combines the TPB and the TAM to provide a comprehensive understanding of young drivers’ risky driving behaviors in urban China. Figure 1 illustrates the proposed integrated framework. Notably, the integrated framework does not assume that technology acceptance directly predicts risky behaviors; rather, it posits that favorable perceptions of DATs can reshape drivers’ general attitudes toward risk, which in turn influence intentions and behaviors. This is in line with recent findings in the behavioral adaptation and automation literature, which highlight indirect pathways from technology attitudes to real-world risk behavior.
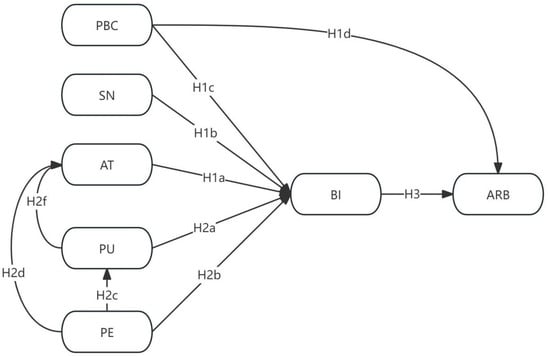
Figure 1.
Integrated Theoretical Framework.
The integration of TPB and TAM is theoretically justified on several grounds. First, both theories share common conceptual roots in the Theory of Reasoned Action (TRA), which posits that behavior is primarily determined by behavioral intentions [44]. This shared theoretical foundation facilitates the conceptual integration of the two frameworks. As noted by Chau and Hu [19], TPB and TAM are theoretically compatible despite their focus on different aspects of behavioral intention. Second, the complementary nature of these theories addresses the multi-faceted nature of risky driving behaviors. TPB addresses the psychological determinants of behavioral intentions through attitudes, subjective norms, and perceived behavioral control, while TAM captures the technological aspects through perceived usefulness and perceived ease of use. In the context of increasingly technology-equipped vehicles, neither theory alone is sufficient to capture the full complexity of factors influencing young drivers’ behaviors. Third, the integration is particularly relevant for young Chinese drivers, who exist at the intersection of rapid technological adoption and evolving social norms regarding driving. Young drivers in urban China represent a unique demographic that has grown up during China’s technological boom and is typically early adopters of new technologies [45]. At the same time, they are navigating the social pressures and status associations of car ownership in Chinese society, which has historically differed from Western contexts [46]. The integrated framework allows for examination of how these technological and social factors interact to influence risky driving behaviors.
This integrated framework retains the core constructs of TPB—attitudes toward risky driving behaviors (AT), subjective norms (SN), and perceived behavioral control (PBC)—while incorporating the key elements of TAM—perceived usefulness (PU) and perceived ease of use (PE) of DAT. By combining these two well-established theories, we aim to capture both the psychological determinants of behavioral intentions (BI) and the technological factors affecting young drivers’ interactions with modern vehicles and driving assistance systems that may influence actual risky driving behaviors (ABR). The integration of the TPB and the TAM in this study is grounded in both theoretical compatibility and the context-specific demands of modern driving environments. While TPB is widely utilized to explain health-related and risk behaviors, its focus is primarily on psychological determinants of intention and behavior. TAM, in contrast, was developed to explain technology adoption, but shares structural roots with TPB through the Theory of Reasoned Action (TRA).
Importantly, in the present study, TAM constructs (perceived usefulness and perceived ease of use) are not assumed to directly predict risky driving behaviors. Rather, the model posits that attitudes toward and perceptions of driving assistance technologies can indirectly reduce risky driving intentions by reshaping drivers’ general attitudes toward risk-taking behind the wheel. This logic is supported by contemporary research in traffic psychology and human factors, where technology adoption is shown to influence drivers’ risk perception, behavioral adaptation, and even risk compensation [42,43].
Moreover, Ajzen [47] emphasized that any TPB extension must be behavior-specific and justified by empirical and contextual evidence. Accordingly, our operationalization of technology acceptance is tailored to the risk context and the rapid diffusion of driving assistance technologies among young Chinese urban drivers. This design enables us to explore novel indirect pathways between technology acceptance and risky driving, which have received limited attention in prior research. By modeling these indirect and cross-theory relationships, our integrated framework provides a more comprehensive and contextually relevant explanation of risky driving behaviors among young drivers in China, extending current understanding of how technological and psychosocial determinants jointly shape driving risk.
3.2. Research Hypotheses
The TPB provides a robust framework for understanding the psychological determinants of risky driving behaviors. According to TPB, behavioral intentions—the most proximal predictor of actual behavior—are influenced by three key factors: attitudes toward the behavior, subjective norms, and perceived behavioral control [12]. In the context of risky driving, these components capture the cognitive, social, and control-related dimensions that shape young drivers’ decisions.
The attitudinal component represents individuals’ overall evaluation of risky driving behaviors as positive or negative. These evaluations are formed through a complex interplay of past experiences, anticipated outcomes, and value judgments. For young drivers in urban China, attitudes toward risky driving may be particularly influential due to the symbolic meaning of driving as a representation of freedom, status, and identity [17]. Previous research by Elliott et al. [32] in the UK and Forward [33] in Sweden has consistently demonstrated strong relationships between positive attitudes toward risky driving behaviors and intentions to engage in these behaviors. In the Chinese context, Cong et al. [48] found that attitudes were significant predictors of aggressive driving intentions among general drivers.
Subjective norms reflect the perceived social pressure to perform or avoid risky driving behaviors. This component acknowledges the powerful influence of social reference groups on individual decision-making. In China, where social relationships (guanxi) and face (mianzi) are particularly important cultural values, the influence of subjective norms may be even stronger than in Western contexts [49]. Research by Scott-Parker et al. [26] identified peer influence as a significant predictor of risky driving intentions among young drivers. For young Chinese drivers, subjective norms may operate through multiple reference groups, including peers, family members, and even media figures who model driving behaviors. Additionally, social media platforms popular among Chinese youth may create digital social environments where risky driving behaviors are sometimes glorified or normalized [50].
Perceived behavioral control refers to individuals’ perceptions of their ability to perform or avoid risky driving behaviors. This component captures both confidence in driving skills and perceptions of environmental constraints or enablers. Previous studies have established the relationship between perceived behavioral control and behavioral intentions in various driving contexts. Walshe et al. [22] found that young drivers with higher perceived control were more likely to form intentions to engage in risky driving. Perceived behavioral control may be particularly influential due to several factors, including still-developing executive functions, the rapidly changing urban driving environment, and the prevalence of technology in vehicles that may create an illusion of enhanced control [51].
A unique aspect of TPB is that perceived behavioral control can also directly influence behavior, independent of intentions. This direct pathway is especially relevant in dynamic driving environments, where decisions must be made rapidly in response to changing conditions. Elliott et al. [32] found that perceived behavioral control directly influenced speeding behavior among UK drivers, beyond its indirect effect through intentions. The direct influence of perceived behavioral control may be amplified by the high-density urban environment and the relative inexperience of young drivers that may create discrepancies between perceived and actual control [52].
Based on the TPB framework and its application to risky driving behaviors, the following hypotheses are proposed:
H1a :
Attitudes toward risky driving behaviors are positively associated with intentions to engage in risky driving behaviors among young drivers in urban China.
H1b :
Subjective norms regarding risky driving behaviors are positively associated with intentions to engage in risky driving behaviors among young drivers in urban China.
H1c :
Perceived behavioral control over risky driving behaviors is positively associated with intentions to engage in risky driving behaviors among young drivers in urban China.
H1d :
Perceived behavioral control over risky driving behaviors is directly associated with actual risky driving behaviors among young drivers in urban China.
The TAM provides a framework for understanding how perceptions of technology influence user behavior. In the context of driving, TAM offers valuable insights into how young drivers interact with increasingly sophisticated vehicle technologies, particularly driving assistance systems designed to enhance safety. According to TAM, two key factors influence technology adoption and usage: perceived usefulness and perceived ease of use [38].
Perceived usefulness refers to the degree to which a person believes that using a particular technology would enhance their performance. In the driving context, this reflects young drivers’ beliefs about whether DATs improve safety, reduce collision risk, or otherwise enhance the driving experience. Research in technology adoption contexts has established that perceived usefulness influences behavioral intentions toward technology use [41]. In the driving context, Park and Kim [53] found that perceptions of ADAS usefulness influenced drivers’ intentions to rely on these systems. For young drivers in urban China, this factor may be particularly relevant due to China’s rapid adoption of advanced automotive technologies, the high-density urban environment that highlights safety challenges, and the technological fluency of young Chinese drivers who may be more attuned to the capabilities and limitations of these systems.
Perceived ease of use refers to the degree to which a person believes that using a particular technology would be free from effort. For DAT, this captures how intuitive, straightforward, and manageable these systems appear to young drivers. Venkatesh and Davis [41] established that perceived ease of use influences behavioral intentions in technology adoption contexts. Ease of use perceptions may influenced intentions to use in-vehicle information systems. For young drivers in urban China, who have grown up during China’s technological boom and typically demonstrate high technological literacy, the ease of use of DATs may be particularly influential in their driving decisions.
A core relationship in TAM is that perceived ease of use positively influences perceived usefulness. The rationale is that technologies that are easier to use require less effort, allowing users to allocate more resources to achieving their goals, thereby enhancing performance and usefulness. This relationship has been consistently supported in technology adoption research and specifically in the context of driving technologies. For young Chinese drivers, who may have higher baseline expectations for ease of use as digital natives, this relationship may be particularly strong, with usability being a prerequisite for recognizing the benefits of DAT.
Beyond the traditional TAM relationships, the integrated framework proposes novel cross-theory relationships between technology perceptions and attitudes toward risky driving. These relationships suggest that when young drivers find safety technologies easy to use and useful, they may develop less favorable attitudes toward risky driving behaviors that conflict with these technologies. While these cross-theory relationships have limited precedent in existing literature, they are suggested by research on technology-induced behavior change and studies examining how technology perceptions influence risk assessment [54]. For young drivers in urban China, these relationships may be particularly relevant due to the rapid technological transformation of the driving environment, the relative malleability of driving attitudes among inexperienced drivers, and the cultural emphasis on technology as a solution to societal problems in modern China.
Based on the TAM framework and its application to driving technologies, the following hypotheses are proposed:
H2a :
Perceived usefulness of driving assistance technologies is negatively associated with intentions to engage in risky driving behaviors among young drivers in urban China.
H2b :
Perceived ease of use of driving assistance technologies is negatively associated with intentions to engage in risky driving behaviors among young drivers in urban China.
H2c :
Perceived ease of use of driving assistance technologies is positively associated with perceived usefulness of these technologies among young drivers in urban China.
H2d :
Perceived ease of use of driving assistance technologies is negatively associated with attitudes toward risky driving behaviors among young drivers in urban China.
H2e :
Perceived usefulness of driving assistance technologies is negatively associated with attitudes toward risky driving behaviors among young drivers in urban China.
Both TPB and TAM share the fundamental proposition that behavioral intentions are the most proximal predictors of actual behavior [12,38]. This relationship forms a crucial link in the integrated framework, connecting the psychological and technological determinants to actual risky driving behaviors. The relationship between intentions and behavior has been consistently supported in driving research, with Elliott et al. [32] finding that intentions significantly predicted speeding behavior among UK drivers and [55] observing a strong relationship between aggressive driving intentions and self-reported aggressive driving behaviors in China.
For young drivers in urban China, the intention-behavior relationship may be influenced by several contextual factors. First, the dynamic urban environment may present situations where behavioral intentions are tested against real-world constraints and opportunities. Second, the social context of driving in China, where behaviors may be observed and judged by others, may create additional motivation to act on formed intentions to maintain social consistency. Third, the relative inexperience of young drivers may result in fewer established driving habits that might otherwise moderate the intention-behavior relationship, potentially strengthening the direct influence of intentions on behavior. Based on this theoretical foundation, the following hypothesis is proposed:
H3 :
Intentions to engage in risky driving behaviors are positively associated with actual risky driving behaviors among young drivers in urban China.
4. Methodology
4.1. Research Design
This study employs a cross-sectional survey design, collecting data from young drivers in urban China through a structured questionnaire. The research follows a quantitative approach to examine the relationships between the theoretical constructs derived from TPB and TAM frameworks. The cross-sectional design allows for efficient data collection at a single point in time, capturing the current attitudes, perceptions, and behaviors of the target population. Prior to the main study, a preliminary qualitative phase was conducted involving in-depth interviews with 15 young drivers and 3 traffic safety experts to inform the questionnaire development and ensure the contextualization of measurement items to the Chinese urban driving environment. The questionnaire includes measures of demographic characteristics, TPB constructs (attitudes, subjective norms, perceived behavioral control), TAM constructs (perceived usefulness, perceived ease of use), behavioral intentions, and actual risky driving behaviors. Throughout this study, the term DAT is used to refer to all types of ADASs commonly available to Chinese drivers, including, but not limited to, speed assistance, lane keeping, and fatigue monitoring systems. The term DAT was consistently used in the questionnaire and explained to participants prior to data collection.
4.2. Sample and Data Collection
The target population consisted of young drivers aged 18–30 years with valid driving licenses in urban areas of China. Participants were recruited through a systematic sampling approach at convenience sampling locations. Specifically, research assistants were stationed at high-traffic public locations in downtown Shaoguan (such as shopping malls, university campuses, parking lots, and gas stations), and every third eligible person passing by was invited to participate in the survey. If a selected person declined, the next third person was approached. Although this systematic approach was adopted to minimize selection bias, the overall sampling frame was based on convenience sampling, and we acknowledge this limitation in the discussion. This process ensured diversity in the sample and reduced potential researcher selection bias.
To enhance the randomization process, research assistants used a systematic approach where every third eligible person passing by a designated point was invited to participate. If a person declined, the next third person was approached. This helped minimize selection bias that might occur if research assistants consciously or unconsciously selected participants based on appearance or perceived approachability. Following [56] recommendation for structural equation modeling analysis, the target sample size was set at a minimum of 400 valid participants to achieve a 10:1 subject-to-parameter ratio. After removing invalid questionnaires (those with incomplete responses, inconsistent answers on validation questions, or completed in less than the minimum expected time), a final sample of 495 valid responses was obtained, exceeding the minimum required sample size and enhancing the statistical power of the analysis. The systematic sampling approach improved the diversity of the sample; however, the overall generalizability of the findings remains limited due to the use of convenience sampling locations.
4.3. Measurement Instruments
The questionnaire used in this study includes the following scales, all of which underwent rigorous development and validation procedures: Basic demographic information was collected, including age, gender, education level, monthly income, years of driving experience, driving frequency, average weekly mileage, vehicle type, involvement in traffic violations or accidents in the past three years, and city of residence. These variables serve as potential control variables and for sample characterization.
The scale items of variables were adapted from the existing scales of previous works [28,32,33,35,41,53]. In this part, respondents rated their opinions on a five-point Likert scale of 1 (strongly disagree), 2 (disagree), 3 (neutral), 4 (agree), and 5 (strongly agree). The specific items are shown in Table 1. All factors underwent Chinese translation and back-translation procedures to ensure content validity. The translation was performed by two bilingual researchers, and discrepancies were resolved through discussion with a third bilingual expert. Additionally, a small-scale pilot test (n = 50) was conducted prior to the formal survey to assess the comprehensibility and reliability of the questionnaire. Based on feedback from the pilot test, minor modifications were made to improve clarity and cultural appropriateness of certain items. The pilot test results showed that all scales had Cronbach’s α coefficients greater than 0.75, indicating good internal consistency.

Table 1.
Items in the Five Subscales of Actual Risky Driving Behaviors.
It should be acknowledged that while perceived usefulness and ease of use items were assessed in relation to “driving assistance technologies” in general, the items used to measure behavioral intention and actual risky driving behaviors were specific to actions such as speeding, mobile phone use, and aggressive maneuvers. This general approach was adopted because, in the current Chinese context, young drivers’ exposure to and knowledge of DATs are still developing, and many DAT systems address a subset—but not all—of these risky behaviors. Although this design may introduce some construct mismatch, it provides a useful starting point for exploring broad technology attitudes as a factor influencing risky driving. Future studies should further refine this approach by matching technology acceptance constructs to specific risk-mitigating systems and behaviors, as well as assessing drivers’ familiarity with each technology.
This design also reflects the current developmental stage of DAT adoption in China, where public awareness, access, and usage of such technologies vary substantially. As a result, employing a general measure of attitudes toward DATs serves as a practical and necessary first step for empirical exploration in this context.
4.4. Data Collection Procedures
The data collection was conducted between October and December 2024. For face-to-face surveys in downtown Shaoguan, four trained research assistants approached potential participants in predetermined locations during various times of the day (morning, afternoon, and evening) and days of the week (weekdays and weekends) to ensure diversity in the sample. The research assistants introduced the study purpose, confirmed eligibility criteria, obtained informed consent, and provided instructions for completing the questionnaire. Participants completed the questionnaire independently, with research assistants available to address any questions. Each face-to-face survey took approximately 15–20 min to complete. Small incentives were provided to participants as a token of appreciation. All participants were informed about the voluntary nature of participation, confidentiality measures, and their right to withdraw at any time without penalty.
4.5. Data Analysis Methods
On one hand, to analyze the influence of demographic factors on risky driving behavior among young drivers in urban China, descriptive statistical analysis and analysis of variance were conducted using SPSS 26.0. This aimed to examine the relationship between personal demographic factors (gender, age, driving experience, etc.) and risky driving behaviors. On the other hand, to further analyze the magnitude and mechanisms of the impact of various factors in the integrated TPB-TAM on risky driving behaviors, several steps were taken. First, the reliability and validity of the measurement model were assessed using Cronbach’s alpha coefficient, composite reliability, and confirmatory factor analysis. Then, Pearson’s correlation analysis was employed to determine the correlations between factors in the integrated model. Finally, Structural Equation Modeling (SEM) was performed using AMOS 24.0 to validate and analyze the integrated theoretical framework. Additionally, logistic regression analyses were conducted to further validate the predictive effects of model constructs on actual traffic violations and accidents. All statistical analyses were performed using a significance level of α = 0.05. Effect sizes were reported using standardized path coefficients and explained variance (R2) values. In this section, the analysis framework will be presented, as shown in Figure 2.
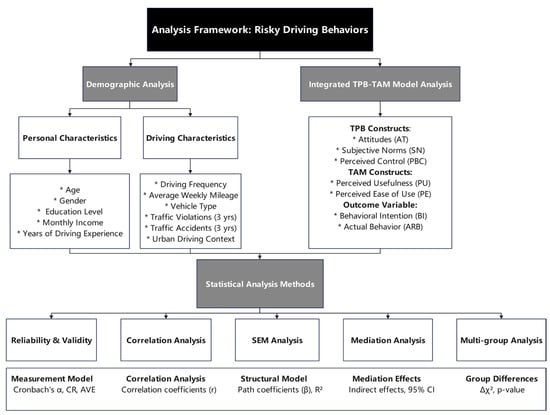
Figure 2.
Analysis Framework.
5. Results
Section 5 presents the main empirical results of the study, including sample characteristics, measurement model evaluation, structural model results, and additional analyses such as mediation, multi-group comparisons, and model comparisons.
5.1. Demographic Characteristics
The final demographic comprised 253 male participants (51.1%) and 242 female participants (48.9%). Participants’ ages ranged from 18 to 30 years, with 36.8% aged 23–26 years, 24.6% aged 27–30 years, and 38.6% aged 18–22 years. Regarding education level, 48.1% of participants held a bachelor’s degree, 28.5% had high school education or below, and 23.4% possessed a master’s degree or higher. In terms of monthly income, nearly half (49.0%) reported earning between 5000 and 10,000 CNY, 31.3% earned less than 5000 CNY, 10.7% earned between 10,000 and 15,000,000 CNY, and 9.0% earned more than 15,000 CNY. Most participants had 1–3 years of driving experience (39.6%), followed by less than 1 year (38.4%), 3–5 years (13.5%), and more than 5 years (8.5%). Regarding driving frequency, more than half (50.9%) of participants reported driving daily, 30.0% drove 3–5 times per week, 13.5% drove 1–2 times per week, and only 5.6% drove less than once per week. For average weekly mileage, 33.9% of participants drove 101–200 km, 33.7% drove 50–100 km, 17.7% drove more than 200 km, and 14.7% drove less than 50 km. The distribution of vehicle types showed that the majority of participants (72.4%) drove passenger cars, 15.8% drove SUVs, 8.9% drove motorcycles, and 2.9% drove other types of vehicles. Regarding urban driving context, 45.2% of participants primarily drove in urban-suburban mixed areas, 37.0% in high-density urban cores, and 17.8% in primarily suburban areas.
Notably, 38.2% of participants reported having been involved in at least one traffic violation in the past three years, with 27.7% having 1–2 violations, 8.5% having 3–5 violations, and 2.0% having more than 5 violations. During the same period, 21.6% of participants experienced at least one traffic accident, with 16.8% experiencing 1 accident, 3.8% experiencing 2 accidents, and 1.0% experiencing 3 or more accidents. Table 2 presents the demographic characteristics of the participants.
Table 2.
Demographic Characteristics of Participants (N = 495).
5.2. Reliability and Validity Analysis
To assess the internal consistency reliability of measurement scales, Cronbach’s alpha coefficients were calculated for each construct. As shown in Table 3, all constructs demonstrated high reliability with Cronbach’s alpha values ranging from 0.793 to 0.887, exceeding the recommended threshold of 0.7 [57]. The Cronbach’s alpha values for AT, SN, PBC, PU, PE, BI, and ARB were 0.842, 0.816, 0.859, 0.887, 0.812, 0.831, and 0.793, respectively.
Table 3.
Reliability Analysis.
Convergent validity was evaluated using confirmatory factor analysis (CFA). Convergent validity was assessed using three indicators: standardized factor loadings, composite reliability (CR), and average variance extracted (AVE). All standardized factor loadings were statistically significant (p < 0.001) and ranged from 0.672 to 0.891, exceeding the recommended threshold of 0.60 [58]. As shown in Table 3, CR values ranged from 0.864 to 0.921 (threshold: >0.70), and AVE values ranged from 0.563 to 0.746 (threshold: >0.50), indicating adequate convergent validity. As presented in Table 3, these results indicate adequate convergent validity for all constructs in the measurement model.
Discriminant validity was assessed using the Fornell-Larcker criterion, which requires that the square root of the AVE for each construct should exceed the correlation between that construct and any other construct in the model. Table 4 shows that the square root of the AVE for each construct (diagonal elements in bold) was greater than its correlation with any other construct, confirming satisfactory discriminant validity.
Table 4.
Validity Analysis.
The overall measurement model fit was assessed using multiple goodness-of-fit indices. The results are presented in Table 5: χ2/df = 2.341 (<3.0), GFI = 0.918 (>0.90), AGFI = 0.903 (>0.90), CFI = 0.946 (>0.90), NFI = 0.927 (>0.90), RMSEA = 0.052 (<0.08), and SRMR = 0.046 (<0.08). These indices collectively suggest that the measurement model demonstrates a satisfactory fit to the data [59].
Table 5.
Goodness-Of-Fit Indices and Suggested Criteria.
5.3. Structural Model and Hypothesis Testing
After confirming the measurement model’s reliability and validity, SEM was used to test the hypothesized relationships. The model explained 58.3% of the variance in BI and 42.6% of the variance in ARB. Figure 3 presents the path diagram of the structural equation model for the integrated model. Table 6 presents the results of hypothesis testing, including standardized path coefficients, t-values, p-values, and hypothesis testing outcomes.
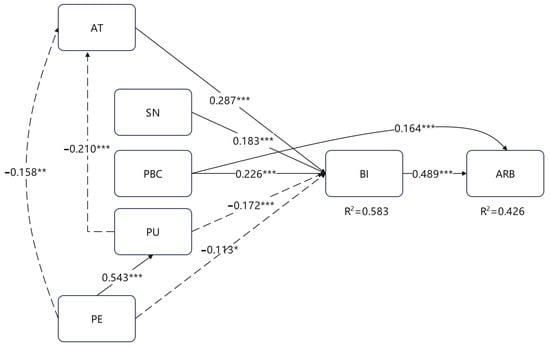
Figure 3.
Path Diagram of The Structural Equation Model for the Integrated Model. Solid Lines Indicate Positive Impacts; Dotted Lines Indicate Negative Impacts. Note: * p < 0.05, ** p < 0.01, *** p < 0.001.
Table 6.
Results of Hypothesis Testing.
All hypothesized relationships were supported. Attitudes toward risky driving behaviors (AT, β = 0.287, p < 0.001), subjective norms (SN, β = 0.183, p < 0.001), and perceived behavioral control (PBC, β = 0.226, p < 0.001) all positively influenced behavioral intention (BI), supporting H1a, H1b, and H1c. PBC also directly influenced actual risky driving behaviors (ARB, β = 0.164, p < 0.001), supporting H1d. Regarding technology acceptance constructs, perceived usefulness (PU, β = −0.172, p < 0.001) and perceived ease of use (PE, β = −0.113, p = 0.017) of DATs both negatively influenced behavioral intention toward risky driving, supporting H2a and H2b. PE positively influenced PU (β = 0.543, p < 0.001), supporting H2c. Both PE (β = −0.158, p = 0.002) and PU (β = −0.210, p < 0.001) negatively influenced attitudes toward risky driving behaviors, supporting H2d and H2e. Finally, behavioral intention significantly influenced actual risky driving behaviors (β = 0.489, p < 0.001), supporting H3.
These results provide comprehensive support for the proposed integrated TPB-TAM, demonstrating that both psychological factors from TPB and technology acceptance factors from TAM significantly contribute to understanding young drivers’ risky driving behaviors in urban China.
5.4. Mediation Analysis
Mediation effects were examined using the bootstrap procedure with 5000 resamples. Table 7 presents the results of the mediation analysis.
Table 7.
Mediation Analysis Results.
The analysis revealed three significant mediation pathways. PU partially mediated the relationship between PE and BI (indirect effect = −0.093, 95% CI [−0.142, −0.052]). AT partially mediated the relationship between PE and BI (indirect effect = −0.045, 95% CI [−0.084, −0.013]). Additionally, AT partially mediated the relationship between PU and BI (indirect effect = −0.060, 95% CI [−0.097, −0.029]).
5.5. Multi-Group Analysis
Multi-group SEM analyses were conducted to examine potential moderating effects of demographic characteristics on the hypothesized relationships. The multi-group analysis revealed that the influence of PBC on BI differed significantly by gender, with a stronger effect for males than females. Specifically, males showed a stronger PBC → BI relationship (β = 0.291, p < 0.01) compared to females (β = 0.176, p < 0.05). Additionally, the direct effect of PBC on ARB was also stronger for males, with β = 0.201, p < 0.01 compared to β = 0.124, p < 0.05 for females. This suggests that PBC has a greater influence on risky driving behaviors for male drivers in urban China, which could be attributed to cultural and social factors that drive males to have stronger perceptions of control over their actions.
The AT on BI approached a significant difference across age groups, with the youngest group (18–22 years) exhibiting the strongest effect (β = 0.354, p < 0.01), followed by the 23–26 years group (β = 0.278, p < 0.01) and the 27–30 years group (β = 0.245, p < 0.01). This finding suggests that Attitudes toward risky driving are stronger predictors of Behavioral Intention for younger drivers, supporting the assumption that younger drivers are more likely to engage in risky behaviors due to their more lenient attitudes toward them. Furthermore, the direct effect of PBC on ARB also approached significance across age groups. The 18–22 years group showed the strongest effect (β = 0.231, p < 0.01), while the older age groups (23–26 years and 27–30 years) demonstrated weaker effects (β = 0.153, p < 0.05; β = 0.129, p < 0.05, respectively). This aligns with findings that less experienced drivers tend to be more susceptible to engaging in risky behaviors due to a lack of confidence and control in driving situations.
The influence of PBC on BI approached a significant difference across driving experience groups, with the strongest effect found in the less experienced group (<1 year) (β = 0.289, p < 0.01), followed by the 1–3 years group (β = 0.231, p < 0.01) and the more experienced group (>3 years) (β = 0.173, p < 0.05). This result confirms that novice drivers are more likely to overestimate their ability to control driving behaviors, potentially leading to higher risk-taking. The direct effect of PBC on ARB also varied significantly across driving experience groups. The effect was strongest for the less experienced drivers (<1 year) (β = 0.243, p < 0.01) and weakened for those with 1–3 years of experience (β = 0.167, p < 0.05), with no significant effect for the more experienced group. This suggests that novice drivers are more influenced by their perceptions of control when engaging in risky driving behaviors, while more experienced drivers may rely more on learned behaviors and habitual driving patterns.
5.6. Model Comparison
To evaluate the effectiveness of the integrated TPB-TAM, it was compared with the TPB-only model and the TAM-only model. Table 8 presents the comparison results.
Table 8.
Comparison of Alternative Models.
The integrated TPB-TAM outperformed both the TPB-only and TAM-only models in terms of explained variance and model fit. The integrated model explained 58.3% of the variance in BI, compared to 46.8% for the TPB-only model and 36.2% for the TAM-only model. Similarly, it explained 42.6% of the variance in ARB, compared to 39.4% for the TPB-only model and 29.8% for the TAM-only model. Likelihood ratio tests confirmed that the integrated model represented a significant improvement over both the TPB-only model (Δχ2 = 194.56, Δdf = 78, p < 0.001) and the TAM-only model (Δχ2 = 276.13, Δdf = 84, p < 0.001).
5.7. Total Effect Analysis
Table 9 presents the total effects (direct + indirect effects) of predictor variables on behavioral intention (BI) and actual risky driving behaviors (ARB). The strongest predictors of BI were AT (0.287), PE (−0.252), PU (−0.232), and PBC (0.226). For ARB, the strongest predictors were BI (0.489), PBC (0.274), AT (0.140), and PE (−0.123). The total effect of PBC on ARB (0.274) comprised both its direct effect (0.164) and its indirect effect through BI (0.110).
Table 9.
Total Effects on Behavioral Intention and Actual Risky Driving Behaviors.
5.8. Prediction of Traffic Safety Outcomes
Logistic regression analyses were conducted to examine the predictive validity of the model constructs for traffic violations and accidents (Table 10 and Table 11). The models explained 32.5% and 23.7% of the variance in traffic violations and accidents, respectively. For violations, significant positive predictors included AT, PBC, BI, ARB, and male gender, while PU, age, and driving experience were significant negative predictors. For accidents, AT, ARB, and male gender were significant positive predictors, while PU was a significant negative predictor.
Table 10.
Logistic Regression Results for Traffic Violations.
Table 11.
Logistic Regression Results for Traffic Accidents.
6. Discussion
Section 6 discusses the theoretical and practical implications of the findings, addresses key limitations, and provides directions for future research.
6.1. Overview of Findings
This study investigated risky driving behaviors among young drivers in urban China through an integrated model that combines the TPB and the TAM. The empirical results support all proposed hypotheses, demonstrating the efficacy of this integrated approach. Three key findings emerged from this research. First, the traditional TPB constructs—attitudes toward risky driving behaviors, subjective norms, and perceived behavioral control—significantly influenced behavioral intentions, consistent with the original theory [12]. Among these constructs, attitudes exhibited the strongest influence (β = 0.287), followed by perceived behavioral control (β = 0.226) and subjective norms (β = 0.183). Additionally, perceived behavioral control directly affected actual risky driving behaviors (β = 0.164), confirming the dual-pathway influence mechanism proposed in TPB.
Second, TAM constructs—perceived usefulness and perceived ease of use of DAT—negatively influenced behavioral intentions toward risky driving (β = −0.172 and β = −0.113, respectively). Furthermore, these technology acceptance constructs negatively influenced attitudes toward risky driving behaviors (β = −0.210 and β = −0.158, respectively), suggesting that perceptions of DATs may reshape drivers’ fundamental attitudes toward risky driving.
Third, the integrated TPB-TAM demonstrated superior explanatory power compared to either single-theory model. The integrated model explained 58.3% of the variance in behavioral intentions and 42.6% of the variance in actual risky driving behaviors, significantly outperforming both the TPB-only model (46.8% and 39.4%, respectively) and the TAM-only model (36.2% and 29.8%, respectively). These results validate the theoretical integration and provide a more comprehensive framework for understanding risky driving behaviors among young drivers in urban China.
6.2. Theoretical Implications
This study extends the applicability of TPB to the context of risky driving behaviors among young drivers in urban China. The significant relationships between TPB constructs and behavioral intentions align with prior research in Western contexts [32,33], but with notable differences in the relative influence of these constructs. In our study, attitudes toward risky driving behaviors emerged as the strongest predictor (β = 0.287), which differs from some Western studies where perceived behavioral control often demonstrates greater influence [60]. This finding may reflect cultural differences in driving behaviors. In the Chinese context, where driving is increasingly viewed as a symbol of social status and personal freedom among young urbanites [61], attitudes toward risky driving may be more deeply embedded in broader cultural values and social identities than in Western societies with longer histories of private vehicle ownership. The relative strength of attitudinal influences suggests that interventions targeting attitude change might be particularly effective in the Chinese context. The significant direct effect of perceived behavioral control on actual risky driving behaviors (β = 0.164) confirms the dual-pathway influence proposed in the original TPB model [12]. This relationship was particularly pronounced among less experienced drivers, suggesting that overconfidence in driving abilities may contribute to risk-taking behaviors among novice drivers. This finding aligns with research by Constantinou et al. [24] and Walshe et al. [22], who identified overconfidence as a key risk factor among young drivers.
The integration of TAM constructs into the risky driving behavior framework represents a theoretical innovation. While previous studies have applied TAM to understand acceptance of driving technologies [53], this study is among the first to examine how technology acceptance factors might influence risky driving behavior intentions through both direct and indirect pathways. The significant negative relationship between perceived usefulness of DATs and behavioral intentions toward risky driving (β = −0.172) suggests that young drivers who recognize the value of these technologies may be less inclined to engage in risky behaviors. This finding extends beyond the conventional application of TAM, which typically focuses on technology adoption rather than behavioral modification [41]. More importantly, the negative associations between technology acceptance constructs and attitudes toward risky driving behaviors (PU → AT: β = −0.210; PE → AT: β = −0.158) reveal a novel mechanism through which technology perceptions may reshape fundamental driving attitudes. This finding suggests that exposure to and positive evaluation of DATs may trigger a cognitive reassessment of risky driving behaviors, potentially serving as an attitudinal intervention mechanism.
The superior explanatory power of the integrated model validates the value of theoretical integration in understanding complex behaviors. The significant improvement in variance explained (ΔR2 = 0.115 for BI and ΔR2 = 0.032 for ARB compared to the TPB-only model) demonstrates that TAM constructs capture additional dimensions of influence not accounted for in the traditional TPB framework. Furthermore, the mediation analysis revealed significant cross-theory mediation pathways, including PE → PU → BI (indirect effect = −0.093), PE → AT → BI (indirect effect = −0.045), and PU → AT → BI (indirect effect = −0.060). These cross-theory mediations highlight the complex interplay between technology perceptions and psychological determinants of risky driving, suggesting that the influence of technology extends beyond its direct effects to reshape the underlying cognitive structures that inform behavioral decisions. This integrated approach responds to calls in the literature for more comprehensive theoretical frameworks to understand risky driving behaviors [31]. By bridging psychological and technological factors, our model provides a more nuanced understanding of how young drivers navigate increasingly technology-rich driving environments in urban China. This study advances theoretical understanding in several important ways. Unlike prior research that mainly focused on the direct prediction of technology adoption or risky driving behavior, our findings demonstrate that technology acceptance constructs (perceived usefulness and ease of use) can indirectly influence risky driving intentions and behaviors through their effects on attitudes. This indirect mechanism highlights a novel pathway for how positive technology perceptions can reshape fundamental risk-related cognitions among young urban drivers in China. By systematically testing and validating these cross-theory mediation effects within an integrated TPB-TAM framework, this research expands the explanatory power of existing models and addresses a gap rarely explored in the previous literature, particularly in non-Western contexts.
6.3. Practical Implications
The findings from this study suggest several targeted intervention strategies for reducing risky driving behaviors among young drivers in urban China. First, given the strong influence of attitudes on behavioral intentions, educational campaigns should focus on reshaping young drivers’ normative beliefs about risky driving. These campaigns could highlight the severe consequences of risky driving while promoting responsible driving as a sign of maturity and social responsibility, appealing to young drivers’ desire for positive social identity. Second, the influence of perceived behavioral control suggests that realistic feedback interventions may be effective, particularly for novice drivers. Driver training programs could incorporate simulated risk scenarios and provide objective feedback on performance to calibrate young drivers’ perceptions of their abilities with their actual skills, potentially reducing overconfidence-driven risk-taking. Third, the negative influence of technology acceptance factors on risky driving intentions suggests that promoting awareness and understanding of DATs could serve as an indirect intervention strategy. Driver education programs could include comprehensive information about these technologies, emphasizing their safety benefits and ease of use to enhance both perceived usefulness and perceived ease of use.
The significant cross-theory relationships identified in this study have implications for the design and implementation of DAT. The finding that perceived ease of use influences perceived usefulness (β = 0.543), which in turn affects both attitudes and behavioral intentions, underscores the importance of user-friendly interfaces in driving assistance systems. Manufacturers should prioritize intuitive design and user experience to maximize the acceptance and effectiveness of these technologies among young drivers. Furthermore, the negative association between technology acceptance factors and attitudes toward risky driving suggests that DATs should be designed not only to intervene in risky situations but also to provide educational feedback that may reshape drivers’ attitudes over time. For example, technology that offers post-drive reports highlighting instances of potential risk and suggesting safer alternatives might promote reflective learning and gradual attitude change. The gender differences observed in the relationship between perceived behavioral control and behavioral intentions (stronger for males) suggest that technology implementations might benefit from gender-specific calibration. For male drivers, who may be more influenced by perceptions of control, technologies that gradually increase driver involvement as skills improve may be particularly effective in reducing risk-taking.
Our findings offer several policy recommendations for traffic safety management in urban China. First, the predictive relationship between model constructs and actual traffic violations/accidents demonstrates the practical relevance of addressing psychological and technological factors in safety policy. Policymakers could develop graduated licensing systems that incorporate psychological assessments and technology training as part of the licensing process for young drivers. Second, the stronger influence of perceived behavioral control among less experienced drivers suggests that novice-specific regulations might be particularly effective. These could include extended probationary periods with stricter technology-enforced limitations (e.g., speed governors, enhanced monitoring) that gradually decrease as experience increases, aligning with our finding that the direct influence of PBC on ARB weakens with driving experience. Third, the significant influence of subjective norms suggests that community-based approaches to traffic safety might be effective. Policies that encourage peer-to-peer safety advocacy and social recognition for responsible driving could leverage the social influence mechanisms identified in our model.
6.4. Limitations and Future Research Directions
Several limitations should be acknowledged. First, as this study employed a cross-sectional design, all variables were measured at a single time point, which limits the ability to draw causal inferences. Longitudinal or experimental studies are recommended for future research to better establish causal pathways. Second, the reliance on self-reported data introduces potential biases, including social desirability and recall bias. Although confidentiality was assured, participants may have underreported or inaccurately recalled their risky driving behaviors. Future studies should combine self-reported measures with objective data sources such as telematics, official driving records, or in-vehicle monitoring systems. Third, there may be a construct mismatch between the general assessment of attitudes toward DATs and the measurement of specific risky driving behaviors. Future research should aim to align technology acceptance items more closely with specific behaviors and DAT functions. Fourth, as the sample was drawn exclusively from young drivers in Shaoguan, Guangdong Province, the findings may not be generalizable to all urban Chinese drivers or other regions. Expanding the sample to multiple cities and diverse regions would enhance external validity.
7. Conclusions
This study developed and validated an integrated TPB-TAM to understand risky driving behaviors among young drivers in urban China. The results demonstrated that both psychological factors from TPB (attitudes, subjective norms, and perceived behavioral control) and technology acceptance factors from TAM (perceived usefulness and perceived ease of use of DATs) significantly influence behavioral intentions toward risky driving, which in turn affect actual risky driving behaviors. The integrated model provided superior explanatory power compared to either the single-theory model, explaining 58.3% of the variance in behavioral intentions and 42.6% of the variance in actual risky driving behaviors. The significant cross-theory relationships, including the negative influence of technology acceptance factors on attitudes toward risky driving, revealed novel mechanisms through which technology perceptions may reshape driving behaviors.
These findings offer valuable theoretical insights into the complex determinants of risky driving among young urban drivers in China and provide practical guidance for developing targeted interventions, improving technology design, and formulating effective traffic safety policies. As China continues to experience rapid motorization and technological advancement in its urban centers, this integrated approach offers a promising framework for addressing the critical public health challenge of traffic safety among young drivers. By bridging psychological and technological perspectives, this research contributes to a more comprehensive understanding of risky driving behaviors in the modern driving environment and highlights the potential for technology-enhanced approaches to traffic safety. Future research should build on this integrated foundation to explore longitudinal effects, additional psychological and technological factors, and culturally specific dimensions of driving behavior in diverse contexts.
Author Contributions
Conceptualization, R.L.; methodology, R.L.; software, X.L. (Xiaoqing Li); formal analysis, X.L. (Xiangyu Li); supervision, X.L. (Xiangyu Li). All authors have read and agreed to the published version of the manuscript.
Funding
This research was funded by the Doctoral Research Start-up Project of Shaoguan University (Grant no. 9900064708/440).
Institutional Review Board Statement
Not applicable.
Informed Consent Statement
Informed consent was obtained from all subjects involved in the study.
Data Availability Statement
The data used to support the findings of this study are available from the corresponding author upon reasonable request.
Conflicts of Interest
The authors declare no conflicts of interest.
References
- Li, R.; Sinniah, G.K.; Li, X. The Factors Influencing Resident’s Intentions on E-Bike Sharing Usage in China. Sustainability 2022, 14, 5013. [Google Scholar] [CrossRef]
- Boulagouas, W.; García-Herrero, S.; Chaib, R.; Febres, J.D.; Mariscal, M.Á.; Djebabra, M. An investigation into unsafe behaviors and traffic accidents involving unlicensed drivers: A perspective for alignment measurement. Int. J. Environ. Res. Public Health 2020, 17, 6743. [Google Scholar] [CrossRef]
- Hatfield, J.; Fernandes, R. The role of risk-propensity in the risky driving of younger drivers. Accid. Anal. Prev. 2009, 41, 25–35. [Google Scholar] [CrossRef]
- Li, D.-H.; Liu, Q.; Yuan, W.; Liu, H.X. Relationship between fatigue driving and traffic accident. J. Traffic Transp. Eng. 2010, 10, 104–109. [Google Scholar]
- Bengler, K.; Dietmayer, K.; Farber, B.; Maurer, M.; Stiller, C.; Winner, H. Three decades of driver assistance systems: Review and future perspectives. IEEE Intell. Transp. Syst. Mag. 2014, 6, 6–22. [Google Scholar] [CrossRef]
- Bao, S.; Wu, L.; Yu, B.; Sayer, J.R. An examination of teen drivers’ car-following behavior under naturalistic driving conditions: With and without an advanced driving assistance system. Accid. Anal. Prev. 2020, 147, 105762. [Google Scholar] [CrossRef] [PubMed]
- Izzetoglu, M.; Jiao, X.; Park, S. Understanding Driving Behavior Using fNIRS and Machine Learning. In Proceedings of the International Conference on Transportation and Development 2021, Phoenix, AZ, USA, 8–10 June 2021; American Society of Civil Engineers (ASCE): Reston, VA, USA, 2021; pp. 367–377. [Google Scholar]
- Peppes, N.; Alexakis, T.; Adamopoulou, E.; Demestichas, K. Driving Behaviour Analysis Using Machine and Deep Learning Methods for Continuous Streams of Vehicular Data. Sensors 2021, 21, 4704. [Google Scholar] [CrossRef]
- Morales-Alvarez, W.; Certad, N.; Roitberg, A.; Stiefelhagen, R.; Olaverri-Monreal, C. On Transferability of Driver Observation Models from Simulated to Real Environments in Autonomous Cars. In Proceedings of the Conference on Intelligent Transportation Systems (ITSC), Atlanta, GA, USA, 24–28 September 2023; IEEE: Piscataway, NJ, USA, 2023; pp. 3129–3134. [Google Scholar]
- Peng, Z.; Pan, H.; Yuan, R.; Wang, Y. A comparative analysis of risk factors influencing crash severity between full-time and part-time riding-hailing drivers in China. Transp. Lett. 2024, 17, 612–627. [Google Scholar] [CrossRef]
- Somoray, K.; White, K.M.; Watson, B.; Lewis, I. Predicting risky driving behaviours using the theory of planned behaviour: A meta-analysis. Accid. Anal. Prev. 2024, 208, 107797. [Google Scholar] [CrossRef]
- Ajzen, I. The theory of planned behavior. Organ. Behav. Hum. Decis. Process 1991, 50, 179–211. [Google Scholar] [CrossRef]
- Ajzen, I. Constructing a TPB Questionnaire: Conceptual and Methodological Considerations. Hepatology 2009, 49, 1335–1374. [Google Scholar]
- Ji, W.; Lu, C.; Mao, J.; Liu, Y.; Hou, M.; Pan, X. Public’s Intention and Influencing Factors of Dockless Bike-Sharing in Central Urban Areas: A Case Study of Lanzhou City, China. Sustainability 2021, 13, 9265. [Google Scholar] [CrossRef]
- Weiss, E.; Fisher Thiel, M.; Sultana, N.; Hannan, C.; Seacrist, T. Advanced driver assistance systems for teen drivers: Teen and parent impressions, perceived need, and intervention preferences. Traffic Inj. Prev. 2018, 19, S120–S124. [Google Scholar] [CrossRef]
- Yuen, K.F.; Mansourifar, F.; Nadimi, N.; Golbabaei, F. Novice and Young Drivers and Advanced Driver Assistant Systems: A Review. Futur. Transp. 2025, 5, 32. [Google Scholar] [CrossRef]
- Liang, Z.; Zhan, X.; Deng, R.; Fu, X. Research on Risky Driving Behavior of Young Truck Drivers: Improved Theory of Planned Behavior Based on Risk Perception Factor. J. Adv. Transp. 2024, 2024, 9966501. [Google Scholar] [CrossRef]
- Szajna, B. Empirical Evaluation of the Revised Technology Acceptance Model. Manag. Science. 1996, 42, 85–92. [Google Scholar] [CrossRef]
- Chau, P.Y.K.; Hu, P.J.H. Investigating healthcare professionals’ decisions to accept telemedicine technology: An empirical test of competing theories. Inf. Manag. 2002, 39, 297–311. [Google Scholar] [CrossRef]
- Jin, R.; Wang, X.; Nguyen, M.H.; La, V.P.; Le, T.T.; Vuong, Q.H. A dataset of Chinese drivers’ driving behaviors and socio-cultural factors related to driving. Data Brief 2023, 49, 109337. [Google Scholar] [CrossRef]
- Jonah, B.A. Accident risk and risk-taking behaviour among young drivers. Accid. Anal. Prev. 1986, 18, 255–271. [Google Scholar] [CrossRef]
- Walshe, E.A.; McIntosh, C.W.; Romer, D.; Winston, F.K. Executive function capacities, negative driving behavior and crashes in young drivers. Int. J. Environ. Res. Public Health 2017, 14, 1314. [Google Scholar] [CrossRef]
- Michaels, J.; Chaumillon, R.; Nguyen-Tri, D.; Watanabe, D.; Hirsch, P.; Bellavance, F.; Giraudet, G.; Bernardin, D.; Faubert, J. Driving simulator scenarios and measures to faithfully evaluate risky driving behavior: A comparative study of different driver age groups. PLoS ONE 2017, 12, e0185909. [Google Scholar] [CrossRef] [PubMed]
- Constantinou, E.; Panayiotou, G.; Konstantinou, N.; Loutsiou-Ladd, A.; Kapardis, A. Risky and aggressive driving in young adults: Personality matters. Accid. Anal. Prev. 2011, 43, 1323–1331. [Google Scholar] [CrossRef] [PubMed]
- Arnau-Sabatés, L.; Sala-Roca, J.; Jariot-Garcia, M. Emotional abilities as predictors of risky driving behavior among a cohort of middle aged drivers. Accid. Anal. Prev. 2012, 45, 818–825. [Google Scholar] [CrossRef] [PubMed]
- Scott-Parker, B.; King, M.J.; Watson, B. The psychosocial purpose of driving and its relationship with the risky driving behaviour of young novice drivers. Transp. Res. Part F Traffic Psychol. Behaviour 2015, 33, 16–26. [Google Scholar] [CrossRef]
- Hassan, H.M.; Abdel-Aty, M.A. Exploring the safety implications of young drivers’ behavior, attitudes and perceptions. Accid. Anal. Prev. 2013, 50, 361–370. [Google Scholar] [CrossRef]
- Scott-Parker, B.; Watson, B.; King, M.; Hyde, M. “My mother would freak out”: Understanding the influence of parents on the risky behaviour of their young novice drivers. In Proceedings of the 2013 Australasian Road Safety Research, Policing and Education Conference, Queensland, Australia, 28–30 August 2013. [Google Scholar]
- Rhodes, N.; Pivik, K. Age and gender differences in risky driving: The roles of positive affect and risk perception. Accid. Anal. Prev. 2011, 43, 923–931. [Google Scholar] [CrossRef]
- Bouhsissin, S.; Sael, N.; Benabbou, F. Driver Behavior Classification: A Systematic Literature Review. IEEE Access 2023, 11, 14128–14153. [Google Scholar] [CrossRef]
- Fernandes, R.; Job, R.F.S.; Hatfield, J. A challenge to the assumed generalizability of prediction and countermeasure for risky driving: Different factors predict different risky driving behaviors. J. Saf. Res. 2007, 38, 59–70. [Google Scholar] [CrossRef]
- Elliott, M.A.; Armitage, C.J.; Baughan, C.J. Using the theory of planned behaviour to predict observed driving behaviour. Br. J. Soc. Psychol. 2007, 46, 69–90. [Google Scholar] [CrossRef]
- Forward, S.E. The theory of planned behaviour: The role of descriptive norms and past behaviour in the prediction of drivers’ intentions to violate. Transp. Res. Part F Traffic Psychol. Behav. 2009, 12, 198–207. [Google Scholar] [CrossRef]
- Conner, M.; Smith, N.; McMillan, B. Examining normative pressure in the theory of planned behaviour: Impact of gender and passengers on intentions to break the speed limit. Curr. Psychol. 2003, 22, 252–263. [Google Scholar] [CrossRef]
- Li, P.; Shi, J.; Liu, X.; Wang, H. The Theory of Planned Behavior and Competitive Driving in China. Procedia Eng. 2016, 137, 362–371. [Google Scholar] [CrossRef]
- Sniehotta, F.F.; Presseau, J.; Araújo-Soares, V. Time to retire the theory of planned behaviour. Health Psychol. Rev. 2014, 8, 1–7. [Google Scholar] [CrossRef] [PubMed]
- Davis, F.D. A Technology Acceptance Model for Empirically Testing New End-User Information Systems: Theory and Results; Massachusetts Institute of Technology: Cambridge, MA, USA, 1985. [Google Scholar]
- Davis, F.D. Perceived Usefulness, Perceived Ease of Use, and User Acceptance of Information Technology. MIS Quarterly. 1989, 13, 319–340. [Google Scholar] [CrossRef]
- Buckley, L.; Chapman, R.L.; Sheehan, M. Young Driver Distraction: State of the Evidence and Directions for Behavior Change Programs. J. Adolesc. Health 2014, 54, S16–S21. [Google Scholar] [CrossRef] [PubMed]
- Bagozzi, R.P. The Legacy of the Technology Acceptance Model and a Proposal for a Paradigm Shift. J. Assoc. Inf. Syst. 2007, 8, 244–254. [Google Scholar] [CrossRef]
- Venkatesh, V.; Davis, F.D. A Theoretical Extension of the Technology Acceptance Model: Four Longitudinal Field Studies. Manag. Sci. 2000, 46, 186–204. [Google Scholar] [CrossRef]
- Rahman, M.M.; Lesch, M.F.; Horrey, W.J.; Strawderman, L. Assessing the utility of TAM, TPB, and UTAUT for advanced driver assistance systems. Accid. Anal. Prev. 2017, 108, 361–373. [Google Scholar] [CrossRef]
- Rahman, M.M.; Strawderman, L.; Lesch, M.F.; Horrey, W.J.; Babski-Reeves, K.; Garrison, T. Modelling driver acceptance of driver support systems. Accid. Anal. Prev. 2018, 121, 134–147. [Google Scholar] [CrossRef]
- Ajzen, I.; Fishbein, M. Understanding Attitudes and Predicting Social Behavior, 1st ed.; Prentice-Hall: Hoboken, NJ, USA, 1980. [Google Scholar]
- Wang, K.; Li, G.; Chen, J.; Long, Y.; Chen, T.; Chen, L.; Xia, Q. The adaptability and challenges of autonomous vehicles to pedestrians in urban China. Accid. Anal. Prev. 2020, 145, 105692. [Google Scholar] [CrossRef]
- Fleiter, B.J.; Watson, B.; Lennon, A.; King, M.; Shi, K. Social influences on drivers in China. J. Australas. Coll. Road Saf. 2011, 22, 29–36. [Google Scholar]
- Ajzen, I. The theory of planned behavior: Frequently asked questions. Hum. Behav. Emerg. Technol. 2020, 2, 314–324. [Google Scholar] [CrossRef]
- Cong, H.; Shi, X.; Cooper, J.; Ye, Z.; Suo, Z.; Zhao, X.; Ye, Z.; Chen, C. Road rage in China: An exploratory study. J. Transp. Saf. Secur. 2021, 13, 503–524. [Google Scholar] [CrossRef]
- Tong, L.; Toppinen, A.; Wang, L. Cultural motives affecting tea purchase behavior under two usage situations in China: A study of renqing, mianzi, collectivism, and man-nature unity culture. J. Ethn. Foods 2021, 8, 1–10. [Google Scholar] [CrossRef]
- Jomnonkwao, S.; Uttra, S.; Ratanavaraha, V. Analysis of a driving behavior measurement model using a modified driver behavior questionnaire encompassing texting, social media use, and drug and alcohol consumption. Transp. Res. Interdiscip. Perspect. 2021, 9, 100302. [Google Scholar] [CrossRef]
- Kiriakidis, S. Perceived Behavioural Control in the Theory of Planned Behaviour: Variability of Conceptualization and Operationalization and Implications for Measurement. In Strategic Innovative Marketing. Springer Proceedings in Business and, Economics; Kavoura, A., Sakas, D., Tomaras, P., Eds.; Springer: Cham, Switzerland, 2017; pp. 197–202. [Google Scholar]
- Jafarpour, S.; Rahimi-Movaghar, V. Determinants of risky driving behavior: A narrative review. Med. J. Islam. Repub. Iran. 2014, 28, 142. [Google Scholar]
- Park, E.; Kim, K.J. An Integrated Adoption Model of Mobile Cloud Services: Exploration of Key Determinants and Extension of Technology Acceptance Model. Telemat. Inform. 2014, 31, 376–385. [Google Scholar] [CrossRef]
- Kyriakidis, M.; Happee, R.; De Winter, J.C.F. Public opinion on automated driving: Results of an international questionnaire among 5000 respondents. Transp. Res. Part F Traffic Psychol. Behav. 2015, 32, 127–140. [Google Scholar] [CrossRef]
- Shen, B.; Qu, W.; Ge, Y.; Sun, X.; Zhang, K. The relationship between personalities and self-report positive driving behavior in a Chinese sample. PLoS ONE 2018, 13, e0190746. [Google Scholar] [CrossRef]
- Kline, R.B. Principles and practice of structural equation modeling. Can. Stud. Popul. 2018, 45, 188–195. [Google Scholar] [CrossRef]
- Hair, J.F.; Black, W.C.; Babin, B.J.; Anderson, R.E. Multivariate Data Analysis, 7th ed.; Prentice Hall: Upper Saddle River, NJ, USA, 2009. [Google Scholar]
- Fornell, C.; Larcker, D.F. Evaluating structural equation models with unobservable variables and measurement error. J. Mark. Res. 1981, 18, 39–50. [Google Scholar] [CrossRef]
- Mulaik, S.A.; James, L.R.; Van Alstine, J.; Bennett, N.; Lind, S.; Stilwell, C.D. Evaluation of Goodness-of-Fit Indices for Structural Equation Models. Psychol. Bull. 1989, 105, 430–445. [Google Scholar] [CrossRef]
- Parker, D.; Manstead, A.S.R.; Stradling, S.G.; Reason, J.T.; Baxter, J.S. Intention to Commit Driving Violations: An Application of the Theory of Planned Behavior. J. Appl. Psychol. 1992, 77, 94–101. [Google Scholar] [CrossRef]
- Moeckli, J.; Lee, J.D. The Making of Driving Cultures; AAA Foundation for Traffic Safety: Washington, DC, USA, 2007; pp. 59–76. [Google Scholar]
Disclaimer/Publisher’s Note: The statements, opinions and data contained in all publications are solely those of the individual author(s) and contributor(s) and not of MDPI and/or the editor(s). MDPI and/or the editor(s) disclaim responsibility for any injury to people or property resulting from any ideas, methods, instructions or products referred to in the content. |
© 2025 by the authors. Licensee MDPI, Basel, Switzerland. This article is an open access article distributed under the terms and conditions of the Creative Commons Attribution (CC BY) license (https://creativecommons.org/licenses/by/4.0/).