Article

Influence of ADAS on Driver Distraction

Department of Engineering, University of Messina, Vill. S. Agata, C.da Di Dio, 98166 Messina, Italy
*
Author to whom correspondence should be addressed.
Vehicles 2025, 7(3), 103; https://doi.org/10.3390/vehicles7030103
Submission received: 27 August 2025 / Revised: 16 September 2025 / Accepted: 17 September 2025 / Published: 18 September 2025

Abstract

In recent years, research into smart roads has moved from the purely theoretical phase of initial experiments to an increasing number of applications on new or existing roads. However, a high level of digitization in terms of available equipment may lead to a decrease in driving performance and, consequently, have a negative impact on safety. The aim of this study is to define a procedure to determine the impact of these technologies by analyzing the visual behavior of the driver, in order to refine the on-board devices in case of negative feedback. The visual strategy of a sample of users was evaluated during simulated driving. Their behavior, recorded by an eye tracker, showed that the introduction of an On-Board Unit (OBU) makes drivers more aware of the road. In fact, even if the number of fixations towards the OBU increases, the average duration of each fixation decreases and remains below the alarm thresholds indicated in the literature.

1. Introduction

1.1. Background

Driver distraction is widely recognized as a critical factor in road safety. The performance of road users is often influenced by elements not directly related to infrastructure [1], which can divert attention and lead to incorrect maneuvers [2,3]. In this context, visual distraction is defined as the diversion of a driver’s gaze and attention to activities not necessary for safe driving.
According to the National Highway Traffic Safety Administration (NHTSA), inattention contributes to 78% of all crashes in the USA and 65% of unintentional crashes; cockpit-related distractions alone account for nearly 25% [4,5,6]. Young drivers appear particularly exposed to these risks, both because of their limited driving experience and their extensive use of digital technologies [7,8].
This issue is gaining further relevance with the rapid digitalization of transport systems. Vehicle-to-vehicle (V2V) and vehicle-to-infrastructure (V2I) communication will expose drivers to a large volume of real-time information, which is expected to improve safety [9,10]. Yet, the same technologies may also increase cognitive workload or introduce new forms of distraction, thereby offsetting their potential benefits [11,12]. Given that the visual channel is the primary modality through which drivers acquire information from the road environment [13,14,15,16,17,18,19], even brief interruptions—such as those caused by mobile phone use or interaction with in-vehicle devices—can critically impair perception, hazard detection, and reaction times [20,21]. Understanding how drivers allocate attentional resources under these conditions is therefore central to anticipating and mitigating safety risks.
The technological evolution of vehicles has advanced toward increasingly sophisticated driver assistance systems, ultimately enabling fully autonomous driving. Driving simulators have become essential research tools, as they allow the safe testing of external and in-vehicle conditions not yet available on the market. This raises the question of how faithfully simulators replicate real vehicles, which is crucial to ensure reliable experimental outcomes. Although standardized validation methods are still lacking, recent studies [22,23,24,25,26] have addressed this challenge through various approaches, including the analysis of typical driving maneuvers, performance indicators (speed, acceleration, steering), and physiological responses (visual behavior, heart rate, skin conductance). Overall, commercial driving simulators are generally considered to provide a realistic and reliable representation of actual driving conditions.

1.2. Literature Review

A substantial body of research has examined the effects of distraction on driver performance. Experimental studies, both in simulators and on real roads, demonstrate that distraction leads to longer braking reaction times [27], shorter time to collision [28], and increased difficulty in maintaining lane position [29]. Other immediate consequences include greater variability in speed and steering angle, prolonged reaction times, and reduced headway [30,31,32,33,34].
In practice, drivers continuously divide their attentional resources between primary and secondary tasks, typically with limited performance degradation [35]. However, when secondary tasks coincide with complex driving contexts—such as intersections, urban settings, or unexpected events—the safety margin decreases significantly. In these cases, the additional cognitive demand may deplete the driver’s reserve capacity, delaying reactions and increasing crash risk [36,37].
Among the different forms of distraction, visual distraction is particularly hazardous. By taking the driver’s eyes off the road, it reduces focal length and diminishes the ability to process critical environmental cues [20,21]. Since the visual channel is the dominant source of information during driving [13,14,15,16,17,18,19], any reduction in visual attention can compromise recognition, perception, and response. Eye-tracking studies have identified saccades, fixation counts, and fixation duration on distracting elements as key indicators of visual distraction [38,39]. Notably, fixation durations longer than 2 s have been repeatedly associated with elevated crash risk [40].
The role of Advanced Driver Assistance Systems (ADAS) in relation to distraction has also been widely investigated. Birrel and Fowkes [41], for example, tested the “Foot-LITE” technology during road trials and observed that participants spent only 4.3% of their time looking at the display, with an average fixation of 0.43 s and no fixations exceeding the 2 s threshold. This suggests that ergonomic interface design can mitigate distraction. Similarly, Starkey et al. [42] found that fixations on Intelligent Speed Adaptation (ISA) systems remained both short and infrequent, well below the 2 s limit recommended by NHTSA [43].
Nonetheless, research highlights that ADAS are not inherently beneficial and must be carefully evaluated to avoid user overload [44]. Their effectiveness is greatest when they reduce environmental complexity [45] or simplify road geometry [46], for example, by distinguishing static from dynamic objects, predicting the behavior of surrounding vehicles, or monitoring the driver’s state [47].
Despite these valuable insights, findings remain context-dependent and are often specific to the technologies tested. Consequently, results cannot be easily generalized across different devices or environments. This underscores the need for further investigation into the interaction between visual distraction, human factors, and emerging vehicle technologies, with the ultimate goal of supporting the development of safer, evidence-based design guidelines.

1.3. Research Gap

The present literature review focused on visual distraction with respect to generic in-vehicle devices (telephones, satellite navigation systems, eco-green systems, etc.). However, the digitalization of the roads has received a significant boost in recent years and foresees the introduction of more heterogeneous technological devices. For these devices, a validation procedure is required before their effective introduction.
This study compares, in a simulated context, a “control condition” (without an in-vehicle device) and a “smart condition” by means of an on-board unit (OBU) that sends several messages to the driver. The device aims to assist the driver in gathering information about the road by providing real-time messages. The On-Board Unit (OBU) was designed specifically for this research and, therefore, has no relationship with existing ADAS. However, the methodology applied for the analysis and the results obtained can be applied to existing instrumentation. It has been customized to ensure the specific function of the Smart Roads (compliance with speed limits, reduction of CO2 emissions, information on infrastructure, etc.).
The authors would like to emphasize that, in contrast to previously discussed research, the aim of this paper is to evaluate driver performance on a specific road, with or without this kind of ADAS.
The results could be useful both for the optimal calibration of in-vehicle devices and for the definition of appropriate active and passive safety measures for the infrastructure.

2. Methodology

As expected, two driving conditions are considered: in the first, the driver does not have any instrumental assistance, while in the second, he relies on an OBU that sends appropriate visual feedback related to the criticisms of the road.
In this study, a simulated environment was used for the experiments in order to guarantee control, repeatability, and standardization: the characteristics of the experiment can be managed according to the needs and objectives of the research. The use of the driving simulator allows users to drive in identical weather and traffic conditions. This allows the creation of standard driving tests and the collection of reproducible results.
-
Variable Numbers: A driving simulator can accurately and efficiently measure driver performance. In a real vehicle, very bulky equipment is required to obtain complete, synchronized and accurate measurements.
-
Safety for the user against driving errors: driving simulators allow the study of hazard perception and anticipation, exposing the driver to dangerous driving activities that cannot be tested in a real vehicle.
The ability to control the variables involved beforehand guarantees greater homogeneity and quality of the raw data obtained during the tests. This makes it possible to isolate the components being studied, in this case the smart advice.
Of course, the use of a driving simulator also has some drawbacks, such as the lack of real feedback, the possible nausea that may affect the user while driving, the need to validate the results in relation to the real context, the driver’s motivation, and the perceived level of risk.
Concerning the full consistency of the results with real conditions, it should be noted that this study was based on commercial software (SCANeR®), which has been widely used by many road industries in recent years. Furthermore, the conclusions drawn relate to the comparison between scenarios, both defined in the simulated environment, avoiding any reference to real contexts.

2.1. The Alignment

The route on which the tests were carried out is represented by a track of approximately 4900 m in length, with a random starting point to avoid the influence of a particular sequence of geometric elements on the overall behavior of the driver.
The components of the track are curves and tangents defined in accordance with Italian standards [48]. In particular, there is a first set of 5 curves with a radius of R = 120 m, a second set of 5 curves with a radius of R = 180 m, a third set of 4 curves with a radius of R = 240 m, and, finally, two final curves with a radius of R = 45 m. The details of the 4 sets of curves are shown in Figure 1, where A represents the spiral parameter (the values without a code represent the length of the segments).
The other characteristics of the road may be listed as follows:
  • Two-way road with one lane in each direction.
  • Total width of carriageway and shoulders: 4.5 m.
  • Cross-slope along tangents: 2.5%.
  • Cross-slope along bends: 7%.
To encourage active driver behavior, some particularly critical elements were included in the design:
  • 2 very small radius bends (R = 45 m) following 2 larger radius bends (R = 240 m) and a 236 m long tangent.
  • A work zone of about 500 m in length.
Other secondary external elements (physical objects, trees, bushes, etc.) were not included in the context to avoid increasing the number of variables and obtaining excessive scatter of the results. For the same reason, the authors considered it negligible, or even counterproductive, to vary the degree of alignment, which was therefore maintained in the plan. To properly inform the driver, vertical signs were added to the edges (speed limit, work zone warning, end of work zone, dangerous bend) and to the cones limiting the work zone.

2.2. The Driving Simulator

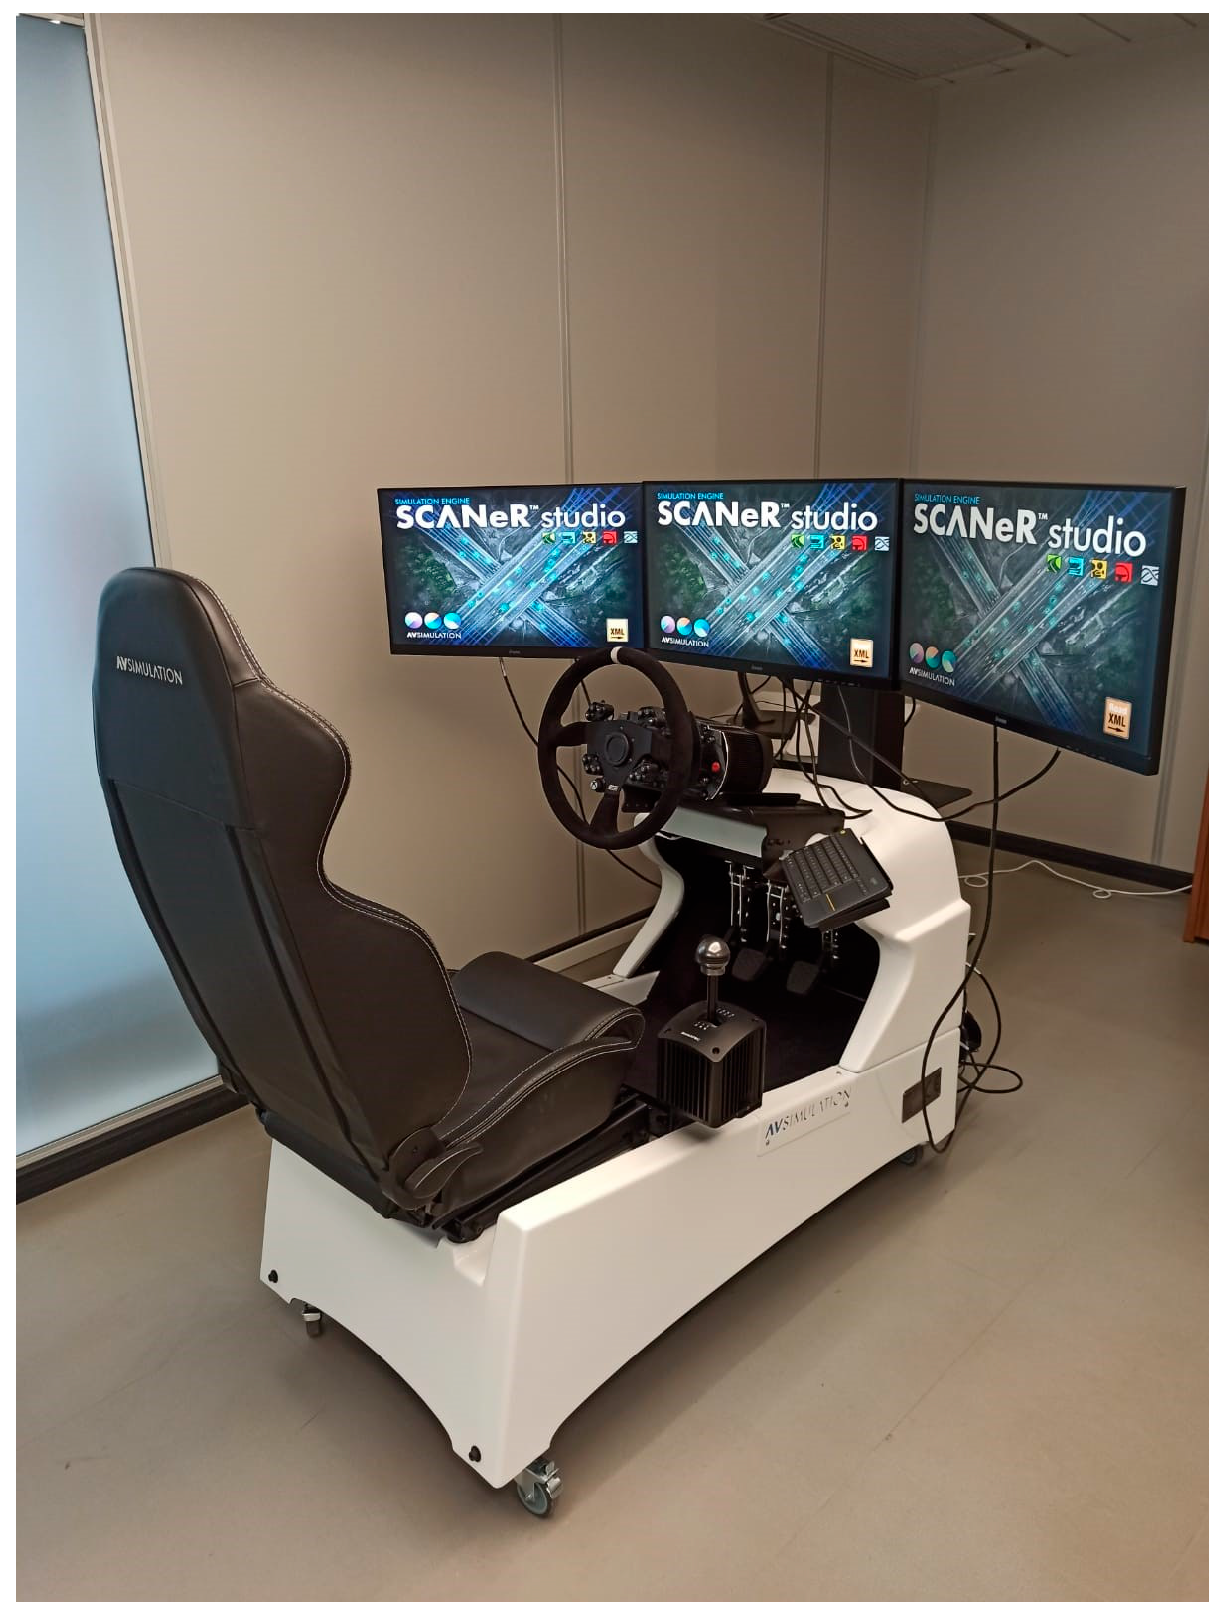
The experiments were carried out using the SimEASY® driving simulator produced by AVSimulation and available at the Road Infrastructure Laboratory of the University of Messina (Figure 2).
The SCANeR® Studio 2021.1 software allowed the authors to fully edit the alignment, the dynamic management of the vehicle, the inclusion of road components, as well as the scripting function, with which the events were included in the driving scenario. This feature was also used to code the OBU described below.
As expected, two scenarios were evaluated in the simulated context: traditional driving (control) and smart driving. The two conditions differ only in terms of the OBU, which is not included in the former.
Specifically, the OBU was defined and customized by initially creating an ad hoc script to display several visual warnings while driving along the route and/or in case of incorrect driving behavior. It was displayed as a rectangular graphical element on the right side of the simulator’s main screen, approximately corresponding to the center console area in a real vehicle. This position was chosen as a compromise between visibility and minimizing obstruction of the forward road view, aligning with common practices for in-vehicle infotainment systems. The dimensions of the OBU frame were 15 cm × 10 cm (subtending a visual angle of approximately 10° × 5° from the driver’s viewpoint). The individual icons within each frame had a size of approximately 4 cm × 4 cm (~2° visual angle). The specific thresholds used for triggering alerts were speeding (>50 km/h in a work zone, >90 km/h elsewhere), excessive accelerator pedal depression (>90% of full range), and lane departure (>0.5 m over the lane marking).
Other specifications of the OBU and its visual warnings are:
  • In the absence of any route criticism or incorrect behavior, the OBU screen remains blank (white).
  • Otherwise, a number of messages are displayed on the screen. These remain valid until the criticism is over.
Obviously, the synchronous appearance of several feedback (active for a long time) indicates a less than virtuous performance by the driver. To improve the driver’s perception, the OBU has been divided into 4 frames, as shown in Figure 3.
Frames 1, 2, and 3 show feedback related to incorrect and/or dangerous behavior. They are displayed until the activities are corrected. In particular, symbols and signs in these frames are displayed when
  • Frame 1: The vehicle speed exceeds the legal limit.
  • Frame 2: The accelerator pedal is depressed excessively.
  • Frame 3: The vehicle is drifting out of the lane.
  • Frame 4, on the other hand, is designed to provide some informative feedback on specific driving errors. Unlike the former, the latter disappears after a fixed time.
The relationship between alignment and driving behavior generates warnings that appear not only at specific locations on the road, but also in potentially dangerous driving situations. Regardless of whether the experimental results are critical, the analyst should act specifically on the target location to improve the driver’s response or at least his mental workload.
By defining a suitable script, it is possible to customize the appearance of these warnings in terms of:
  • The time of appearance of each warning with reference to the critical element of the alignment.
  • The duration of the warning (in seconds).
  • Threshold values of the variables beyond which the alert is provided.
  • Optimal positioning of the single alert or the whole OBU on the screen (driver’s field of view).
  • Size of the single warning or of the OBU.
  • Possibility to switch between textual warnings and alert icons.
  • Possibility to integrate (or replace) the visual warning with audible feedback.
The Tobii Glasses® eye tracker, which provides information on eye movements in terms of fixations and saccades [31], was used to capture the visual behavior of the drivers. It is a wearable eye-tracking system equipped with a high-definition scene camera (1920 × 1080 px at 25 fps), stereo microphones, eye-tracking sensors, and infrared illuminators to record user gaze and environmental audio and video. The device offered about 2 degrees of accuracy under normal conditions, but it would degrade at the periphery of the field of view.

2.3. Sample Users’ Definition

The driving tests involved 21 users aged between 22 and 29 years old, specifically selected to form a homogeneous sample in terms of age, number of years driving license held, presence of mild visual impairment such as myopia (less than two diopters), number of accidents experienced, and possible car sickness recorded after the activity of driving to the simulator. This research complied with the American Psychological Association Code of Ethics and informed consent was obtained from each participant. Table 1 shows the main results of the surveys; the standard deviation shows a good consistency of the sample.
The calculation of the sample size should be based on considerations of variance and the size of the confidence level, which is generally assumed to be 95%. Given the good homogeneity of the selected drivers (see Table 1), the sample size was calculated as a function of the desired precision P and the expected frequency F using Equation (1).
n = 1.96 2 · F ( 1 F ) P 2 = 18
In this study, the expected frequency F was set at 5% and the absolute precision P at 10%, obtaining a minimum number of 18, lower than the actual sample size, equal to 21.
While a larger sample size is always desirable, the “a priori” calculation, combined with the homogeneity of the sample and the significant results obtained, supports the statistical validity of the findings within the scope of this controlled simulator study.

2.4. Experimental Procedure

The experimental procedure required different phases, each of which occupied each user for about 30 min. The phases are listed below:
  • Introduction to the experiments (2 min): each participant was given some preliminary information about the experiments.
  • Calibration of the eye tracker (5 min), which was necessary to obtain sufficient accuracy in tracking eye movements.
  • Driving practice (3 min): before the actual tests, each driver performed a practice drive along a section different from the test alignment in order to become familiar with the driving instruments (wheel, pedals, gears), lane change, brake and accelerator modulation.
  • Driving under “control” conditions (5 min).
  • Driving in “smart” conditions (5 min).
The time for each phase is approximate but represents a good estimate of the actual time spent by the user sample.

2.5. Measures and Indicators

For the purposes of this research, several variables representative of the drivers’ visual behavior were identified. The raw data (fixations and saccades) were extracted from the movies recorded by the Tobii glasses worn by the drivers while driving.
Fixations to vertical signage were considered in the first driving condition (control), while the OBU warning was considered in the second (smart). Warnings related to infrastructure (e.g., roadworks, curves, speed limits) were displayed on the OBU for a fixed duration of 5 s as the driver approached the relevant element, ensuring a comparable time window for perception as provided by traditional signage.
The measures performed are listed below: (a) Total number of fixations and average fixation time (s). (b) Maximum time per fixation (s). (c) Number of missed signals.
To maximize the comprehensiveness of the study, these measurements were made both overall (without distinguishing the type of signal) and in relation to individual alarms. The information obtained was then processed using the technique of analysis of variance (one-way ANOVA) to determine how drivers were affected by the presence/absence of smart alerts and which of these was the most critical. In terms of the independent variable, the first step was to start with the Driving Condition and then consider the different signals reported within the OBU:
  • Driving Condition (2 levels: Control and Smart).
  • On-board warning (7 levels: Roadworks, Speed Limit 50, Speed Limit 90, End of Roadworks, Dangerous Corner, Excess CO2, Lane Departure).
  • The response variable (or dependent variable DV) is always represented by the following alternative values:
  • Number of fixations.
  • Average duration of a single fixation.
  • Maximum duration of a single fixation.
  • Number of unseen traffic signs.
The reliability of the results depends on the fulfilment of the basic assumptions of the ANOVA analysis. In this case, the assumptions are referred to:
  • The dependent variable must be measured at the continuous level.
  • The within-subjects factors (i.e., the independent variables) should consist of at least two related groups, indicating that the same subjects are present in all groups.
In this case, they were divided into 2 levels for driving conditions and 7 levels for onboard warning.
  • The observations are independent, with no relationship between the observations in each group.
  • No significant outliers.
  • Normal tests using residuals.
The following pairs of null or alternative hypotheses are to be tested:
  • H0: The means of all driving conditions or on-board warnings are equal.
  • H1: The means of at least one driving condition or on-board warning group (Control or Smart) are different.

3. Results

The results obtained are derived from ANOVA and are presented in this section by means of a box-and-whiskers plot.

3.1. Total Number of Fixations and Average Fixation Time

The total number of fixations and the average fixation time were measured with respect to:
  • The vertical sign (the only “information” element in the control condition) during the first trials.
  • The same signal displayed on the OBU during the second experiment (smart condition).
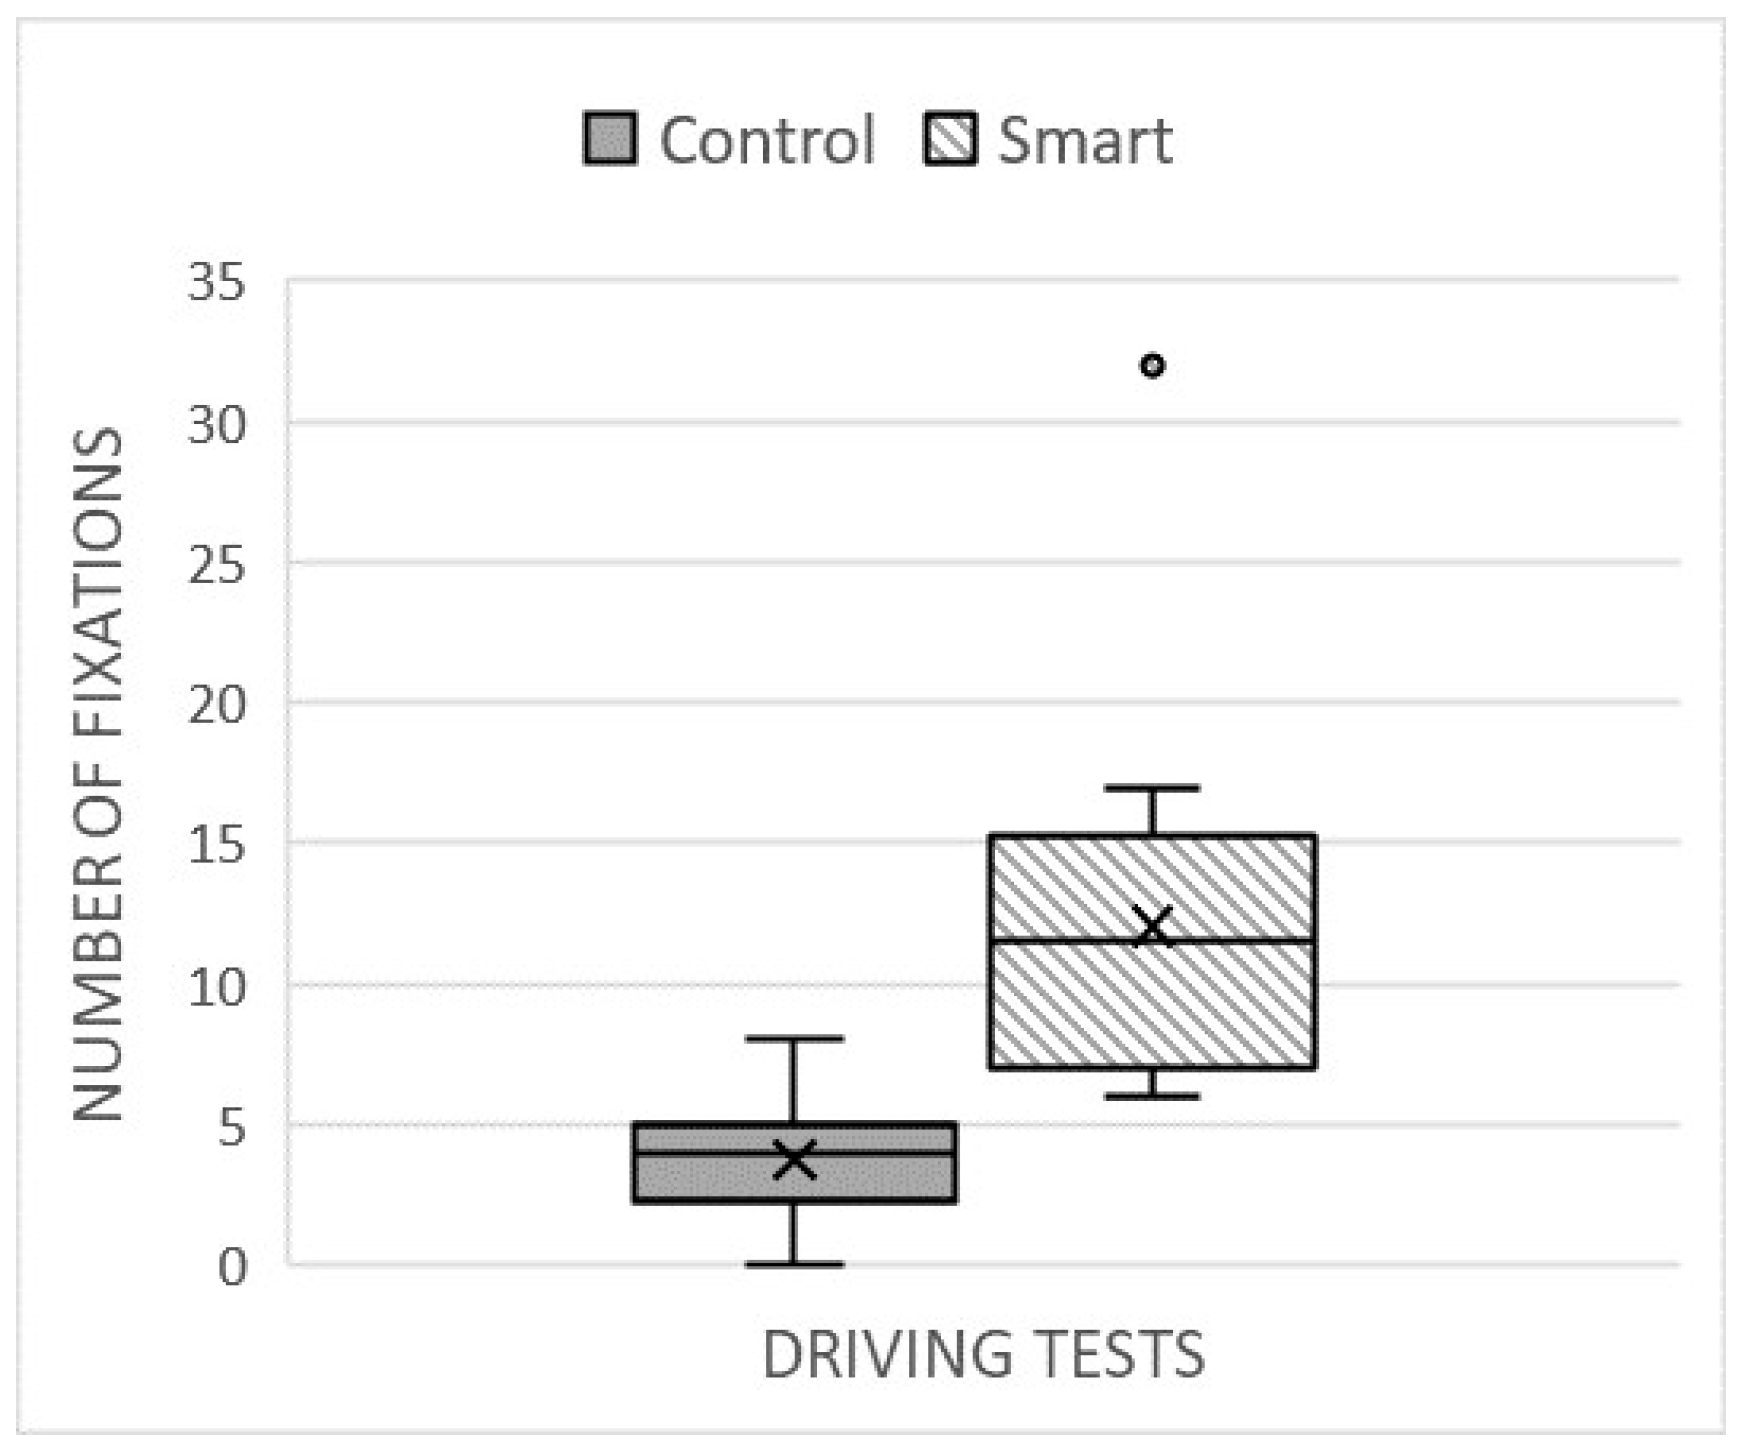
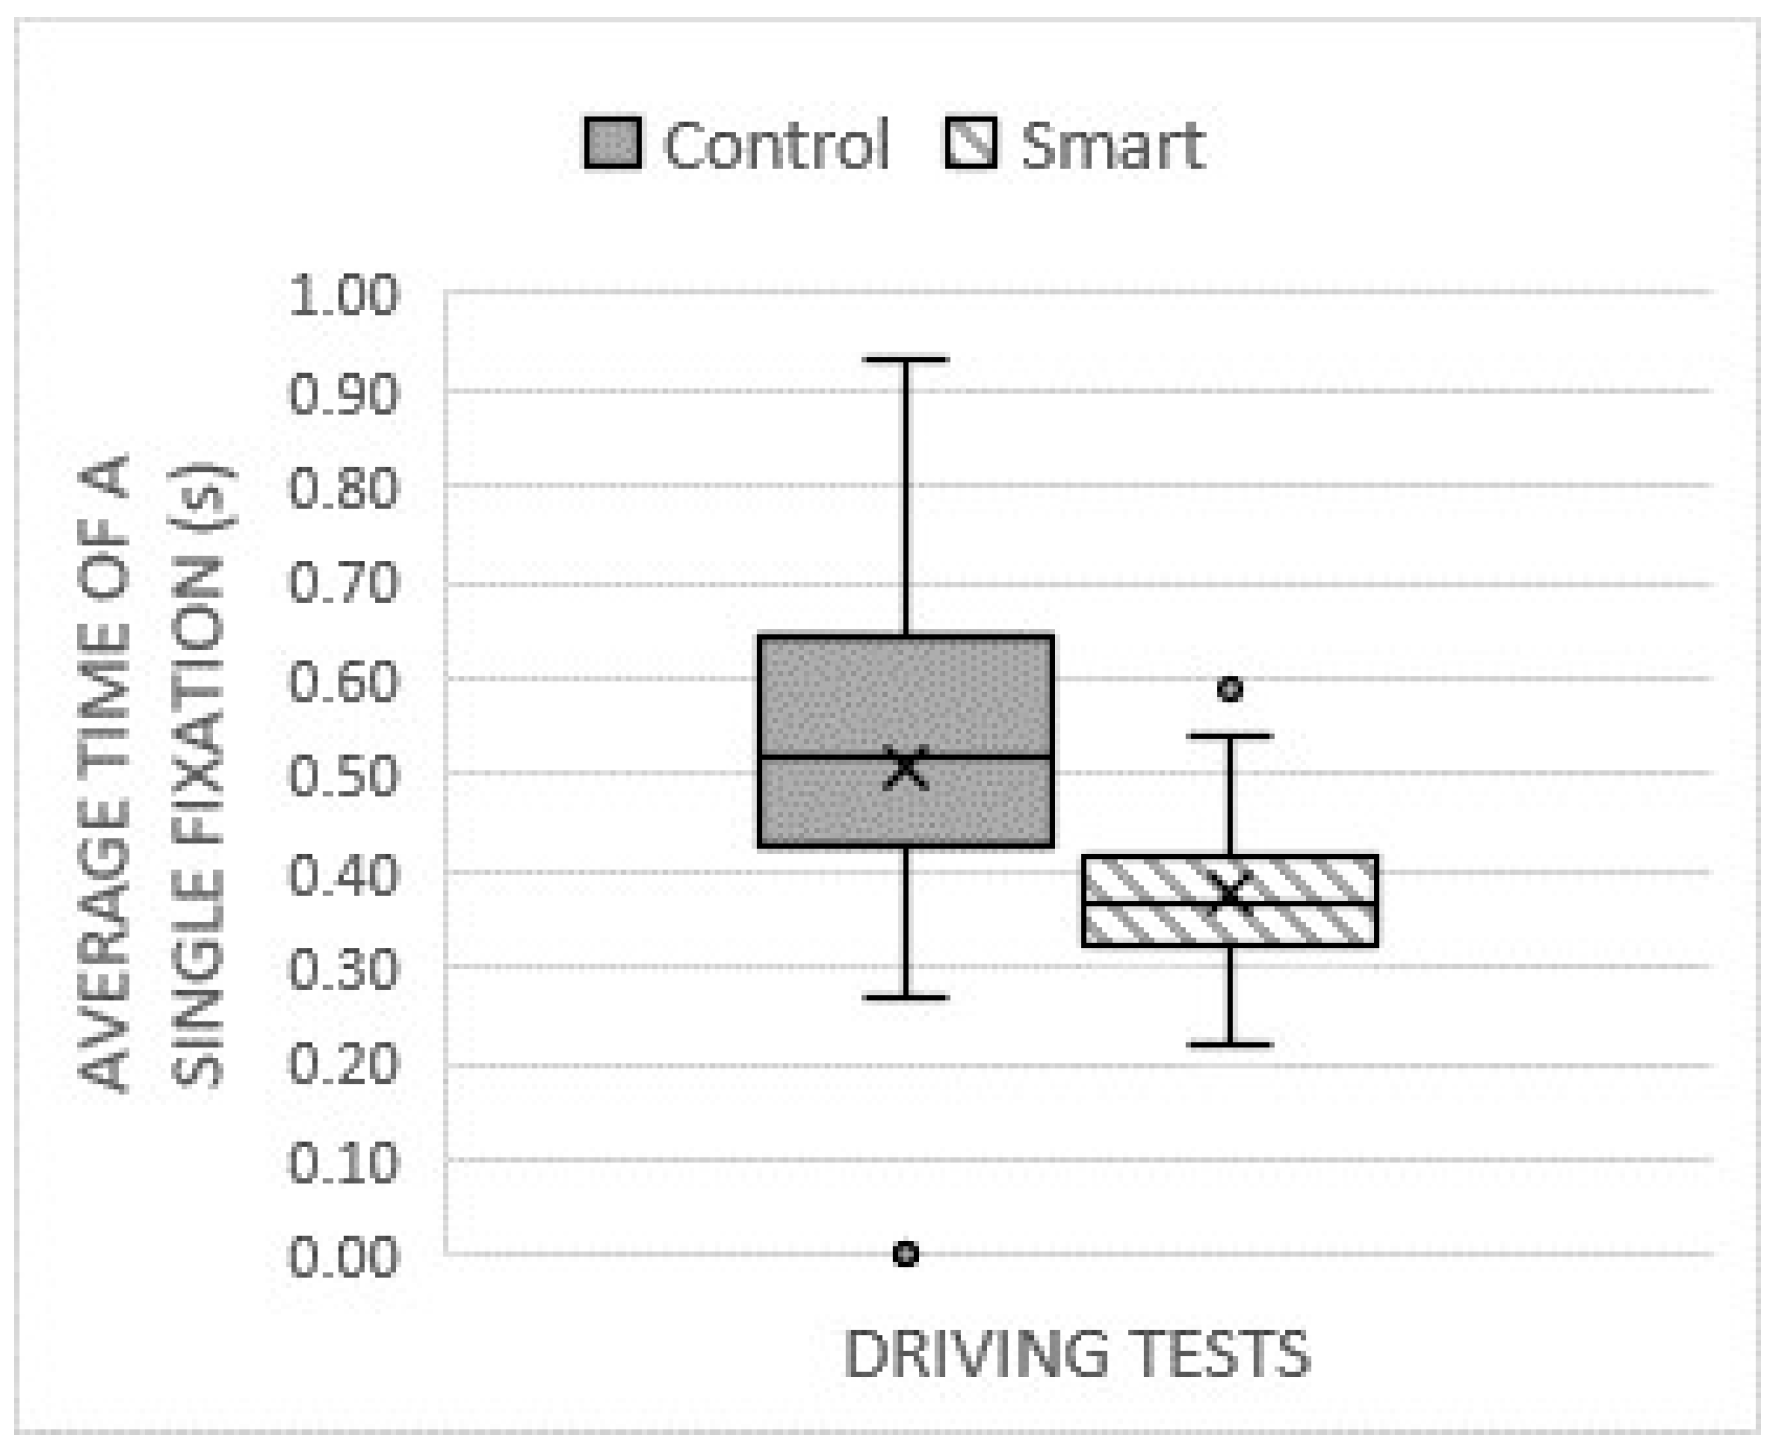
Both for the total number of fixations (F (1,38) = 34.60, p < 0.05) and the average time for fixation (F (1,38) = 6.85, p < 0.05), significant variations passing from the “control” to the smart condition appeared. The results are provided in Figure 4 and Figure 5.

3.2. Maximum Time per Fixation

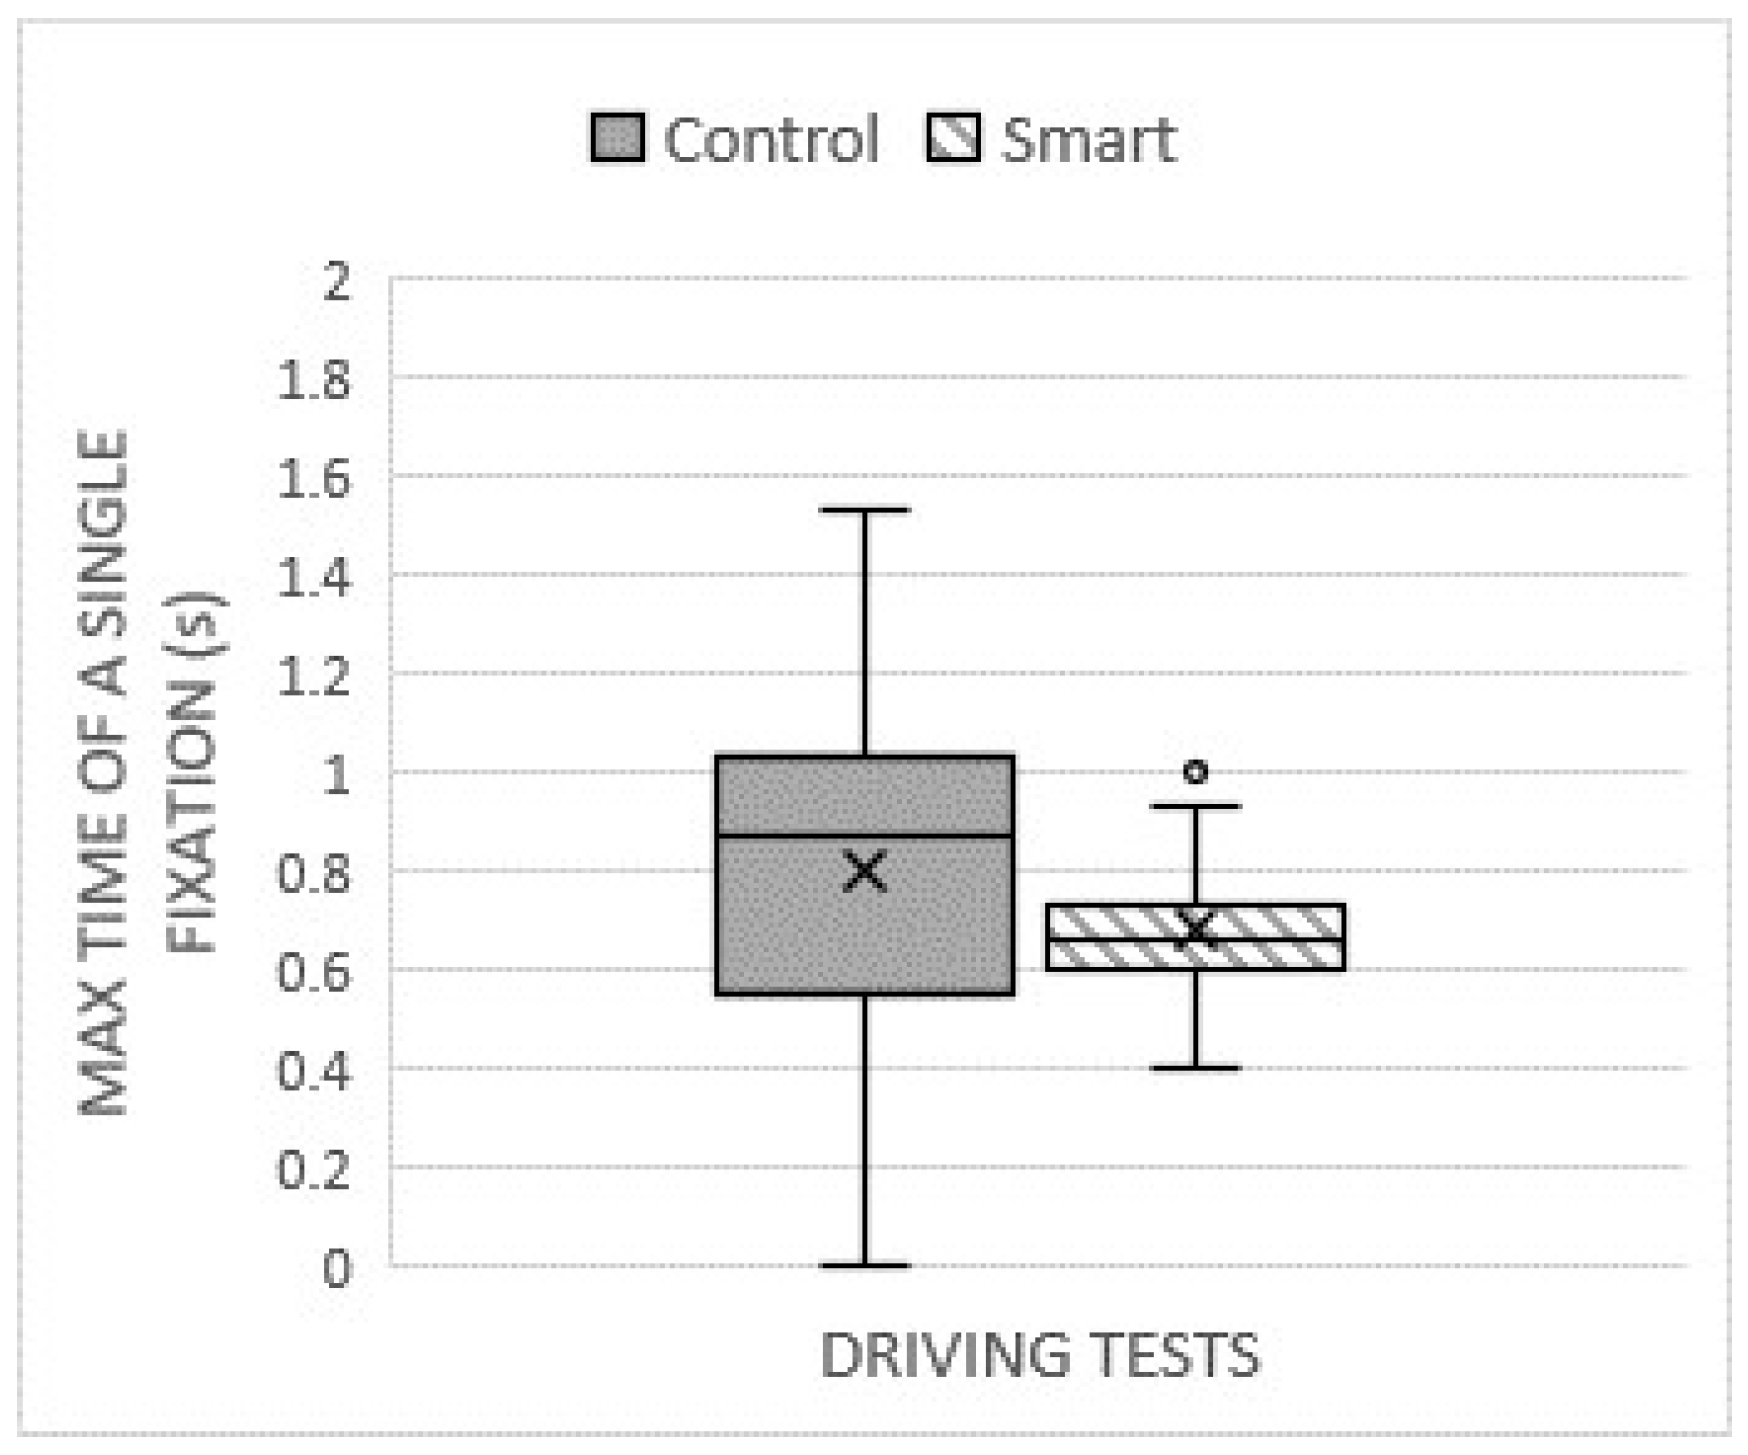
For each driver, the maximum time for the single fixation to the vertical signage, respectively, in control and smart conditions was measured. In this case, relevant variations between the two conditions do not emerge (F (1,38) = 1.57, p = 0.217), and in both scenarios, there were no fixations for longer than 2 s. The times measured in the two driving scenarios are shown in Figure 6.

3.3. Number of Missed Signals

While driving, both in control and smart conditions, the drivers should have found some information, though in different ways, from signage. Generally, the vertical signals, during traditional driving, are not always perceived by the drivers. Even in this case, significant variations (F (1,38) = 33.63, p < 0.05) were measured passing from the control to the smart condition. The results are shown in Figure 7.

3.4. Specific Intake of the Single OBU Warnings

To enrich the analysis, a further investigation was carried out on the intake of each signal (on the OBU) on the driving performance, through measurements in terms of:
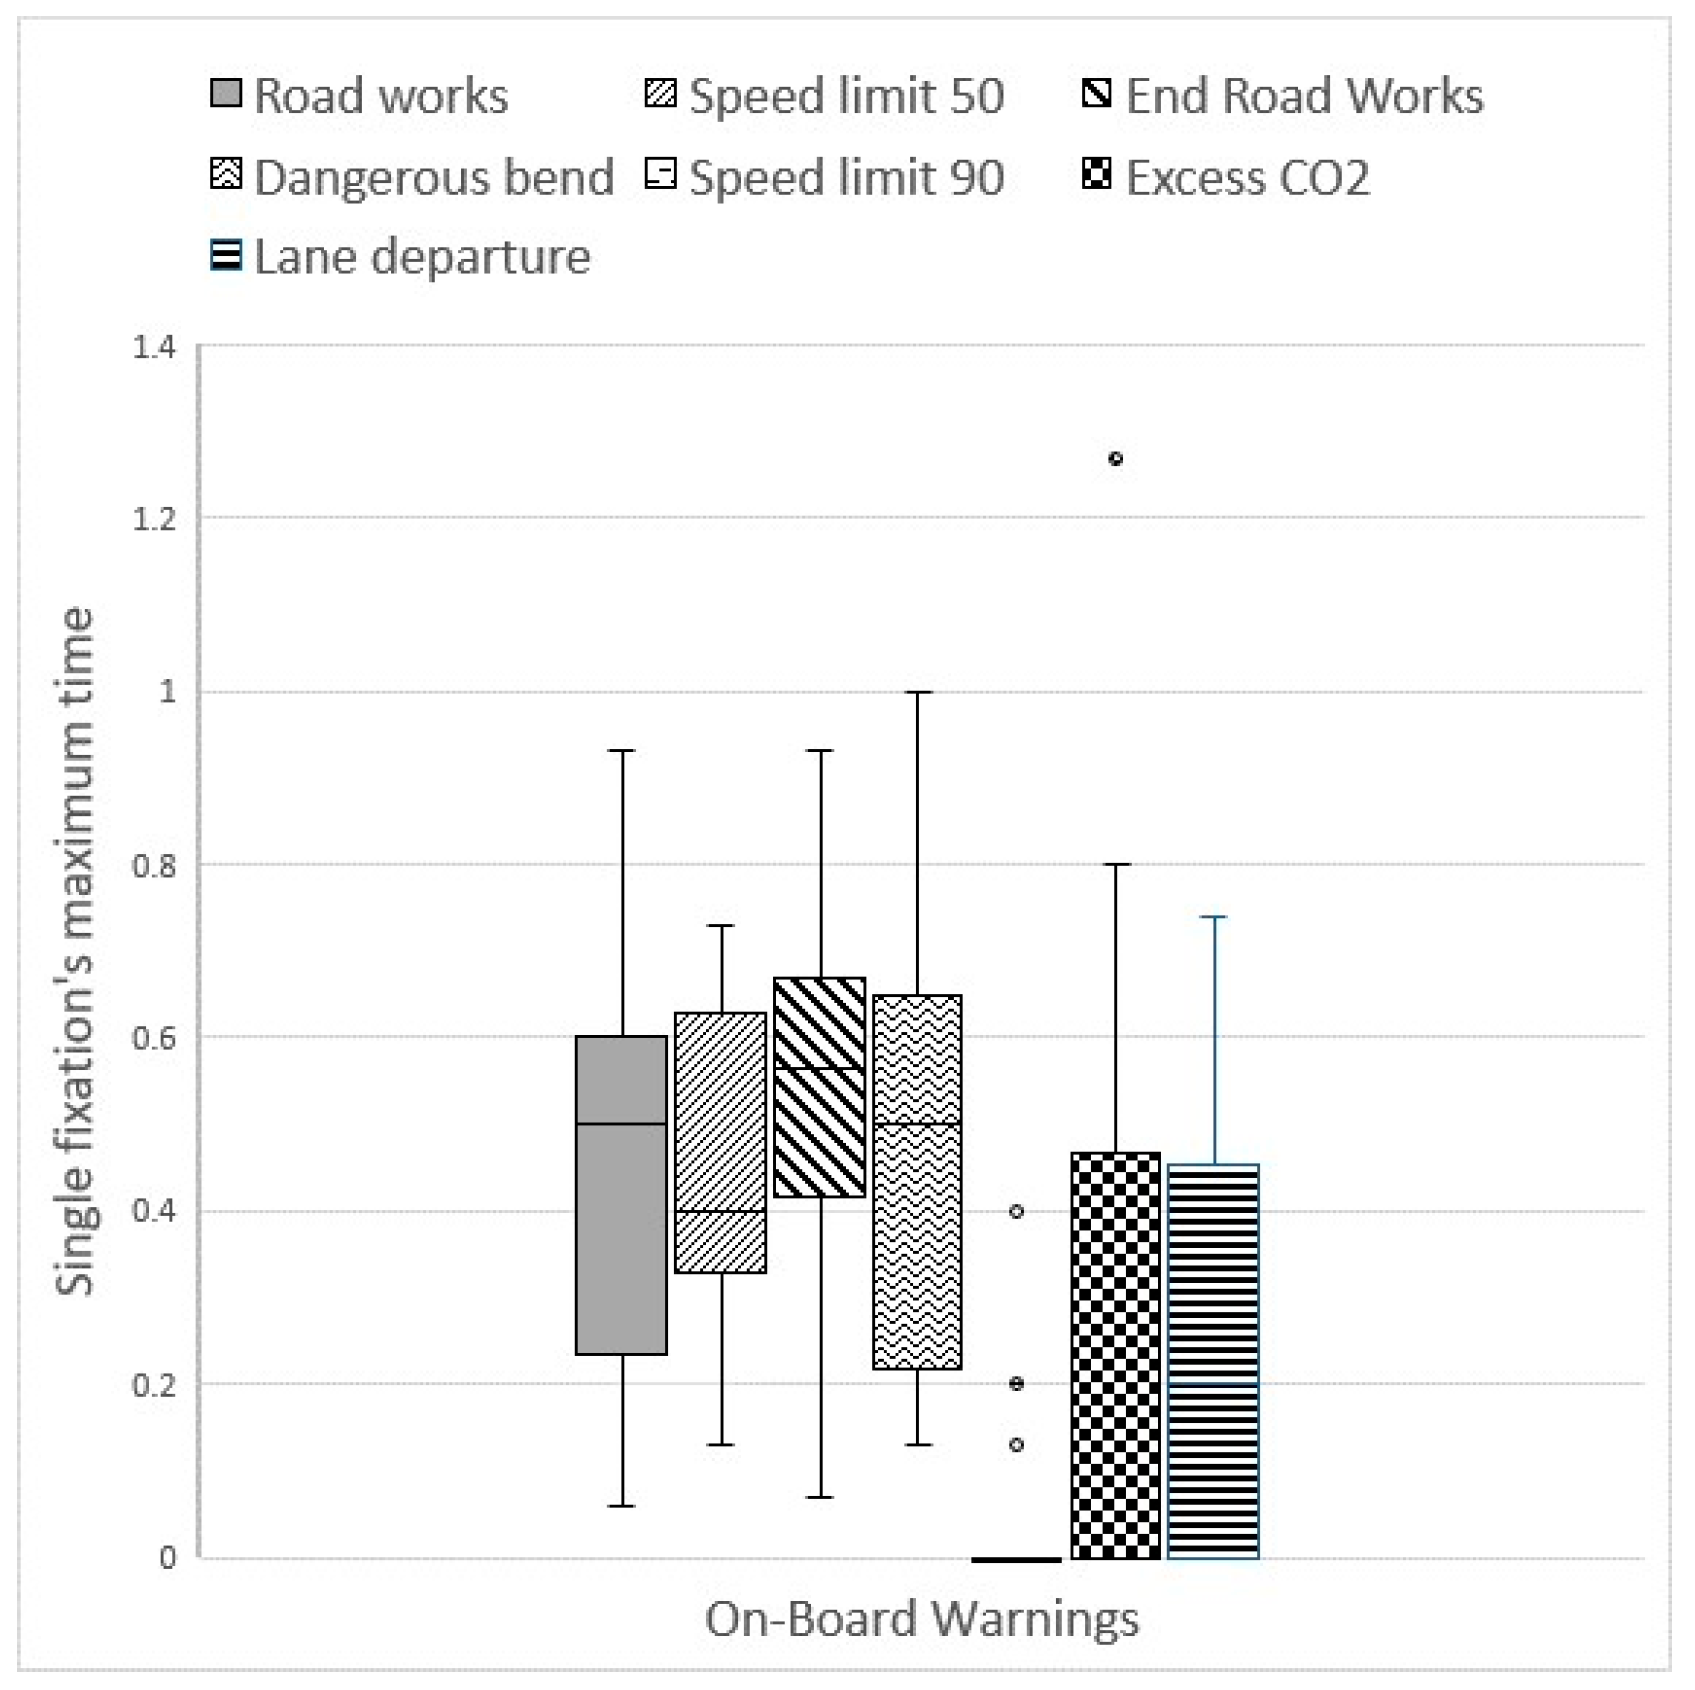
The results derived lead to assessing that, for each measurement, the single signals have different effects on the driver’s visual behavior. According to the ANOVA, there is a significant difference in the visual strategies for the number of fixations of some signals (F(139,6) = 10.33, p < 0.05), the average time per fixation (F(139,6) = 13.57, p < 0.05) and the maximum time per fixation (F(139,6) = 10.11, p < 0.05).
For more clarity, in Table 2 there is a summary of the average values of the three Dependent Variables with respect to the road characteristics.
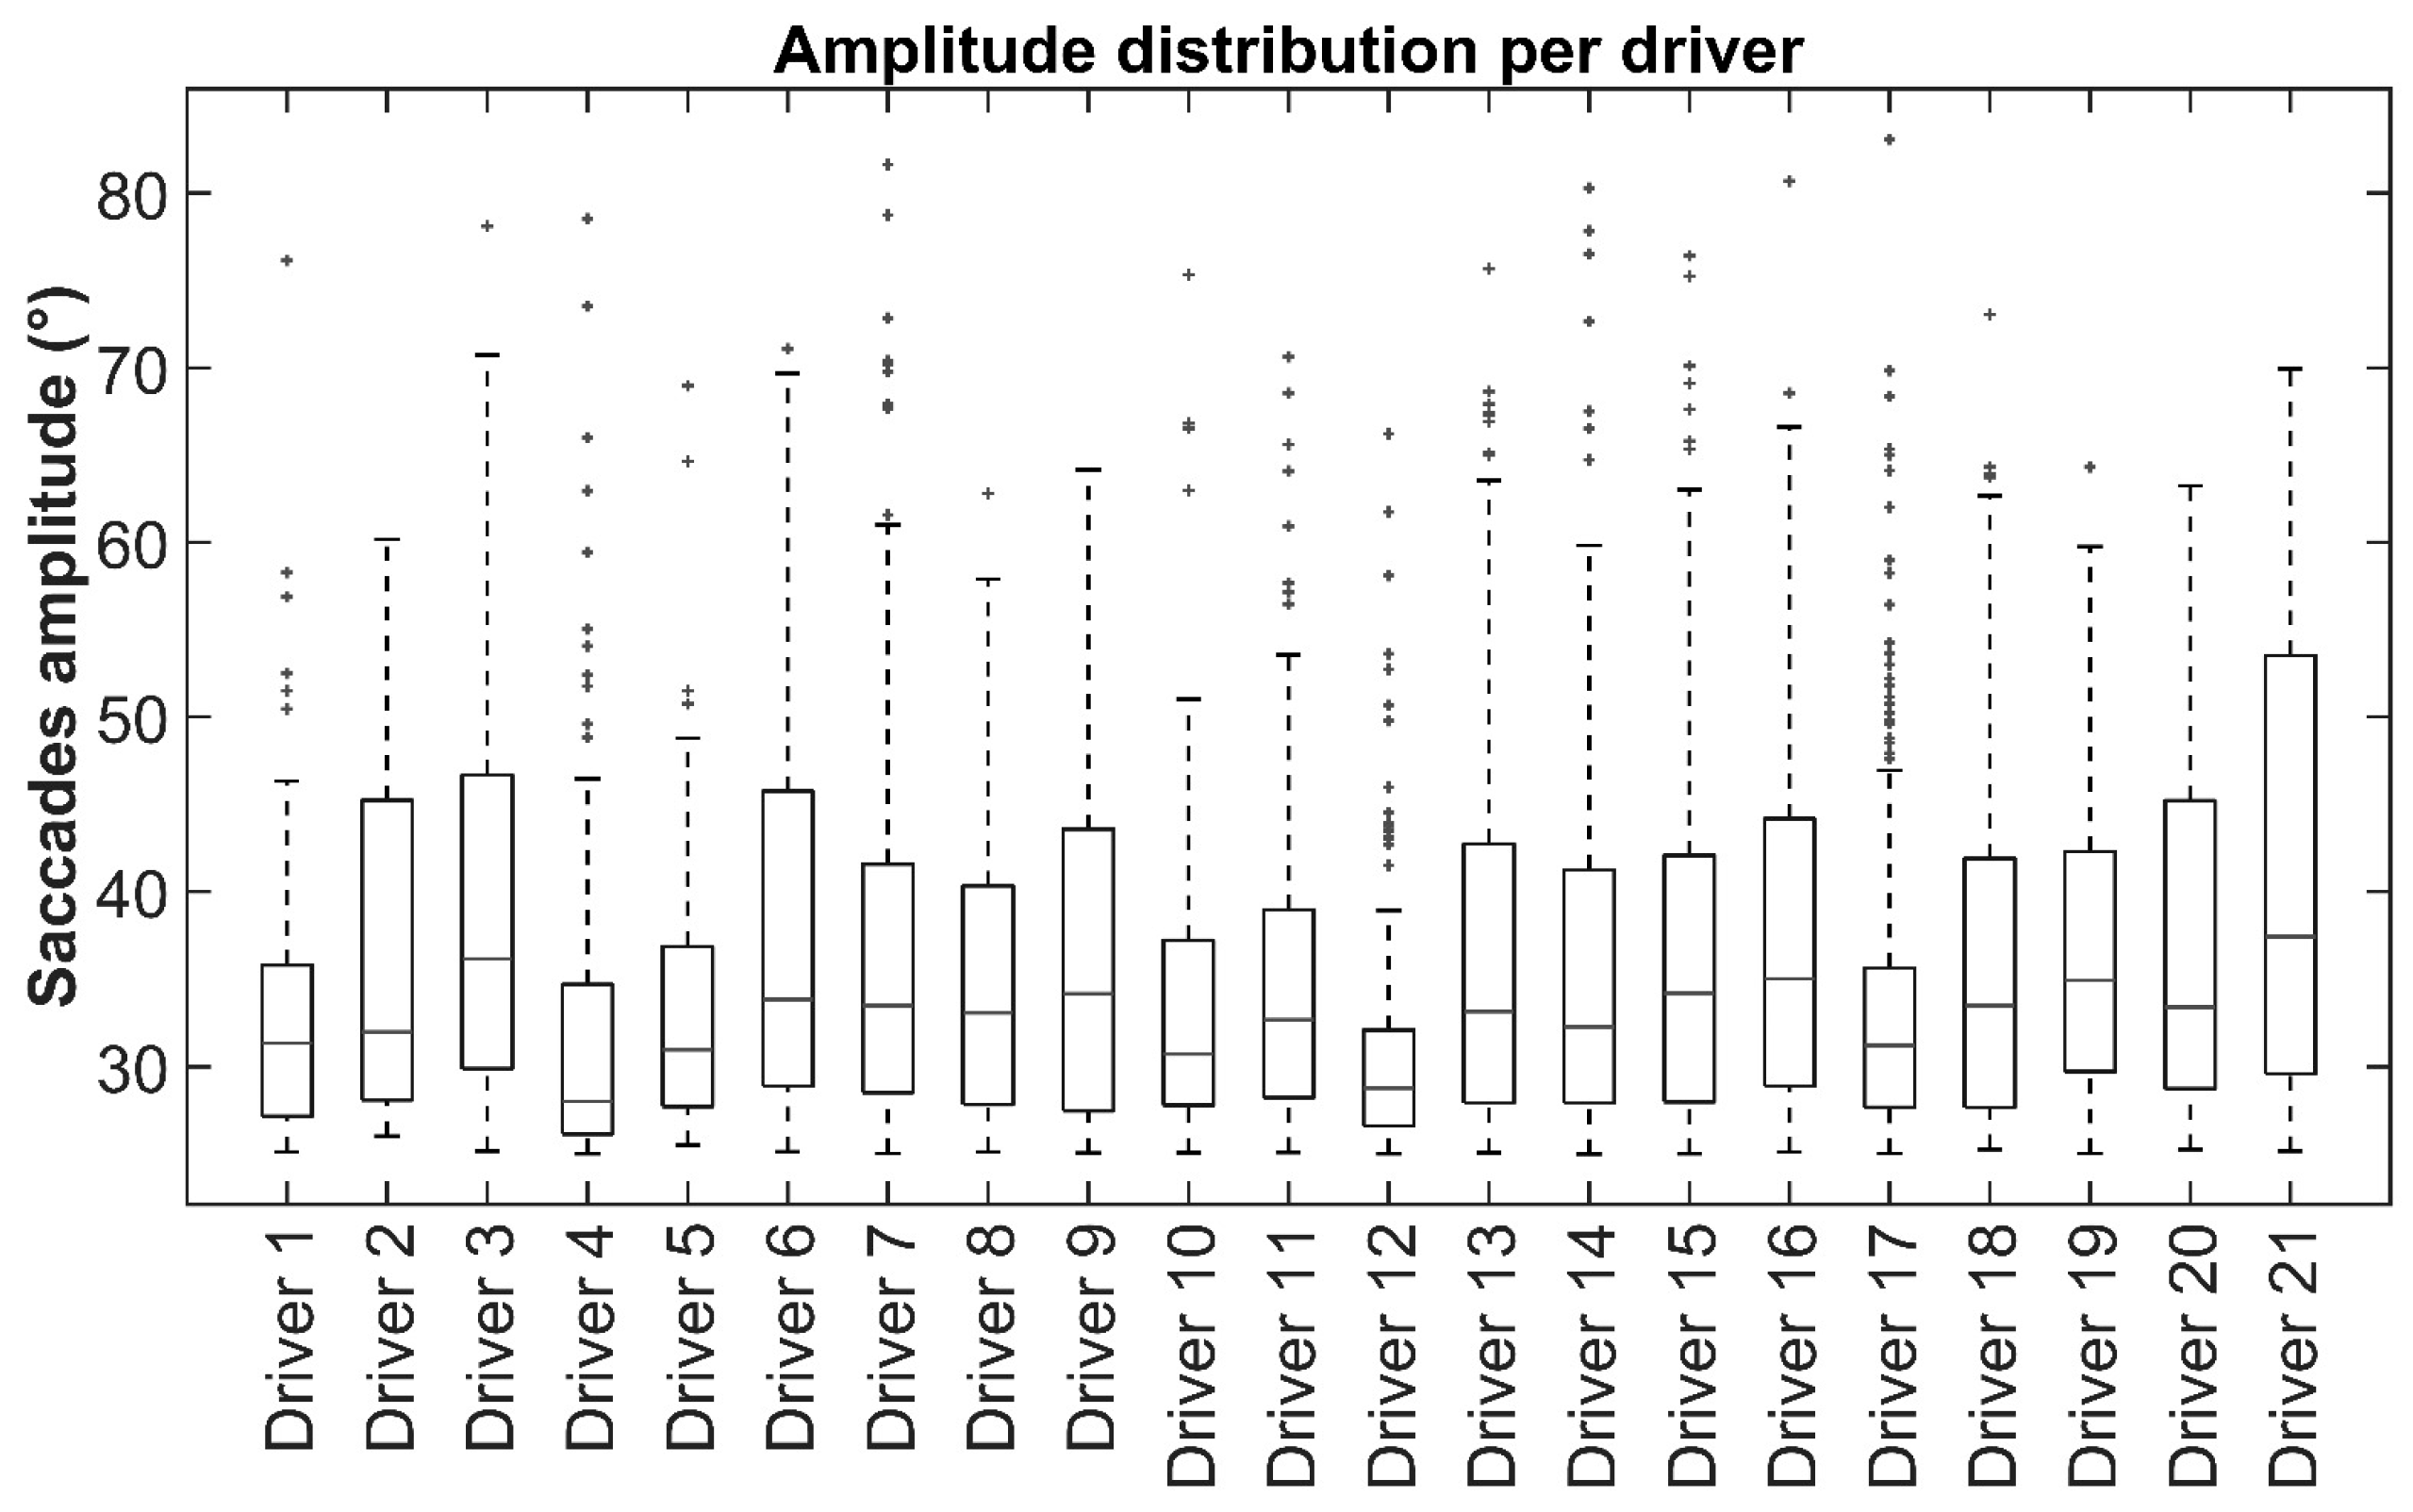
The experiment yielded data on saccades, defined as rapid eye movements that enable the sequential acquisition of visual information. The amplitude of a saccade, measured in degrees, indicates the extent to which the driver searches for targets within the visual field. The highest values recorded during the experiment demonstrate a shift of fixations from the road to distant points in the visual field, such as the OBU. Figure 11 reports the distribution of saccadic amplitudes across 21 drivers. The boxplots highlight substantial inter-individual variability, with median values ranging approximately between 30° and 45°. Several drivers (e.g., Driver 2, Driver 3, Driver 6, and Driver 21) exhibit wider interquartile ranges (IQR), suggesting more heterogeneous saccadic behavior within the same subject, whereas others (e.g., Driver 4, Driver 11, Driver 12, and Driver 17) show more compact distributions, indicative of more consistent oculomotor patterns. Outliers (+ in figure) are present for nearly all drivers, reaching values above 70° in some cases, which may reflect occasional large gaze shifts toward peripheral areas of the visual field.
Use of a one-way ANOVA for independent samples was a deliberate choice based on specific and more conservative statistical reasoning. The one-way ANOVA treats the data from the two conditions as if they came from independent groups. This approach inflates the error variance because it does not account for the within-subject correlation. Consequently, it makes it harder to find a statistically significant effect (i.e., it reduces statistical power) and represents a more stringent test.
Given that our results under this more conservative model yielded highly significant p-values (p < 0.05) for our primary variables, we concluded that the effect of the OBU was robust enough to be detected even when using the most cautious analytical approach. This provides a very strong and conservative level of confidence in our findings.
To formally confirm this and to address the reviewer’s valid concern directly, we have also conducted an RM-ANOVA. The results are presented below:
-
Total Number of Fixations: RM-ANOVA: F(1, 20) = 126.52, p < 0.001
-
Average Fixation Time: RM-ANOVA: F(1, 20) = 10.43, p = 0.015
-
Number of Missed Signals: RM-ANOVA: F(1, 20) = 76.025, p < 0.001
As expected, the p-values from the RM-ANOVA are even more significant than those obtained with the independent samples ANOVA (e.g., the F-value for Fixations increases from 34.60 to 126.52), confirming the strength of the observed effects.
Therefore, while RM-ANOVA is statistically more efficient, our initial use of a one-way ANOVA was a valid, albeit more conservative, strategy that nonetheless confirmed our hypotheses.

4. Discussion

The aim of this study was to identify possible criticisms of the introduction of an OBU by observing the driver’s eye movements. The main considerations are then presented on the basis of the results obtained. It is clarified that the comparison with similar data from literature is purely qualitative, since the different results depend on the specific equipment adopted and slight differences can produce very different results. Rather, if the results are unsatisfactory, some features of the OBU should be modified, such as the size of the screen, the visibility of the signal, the start and duration of the signal, the possible use of acoustic feedback, etc.
  • Total number of fixations and average time for fixation
The authors insisted on analyzing these two variables together, as a single analysis could lead to erroneous conclusions.
In particular, when moving from the control to the smart condition, there is generally a remarkable increase in the total number of fixations on objects of interest, i.e., road signs. The mean value for the control condition is 3.75, while in the smart condition it is 12.05. A general increase in this number due to an OBU device was also found by Kaber et al. [49]. However, in this study, this increase is accompanied by a contextual and significant reduction in the average time for a single fixation (0.509 s in the control conditions, 0.377 s in the smart conditions). According to Birrel & Fowkes [36], in this case, too, the introduction of an OBU does not seem to be a source of distraction for the driver, but rather a useful source of quickly acquired information.
These results could be considered positive for road safety. In fact, although the driver tends to look at the OBU more often than at traditional vertical signs, these fixations are quicker, and he is able to refocus quickly on the road. He can then avoid those corrective maneuvers that are often dangerous due to long fixation times off the road.
  • Maximum time per fixation
This measure was investigated to avoid possible criticism due to excessive fixation time. It did not appear in this study, as in both conditions no maximum fixation times longer than 2 s were detected, the threshold identified by NHTSA [38], beyond which there are serious dangers for the driver.
In this study, the maximum time per fixation was 1.53 s in the control condition and 1.00 s in the smart condition. Although there is no significant difference between the two scenarios, it can be concluded that the OBU system, as defined in this study, is far from the NHTS limit [38] and therefore does not represent a potential distraction for the driver. Other authors have also demonstrated that the presence of an OBU, if well designed, does not cause fixations longer than 2 s [36].
  • Number of missed signals
One of the main criticisms of drivers is that they do not pay attention to vertical signals. This affects the driver’s awareness and the decisions they make while driving. Recent scientific research has shown that the driver’s perception of road signs is reduced, despite their key role in safety. Johansson & Rumar [50] demonstrated that driver awareness of signage is often low. Several other studies have come to similar conclusions: Johansson & Backlund [51] verified that the percentage of acquired information respecting the available one from signage is between 25% and 75%, Milosevic & Gajic [52] between 2% and 20%; Shinar & Drory [53] showed values lower than 10% during the day and lower than 16.5% during the night; Macdonald & Hoffman [54] between 26% and 39% as a function of driving experience; Costa et al. [55], as well as Shoman et al. [56], report that only 25% of vertical signals are observed by drivers.
In this study, the experiments showed that the driver missed on average 1.95 (39%) of the 5 signals in the control condition scenario. This percentage seems rather low compared to literature values and probably depends on the experimental context—without particular distracting elements. However, in smart conditions, the driver does not miss any signal that appears on the screen when necessary. This aspect is noteworthy for three reasons:
  • Better awareness of the route and the limits imposed: the driver avoids losing information and can regulate himself in advance to react to possible dangers (lane restrictions, deviations, dangerous bends, etc.).
  • Permanent and uninterrupted: with respect to the control conditions, in the smart one, the information appears on the screen and remains active until the driver fully understands it (by correcting the incorrect driving behavior) or until this information requires attention.
  • Better economy: in smart conditions, when a problem related to a driver’s incorrect behavior occurs on a specific section of road, it would be sufficient for road managers to code the appearance of novel feedback to correct it through the road control system in a smart road environment. Conversely, in a traditional driving environment, they would have to plan the installation of novel signals—with the associated costs—but these cannot always warn the driver in real time of possible dangers (e.g., the sudden presence of a stationary vehicle on the road).
  • Specific intake of the single OBU warnings
For the purposes of this study, OBUs can be divided into two categories: warnings related to the external context and warnings related to driver misbehavior (Table 2). The main difference between these categories may be related to their cause. Indeed, while the former are due to an external factor (presence of the work site, dangers on the road, etc.), the latter are generated when incorrect driving behavior is detected and are maintained throughout their duration.
Based on the results obtained, it can be said that, in general, no warning caused any distraction to the driver. A higher number of fixations was measured on average for the speed limit warning, which was active for the entire length of the workspace, but the average time per fixation was particularly low, without causing any distraction to the driver.
Another particularly helpful warning was the ‘dangerous bend’ warning. The driver, who fixed the warning for an average of 0.44 s, drove around the low R bend with greater awareness of the condition control.
The signals in the second category were fixed less often and for less time than the first, simply because they stayed on the screen for less time. In fact, on average, the authors measured for each user that:
  • The speed limit warning (90 km/h) is activated 0.65 times and remains on the screen for 2.64 s before being corrected.
  • The CO2 emission warning is activated 1.45 times and remains for 1.10 s before being corrected.
  • The Lane Departure Warning is activated once and remains on the screen for 1.35 s before being corrected.
From these results, it can be concluded that the most frequent warning was the CO2 emission warning (evidence of non-continuous use of the accelerator), followed by the lane departure warning and the speed limit warning. Based on the active times, drivers quickly correct their incorrect behavior. On the other hand, the longest warning was the speed limit, followed by lane departure and the CO2 emission limit.
Even for this warning category, compared to a negligible impact in terms of distraction, it is possible to see a significant improvement in driving performance in a smart environment.
Regarding visual strategies, interpreting saccade amplitude is not central to the aims of this research phase, but it is a very interesting topic that deserves further investigation. Significant amplitudes indicate an effective scanning ability on the part of the driver, but this could lead to a certain degree of psychophysiological fatigue. Conversely, small amplitudes could indicate that the driver has a lower ability to acquire information from different positions in the visual field (e.g., from driving aids), but this would result in a lower workload. From a statistical perspective (Figure 11), the overlapping IQRs suggest that central tendencies are broadly comparable across drivers, but the differences in spread highlight individual differences in gaze allocation strategies. Larger amplitude distributions may be associated with a more exploratory visual scanning style, while narrower distributions point toward more restricted visual field coverage. These inter-individual differences are relevant for interpreting driver visual behavior, as they may reflect distinct attentional strategies or varying sensitivity to environmental stimuli.
The results are quite satisfactory, but they could be further improved by adjusting the timing and appearance of the warnings. These features should be calibrated according to the road geometry and the external context, as their excessive presence could have counterproductive effects on the driver’s workload. A primary limitation of this study is the demographic profile of the participant sample, which consisted exclusively of young drivers. While this homogeneity was useful for controlling variability in this initial experiment, it limits the generalizability of the results. Younger drivers may interact with in-vehicle technology differently than older, more experienced drivers, who might have different visual and cognitive capabilities. Future research must validate these findings across a wider range of ages and driving experiences. Furthermore, the simulated environment was intentionally designed to be visually sparse to isolate the effect of the OBU on visual behavior. While this strengthens the internal validity of the causal relationship, it reduces the ecological validity of the study. The visual load in a real-world setting, with its myriad distractions, would likely be higher and could alter the driver’s interaction with the OBU. Subsequent research should introduce controlled levels of visual complexity to assess the robustness of the OBU’s design under more demanding conditions. Lastly, this study focused specifically on the visual strategy of drivers. While this provides critical insights into distraction, it does not capture the ultimate impact on driving performance metrics, such as lateral control (e.g., steering entropy) or longitudinal control (e.g., speed variance). Future work will integrate these performance measures to form a complete picture of how the information from the OBU is translated into driving action.

5. Conclusions

The proposed system does not seem to give rise to any criticism regarding the visual distraction of the driver. The on-board messages inevitably attract the driver’s fixations, but they are more rapid than in the case of traditional signage observation.
Regarding the references presented previously, some new elements appear in this research:
  • A comparison between the condition of traditional driving and the condition of driving assisted by a suitable digital device, in extremely homogeneous conditions provided by the driving simulator.
  • The proposed procedure is not aimed at choosing between traditional and smart conditions, but at optimizing warning signals and possibly correcting specific elements of the road infrastructure.
  • The final results may concern not only the overall efficiency of the OBU, but also the refinement of a single considered signal.
  • There is no separate monitoring between the driver and the road, but the study focused on the way the former is influenced by the permanent or temporary conditions of the infrastructure.
This study has proposed a valid methodological approach for road managers who, in view of the digitalization of the road, will have to calibrate the information sent to the user during the journey by minimizing visual distraction and optimizing the information acquisition process.
The next steps of the research will focus on the influence of particularly insidious road geometries, in which the driver’s workload assumes very significant values, making the role of ADAS extremely relevant in one way or another.

Author Contributions

Conceptualization, methodology, software, validation, formal analysis, investigation, resources, data curation, writing—original draft preparation: G.B., S.M., O.P., G.S. and A.R. All authors have read and agreed to the published version of the manuscript.

Funding

This work was supported by the European Union (NextGeneration EU) through the MUR-PNRR project SAMOTHRACE (No. ECS00000022).

Institutional Review Board Statement

Not applicable to studies where the impact on humans is substantially absent.

Informed Consent Statement

Informed consent was obtained from all subjects involved in the study. The study was conducted in adherence to the principles set out in the Declaration of Helsinki and received approval from the Ethics Committee of Messina “AOU G. Martino”, with Deliberation number 786, dated 16 May 2024.

Data Availability Statement

Due to the proprietary nature of the dataset, the raw data supporting this research cannot be shared.

Conflicts of Interest

The authors declare no conflicts of interest.

References

  1. Jazayeri, A.; Martinez, J.R.B.; Loeb, H.S.; Yang, C.C. The Impact of driver distraction and secondary tasks with and without other co-occurring driving behaviors on the level of road traffic crashes. Accid. Anal. Prev. 2021, 153, 106010. [Google Scholar] [CrossRef] [PubMed]
  2. Bowden, V.K.; Loft, S.; Wilson, M.D.; Howard, J.; Visser, T.A.W. The long road home from distraction: Investigating the time-course of distraction recovery in driving. Accid. Anal. Prev. 2019, 124, 23–32. [Google Scholar] [CrossRef]
  3. Lansdown, T.C.; Kovanda, E.J.; Spence, L. Student driver propensity to engage with distractions—A self-report survey. Transp. Res. Part F Traffic Psychol. Behav. 2021, 81, 650–660. [Google Scholar] [CrossRef]
  4. NHTSA. Distracted Driving in Fatal Crashes, 2017; DOT HS 812 700; NHTSA’s National Center for Statistics and Analysis: Washington, DC, USA, 2019.
  5. NHTSA. Distracted Driving 2020; DOT HS 813 309; NHTSA’s National Center for Statistics and Analysis: Washington, DC, USA, 2022. Available online: https://www.nhtsa.gov/risky-driving/distracted-driving (accessed on 1 July 2025).
  6. Klauer, S.; Dingus, D.; Neale, T.; Sudweeks, J.; Ramset, D. The Impact of Driver Inattention on Near-Crash/Crash Risk: An Analysis Using the 100-Car Naturalistic Study Data; DOT HS 810 594; National Highway Traffic Safety Administration (NHTSA): Washington, DC, USA, 2006. [Google Scholar]
  7. Lee, J.D. Technology and Teen Drivers. J. Saf. Res. 2007, 38, 203–213. [Google Scholar] [CrossRef] [PubMed]
  8. Stutts, J.; Reinfurt, D.; Staplin, L.; Rodgman, E. The Role of Driver Distraction in Traffic Crashes; University of North Carolina Highway Safety Research Center: Chapell Hill, NC, USA, 2001. [Google Scholar]
  9. Ali, Y.; Sharma, A.; Haque, M.M.; Zheng, Z.; Saifuzzaman, M. The impact of the connected environment on driving behavior and safety: A driving simulator study. Accid. Anal. Prev. 2020, 144, 105643. [Google Scholar] [CrossRef]
  10. Fernández-Isabel, A.; Fuentes-Fernández, R.; de Diego, I.M. Modeling multi-agent systems to simulate sensor-based Smart Roads. Simul. Model. Pract. Theory 2020, 99, 101994. [Google Scholar] [CrossRef]
  11. Birrell, S.; Young, M. The impact of smart driving aids on driving performance and driver distraction. Transp. Res. Part F Traffic Psychol. Behav. 2011, 14, 484–493. [Google Scholar] [CrossRef]
  12. Ma, J.; Gong, Z.; Tan, J.; Zhang, Q.; Zuo, Y. Assessing the driving distraction effect of vehicle HMI displays using data mining techniques. Transp. Res. Part F Traffic Psychol. Behav. 2020, 69, 235–250. [Google Scholar] [CrossRef]
  13. Pellegrino, O. An analysis of the effect of roadway design on driver’s workload. Balt. J. Road Bridg. Eng. 2009, 4, 45–53. [Google Scholar] [CrossRef]
  14. Pellegrino, O. Prediction of driver’s workload by means of fuzzy techniques. Balt. J. Road Bridg. Eng. 2012, 7, 120–128. [Google Scholar] [CrossRef]
  15. Bosurgi, G.; D’Andrea, A.; Pellegrino, O. What variables affect to a greater extent the driver’s vision while driving? Transport 2013, 28, 331–340. [Google Scholar] [CrossRef]
  16. Kircher, K.; Fors, C.; Ahlstrom, C. Continuous versus intermittent presentation of visual eco-driving advice. Transp. Res. Part F Traffic Psychol. Behav. 2014, 24, 27–38. [Google Scholar] [CrossRef]
  17. Bosurgi, G.; D’Andrea, A.; Pellegrino, O. Prediction of Drivers’ Visual Strategy Using an Analytical Model. J. Transp. Saf. Secur. 2015, 7, 153–173. [Google Scholar] [CrossRef]
  18. Bongiorno, N.; Bosurgi, G.; Pellegrino, O.; Sollazzo, G. Analysis of Different Visual Strategies of ‘Isolated Vehicle’ and ‘Disturbed Vehicle’. Transport 2017, 33, 853–860. [Google Scholar] [CrossRef]
  19. Risteska, M.; Kanaan, D.; Donmez, B.; Chen, H.Y.W. The effect of driving demands on distraction engagement and glance behaviors: Results from naturalistic data. Saf. Sci. 2021, 136, 105123. [Google Scholar] [CrossRef]
  20. Dumitru, A.I.; Girbacia, T.; Boboc, R.G.; Postelnicu, C.C.; Mogan, G.L. Effects of smartphone based advanced driver assistance system on distracted driving behavior: A simulator study. Comput. Hum. Behav. 2018, 83, 1–7. [Google Scholar] [CrossRef]
  21. Gazder, U.; Al-Malki, Y.; Alam, M.S. Risk of Using Smart Devices for Drivers. In proceeding of 2nd Smart Cities Symposium; Univerisity of Bahrain, Zallaq, Bahrain, 24–26 March 2019. [Google Scholar]
  22. Zhang, S.; Zhao, C.; Zhang, Z.; Lv, Y. Driving simulator validation studies: A systematic review. Simul. Model. Pr. Theory 2025, 138, 103020. [Google Scholar] [CrossRef]
  23. Underwood, G.; Crundall, D.; Chapman, P. Driving simulator validation with hazard perception. Transp. Res. Part F Traffic Psychol. Behav. 2011, 14, 435–446. [Google Scholar] [CrossRef]
  24. Hussain, Q.; Alhajyaseen, W.K.M.; Pirdavani, A.; Reinolsmann, N.; Brijs, K.; Brijs, T. Speed perception and actual speed in a driving simulator and real-world: A validation study. Transp. Res. Part F Traffic Psychol. Behav. 2019, 62, 637–650. [Google Scholar] [CrossRef]
  25. Himmels, C.; Venrooij, J.; Parduzi, A.; Peller, M.; Riener, A. The bigger the better? Investigating the effects of driving simulator fidelity on driving behavior and perception. Transp. Res. Part F Traffic Psychol. Behav. 2024, 101, 250–266. [Google Scholar] [CrossRef]
  26. Wang, C.; Ren, W.; Xu, C.; Zheng, N.; Peng, C.; Tong, H. Exploring the Impact of Conditionally Automated Driving Vehicles Transferring Control to Human Drivers on the Stability of Heterogeneous Traffic Flow. IEEE Trans. Intell. Veh. 2025, 10, 912–928. [Google Scholar] [CrossRef]
  27. D’Addario, P.; Donmez, B. The effect of cognitive distraction on perception-response time to unexpected abrupt and gradually onset roadway hazards. Accid. Anal. Prev. 2019, 127, 177–185. [Google Scholar] [CrossRef]
  28. Chen, H.Y.W.; Hoekstra-Atwood, L.; Donmez, B. Voluntary- and involuntary distraction engagement: An exploratory study of individual differences. Hum. Factors 2018, 60, 575–588. [Google Scholar] [CrossRef]
  29. Engström, J.; Johansson, E.; Östlund, J. Effects of visual and cognitive load in real and simulated motorway driving. Transp. Res. Part F Traffic Psychol. Behav. 2005, 8, 97–120. [Google Scholar] [CrossRef]
  30. Boer, E.R.; Rakauskas, M.E.; Ward, N.J.; Goodrich, M.A. Steering entropy revisited. In Proceedings of the Third International Driving Symposium on Human Factors in Driver Assessment, Training and Vehicle Design, Rockport, Maine, 27–30 June 2005. [Google Scholar]
  31. Briggs, G.F.; Hole, G.J.; Land, M.F. Emotionally involving telephone conversations lead to driver error and visual tunnelling. Transp. Res. Part F Traffic Psychol. Behav. 2011, 14, 313–323. [Google Scholar] [CrossRef]
  32. Chen, H.; Chiuhsiang, J. The effects of various naturalistic conversations on driving performances during simulated driving. In Ergonomics for All: Celebrating PPCOE’s 20 Years of Excellence; Wang, A., Ed.; CRC Press: Kaohsiung, Taiwan, 2011. [Google Scholar]
  33. Horberry, T.; Anderson, J.; Regan, M.A.; Triggs, T.J.; Brown, J. Driver distraction: The effects of concurrent in-vehicle tasks, road environment complexity and age on driving performance. Accid. Anal. Prev. 2006, 38, 185–191. [Google Scholar] [CrossRef] [PubMed]
  34. Kuo, J.; Lenné, M.G.; Mulhall, M.; Sletten, T.; Anderson, C.; Howard, M.; Rajaratnam, S.; Magee, M.; Collins, A. Continuous monitoring of visual distraction and drowsiness in shift-workers during naturalistic driving. Saf. Sci. 2019, 119, 112–116. [Google Scholar] [CrossRef]
  35. Dingus, T.A.; Guo, F.; Lee, S.; Antin, J.F.; Perez, M.; Buchanan-King, M.; Hankey, J. Driver crash risk factors and prevalence evaluation using naturalistic driving data. Proc. Natl. Acad. Sci. USA 2016, 113, 2636–2641. [Google Scholar] [CrossRef]
  36. Angell, L.; Auflick, J.; Austria, P.; Kochhar, D.; Tijerina, L.; Biever, W.; Diptiman, T.; Hogsett, J.; Kiger, S. Driver Workload Metrics Project: Task 2 Final Report; DOT HS 810 635; Crash Avoidance Metrics Partnership (CAMP): Farmington Hills, MI, USA, 2006. [Google Scholar]
  37. Bosurgi, G.; Marra, S.; Pellegrino, O.; Villari, M. Drivers’ Workload Measures to Verify Functionality of Ferry Boats Boarding Area. Arch. Transp. 2020, 56, 7–17. [Google Scholar] [CrossRef]
  38. Gaspar, J.G.; Ward, N.; Neider, M.B.; Crowell, J.; Carbonari, R.; Kaczmarski, H.; Ringer, R.V.; Johnson, A.P.; Kramer, A.F.; Loschky, L.C. Measuring the useful field of view during simulated driving with gaze-contingent displays. Hum. Factors 2016, 58, 630–641. [Google Scholar] [CrossRef]
  39. Li, P.; Merat, N.; Zheng, Z.; Markkula, G.; Li, Y.; Wang, Y. Does cognitive distraction improve or degrade lane keeping performance? Analysis of time-to-line crossing safety margins. Transp. Res. Part F Traffic Psychol. Behav. 2018, 57, 48–58. [Google Scholar] [CrossRef]
  40. Simons-Morton, B.G.; Guo, F.; Klauer, S.G.; Ehsani, J.P.; Pradhan, A.K. Keep Your Eyes on the Road: Young Driver Crash Risk Increases According to Duration of Distraction. J. Adolesc. Health 2014, 54, S61–S67. [Google Scholar] [CrossRef]
  41. Birrel, S.; Fowkes, M. Glance behaviours when using an in-vehicle smart driving aid: A real-world, on-road driving study. Transp. Res. Part F Traffic Psychol. Behav. 2014, 22, 113–125. [Google Scholar] [CrossRef]
  42. Starkey, N.J.; Charlton, S.G.; Malhotra, N.; Lehtonen, E. Drivers’ response to speed warnings provided by a smart phone app. Transp. Res. Part C Emerg. Technol. 2020, 110, 209–221. [Google Scholar] [CrossRef]
  43. NHTSA. Visual-Manual Nhtsa Driver Distraction Guidelines for in-Vehicle Electronic Devices; NHTSA-2010-0053; National Highway Traffic Safety Administration: Washington, DC, USA, 2012; pp. 1–117.
  44. Cummings, M.L.; Bauchwitz, B. Safety Implications of Variability in Autonomous Driving Assist Alerting. IEEE Trans. Intell. Transp. Syst. 2022, 23, 12039. [Google Scholar] [CrossRef]
  45. Schreier, M.; Willert, V.; Adamy, J. Compact Representation of Dynamic Driving Environments for ADAS by Parametric Free Space and Dynamic Object Maps. IEEE Trans. Intell. Transp. Syst. 2016, 17, 367–384. [Google Scholar] [CrossRef]
  46. Bosetti, P.; Da Lio, M.; Saroldi, A. On Curve Negotiation: From Driver Support to Automation. IEEE Trans. Intell. Transp. Syst. 2015, 16, 2082–2093. [Google Scholar] [CrossRef]
  47. Li, X.; Lin, K.-Y.; Meng, M.; Li, X.; Li, L.; Hong, Y.; Chen, J. A Survey of ADAS Perceptions with Development in China. IEEE Trans. Intell. Transp. Syst. 2022, 23, 14188. [Google Scholar] [CrossRef]
  48. D.M. No. 6792, Norme Funzionali e Geometriche per la Costruzione Delle Strade (in Italian). Ministero Delle Infrastrutture e dei Trasporti: Rome, Italy, 2011.
  49. Kaber, D.B.; Liang, Y.; Zhang, Y.; Rogers, M.L.; Gangakhedkar, S. Driver performance effects of simultaneous visual and cognitive distraction and adaptation behaviour. Transp. Res. Part F Traffic Psychol. Behav. 2012, 15, 491–501. [Google Scholar] [CrossRef]
  50. Johansson, G.; Rumar, K. Drivers and road signs: A preliminary investigation of the capacity of car drivers to get information from road signs. Ergonomics 1966, 9, 57–62. [Google Scholar] [CrossRef] [PubMed]
  51. Johansson, G.; Backlund, F. Drivers and road signs. Ergonomics 1970, 13, 749–759. [Google Scholar] [CrossRef] [PubMed]
  52. Milosevic, S.; Gajic, R. Presentation factors and driver characteristics affecting road sign registration. Ergonomics 1986, 29, 807–815. [Google Scholar] [CrossRef]
  53. Shinar, D.; Drory, A. Sign Registration in Daytime and Nighttime Driving. Hum. Factors J. Hum. Factors Ergon. Soc. 1983, 25, 117–122. [Google Scholar] [CrossRef] [PubMed]
  54. Macdonald, W.A.; Hoffmann, E.R. Drivers’ awareness of traffic sign information. Ergonomics 1991, 34, 585–612. [Google Scholar] [CrossRef]
  55. Costa, M.; Simone, A.; Vignali, V.; Lantieri, C.; Bucchi, A.; Dondi, G. Looking behavior for vertical road signs. Transp. Res. Part F Traffic Psychol. Behav. 2014, 23, 147–155. [Google Scholar] [CrossRef]
  56. Shoman, M.; Simone, A.; Vignali, V. Looking behavior to vertical road signs on rural roads. MOJ Civ. Eng. 2018, 4, 75–79. [Google Scholar] [CrossRef]
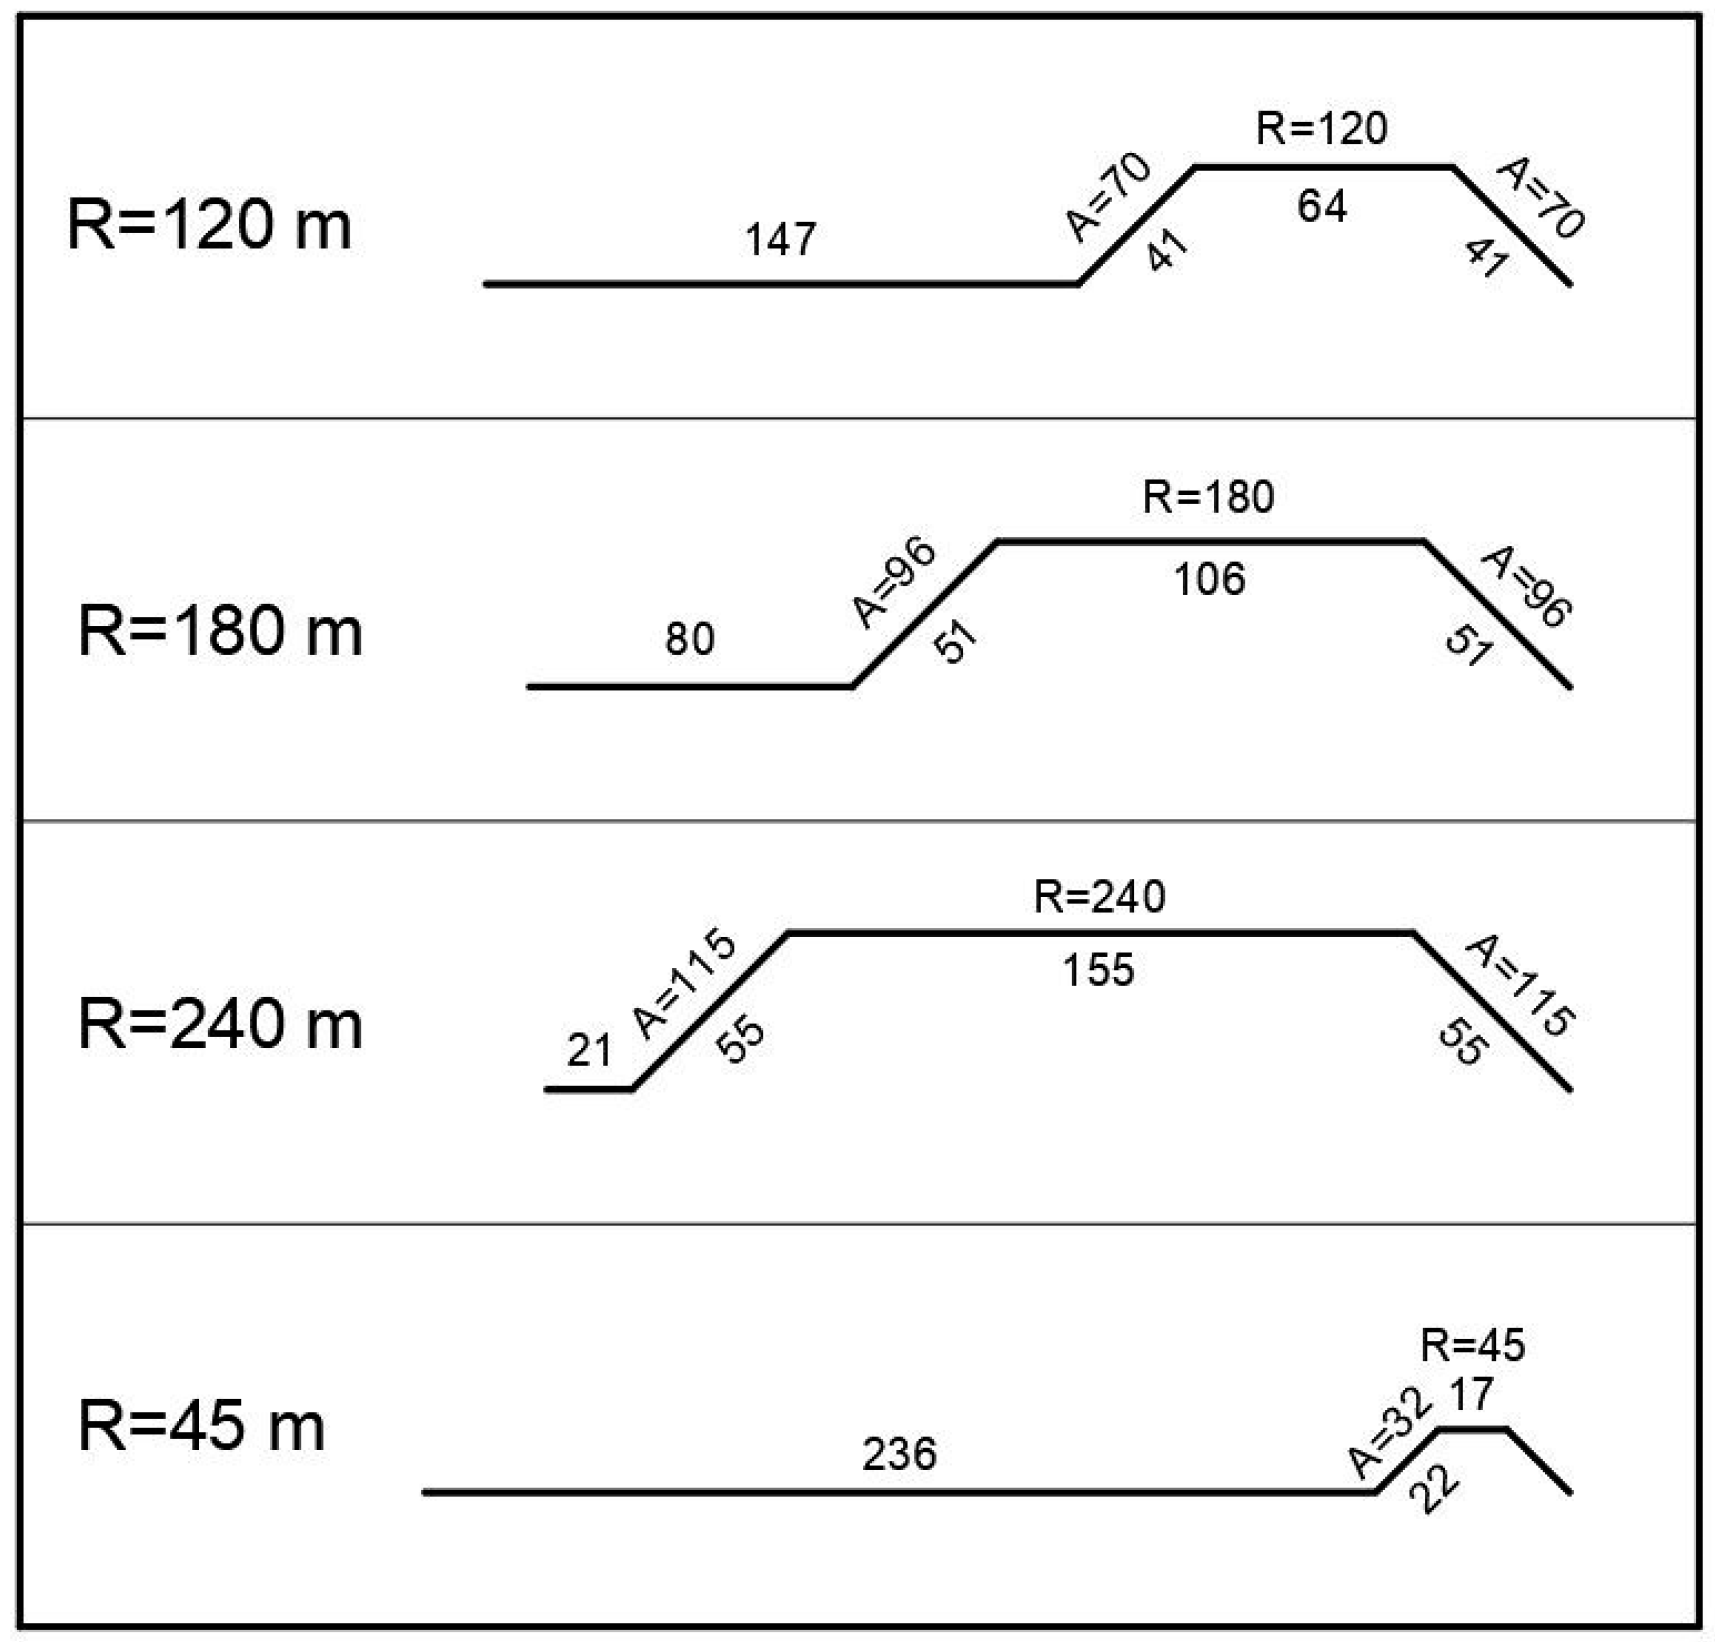
Figure 1. Geometric details of the 4 groups of curves are included in the test alignment.
Vehicles 07 00103 g001
Figure 2. The Sim-Easy driving simulator.
Vehicles 07 00103 g002
Figure 3. The OBU front-end.
Vehicles 07 00103 g003
Figure 4. Box-and-whiskers plot for the total number of fixations.
Vehicles 07 00103 g004
Figure 5. Box-and-whiskers plot for the average time for fixation.
Vehicles 07 00103 g005
Figure 6. Box-and-whiskers plot for the maximum time per fixation.
Vehicles 07 00103 g006
Figure 7. Box-and-whiskers plot for the number of missed signals.
Vehicles 07 00103 g007
Figure 8. Average number of fixations of each warning (OBU).
Vehicles 07 00103 g008
Figure 9. Average time per single fixation (OBU).
Vehicles 07 00103 g009
Figure 10. Maximum time per single fixation (OBU).
Vehicles 07 00103 g010
Figure 11. Distribution of saccadic amplitude for the drivers’ sample; + in the figure represents the outliers.
Vehicles 07 00103 g011
Table 1. Data on drivers. The “Accidents” column includes both accidents suffered and accidents caused. The column “License” refers to the number of years of possession of the driving license. The column “Short-sightedness” contains only values 1 (presence of short-sightedness less than 2 diopters) or 0 (no pathology). Similarly, the column “car sickness” only includes values of 1 (the driver felt a little nauseous while driving) or 0 (no problem).
DriverAgeAccidentsLicenseMyopiaCar Sickness
12911110
22901001
3210400
42801000
5210300
6210300
7210300
8250710
9210300
10270800
11270900
12250700
13220400
14200200
15200200
162801000
17251700
182911000
19240500
20270900
21270900
std dev3.310.363.120.300.22
Table 2. Summary of the results for the different warnings.
WarningsAverage Number of FixationsAverage Time per Single Fixation (s)Maximum Time per Single Fixation (s)
Start Work zone1.450.410.44
Speed Limit Work zone4.550.320.45
End Work zone1.750.460.53
Dangerous curve1.300.440.47
Speeding (90 km/h)0.700.030.05
High CO2 1.400.180.26
Lane departure0.950.220.25
Disclaimer/Publisher’s Note: The statements, opinions and data contained in all publications are solely those of the individual author(s) and contributor(s) and not of MDPI and/or the editor(s). MDPI and/or the editor(s) disclaim responsibility for any injury to people or property resulting from any ideas, methods, instructions or products referred to in the content.