Article

Pooled Rideshare in the U.S.: An Exploratory Study of User Preferences

by
Rakesh Gangadharaiah
1,*,
Johnell Brooks
1,
Lisa Boor
2,
Kristin Kolodge
2,
Haotian Su
1 and
Yunyi Jia
1
1
Department of Automotive Engineering, Clemson University, Greenville, SC 29607, USA
2
J.D. Power, Troy, MI 48083, USA
*
Author to whom correspondence should be addressed.
Vehicles 2025, 7(2), 44; https://doi.org/10.3390/vehicles7020044
Submission received: 1 April 2025 / Revised: 30 April 2025 / Accepted: 7 May 2025 / Published: 9 May 2025
(This article belongs to the Special Issue Novel Solutions for Transportation Safety)

Abstract

:
Pooled ridesharing offers on-demand, one-way, cost-effective transportation for passengers traveling in similar directions via a shared vehicle ride with others they do not know. Despite its potential benefits, the adoption of pooled rideshare remains low in the United States. This exploratory study aims to evaluate potential service improvements and features that may increase users’ willingness to adopt the service. The study analyzed transportation behaviors, rideshare preferences, and willingness to adopt pooled rideshare services among 8296 U.S. participants in 2025, building on findings from a 2021 nationwide survey of 5385 U.S. participants. The study incorporated 77 actionable items developed from the results of the 2021 survey to assess whether addressing specific user-generated topics such as safety, reliability, convenience, and privacy can improve pooled rideshare use. A side-by-side comparison of the 2021 and 2025 data revealed shifts in transportation behavior, with personal rideshare usage increasing from 22% to 28%, public transportation from 21% to 27%, and pooled rideshare from 6% to 8%, while personal vehicle (79%) use remained dominant. Participants rated features such as driver verification (94%), vehicle information (93%), peak time reliability (93%), and saving time and money (92–93%) as most important for improving rideshare services. A pre-to-post analysis of willingness to use pooled rideshare utilizing the actionable items as per respondents’ preferences showed improvement: “definitely will” increased from 15.9% to 20.1% and “probably will” rose from 35.6% to 47.7%. These results suggest that well-targeted service improvements may meaningfully enhance pooled rideshare acceptance. This study offers practical guidance for Transportation Network Companies (TNCs) and policymakers aiming to improve pooled rideshare as well as potential future research opportunities.

1. Introduction

The United States has long relied on a vast and interconnected transportation system—which has evolved through our history with the decline of railroads but an increase in reliance on our vast interstate, highway, state, and local roadway system to support the economy and connect goods, services, and people across its large and diverse landscape [1]. As this network continues to evolve in response to technological advancements and shifting societal needs, ridesharing has emerged as a technological disruption within the mobility sector [2,3]. Although personal vehicles have traditionally dominated ground transportation, the growth of rideshare services is reshaping how people travel [4,5,6]. Gaining a deeper understanding of these changes, particularly the distinctions between personal and pooled rideshare services, is essential for anticipating the direction of future transportation systems in the U.S. [7].
Ridesharing offers on-demand transportation via digital platforms. The basic service of ridesharing is “arranging one-way transportation on short notice” [8], connecting passengers with drivers through smartphone applications [9,10]. This model, popularized by Transportation Network Companies (TNCs) such as Uber and Lyft [7], has rapidly increased, offering a customized and convenient transportation solution. However, it is important to distinguish between personal rideshare and pooled rideshare services—terms often used interchangeably but representing different experiences [11]. Personal rideshare (also known as ride-hailing) provides direct point-to-point service for a single rider or group of riders who know one another, while pooled rideshare involves sharing a ride with a single or multiple passengers traveling in similar directions who do not know one another [12]. Although TNCs offer both options, most rideshare trips use personal rideshare.
Rideshare services are parallel and diverge from traditional transportation, which is notable in several ways. For instance, taxi services require “roadside hailing”, whereas rideshare platforms offer pre-scheduled pick-ups and cashless transactions [13]. Unlike carpooling, which often requires pre-planning, ridesharing dynamically matches riders and drivers in real time, offering greater flexibility [14]. Furthermore, environmental and societal implications are notable, as these services can contribute to decreased traffic congestion and a positive environmental impact [11,15].
To fully understand the current state of ridesharing, a brief look at its history is essential. Although the concept of sharing rides, such as jitney services, dates to the era of the Ford Model T [16,17,18,19], the modern iteration of ridesharing is closely linked to technological advancements [20]. The proliferation of smartphones and internet access outside the home or office created the foundation for real-time ride matching and efficient communication between drivers and riders [21,22]. The inspiration for Uber, the largest company in the rideshare industry, originated in 2008, when two friends struggled to find a taxi in Paris [23]. Their initial idea evolved into a service provider using a smartphone app. As of 2025, Uber operates in approximately 70 countries and more than 10,000 cities worldwide, with a market capitalization of around $160 billion [24]. Lyft, another major service provider, followed in 2012, increasing the mainstream adoption of app-based mobility [25]. Apart from Uber and Lyft, numerous ridesharing platforms are available worldwide, such as DiDi in China [26], Ola Cabs in India [27], Grab in Southeast Asia [28], and Chauffeur Privé in France [29]. Uber offers services worldwide and is the largest ridesharing service provider.
While ridesharing has become a global phenomenon, it is important to recognize the unique challenges that exist within the United States compared to other countries [30,31]. Ridesharing services have been more seamlessly integrated into many international markets with longstanding multimodal public transportation networks and urban planning efforts. In contrast, the U.S. relies predominantly on personal vehicles. Coupling personal vehicle use, reliance on a suburban lifestyle, and limited public transit infrastructure outside major metropolitan areas [32], these conditions create different expectations and demands from U.S. consumers. Additionally, regulatory policies vary widely across the U.S., leading to varying user experiences and operational hurdles for TNCs, which may not be as prevalent in more centralized regulatory systems in other countries [31]. Understanding these unique dynamics is critical when examining the reasons behind the lack of widespread use of pooled rideshare adoption within the United States.
The growth of rideshare use has not been without its challenges [33,34]. While riders benefit from flexibility, affordability, and decreased impaired driving incidents, key concerns—particularly with pooled rideshare—persist [35]. Pooled rideshare adoption continues to face user concerns that cause reluctance in widespread acceptance. Safety is a primary issue, with many users hesitant to share rides with strangers due to fear concerning their physical security and/or the unpredictability of fellow passengers as well as the driver (these concerns may be related to the lack of background checks and/or screenings) [36,37,38,39,40,41,42]. Topics related to the ride’s service and/or experience are another area of concern, particularly around the consistency and reliability of pick-ups, drop-offs, and the vehicle’s cleanliness [43,44,45,46,47]. Privacy is often cited as a barrier, as pooled rides require passengers to share confined spaces [48] and personal travel details such as pick-up and drop-off locations with strangers [49]. Pooled rides can also take longer due to multiple stops, leading to concerns about the efficiency of one’s time as well as the overall convenience of these services [50]. Trust in both the rideshare platform and the driver is critical. Riders must feel confident that the driver is safe, professional, and respectful of riders’ preferences [51,52]. These topics collectively shape the perceptions of pooled rideshare and highlight areas where service providers may improve their services to enhance ridership.
Despite these challenges, ridesharing continues to evolve, with TNCs consistently exploring enhanced services to address user concerns [53,54,55,56,57,58]. As rideshare services grow their presence in the U.S. transportation sector, understanding how users view their multifaceted aspects becomes increasingly important. Understanding the TNCs’ pooled rideshare services, as well as their associated benefits and concerns, requires a comprehensive analysis. By examining the different rideshare-associated topics, policymakers, transportation planners, and other stakeholders can work towards building a future where pooled rideshare contributes to a more efficient and effective transportation system for all.

Previous Nationwide Study on Pooled Rideshare

The current study builds upon and extends the findings of a nationwide survey conducted in 2021, which included 5385 respondents, with 3385 participants from seven major U.S. cities and an additional national sample of 2000 participants. The objective of the 2021 survey was to create a baseline understanding of pooled rideshare within the transportation sector. The survey responses revealed trends in transportation preferences and usage, barriers, and motivators influencing the willingness to consider pooled rideshare services [59]. The study employed a mixed-methods approach that integrated qualitative insights with quantitative data. Initially, open-ended responses were analyzed to capture users’ concerns and experiences related to pooled rideshare.
The results from the 5385 participants were used to conduct two separate factor (including exploratory and confirmatory) analyses to identify latent constructs that influence pooled rideshare adoption [60,61]. The first factor analysis focused on identifying factors influencing one’s willingness to consider pooled rideshare, resulting in five major factors: safety, service experience, privacy, time/cost, and traffic/environment [60]. The second factor analysis explored how to optimize the user’s experience so that the user may be willing to consider pooled rideshare, and identified four factors: comfort/ease of use, convenience, vehicle technology/accessibility, and passenger safety [61]. Logistic regressions revealed how each of the factors individually can influence one’s willingness to consider pooled rideshare. Privacy concerns, for instance, were found to reduce the likelihood of pooled rideshare adoption by 77%, while convenience can increase it by 156%. These nine factors formed the conceptual backbone for further modeling efforts.
Next, the goal was to determine their contribution to the adoption of pooled rideshare when evaluating all the factors together. To understand the relationships among these factors, the Pooled Rideshare Acceptance Model (PRAM) was developed using Structural Equation Modeling (SEM) [62]. This model assessed how each of the nine factors contributed to outcomes, including trust in pooled rideshare services, user attitudes, and behavioral intent to use pooled rideshare. Among the factors, privacy, safety, trust in the service, and convenience had a strong significant influence on the PRAM, with large effect sizes (Cohen’s f2 > 0.35), along with the significance of comfort/ease of use, service experience, traffic/environment, and passenger safety factors. Notably, while time and cost were not significant on their own, their influence was indirectly included under the context of convenience and service reliability.
Recognizing that transportation preferences are not uniform across populations, another set of analyses extended PRAM into the Pooled Rideshare Acceptance Model Multigroup Analyses (PRAMMA) [63]. This stage of analysis incorporated 16 demographic moderators—such as gender, age, generation, income, education, geographic area, and prior rideshare experience—to explore subgroup differences. The multigroup analyses confirmed the need for tailored strategies for different groups of users. For instance, privacy concerns were especially critical for female participants, while younger participants placed more emphasis on environmental and technological benefits. Frequent riders showed higher tolerance for shared rides and stronger trust in the platform.
Drawing from these results, the research team translated statistical insights into 84 actionable items that may be used to address barriers to pooled rideshare [59]. These items were developed through a series of workshops. The actionable items were categorized thematically into key domains, including vehicle selection, routing, driver and passenger characteristics, safety, user experience, and educational services. Each recommendation was derived from empirical data, ensuring the actionable items were grounded in user-centered design principles. The data-driven process used in this series of studies provides the foundation for this manuscript.
This study aims to provide a nationwide perspective of potential modifications and features that may increase pooled rideshare usage in the United States. Building on findings from a previous nationwide survey and the development of 84 actionable items, this follow-up research uses a large national sample to assess how participants respond to specific pooled rideshare service enhancements across multiple categories. Comparing users’ willingness to use pooled rideshare before and after rating the actionable items serves as an initial step to identify the most impactful strategies that may be adopted by Transportation Network Companies (TNCs), policymakers, and urban planners, etc., to increase pooled rideshare adoption. This exploratory study, using a broad national sample, may provide a foundation for future targeted efforts to build upon the most promising actionable items. Since this is an exploratory study, a pre–post comparison is used by asking participants about their willingness to use pooled rideshare before and after reviewing the actionable items to determine if exposure to these topics influences participants’ ratings.

2. Methods

2.1. Part 1: Refining Actionable Items

2.1.1. Actionable Item Selection

Building upon our team’s earlier research, this study aimed to investigate the types of improvements that have the potential to enhance pooled rideshare user acceptance. The research team reviewed each of the 84 previously developed items, and through iterative review sessions, 77 items were selected and adapted to move forward with the national study.

2.1.2. Categorization of Actionable Items

The 77 actionable items were grouped into eight thematic categories, reflecting distinct aspects of the pooled rideshare experience. Each category was developed to assess practical and implementable service features that have the potential to address known user concerns. Vehicle selection (16 items) focused on cleanliness, comfort, accessibility, and features such as storage space, legroom, and maintenance standards. Driver-related preferences (8 items) assessed topics such as background checks, driving records, passenger ratings, punctuality, and ride personalization options. Fellow passenger preferences (6 items) explored one’s desire for familiarity and visibility before a ride. Safety considerations (8 items) included identity verification, emergency response features, real-time tracking, and verification of other passengers’ profiles. Rider experience (15 items) evaluated service reliability, ease of booking, trip flexibility, and incentive programs. Specialized services (8 items) focused on targeted offerings for specific groups, such as elderly passengers, non-native English speakers, and new rideshare users. Trip route preferences (9 items) examined route customization, prioritization, and cost-saving options like setting a maximum detour time or viewing other passengers’ pick-up/drop-off points. Finally, additional services (7 items) included topics such as data privacy policies, employer partnerships, and environmental initiatives. These categories were developed not only to guide data interpretation, but also to inform real-world implementation.

2.2. Part 2: Survey Methodology

2.2.1. Survey Structure

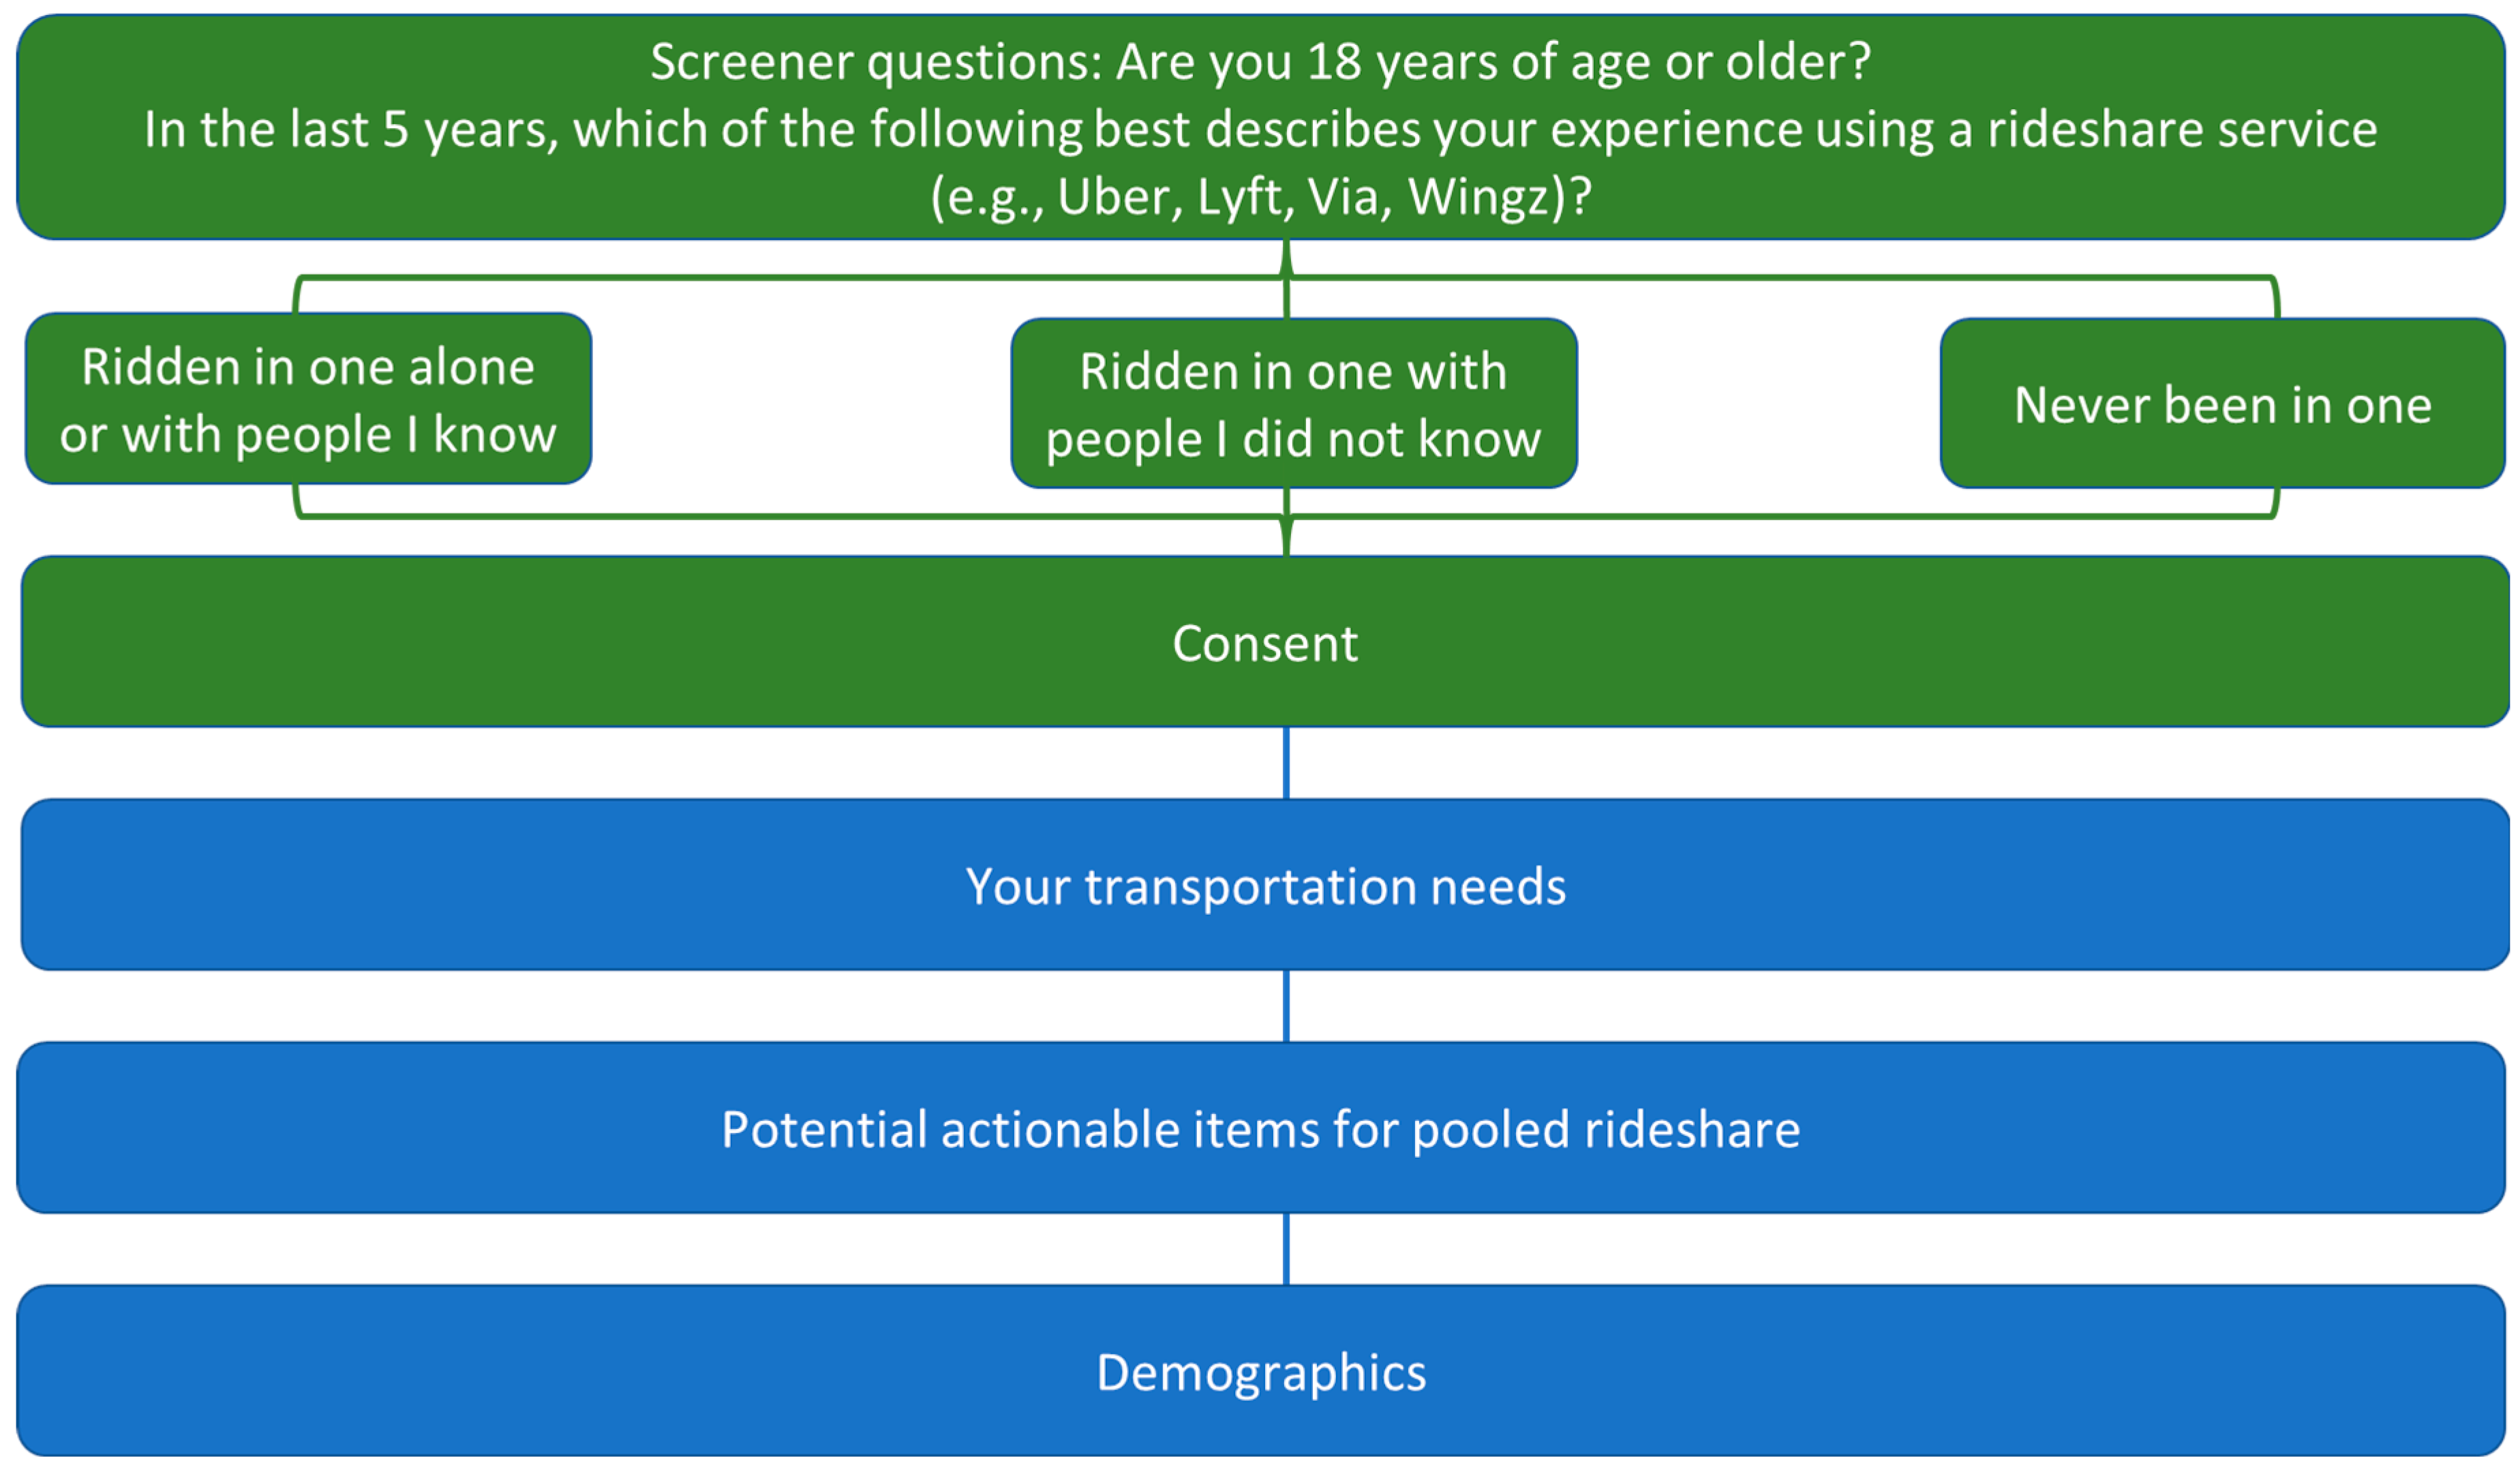
The flow diagram in Figure 1 provides an overview of the online survey’s design. First, potential participants completed two screening questions: age, to ensure all interested individuals were at least 18 years of age, and previous rideshare experience. The previous rideshare experience question was used to recruit an equal number of respondents with and without rideshare experience. After providing consent, participants expressed their willingness to use pooled rideshare prior to providing insights into their transportation needs, such as current mobility uses, frequency of rideshare usage, and reasons to use pooled rideshare. Subsequently, the following section explored the 77 potential actionable items described in Section 2.1. using a 4-point scale (strongly agree, agree, disagree, and strongly disagree). Then, respondents were asked for a second time about their willingness to use pooled rideshare after consideration of the actionable items. Finally, the demographic information was obtained.

2.2.2. Participants

A total of 8296 participants completed the survey, comprising both city-specific and nationally representative samples. The city samples (4296) included respondents from nine metropolitan areas: Atlanta, Austin, Chicago, New York City, San Francisco, Los Angeles, Dallas, Seattle, and Washington, DC. The target sample was 500 respondents for each city, with equal representation of those with rideshare experience and those without. The goal was obtained for all cities except for Austin (410 participants) and San Francisco (386). A national sample of 4000 additional respondents (2000 with rideshare experience and 2000 without) was included to ensure broader geographic representation beyond the selected metropolitan areas. Out of the full sample of 8296 participants, the majority of respondents lived in suburban areas (50.3%), followed by urban (29%) and rural areas (19.1%).
Participants were recruited through an online panel managed by a professional survey distribution company. J.D. Power, who are collaborators in this research, managed the survey design and data collection in compliance with market research industry standards. The survey was conducted online using a secure web-based platform. Potential participants aged 18 and above were invited to join the study and were required to verify their age prior to participating. Informed consent was obtained electronically prior to beginning the survey. This research was approved by the Institutional Review Board (IRB) at Clemson University.

2.2.3. Demographics

Since this manuscript focuses on summary statistics for the entire group of 8296 participants, only a few demographic details are discussed; the remainder of the demographic information is presented in Table 1. The survey was nearly gender-balanced, with 52.7% female and 47.0% male respondents. Participants represented a diverse age distribution, with the largest group being Gen Y (27–44 years, 31.4%), followed by Boomers (57–75 years, 29.9%) and Gen X (45–56 years, 20.2%). A smaller proportion of participants represented the youngest and oldest participants, specifically Gen Z (<27 years, 15.7%) and Pre-boomers (>75 years, 2.7%). Most participants reported owning at least one vehicle (91.7%), as well as having a valid driver’s license and being an active driver (82.6%).

2.2.4. Data Analysis

This study used descriptive analyses to explore participants’ rideshare experiences, transportation choices, usage frequency, trip duration, fare distribution, and preferences for pooled rideshare services. Given the exploratory nature of the study, the analyses are primarily focused on summarizing the key trends. For select questions that were consistent between the surveys completed in 2021 [64] and 2025, a side-by-side comparison is presented to identify shifts in attitudes and behaviors. Finally, the study summarizes the proposed actionable items by comparing participants’ willingness to use pooled rideshare services at the beginning and end of the study to offer insights into potential strategies to enhance pooled rideshare adoption.

3. Results

3.1. Current Pooled Rideshare Usage

The dataset includes 4250 participants with rideshare experience (51.2%) and 4046 participants without (48.8%). When participants were asked about their willingness to consider a pooled rideshare service as it operates today, 15.9% reported they “definitely will” use pooled rideshare when available. Conversely, 15.1% of participants stated they “definitely will not” use pooled rideshare. When comparing these percentages to the same question from the 2021 survey (Figure 2), the percentage of those who “definitely will” doubled, increasing from 7.8% in 2021 to 15.9% in 2025. Notably, those who “definitely will not” use pooled rideshare declined from 24.7% in 2021 to 15.1%, suggesting a reduction in strong opposition against pooled rideshare services. This pattern is encouraging, suggesting a growing willingness to use pooled rideshare.

3.2. Transportation Needs

3.2.1. Method of Transportation

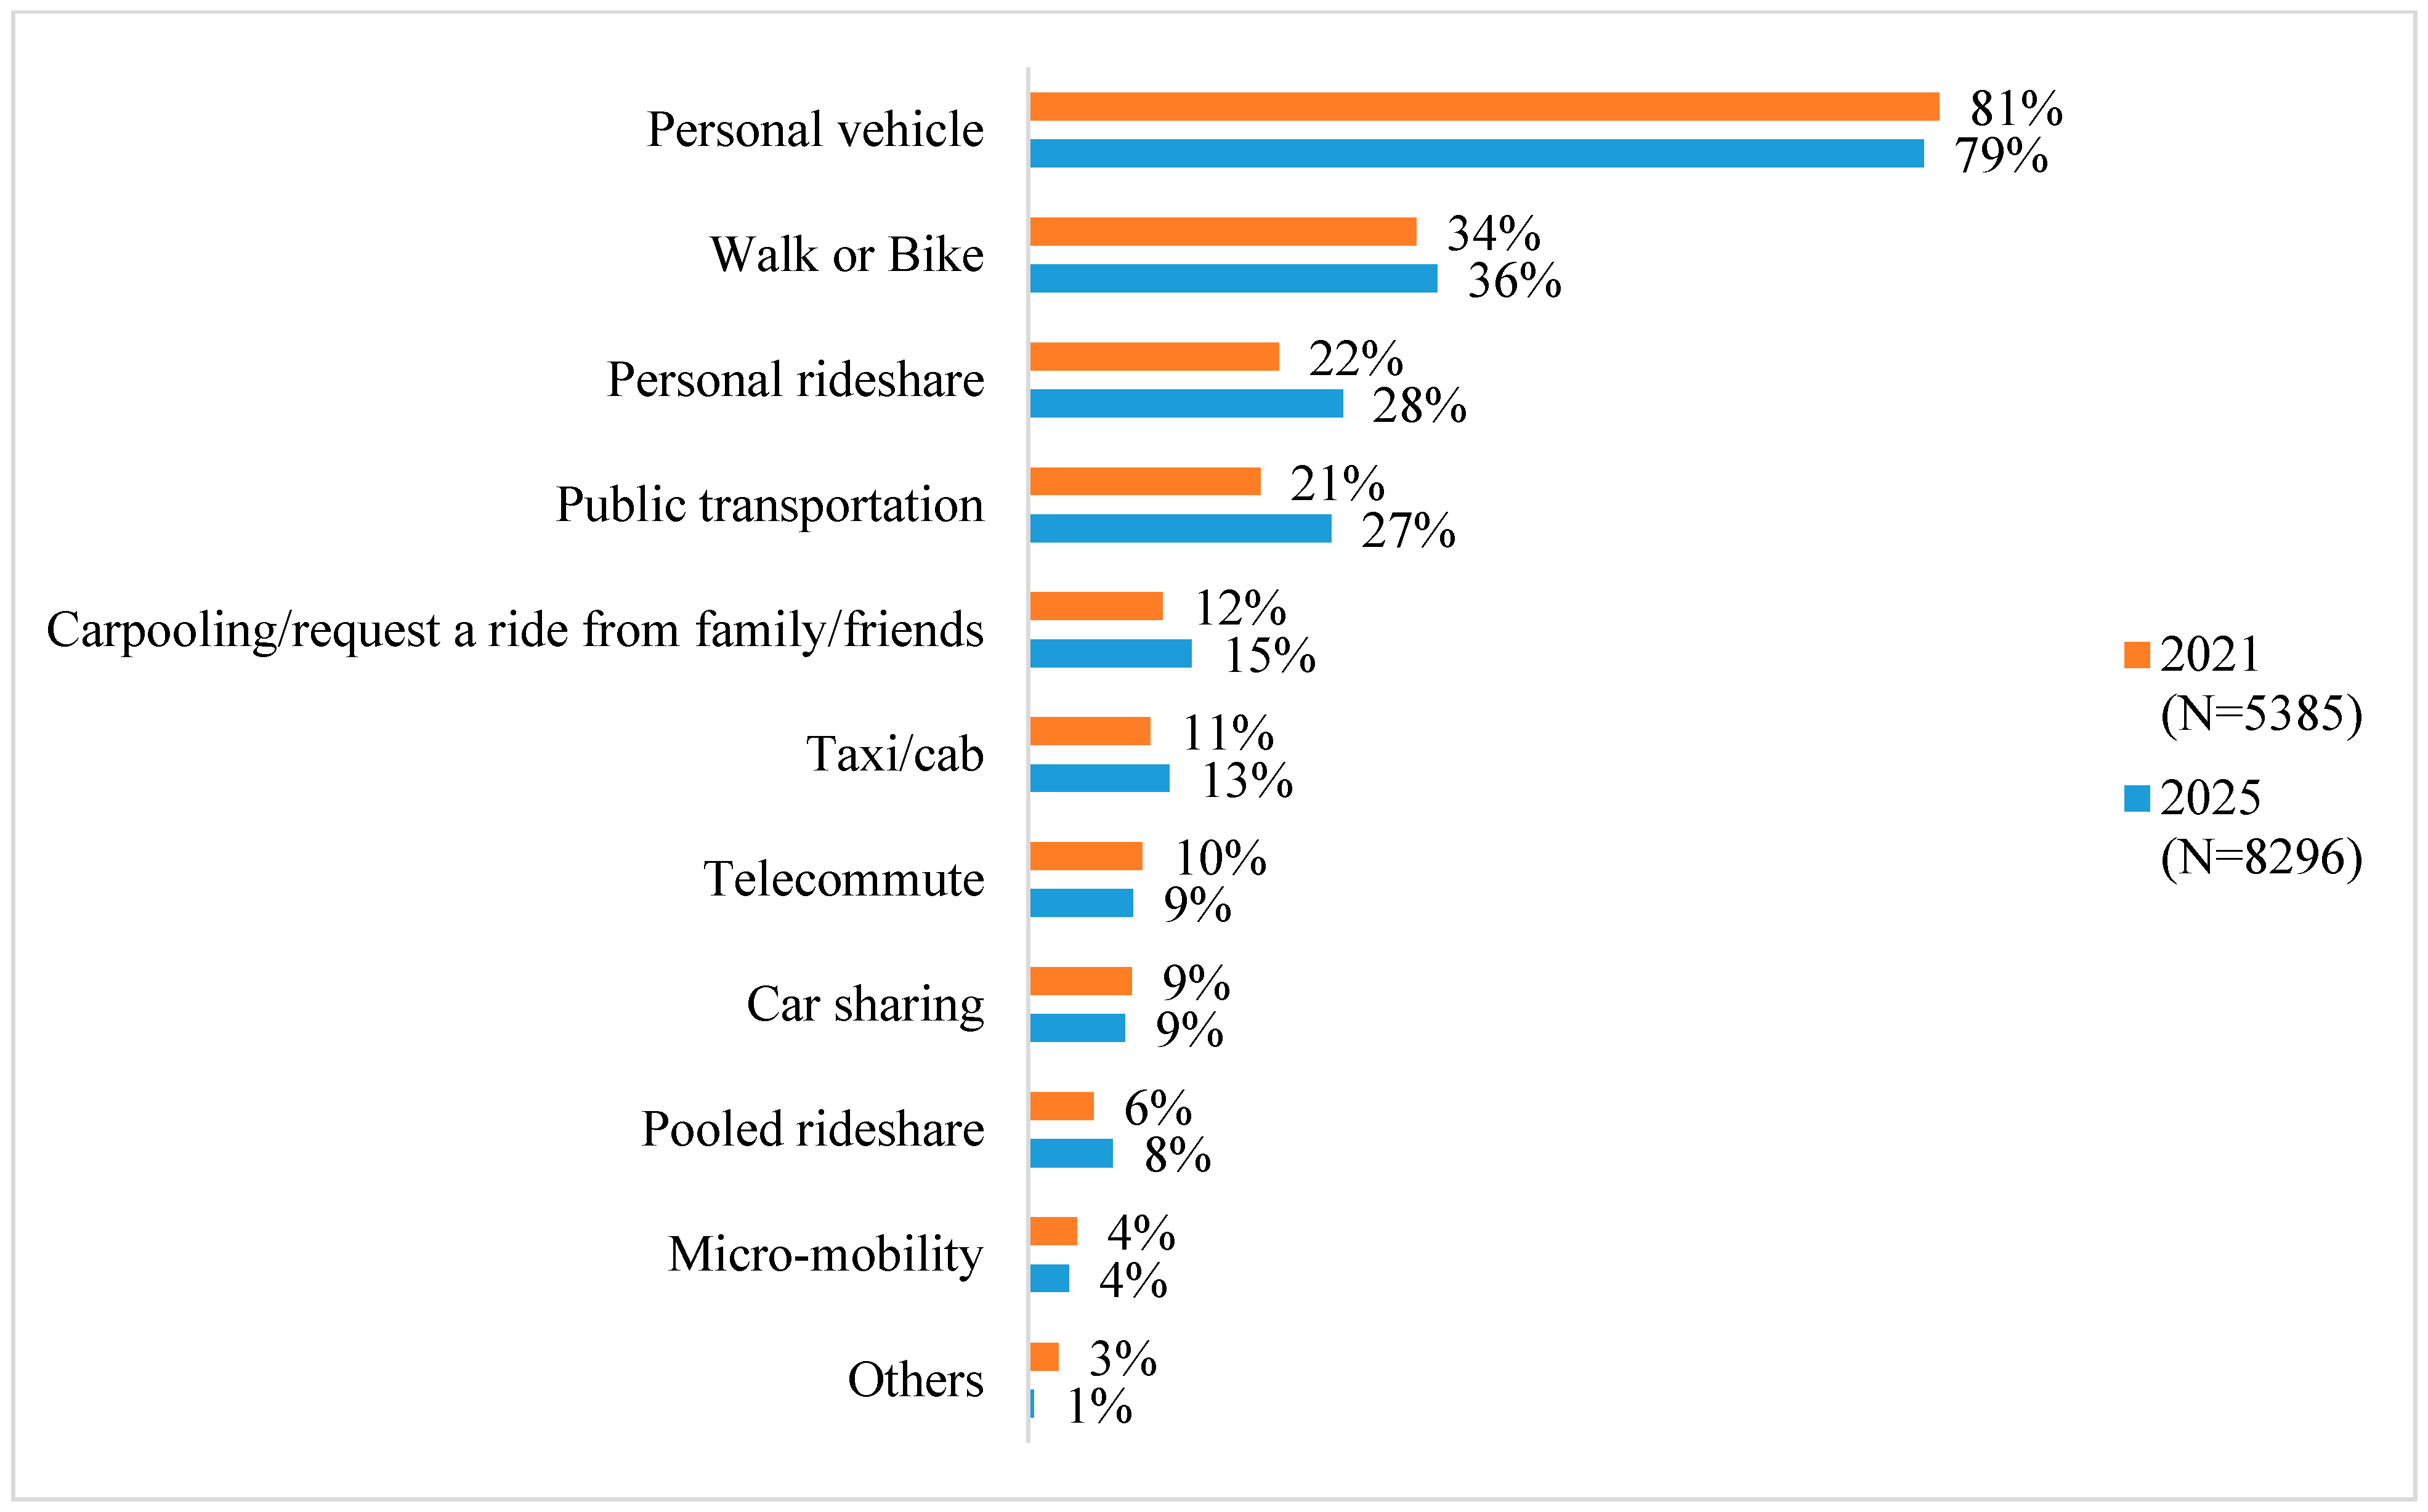
Participants’ typical transportation methods were examined and presented in comparison to the 2021 dataset (see Figure 3). Due to multiple transportation alternatives, respondents could select more than one option to capture the diversity of their transportation habits. In the 2025 sample, the majority of participants drive using their “personal vehicle” (79%), followed by “walk or bike” (36%), “personal rideshare” (28%), and “public transportation” (27%). Sharing a ride options, whether “carpooling/request a ride from family or friends” (15%), “car sharing” (9%), or “pooled rideshare” (8%), were utilized by roughly 35% of the users. The pattern of transportation options used between 2021 and 2025 remained consistent.

3.2.2. Transportation Frequency

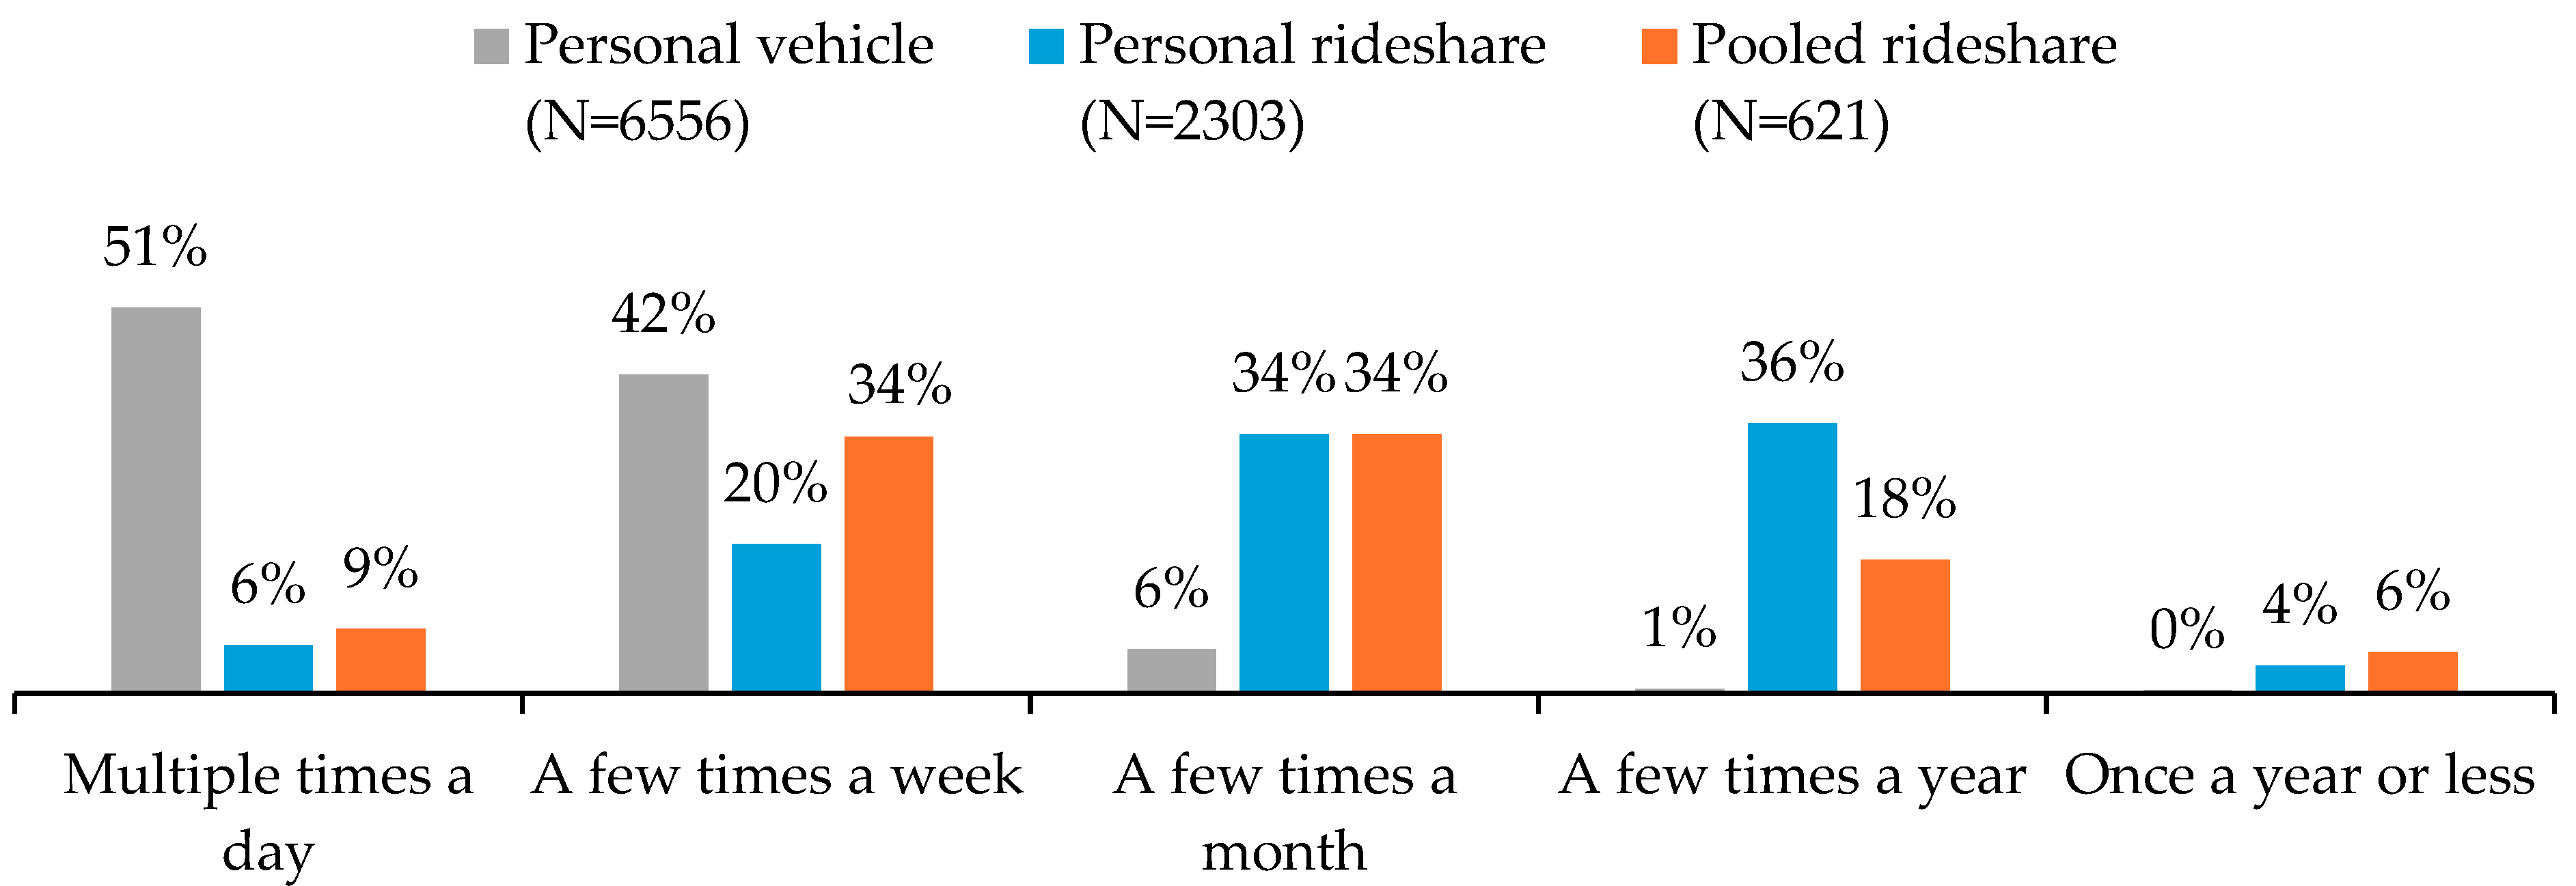
Next, the frequency of use for personal vehicles, personal rideshare services, and pooled rideshare services were examined (Figure 4). Among personal vehicle users (N = 6556), the vast majority used their vehicles “multiple times a day” (51%) or “a few times a week” (42%), highlighting the reliance on personal vehicles in the United States for daily transportation.
For personal rideshare users (N = 2303), 6% reported using the service “multiple times a day”, while 20% used it “a few times a week”. The most common usage was “a few times a month” (34%) and “a few times a year” (36%), indicating that personal rideshare services are more frequently used for occasional travel rather than as a daily or even weekly mode of transportation.
For pooled rideshare users (N = 621), the frequency of use followed a similar pattern to personal rideshare, but with slightly higher weekly usage, where 9% reported using pooled rideshare “multiple times a day” and 34% used it “a few times a week”. The highest proportion of pooled rideshare users (34%) reported using the service “a few times a month”. These findings indicate that while personal vehicles remain the dominant and most frequently used mode of daily transport, personal and pooled rideshare services are being used, but on a situational or infrequent basis rather than as a daily mode of transportation. It is interesting to note that pooled rideshare users report a higher weekly usage than personal rideshare users, suggesting that those who opt for pooled rideshare may do so with greater regularity than those using personal rideshare services.

3.2.3. Average Duration of Recent Trips

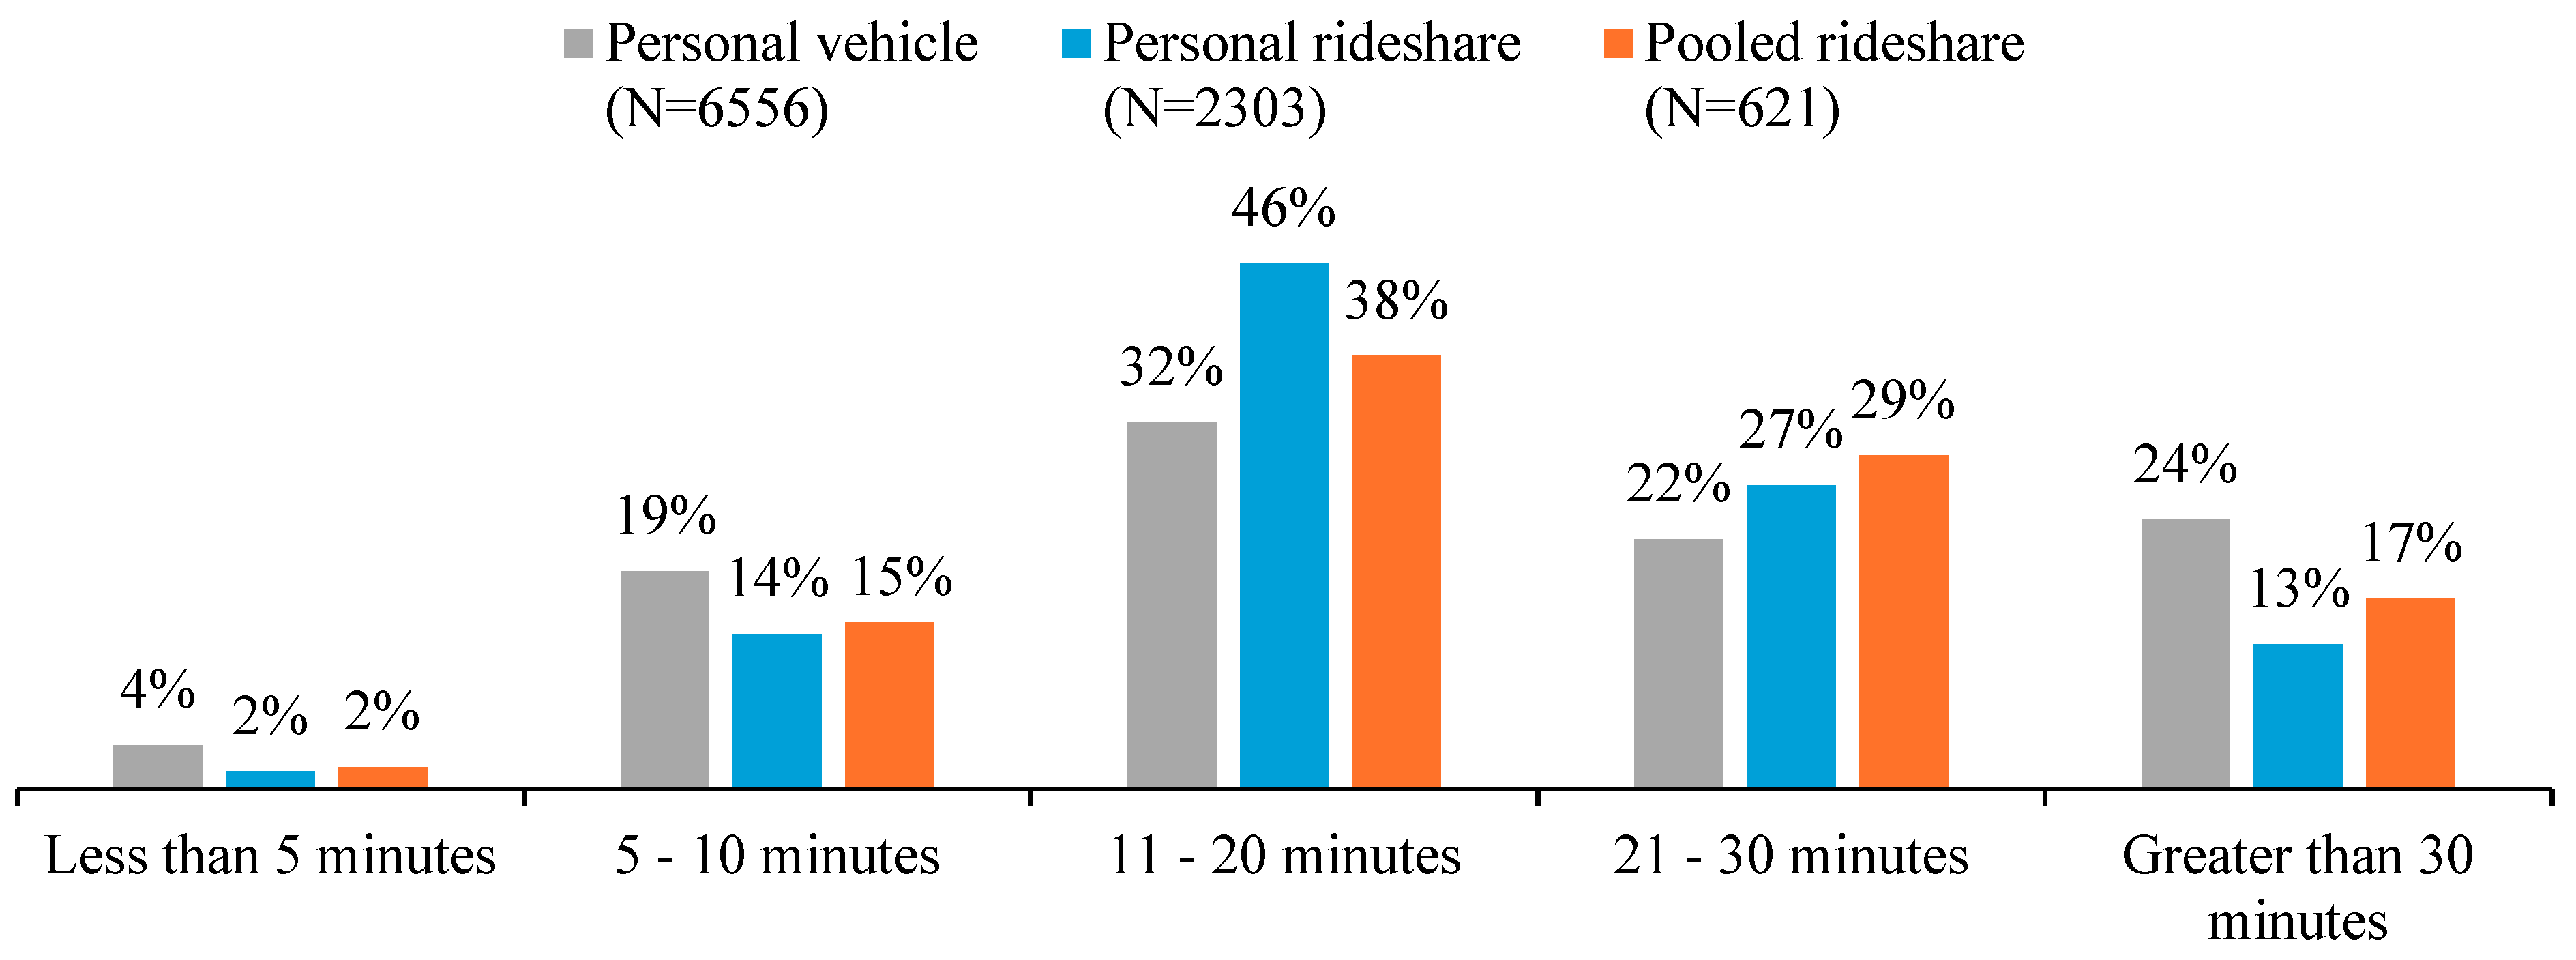
The average duration of participants’ most recent trips using personal vehicles, personal rideshare, and pooled rideshare services is illustrated in Figure 5. Across all three transportation modes, the most common trip duration was “11–20 min”, suggesting a shared duration of travel among users. For personal and pooled rideshare users, the next most common duration was “21–30 min”. Approximately 67% of pooled rideshare trips fell between 11 and 30 min, which likely included the additional time required for multiple passenger pick-ups and drop-offs. Shorter trips were less frequent in all three groups. These findings suggest that personal and pooled rideshare services are most commonly used for trips under 30 min. Pooled rideshare may involve longer durations due to its shared nature.

3.2.4. Reasons for Using Pooled Rideshare Services

Regarding the typical reasons for using a pooled rideshare service, responses were collected in both 2021 (N = 314) and 2025 (N = 621), allowing for a direct comparison of trends over time (Figure 6). The most common reasons for using a pooled rideshare were “recreation/social events (e.g., dining or bar)” (55% in 2021 vs. 48% in 2025), “transportation to the airport” (42% vs. 45%), and “shopping/errands” (37% vs. 43%). A new option introduced in the 2025 survey, “large events (e.g., sports or concerts; 42%)” and “personal vehicle being repaired/serviced” was selected by (39% vs. 42%) of participants, highlighting the importance of pooled rideshare as a transportation option for planned outings and logistical needs. Work-related trips (44% vs. 40%) and personal travel/vacation (40% vs. 39%) also remained common use cases. Overall, the findings suggest that pooled rideshare continues to be a useful option for leisure and essential trips, especially trips to the airport.

3.2.5. Reasons for Choosing to Use Pooled Rideshare Services

Next, participants’ reasons for choosing to use a pooled rideshare service were explored (Figure 7). The most frequent reasons for choosing pooled rideshare were “more convenient (e.g., inclement weather or inconvenient parking)” (52% in 2021 vs. 58% in 2025) and “cheaper than my other transportation options”. Additional benefits of pooled rideshare continue to be “less stressful”, “quicker to reach destination”, and “ability to multi-task”. Overall, the findings suggest that convenience remains the main reason for choosing pooled rideshare, with increasing emphasis on cost savings and stress reduction.

3.3. Actionable Items

First, the actionable items within each of the eight categories are explored prior to examining the most highly rated items between the eight categories.

3.3.1. Vehicle Selection

Participants’ preferences regarding vehicle selection were assessed to determine which vehicle features they believe may make them more likely to choose a pooled rideshare (Table 2). When combining “strongly agree” with “agree”, cleanliness emerged as the most important item (93%), with 41% strongly agreeing and 52% agreeing. Regarding cleanliness, 84% of the participants are in favor of the vehicle being disinfected between rides (32% strongly agree and 52% agree).
Accessibility in terms of easy ingress and egress also played a substantial role, with 92% (33% strongly agree and 59% agree) favoring vehicles that are easy to get in and out of. Storage and seating considerations were also important, as 87% (26% strongly agree and 61% agree) valued having sufficient storage space for cargo, 83% (26% strongly agree and 57% agree) preferred vehicles that offer seating options other than the middle seat, 77% prefer extra legroom (21% strongly agree and 56% agree), and 70% (19% strongly agree and 52% agree) want the ability to reserve their preferred seat location in advance.
The vehicle’s reliability is also important, where 86% (32% strongly agree and 54% agree) preferred vehicles that undergo a certified annual maintenance check, ensuring that the vehicles operate as expected. These findings highlight the most important vehicle preferences for potential pooled rideshare users, with cleanliness, accessibility/space, and certified maintenance ranking as the highest priorities.

3.3.2. Driver Selection

Participants’ preferences regarding the driver are helpful to understand the importance of each driver’s influence on individuals’ willingness to choose a pooled rideshare. When aggregating across “strongly agree” and “agree”, the most important driver characteristic was a high punctuality rating, with 93% agreement (41% strongly agree and 52% agree; Table 3). Three other driver-related variables were above 90%, including that a driver should have a clean driving record (92%; 46% strongly agree and 46% agree), a driver should have high passenger ratings (92%; 39% strongly agree and 53% agree), and a driver should have recently passed a formal background check (90%; 42% strongly agree and 48% agree).
Drivers who are sensitive to passengers’ preferences were also valued, but to a lesser extent. The ability for a passenger to choose between a conversation-friendly or quiet ride was supported by 85% (27% strongly agree and 58% agree), and 84% (25% strongly agree and 59% agree) preferred a driver who consults them on preference-related topics such as the temperature and music.
Overall, punctuality, a clean driving record/background check, and passenger ratings were the strongest determinants for passengers’ ratings related to a pooled rideshare driver.

3.3.3. Fellow Passengers

Participants’ preferences regarding fellow passengers and the items that make them more likely to choose pooled rideshare were assessed. When aggregating the “strongly agree” and “agree” responses, all the items in this section are rated below a combined 80% (Table 4). Familiarity and previous experience were rated as the most important considerations within this category. The strongest rated item was riding with “preferred riders because I know them” (72%; 20% strongly agree and 52% agree) and “ridden with fellow passengers before” (70%; 17% strongly agree and 53% agree).
The majority of participants (72%; 14% strongly agree and 59% agree) expressed a favorable view towards sharing a ride with another passenger who is traveling or riding alone. Overall, riders showed stronger preferences for familiarity and past experiences with fellow passengers, while demographic items such as gender and age played a smaller role in influencing willingness to choose pooled rideshare.

3.3.4. Safety

Participants’ safety regarding towards pooled rideshare were examined (Table 5). Identity verification was the highest-rated safety item, specifically providing “the driver’s name and photo to confirm that I’m getting in the correct vehicle”, with 95% (49% strongly agree and 46% agree) supporting this feature. Similarly, 93% (45% strongly agree and 48% agree) valued “providing the vehicle make, model, and license plate number” to verify their ride, highlighting the importance of ensuring the correct match between a driver and rider. Verification systems and real-time tracking were also highly valued, where 92% (41% strongly agree and 51% agree) supported “a two-way verification code” to confirm that they were entering the correct vehicle, and 89% (40% strongly agree and 48% agree) preferred “an emergency button in the vehicle and/or on the app” to connect with local emergency services and share their location with authorities. A total of 88% (37% strongly agree and 51% agree) wanted the ability to “track their trip in real time by a person of their choosing”.
Security screening for fellow passengers was also important, with 82% (30% strongly agree and 52% agree) supporting “having other passengers’ profiles verified by the rideshare company”. This suggests a preference for background checks and identity verification among co-riders. Meanwhile, 79% (25% strongly agree and 54% agree) supported “educational resources on safety best practices for using pooled rideshare”, and 76% (28% strongly agree and 48% agree) preferred vehicles to “indicate if child safety locks are unlocked/disabled”, ensuring they are not unknowingly locked inside. Overall, the findings suggest that pooled rideshare users prioritize safety, including identity verification, vehicle confirmation, real-time tracking, and emergency response features, while educational initiatives and physical safety mechanisms are also valuable.

3.3.5. Rider Experience

Participants’ rider experience preferences were assessed, identifying which service features will make them more likely to choose pooled rideshare services. Reliability and efficiency were the top priorities (Table 6). The highest-rated item was “providing reliable service during peak demand times”, with 93% (38% strongly agree and 55% agree) emphasizing its importance. A total of 90% (32% strongly agree and 58% agree) of participants supported “the ability to provide feedback to the company after the ride”. Convenience in both booking and trip management were also major features, where 90% (32% strongly agree and 58% agree) wanted “the ability to book roundtrips in one transaction”, improving trip-planning efficiency. A total of 89% (31% strongly agree and 58% agree) valued “dedicated drop-off/pick-up zones for large events”, making it easier for riders to know where to go to meet their ride. Similarly, 88% (33% strongly agree and 55% agree) valued “faster pick-ups at airports and transit stations”, highlighting a demand for a timely and predictable service. There was also interest from 75% (21% strongly agree and 54% agree) who want “integration with public transit services”, allowing for multimodal trip-planning experiences.
Loyalty programs with decreased pricing were popular topics, where 87% (31% strongly agree and 56% agree) preferred “discounts or price locking for pre-booked regular trips”, reflecting cost-conscious rider preferences. Appreciation for regular usage was also important, where 87% (32% strongly agree and 55% agree) supported “reward programs for frequent riders”, incentivizing repeat users. A total of 85% (28% strongly agree and 57% agree) wanted “the ability to book recurring trips in advance”, making ridesharing more predictable. A total of 80% (23% strongly agree and 57% agree) appreciated “the option to book multiple short trips with the driver waiting at each stop”, while 79% (24% strongly agree and 55% agree) found “storing frequently selected destinations for easy booking” useful. The concept of “one-tap rebooking” for seamless reservations was valued by 76% (23% strongly agree and 53% agree) of the participants.
Savings in terms of cost or experiences for using pooled rideshare in comparison to a personal vehicle or the benefits to the environment received moderate support. A total of 81% (21% strongly agree and 60% agree) value “calculating estimated cost savings compared to using a personal vehicle”, and 72% (20% strongly agree and 52% agree) supported “calculating the estimated experiential benefits of using a pooled rideshare”. Overall, participants showed strong preferences for reliability, seamless booking options, and pricing incentives.

3.3.6. Specialized Services

Participants’ preferences for specialized services were assessed to identify which offerings may make them more likely to choose a pooled rideshare. A clear registration process and serving the aging population were the highest priorities (Table 7). The most preferred item was “creating an initial registration process that clearly communicates policies and procedures”, with 87% (27% strongly agree and 60% agree) supporting its importance in setting clear expectations upfront for riders. Additionally, 83% (29% strongly agree and 54% agree) favored “services for elderly riders”, ensuring accessibility for this growing population. Incentives and support for new users also received moderate support. Moreover, 81% (24% strongly agree and 57% agree) wanted “one free pooled rideshare as a trial”, suggesting that a no-cost initial experience may encourage first-time users to try the service. Overall, the results indicate that participants place the highest value on clear policies, providing accessibility for elderly riders, and incentives, including a free initial trial, while support for educational efforts and services for specific passenger groups varied and is likely valued by subsamples of the participants.

3.3.7. Trip Route

Participants were asked about preferences regarding trip route customization to determine which items may make them more likely to choose a pooled rideshare service. Cost and time savings were the most important considerations (see Table 8). Overall, the highest-rated item was “saving the most time getting to their destination”, with 93% (35% strongly agree and 58% agree) indicating that efficiency remains a main item of pooled rideshare adoption. Similarly, 92% (39% strongly agree and 53% agree) support cost-efficient rides that allow users to save money getting to their destination. Transparency and control over the trip’s route were also highly valued. A total of 90% (31% strongly agree, 59% agree) wanted “the ability to see the route in progress with current traffic information”, while 87% (29% strongly agree and 58% agree) wanted to see “other passengers’ pick-up and drop-off locations in progress”. Additionally, 86% (29% strongly agree and 57% agree) supported “having the highest priority during pick-up and drop-off”, reflecting a desire for an optimized, personalized travel experience.
Parental control and discounted route flexibility were moderately important. A total of 82% (26% strongly agree and 56% agree) valued “having the option to be picked up or dropped off near, but not exactly at, their origin/destination for a discounted fare”, indicating that some riders were open to trade-offs for cost savings. Furthermore, 76% (28% strongly agree and 48% agree) wanted “parents to pre-approve locations for independent minor passengers”, suggesting either a level of control or safety concerns, or both, for younger riders. A total of 78% (21% strongly agree and 57% agree) wanted “the ability to set their own maximum detour time compared to taking a personal rideshare”, while 76% (23% strongly agree and 53% agree) supported “setting their route beforehand”. These results suggest that while some riders seek control over trip planning, the majority are comfortable with pre-determined routes, as long as efficiency and transparency are maintained. Overall, participants prioritized affordability, time savings, and real-time route visibility, while personalized control features such as pre-set routes and detour customization were also considered important.

3.3.8. Additional Services

Participants’ preferences for additional services offered by pooled rideshare companies were assessed, focusing on items that enhance trust, awareness, and accessibility. Privacy and safety education were the most important additional services (see Table 9). The highest-rated preference was “explaining data protection and privacy rules”, with 82% (26% strongly agree and 56% agree) supporting transparency regarding how their information is handled. Similarly, 81% (24% strongly agree and 57% agree) valued “educating users on how pooled rideshare works, including safety features and tips for traveling with children”, indicating that riders seek clear guidelines. Moreover, 81% (20% strongly agree and 61% agree) agreed that “ensuring leisure and business travelers are aware of available pooled rideshare options” is important. Promotions and event-based services were also well received. A total of 80% (23% strongly agree and 57% agree) supported “promoting pooled rideshare usage during high-traffic events such as concerts and sporting events”, reflecting the demand for seamless mobility solutions in crowded environments. Additionally, 76% (22% strongly agree and 54% agree) favored “partnerships with employers (e.g., universities, hospitals, and companies) to provide promotions for pooled rideshare usage”, highlighting the role of incentives in encouraging adoption.
Environmental consciousness and partnerships with organizations received moderate support. In total, 75% (23% strongly agree and 52% agree) agreed that a rideshare company should be environmentally conscious, indicating a preference for sustainable transportation solutions. Meanwhile, 71% (23% strongly agree and 48% agree) favored “partnerships with organizations such as Mothers Against Drunk Driving, rape crisis centers, and AARP”, suggesting that corporate social responsibility initiatives may enhance trust and credibility. This result suggests that awareness efforts for specific traveler groups are beneficial, but not as critical as privacy, safety, and event-based promotions. Overall, participants prioritized privacy protection, safety education, and strategic promotions and partnerships.

3.4. Willingness to Use Pooled Rideshare in the Future

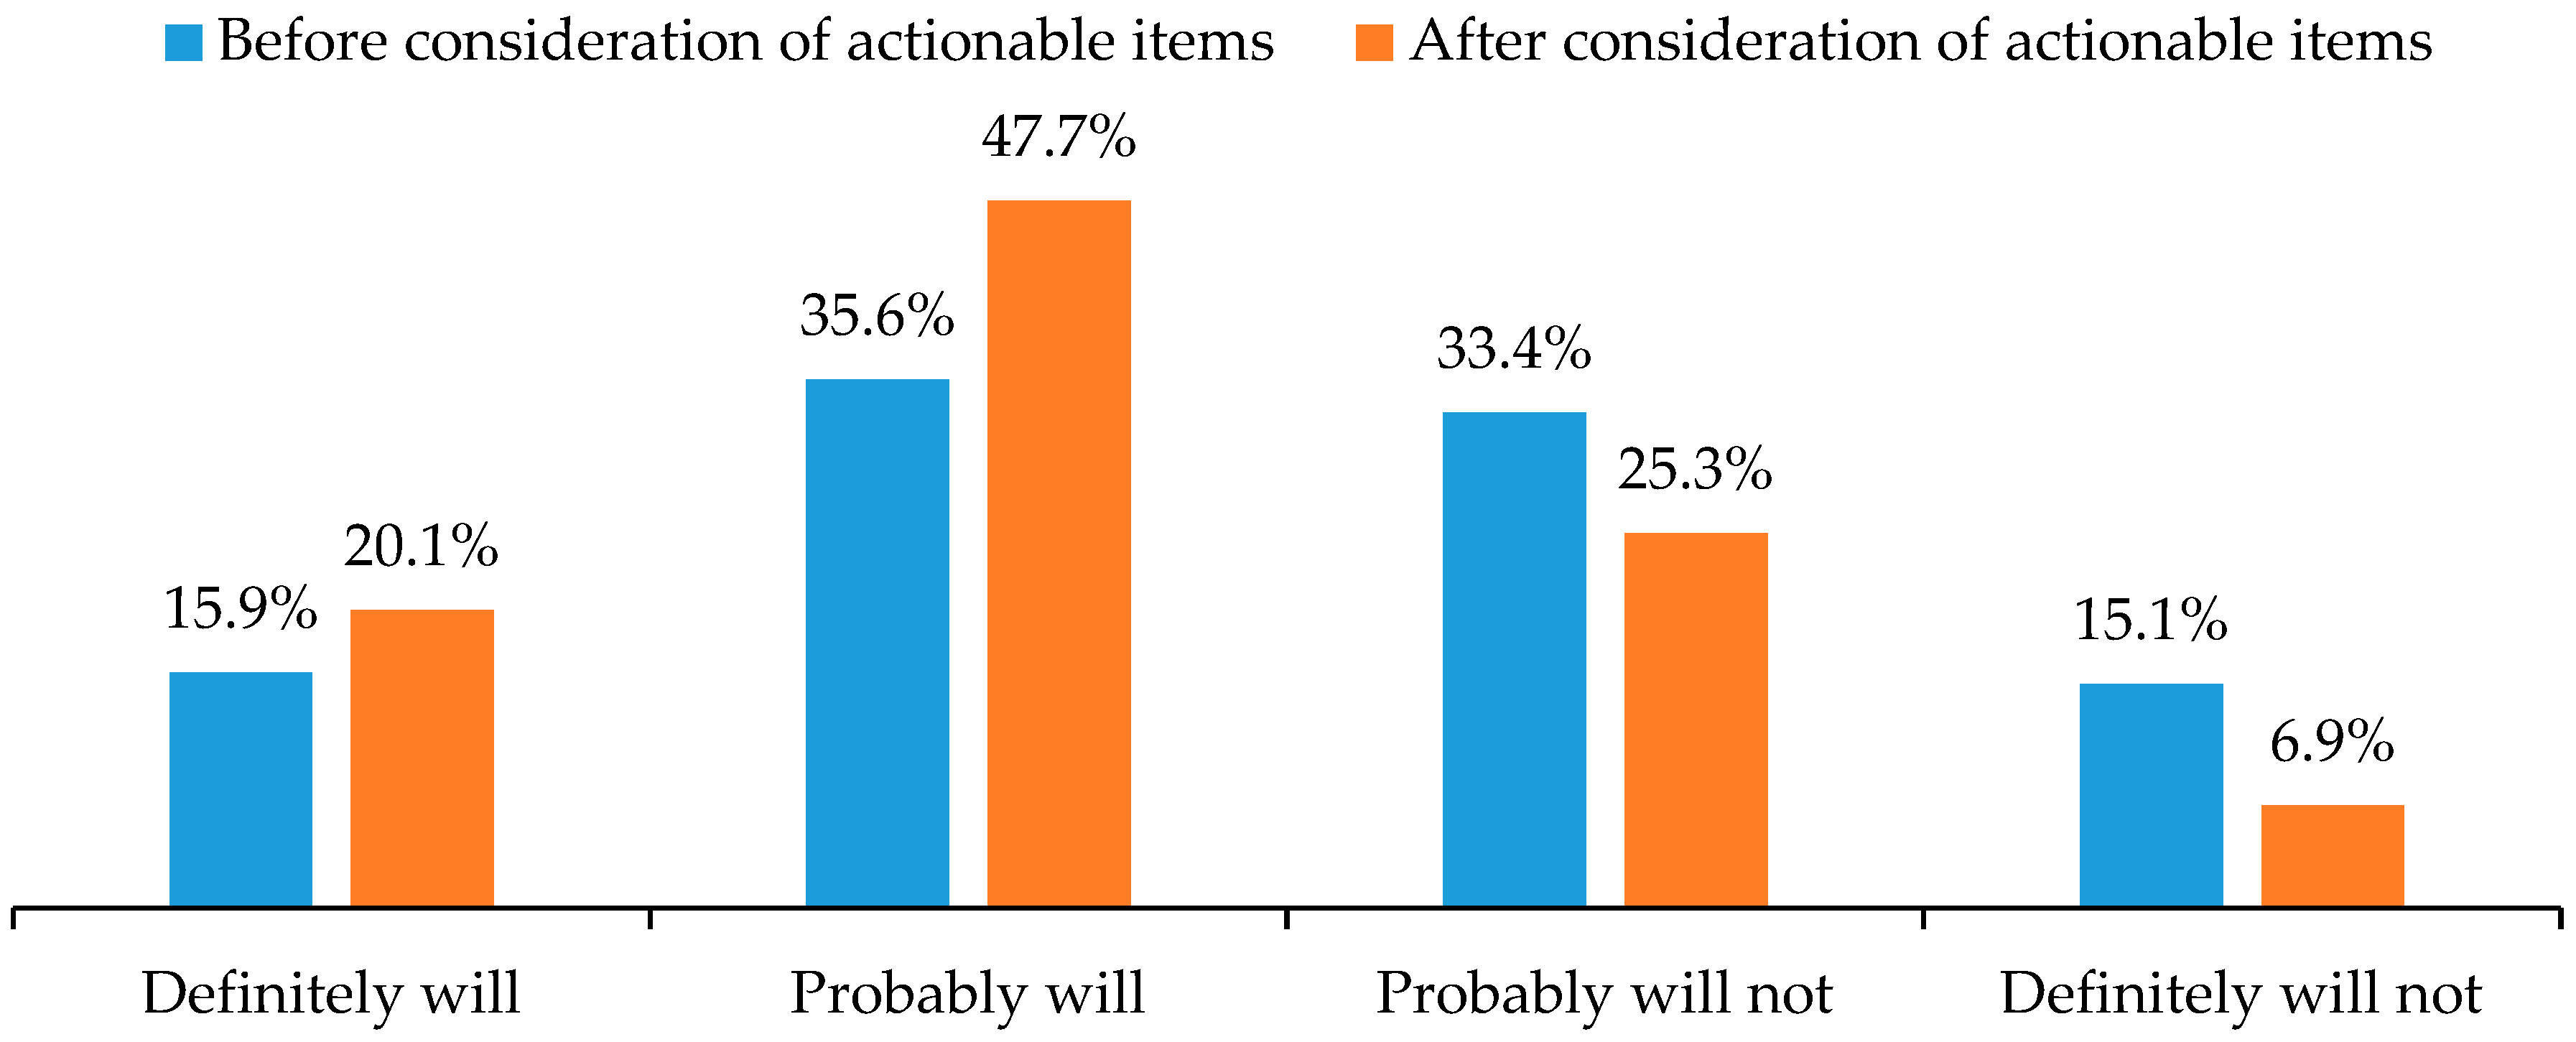
Participants’ willingness to use a pooled rideshare service in the future was examined by comparing responses before and after consideration of the actionable items (Figure 8). The results indicate a notable shift in willingness to adopt pooled rideshare services after the actionable items were presented. The percentage of participants who “definitely will” use pooled rideshare increased from 15.9% to 20.1%, and those who “probably will” increased from 35.6% to 47.7%. This suggests that the proposed enhancements may have a strong positive impact on the potential adoption of pooled rideshare services. Conversely, hesitation and rejection rates declined. The percentage of participants who “probably will not” use pooled rideshare dropped from 33.4% to 25.3%, while those who “definitely will not” fell by more than half, from 15.1% to 6.9%. This reduction in hesitance suggests that the proposed improvements addressed potential users’ concerns, which in turn may make pooled rideshare a more viable option in the future. These findings highlight the effectiveness of actionable items in increasing user willingness, not only by reducing barriers and improving service expectations, but also by raising consumer awareness by bringing attention to features that users may not have previously considered, but find valuable once presented.

4. Discussion

This study is exploratory in nature and focuses on the descriptive analysis of 8,296 participants’ survey responses to understand their transportation behaviors, rideshare experiences, and pooled rideshare preferences. By examining participants’ responses across multiple transportation modes, including personal vehicles, personal rideshare, and pooled rideshare, the study provides insights into shifting mobility patterns, key items influencing pooled rideshare adoption, and the impact of external factors. In addition to analyzing current behaviors and preferences, the study introduced a set of 77 actionable items aimed at addressing user concerns to potentially improve pooled rideshare experiences. By comparing willingness to use pooled rideshare before and after exposure to these actionable items, the study assessed the actionable items’ potential effectiveness in influencing user perceptions regarding pooled rideshare.
The findings of this study highlight shifts in transportation behaviors and rideshare adoption over time (2021 vs. 2025). Notably, the use of personal rideshare services has grown, with usage increasing from 22% to 28%, while the use of public transportation has also increased from 21% to 27%. These trends indicate a growing reliance on or return to shared mobility solutions. Personal vehicle use remains dominant, with 79% of respondents still favoring private transportation. The increased use of pooled rideshare services for essential trips, such as airport transportation and errands, suggests a shift toward integrating rideshare into routine mobility rather than just social or leisure travel. While a decline in pooled rideshare participation was observed for work-related travel and social outings, this may be an artifact in the data, since the new category of large events was added as an option. While personal and pooled rideshare services are used regularly, their frequency of use remains lower compared to personal vehicle use. Personal vehicles are overwhelmingly the primary mode of transportation, with most users driving multiple times a day or at least a few times a week. In contrast, personal and pooled rideshare services are more often used on a situational basis, typically a few times a month or a few times a year.
Cost remains a distinguishing factor, with pooled rideshare fares generally lower than personal rideshare fares, highlighting its service as a budget-friendly alternative. However, pooled rideshare users tend to have longer trip durations compared to personal rideshare users, and this may be partially due to the additional time required for multiple pick-ups and drop-offs. This trade-off between cost savings and travel time efficiency continues to be an important consideration for users when selecting a rideshare option.
Next, to understand the factors influencing participants’ willingness to use pooled rideshare services, the study examined 77 actionable items. Table 10 includes all 70 of the 77 actionable items that showed importance (combined across “strongly agree” and “agree”) to more than half of the respondents. Among all the actionable items, those related to verification and security were rated of the highest importance, with more than 90% of participants agreeing that having the driver’s name and photo, displaying vehicle details such as make, model, and license plate number, and implementing a two-way verification code system are essential for ensuring trust and safety. Similarly, providing a reliable service during peak demand times and allowing users to save the most money and time on their trips were equally important, indicating that users prioritize dependability and efficiency in their pooled rideshare experiences. In addition to security and reliability, driver selection criteria were highly rated, with more than 90% of respondents emphasizing the need for clean driving records, high punctuality ratings, recent background checks, and high passenger ratings. This suggests that users are highly selective regarding who operates their rideshare experience. Vehicle cleanliness and accessibility are highly relevant, with the expectation that pooled rideshare providers should maintain excellent hygiene standards and ensure vehicles are easy to enter and exit.
Topics that fall between 80 and 90% include trip planning, personalization, and customer experience features. Users want faster pick-ups at airports and transit hubs, the ability to book roundtrips in one transaction, and clear pick-up/drop-off zones for large events. Additionally, discounts and price fixation for pre-booked trips, reward programs for frequent riders, and the ability to book recurring trips in advance were highly favored, indicating that pricing incentives and convenience features can further influence pooled rideshare use. Real-time trip tracking and emergency contact options play a crucial role in increasing user confidence in pooled rideshare services.
Several actionable items fell within the 70–80% agreement range. Many of these topics focus on features that enhance ride efficiency, personalization, and inclusivity. The ability to store frequently used destinations and set maximum detour times is valued, suggesting that users desire control over their trip logistics. Additionally, options to choose a conversation-friendly or quiet ride, consult with the driver regarding the temperature and music settings, and transparency on passenger pick-up/drop-off locations were seen as beneficial, but not as universally essential as safety and cost-related topics. A free trial ride for first-time users and ensuring that elderly passengers have access to pooled rideshare services were also supported, indicating that targeted promotions and inclusivity measures can positively influence adoption.
Many additional actionable items, while still relevant, were of lower importance (50–70%). Some of these topics include environmental savings calculations, partnerships with major employers for pooled rideshare incentives, and connectivity features like Wi-Fi and charging ports. Similarly, preferences for fragrance-free vehicles, pet-friendly options, and luxury vehicle choices were of value to some, but certainly not most of the users.

5. Limitations and Future Research

Seven items were not valued by the full group of participants, and these items have 50% or less of respondents selecting “strongly agree” or “agree” (Table 11). Offering beverages or snacks during a pooled rideshare trip was the least valued item, followed by the inclusion of a child and/or booster seat and having a driver of the same gender. The four other low-rated items include passengers who are of the same gender or a similar age, accessibility features such as accommodating wheelchairs, walkers, or assistive devices, and services for unaccompanied minors. Future research should examine many of these items based on targeted subgroups, because their actionable items are anticipated to be valued differently. For example, parents with young children may value booster seats, while parents with young teens may value services specifically for young teenagers who are too young to drive. It is not surprising that only 42% of the sample supports having a child or booster seat, considering that 59% of the participants do not have children. Future efforts should also examine what makes unaccompanied minors using a pooled rideshare comfortable and uncomfortable. The same applies to riders who use assistive devices, a walker, or a wheelchair.
This study assessed the potential effectiveness of the proposed actionable items by comparing willingness to use pooled rideshare before and after exposure to these 77 items. This simple pre–post comparison indicates a positive shift in willingness to use pooled rideshare, with the proportion of participants who responded “definitely will” increasing from 15.9% to 20.1% and those selecting “probably will” rising from 35.6% to 47.7%. Meanwhile, reluctance to use pooled rideshare decreased, as those who selected “probably will not” declined from 33.4% to 25.3%, and “definitely will not” dropped from 15.1% to 6.9%. These findings suggest that addressing users’ concerns through targeted improvements may increase the likelihood of pooled rideshare adoption, yet these differences may be partially due to study participants recently reading the actionable items. It will be valuable to have longitudinal data to see how participants’ views and actual rideshare usage changes over time as actionable items are introduced to the market.
Future analyses should explore specific demographic variables, such as age. It is well known in the automotive field that Gen Z is not as excited to drive as previous generations [65,66,67]. A deeper dive into that generation may provide generation-specific recommendations. The growing retired demographic [68,69,70] may also have generation-specific preferences that deserve special attention. As vehicle prices are expected to increase due to tariffs and increases in the cost of automotive components [71], increases in pooled rideshare may follow. Future efforts should be made to share the utility of the recommendations that are incorporated by TNCs or municipalities.
The goal of this study was to gain a wide national view of pooled rideshare. While pooled rideshare increases with population densities, this study’s sample is largely represented by suburban (50.3%) and rural (19.1%) participants compared to urban (29%) populations, where pooled rideshare is typically more prevalent. Future analyses should compare the results from urban and suburban markets.
While this study compares two independent groups of participants from 2021 and 2025, a longitudinal study including participants from different generations and locations will be beneficial. A longitudinal study will not only allow for comparisons of transportation behaviors across time, but also nuanced perspectives from different geographical regions. A longitudinal study will allow for understanding how parents’ needs change as their children age, but also the different transportation needs of the growing aging population. A longitudinal study will be especially valuable to ensure that users with disabilities receive equitable services across their lifespan.
In addition, this study lays the foundation for promising directions for future research for modeling perspectives. First, the results from this study offer an opportunity to apply the new dataset to the previously developed Pooled Rideshare Acceptance Model (PRAM) and its extension, Pooled Rideshare Acceptance Model Multigroup Analyses (PRAMMA), to examine whether factors such as privacy, safety, and convenience continue to most strongly influence pooled rideshare. With over 8000 participants, this new dataset can support more robust statistical models that may refine or expand upon the existing theoretical constructs. Therefore, future analytical phases of this research can incorporate formal statistical modeling, including estimates of variability such as confidence intervals.
Future research should also move beyond survey-based evaluations to real-world applications by conducting pilot programs, field experiments, or collaborations with Transportation Network Companies (TNCs) to observe the practical adoption and effectiveness of the key actionable items. It will also be important to evaluate many of the actionable items in locations using self-driving vehicles [72]. Together, these steps will help bridge the gap between user-centered research, policy, and/or industry-level decisions that support the growth of pooled rideshare.

6. Conclusions

This exploratory study investigated pooled rideshare preferences among 8296 participants. The study evaluated 77 actionable items designed to address known barriers to rideshare acceptance, such as safety, service reliability, privacy, and convenience. Through a descriptive and comparative analysis, the results revealed that security-related features such as verified driver and vehicle information, emergency contact tools, and trip tracking were among the most valued, with over 90% of respondents agreeing on their importance. Users also expressed strong preferences for reliable service during peak demand (93%), the ability to save time and money (92–93%), and driver-related attributes like clean driving records and high ratings (92%). While vehicle cleanliness and ease of access were similarly important (92–93%), features like in-vehicle refreshments (41% agreed), booster seats (42% agreed), and demographic-based matching with passengers or drivers (46–50% agreed) were among the least valued.
The study demonstrated that presenting participants with potential targeted service improvements led to a notable increase in willingness to use pooled rideshare. The percentage of participants who responded “definitely will” increased from 15.9% to 20.1%, and those who chose “probably will” rose from 35.6% to 47.7%. These findings suggest that addressing users’ concerns through thoughtful and targeted improvements can enhance pooled rideshare adoption. By identifying which features matter most to users, this study offers practical guidance for Transportation Network Companies and policymakers aiming to improve pooled rideshare.
Author Contributions

Conceptualization, R.G. and J.B.; methodology, R.G.; software, R.G.; validation, J.B., L.B., K.K. and Y.J.; formal analysis, Y.J.; investigation, R.G.; resources, R.G., H.S. and J.B.; writing—original draft preparation, R.G.; writing—review and editing, J.B.; funding acquisition, Y.J. All authors have read and agreed to the published version of the manuscript.

Funding

This research was funded by the U.S. Department of Energy, grant number DE-EE0009205.

Data Availability Statement

The data are available upon request due to restrictions, e.g., privacy or ethical.

Acknowledgments

This research was supported by the U.S. Department of Energy’s Office of Energy Efficiency and Renewable Energy (EERE) under award number DE-EE0009205. The views and conclusions presented in this study are those of the authors and do not necessarily represent the official policies or opinions of the U.S. Department of Energy or the U.S. Government. We extend our gratitude to Megan Gilstrap, Krishna Murthy Gurumurthy, Nazmul Arefin Khan, and Joe Paul for their invaluable support and contributions to survey development and data analysis.

Conflicts of Interest

Authors Lisa Boor and Kristin Kolodge were employed by the company J.D. Power. The remaining authors declare that the research was conducted in the absence of any commercial or financial relationships that could be construed as a potential conflict of interest.

References

  1. Transportation Revolution: How Did the Transportation Revolution Change Life in America? Available online: https://socialstudieshelp.com/american-history-topics/transportation-revolution/ (accessed on 22 March 2025).
  2. Schneider, H. Creative Destruction and the Sharing Economy: Uber as Disruptive Innovation; Edward Elgar Publishing: Camberley, UK, 2017. [Google Scholar]
  3. Khamis, A. Smart Mobility: Disruptors. In Smart Mobility; Apress: Berkeley, CA, USA, 2021; pp. 103–129. [Google Scholar]
  4. Young, M.; Farber, S. The Who, Why, and When of Uber and Other Ride-Hailing Trips: An Examination of a Large Sample Household Travel Survey. Transp. Res. Part A Policy Pract. 2019, 119, 383–392. [Google Scholar] [CrossRef]
  5. Stocker, A.; Shaheen, S. Shared Automated Vehicle (SAV) Pilots and Automated Vehicle Policy in the U.S.: Current and Future Developments BT—Road Vehicle Automation 5; Meyer, G., Beiker, S., Eds.; Springer International Publishing: Cham, Switzerland, 2019; pp. 131–147. [Google Scholar]
  6. Shaheen, S.; Cohen, A.; Yelchuru, B.; Sarkhili, S. Mobility on Demand Operational Concept Report; U.S. Department of Transportation, Federal Highway Administration: Washington, DC, USA, 2017. Available online: https://rosap.ntl.bts.gov/view/dot/34258 (accessed on 10 August 2023).
  7. Schaller, B. Can Sharing a Ride Make for Less Traffic? Evidence from Uber and Lyft and Implications for Cities. Transp. Policy 2021, 102, 1–10. [Google Scholar] [CrossRef]
  8. What Is Ridesharing? Available online: https://edu.gcfglobal.org/en/sharingeconomy/legal-and-safety-issues-in-the-sharing-economy/1/ (accessed on 22 March 2025).
  9. Deakin, E.; Frick, K.T.; Shively, K. Dynamic Ridesharing. ACCESS Mag. 2013, 15, 250–260. [Google Scholar] [CrossRef]
  10. Siddiqi, Z.; Buliung, R. Dynamic Ridesharing and Information and Communications Technology: Past, Present and Future Prospects. Transp. Plan. Technol. 2013, 36, 479–498. [Google Scholar] [CrossRef]
  11. Ecolane Ride-Hailing, vs. Ride-Sharing: The Key Difference and Why It Matters. Available online: https://www.ecolane.com/blog/ride-hailing-vs.-ride-sharing-the-key-difference-and-why-it-matters (accessed on 22 March 2025).
  12. Su, H.; Gangadharaiah, R.; Paul, J.; Boor, L.; Kolodge, K.; Gurumurthy, K.M.; Khan, N.A.; Auld, J.; Brooks, J.; Jia, Y. Exploring Demographic Factors Behind the User Preferences in Ridesharing Services. In Proceedings of the 2023 IEEE 26th International Conference on Intelligent Transportation Systems (ITSC), Bilbao, Spain, 24 September 2023; IEEE: Piscataway, NJ, USA; pp. 2370–2375. [Google Scholar]
  13. Nistal, P.D.; Regidor, J.R.F. Comparative Study of Uber and Regular Taxi Service Characteristics. In Proceedings of the 23rd Annual Conference of the Transportation Science Society of the Philippines, Quezon City, Philippines, 8 August 2016; 2016. Available online: https://ncts.upd.edu.ph/tssp/wp-content/uploads/2016/08/Nistal-Regidor.pdf (accessed on 13 August 2017).
  14. Bresciani, C.; Colorni, A.; Costa, F.; Lue, A.; Studer, L. Carpooling: Facts and New Trends. In Proceedings of the 2018 International Conference of Electrical and Electronic Technologies for Automotive, Milan, Italy, 9–11 July 2018; IEEE: Piscataway, NJ, USA, 2018; pp. 1–4. [Google Scholar]
  15. Zhang, W.; Guhathakurta, S.; Fang, J.; Zhang, G. Exploring the Impact of Shared Autonomous Vehicles on Urban Parking Demand: An Agent-Based Simulation Approach. Sustain. Cities Soc. 2015, 19, 34–45. [Google Scholar] [CrossRef]
  16. King, D.A.; Goldwyn, E. Why Do Regulated Jitney Services Often Fail? Evidence from the New York City Group Ride Vehicle Project. Transp. Policy 2014, 35, 186–192. [Google Scholar] [CrossRef]
  17. Hodges, A. Roping the Wild Jitney: The Jitney Bus Craze and the Rise of Urban Autobus Systems. Plan. Perspect. 2006, 21, 253–276. [Google Scholar] [CrossRef]
  18. Eckert, R.D.; Hilton, G.W. The Jitneys. J. Law. Econ. 1972, 15, 293–325. [Google Scholar] [CrossRef]
  19. Definition of Jitney. Available online: https://www.merriam-webster.com/dictionary/jitney (accessed on 16 April 2021).
  20. Chan, N.D.; Shaheen, S.A. Ridesharing in North America: Past, Present, and Future. Transp. Rev. 2012, 32, 93–112. [Google Scholar] [CrossRef]
  21. Bugador, R.C. The Global Expansion of UBER in ASIAN Markets. Int. J. Supply Chain. Manag. 2019, 8, 569–575. [Google Scholar]
  22. Min, S.; So, K.K.F.; Jeong, M. Consumer Adoption of the Uber Mobile Application: Insights from Diffusion of Innovation Theory and Technology Acceptance Model. J. Travel Tour. Mark. 2019, 36, 770–783. [Google Scholar] [CrossRef]
  23. Hoenig, H. The History of Uber. Available online: https://www.investopedia.com/articles/personal-finance/111015/story-uber.asp (accessed on 22 March 2025).
  24. Use Uber in Cities around the World. Available online: https://www.uber.com/global/en/cities/ (accessed on 21 April 2024).
  25. Lyft Revenue and Usage Statistics. Available online: https://www.businessofapps.com/data/lyft-statistics/ (accessed on 21 January 2022).
  26. Didi. Available online: https://www.didiglobal.com/ (accessed on 6 August 2021).
  27. Ola Cabs. Available online: https://www.olacabs.com/ (accessed on 6 August 2021).
  28. Grab. Available online: https://www.grab.com/sg/ (accessed on 6 August 2021).
  29. Chauffeur Privé. Available online: https://www.chauffeurpriveparis.fr/en/ (accessed on 6 August 2021).
  30. Jiang, S.; Chen, L.; Mislove, A.; Wilson, C. On Ridesharing Competition and Accessibility. In Proceedings of the 2018 World Wide Web Conference on World Wide Web—WWW ’18, Lyon, France, 23–27 April 2018; ACM Press: New York, NY, USA, 2018; pp. 863–872. [Google Scholar]
  31. Speta, J.B. Ridesharing Regulation in the USA. In Global Perspectives on Legal Challenges Posed by Ridesharing Companies; Springer: Singapore, 2021; pp. 35–54. [Google Scholar]
  32. Hensley, R.; Padhi, A.; Salazar, J. Cracks in the Ridesharing Market—And How to Fill Them. McKinsey Q. 2017, 3, 48–55. [Google Scholar]
  33. Posen, H.A. Ridesharing in the Sharing Economy: Should Regulators Impose Uber Regulations on Uber Notes. Iowa Law Rev 2015, 101, 405–434. [Google Scholar]
  34. Sami’s Law. Available online: https://www.congress.gov/bill/117th-congress/house-bill/1082/text (accessed on 18 September 2021).
  35. Sarriera, J.M.; Escovar Álvarez, G.; Blynn, K.; Alesbury, A.; Scully, T.; Zhao, J. To Share or Not to Share: Investigating the Social Aspects of Dynamic Ridesharing. Transp. Res. Rec. 2017, 2605, 109–117. [Google Scholar] [CrossRef]
  36. Hoskins, P. Uber Sued in US over Sexual Assault Claims—BBC News. Available online: https://www.bbc.com/news/business-62158976 (accessed on 19 July 2022).
  37. Uber to Pay $2.2m to Disabled Riders over Wait Fees—BBC News. Available online: https://www.bbc.com/news/business-62214567 (accessed on 19 July 2022).
  38. Kerr, D. The Sexual Assault Victims Suing Uber Notch a Legal Victory in Their Long Battle. Available online: https://www.npr.org/2023/10/11/1205135476/sexual-assault-victims-suing-uber-notch-a-legal-victory-in-long-battle (accessed on 9 July 2024).
  39. Marotti, A. Woman Sues Uber After Fellow Passenger Allegedly Stabbed Her During Shared Ride—Chicago Tribune. Available online: https://www.chicagotribune.com/business/ct-uber-pool-attack-lawsuit-0406-biz-20170405-story.html (accessed on 21 March 2021).
  40. Levenson, E. Uber Driver Who Killed 6 in Kalamazoo, Michigan, Rampage Sentenced to Life in Prison | CNN. Available online: https://www.cnn.com/2019/02/05/us/uber-driver-killer-kalamazoo/index.html (accessed on 21 October 2022).
  41. Epstein, K. Uber Lawsuit: Three Women Sue after Saying They Were Raped by Fake Drivers—The Washington Post. Available online: https://www.washingtonpost.com/business/2019/04/10/these-women-say-they-were-raped-by-fake-uber-drivers-now-theyre-suing-company/ (accessed on 21 October 2022).
  42. WhatsMyName Foundation | Rideshare Safety WhatsMyName Foundation | Rideshare Safety. Available online: https://www.whatsmyname.org/safetytips (accessed on 18 September 2021).
  43. Mims, L.K.; Gangadharaiah, R.; Brooks, J.; Su, H.; Jia, Y.; Jacobs, J.; Mensch, S. What Makes Passengers Uncomfortable In Vehicles Today? An Exploratory Study of Current Factors That May Influence Acceptance of Future Autonomous Vehicles. SAE Technical Paper 2023, 2023-01-0675. [Google Scholar] [CrossRef]
  44. Gangadharaiah, R.; Mims, L.; Jia, Y.; Brooks, J. Opinions from Users Across the Lifespan about Fully Autonomous and Rideshare Vehicles with Associated Features. SAE Technical Paper 2024, 6, 309–323. [Google Scholar] [CrossRef]
  45. Morris, E.A.; Pratt, A.N.; Zhou, Y.; Brown, A.; Khan, S.M.; Derochers, J.L.; Campbell, H.; Chowdhury, M. Assessing the Experience of Providers and Users of Transportation Network Company Ridesharing Services; Technical Report; Center for Connected Multimodal Mobility (C2M2), Clemson University: Clemson, SC, USA, 2019. [Google Scholar] [CrossRef]
  46. Siagian, V. Reviewing Service Quality of UBER: Between Customer Satisfaction and Customer Expectation. Abstr. Proc. Int. Sch. Conf. 2019, 7, 1283–1292. [Google Scholar] [CrossRef]
  47. Cheewathanakornkul, C.; Jiratchot, C. Customer Satisfaction and Word of Mouth towards Online Taxi Providers: A Case Study of Grab and Uber. Manag. Res. Pract. 2018, 12, 66–76. [Google Scholar]
  48. Pham, A.; Dacosta, I.; Jacot-Guillarmod, B.; Huguenin, K.; Hajar, T.; Tramèr, F.; Gligor, V.; Hubaux, J.-P. Privateride: A Privacy-Enhanced Ride-Hailing Service. Proc. Priv. Enhancing Technol. 2017, 2017, 38–56. [Google Scholar] [CrossRef]
  49. He, Y.; Ni, J.; Wang, X.; Niu, B.; Li, F.; Shen, X.S. Privacy-Preserving Partner Selection for Ride-Sharing Services. IEEE Trans. Veh. Technol. 2018, 67, 5994–6005. [Google Scholar] [CrossRef]
  50. Zhang, K.; Nie, Y. (Marco) Inter-Platform Competition in a Regulated Ride-Hail Market with Pooling. Transp. Res. E Logist. Transp. Rev. 2021, 151, 102327. [Google Scholar] [CrossRef]
  51. Cha, M.-K.; Lee, H.-J. Does Social Trust Always Explain the Active Use of Sharing-Based Programs?: A Cross-National Comparison of Indian and U.S. Rideshare Consumers. J. Retail. Consum. Serv. 2022, 65, 102515. [Google Scholar] [CrossRef]
  52. Shaheen, S. Shared Mobility: The Potential of Ridehailing and Pooling. In Three Revolutions; Island Press/Center for Resource Economics: Washington, DC, USA, 2018; pp. 55–76. [Google Scholar]
  53. Shaheen, S.; Cohen, A. Shared Ride Services in North America: Definitions, Impacts, and the Future of Pooling. Transp. Rev. 2019, 39, 427–442. [Google Scholar] [CrossRef]
  54. Alonso-González, M.J.; Cats, O.; van Oort, N.; Hoogendoorn-Lanser, S.; Hoogendoorn, S. What Are the Determinants of the Willingness to Share Rides in Pooled On-Demand Services? Transportation 2021, 48, 1733–1765. [Google Scholar] [CrossRef]
  55. Amirkiaee, S.Y.; Evangelopoulos, N. Why Do People Rideshare? An Experimental Study. Transp. Res. Part F Traffic Psychol. Behav. 2018, 55, 9–24. [Google Scholar] [CrossRef]
  56. Lyft Safety Report. Available online: https://assets.ctfassets.net/q8mvene1wzq4/4jxkFTH5YCQK8T96STULMd/4269e14dbcb8578ff64da45df08b8147/Community_Safety_Report.pdf (accessed on 8 November 2022).
  57. Uber Uber Safety Report. Available online: https://uber.app.box.com/s/vkx4zgwy6sxx2t2618520xt35rix022h?uclick_id=feef5907-4ca0-4a35-bc25-07a56e98b08b (accessed on 18 January 2023).
  58. Safety Tips for Riders | Uber. Available online: https://www.uber.com/us/en/ride/safety/tips/ (accessed on 18 September 2021).
  59. Gangadharaiah, R.; Brooks, J.; Boor, L.; Kolodge, K.; Jia, Y. Barriers and Benefits: Understanding Riders’ Views on Pooled Rideshare in the U.S. Vehicles 2025, 7, 13. [Google Scholar] [CrossRef]
  60. Su, H.; Gangadharaiah, R.; Rosopa, E.B.; Brooks, J.O.; Boor, L.; Kolodge, K.; Rosopa, P.J.; Jia, Y. Exploration of Factors That Influence Willingness to Consider Pooled Rideshare. Transp. Res. Rec. J. Transp. Res. Board 2024, 2678, 57–73. [Google Scholar] [CrossRef]
  61. Gangadharaiah, R.; Su, H.; Rosopa, E.B.; Brooks, J.O.; Kolodge, K.; Boor, L.; Rosopa, P.J.; Jia, Y. A User-Centered Design Exploration of Factors That Influence the Rideshare Experience. Safety 2023, 9, 36. [Google Scholar] [CrossRef]
  62. Gangadharaiah, R.; Brooks, J.O.; Rosopa, P.J.; Su, H.; Boor, L.; Edgar, A.; Kolodge, K.; Jia, Y. The Development of the Pooled Rideshare Acceptance Model (PRAM). Safety 2023, 9, 61. [Google Scholar] [CrossRef]
  63. Gangadharaiah, R.; Brooks, J.O.; Rosopa, P.J.; Boor, L.; Kolodge, K.; Paul, J.; Su, H.; Jia, Y. The Influence of Demographic Variables on the Pooled Rideshare Acceptance Model Multigroup Analyses (PRAMMA). Sustainability 2025, 17, 4196. [Google Scholar] [CrossRef]
  64. Gangadharaiah, R. Understanding And Modeling Pooled Rideshare Acceptance: Influential Factors, Preferred User Experiences, and Implications, Clemson University. 2025. Dissertation accepted for publication. [Google Scholar]
  65. Wang, Z.; Chen, X.; Chen, X. (Michael) Ridesplitting Is Shaping Young People’s Travel Behavior: Evidence from Comparative Survey via Ride-Sourcing Platform. Transp. Res. D Transp. Environ. 2019, 75, 57–71. [Google Scholar] [CrossRef]
  66. Azimi, G.; Rahimi, A.; Jin, X. Exploring the Attitudes of Millennials and Generation Xers toward Ridesourcing Services. Transportation 2022, 49, 1765–1799. [Google Scholar] [CrossRef] [PubMed]
  67. Lee, Y.; Circella, G.; Mokhtarian, P.L.; Guhathakurta, S. Are Millennials More Multimodal? A Latent-Class Cluster Analysis with Attitudes and Preferences among Millennial and Generation X Commuters in California. Transportation 2020, 47, 2505–2528. [Google Scholar] [CrossRef]
  68. Mitra, S.K.; Bae, Y.; Ritchie, S.G. Use of Ride-Hailing Services among Older Adults in the United States. Transp. Res. Rec. J. Transp. Res. Board 2019, 2673, 700–710. [Google Scholar] [CrossRef]
  69. Payyanadan, R.P.; Lee, J.D. Understanding the Ridesharing Needs of Older Adults. Travel. Behav. Soc. 2018, 13, 155–164. [Google Scholar] [CrossRef]
  70. Bayne, A.; Siegfried, A.; Beck, L.F.; Freund, K. Barriers and Facilitators of Older Adults’ Use of Ride Share Services. J. Transp. Health 2021, 21, 101055. [Google Scholar] [CrossRef]
  71. OMB Memorandum on Temporary Pause of Agency Grant, Loan, and Other Financial Assistance Programs. Available online: https://www.nafsa.org/regulatory-information/omb-memorandum-temporary-pause-agency-grant-loan-and-other-financial (accessed on 29 March 2025).
  72. Waymo One. Available online: https://waymo.com/waymo-one/ (accessed on 8 August 2024).
Figure 1. Survey flow diagram.
Vehicles 07 00044 g001
Figure 2. Willingness to consider using pooled rideshare in 2021 and 2025.
Vehicles 07 00044 g002
Figure 3. Comparing transportation use between 2021 and 2025.
Vehicles 07 00044 g003
Figure 4. Frequency of use for personal vehicles, personal rideshare, and pooled rideshare.
Vehicles 07 00044 g004
Figure 5. The average duration of a recent trip for personal vehicle, personal rideshare, and pooled rideshare.
Vehicles 07 00044 g005
Figure 6. Reasons for using pooled rideshare services in 2021 and 2025. The option “large events (e.g., sports, concerts)” was added to the 2025 survey question, so “NA”—Not applicable is shown in 2021.
Vehicles 07 00044 g006
Figure 7. Reasons for choosing to use pooled rideshare services in 2021 and 2025. The option “I prefer to socialize with the driver or other riders” was added to the 2025 survey question, so “NA”—Not applicable is shown in 2021.
Vehicles 07 00044 g007
Figure 8. Participants’ (N = 8296) response on their willingness to use pooled rideshare before and after consideration of actionable items.
Vehicles 07 00044 g008
Table 1. Distribution of participants based on their demographics.
Sample
(N = 8296)
Sample
(N = 8296)
Gender Number of children
    Male47.0%    Zero59.2%
    Female52.7%    One19.2%
    Prefer to self-describe0.2%    Two15.5%
    Prefer not to answer0.1%    More than two5.9%
Generation     Prefer not to answer0.2%
    Gen Z (1995–2004) < 27 years15.7%Household annual income
    Gen Y (1977–1994) 27–44 years31.4%    Less than $50,00037.6%
    Gen X (1965–1976) 45–56 years20.2%    $50,000 to $124,99940.2%
    Boomers (1946–1964) 57–75 years29.9%    $125,000 to $249,99916.8%
    Pre-boomers (before 1946) > 75 years2.7%    $250,000 or more3.2%
Geographic area     Prefer not to answer2.2%
    Urban29.0%Number of vehicles in the household
    Suburban50.3%    Zero8.3%
    Rural19.1%    One42.4%
    Prefer not to answer0.4%    Two34.4%
    Don’t know1.2%    More than two14.6%
School completion     Prefer not to answer0.2%
    High school degree or less24.4%Driver’s license
    Some post-secondary training4.5%    Have a valid driver’s license and drive82.6%
    Post-secondary certificate or diploma26.5%    Have a valid driver’s license, but don’t drive6.0%
    University degree or higher44.3%    Do not have a valid driver’s license anymore4.3%
    Prefer not to answer0.3%    Never had a valid driver’s license5.8%
Employment status     Unable/unwilling to drive1.3%
    Employed53.7%Ethnicity
    Seeking employment 9.3%    White/Caucasian72.0%
    Student3.2%    Black/African American16.4%
    Retired24.1%    Asian/Asian American5.4%
    Unable to work7.6%    Hispanic/Latino, or of Spanish origin9.2%
    Prefer not to answer2.0%    Native American/Alaskan Native2.2%
Number of people in the household     Pacific Islander0.5%
    One21.7%    Prefer to self-describe 0.8%
    Two33.6%    Prefer not to answer 0.6%
    Three17.9%Rideshare experience
    More than three26.7%    Has rideshare experience51.2%
    Prefer not to answer0.2%    Does not have rideshare experience48.8%
Table 2. Actionable items from the vehicle selection category.
Actionable Items: Vehicle SelectionStrongly AgreeAgreeDisagreeStrongly Disagree
Has a high cleanliness rating41%52%6%2%
Is easy to get in and out of33%59%7%2%
Has a certified annual maintenance check performed32%54%12%3%
Is disinfected between rides32%52%13%3%
Has sufficient storage space for my cargo (e.g., bags, luggage, etc.)26%61%10%3%
Has seats other than the middle seat available26%57%14%3%
Has extra legroom21%56%20%3%
Is a fragrance-free vehicle21%48%27%4%
Allows me to reserve my preferred seat location in advance19%52%26%4%
Provides connectivity features (e.g., Wi-Fi, charging ports, wireless charging pad, etc.)19%47%29%6%
Is either pet friendly or pet free19%45%27%9%
Has the features and amenities I want (e.g., heated seats, side curtain airbags, automatic emergency braking, etc.)18%50%27%5%
Allows me to control the interior temperature and fan speed16%53%28%4%
Is able to accommodate a wheelchair, walker, or assistive device15%35%38%12%
Is a premium/luxury vehicle13%39%41%7%
Has child and/or booster seat(s) for young children12%30%40%18%
Table 3. Actionable items from the driver selection category.
Actionable Items: Driver SelectionStrongly AgreeAgreeDisagreeStrongly Disagree
Has a clean driving record (i.e., no tickets/citations)46%46%6%2%
Has recently passed a formal background check42%48%8%2%
Has a high punctuality rating41%52%6%2%
Has high passenger ratings39%53%6%2%
Allows me to choose a conversation-friendly or a quiet ride27%58%12%3%
Consults passenger preference for features like temperature setting, music, etc.25%59%14%3%
Is the same gender as me13%33%45%9%
Offers me a beverage and/or snack during my trip12%29%46%13%
Table 4. Actionable items from the fellow passengers category.
Actionable Items: Other PassengersStrongly AgreeAgreeDisagreeStrongly Disagree
Are preferred riders because I know them20%52%23%5%
I have ridden with before17%53%23%7%
I can view their profile prior to match my preferences, similar to a dating app16%43%32%9%
Are also riding alone14%59%23%4%
Are the same gender as me13%37%42%9%
Are a similar age as me10%40%42%8%
Table 5. Actionable items from the safety category.
Actionable Items: SafetyStrongly AgreeAgreeDisagreeStrongly Disagree
Provides me the driver’s name and photo to confirm that I’m getting in the correct vehicle49%46%4%1%
Provides the vehicle make, model and license plate number45%48%6%1%
Provides two-way verification code to confirm that I’m getting in the correct vehicle41%51%8%1%
Has an emergency button in the vehicle and/or on the app to connect with local emergency services and shares my location with authorities40%48%11%2%
Allows my trip to be tracked in real-time by a person of my choosing37%51%11%2%
Have other passengers’ profiles verified by the rideshare company30%52%16%2%
Indicates if the child safety locks are unlocked/disabled on the vehicle28%48%20%5%
Helps educate me on safety best practices for using pooled rideshare25%54%18%3%
Table 6. Actionable items from the rider experience category.
Actionable Items: Rider ExperienceStrongly AgreeAgreeDisagreeStrongly Disagree
Provides reliable service during peak demand times38%55%6%1%
Provides faster pick-ups at airports and transit stations33%55%10%2%
Allows me to provide feedback to the company after the ride32%58%9%2%
Allows me to book roundtrips in one booking32%58%9%2%
Offers a program that rewards frequent riders32%55%12%2%
Identifies dedicated drop-off/pick-up zones for large events making it easy for me to know where to go31%58%9%2%
Provides discounts or price locking for pre-booked regular trips (e.g., every weekday at 7:00 a.m.)31%56%11%2%
Allows me to book recurring trips in advance (e.g., every weekday at 7:00 a.m.)28%57%12%2%
Stores my frequently selected destinations for easy booking24%55%18%3%
Provides the option to book multiple short trips with the driver waiting at each stop23%57%17%2%
Calculates my estimated cost savings by using a pooled rideshare vs. my own vehicle (e.g., insurance, car payment, fuel, parking, etc.)23%53%21%4%
Allows for one tap rebooking21%60%17%3%
Works with other community transit services (e.g., bus, rail, subway, etc.) to allow an integrated mobility solution to plan my trip21%54%21%4%
Calculates the estimated experiential benefits of using a pooled rideshare vs. my own vehicle (e.g., drop off location vs. walking, time savings, meeting others, etc.)20%52%24%4%
Calculates my accumulated environmental savings by using a pooled rideshare vs. my own vehicle17%44%32%7%
Table 7. Actionable items from the specialized services category.
Actionable Items: Specialized Services Strongly AgreeAgreeDisagreeStrongly Disagree
Services elderly riders29%54%14%4%
Creates an initial registration process that clearly communicates policies and procedures (e.g., ride cancellations, delays, etc.)27%60%11%2%
Offers one free pooled rideshare as a trial24%57%16%3%
Services those without previous driving experience or those who don’t enjoy driving18%51%25%7%
Offers demonstrations, training, and other in-person educational activities to introduce pooled rideshare to brand new users16%49%30%5%
Services non-native English speaking riders15%45%32%9%
Services unaccompanied minor riders14%37%38%12%
Highlights the opportunity to meet others (e.g., new friends, new business relationships, etc.)13%39%38%9%
Table 8. Actionable items from the trip route category.
Actionable Items: Trip RouteStrongly AgreeAgreeDisagreeStrongly Disagree
Allows me to save the most money getting to my destination39%53%6%1%
Allows me to save the most time getting to my destination35%58%6%1%
Shows the route in progress with current traffic information31%59%8%1%
Shows the route in progress with other passenger’s pick-up/drop-off locations29%58%11%2%
Gives the highest priority to me during pick-up/drop-off29%57%12%2%
Allows parents to pre-approve locations for independent minor passengers28%48%19%6%
Allows me the option to get picked up and/or dropped off at a location close to, but not exactly at, my origin/destination for a discounted fare26%56%15%3%
Allows me to set the route beforehand23%53%22%2%
Allows me to set my own maximum detour time compared to taking a personal rideshare21%57%20%2%
Table 9. Actionable items from the additional services category.
Actionable items: Additional ServicesStrongly AgreeAgreeDisagreeStrongly Disagree
Explains their data protection and privacy rules26%56%15%3%
Explains how pooled rideshare works, safety features, and tips for traveling with children24%57%16%3%
Promotes using pooled rideshare services during high-traffic events (e.g., concerts, sporting events, etc.)23%57%18%3%
Is environmentally conscious23%52%21%4%
Partners with specific organizations (e.g., Mothers Against Drunk Drivers, rape crisis centers, AARP, etc.)23%48%24%5%
Partners with employers (e.g., universities, hospitals, companies, etc.) to provide promotions for using pooled rideshare22%54%20%4%
Ensures leisure/business travelers are aware of available pooled rideshare options at their destination20%61%16%3%
Table 10. This shows 70 of 77 pooled rideshare (PR) actionable items that were rated above 50% when “strongly agree” or “agree” were combined.
CategoryCombined Percentage of Strongly Agree and Agree of Actionable Items (Part 1)CategoryCombined Percentage of Strongly Agree and Agree of Actionable Items (Part 2)
SafetyProvides me the driver’s name and photo to confirm that I’m getting in the correct vehicle94%SafetyHave other passengers’ profiles verified by the rideshare company81%
Rider experienceProvides reliable service during peak demand times93%Rider experienceAllows for one tap rebooking81%
Trip routeAllows me to save the most money getting to my destination93%Specialized servicesOffers one free pooled rideshare as a trial81%
SafetyProvides the vehicle make, model and license plate number93%Additional servicesExplains how PR works, safety features, and tips for traveling with children81%
Vehicle selectionHas a high cleanliness rating93%Rider experienceProvides the option to book multiple short trips with the driver waiting at each stop81%
Driver selectionHas a high punctuality rating93%Additional servicesPromotes using pooled rideshare services during high-traffic events 79%
Trip routeAllows me to save the most time getting to my destination92%SafetyHelps educate me on safety best practices for using pooled rideshare79%
Driver selectionHas a clean driving record (i.e., no tickets/citations)92%Rider experienceStores my frequently selected destinations for easy booking79%
Driver selectionHas high passenger ratings92%Trip routeAllows me to set my own maximum detour time compared to taking a personal rideshare78%
Vehicle selectionIs easy to get in and out of92%Vehicle selectionHas extra legroom77%
SafetyProvides two-way verification code to confirm that I’m getting in the correct vehicle91%Additional servicesPartners with employers to provide promotions for using pooled rideshare76%
Trip routeShows the route in progress with current traffic information91%Trip routeAllows me to set the route beforehand76%
Driver selectionHas recently passed a formal background check90%SafetyIndicates if the child safety locks are unlocked/disabled on the vehicle76%
Rider experienceAllows me to provide feedback to the company after the ride90%Rider experienceCalculates my estimated cost savings by using a pooled rideshare vs. my own vehicle 76%
Rider experienceAllows me to book roundtrips in one booking89%Rider experienceWorks with other community transit services (e.g., bus, rail, subway, etc.) to allow an integrated mobility solution to plan my trip75%
Rider experienceIdentifies dedicated drop-off/pick-up zones for large events making it easy for me to know where to go89%Trip routeAllows parents to pre-approve locations for independent minor passengers75%
Rider experienceProvides faster pick-ups at airports and transit stations88%Additional servicesIs environmentally conscious75%
SafetyHas an emergency button in the vehicle and/or on the app to connect with local emergency services and shares my location with authorities88%Fellow passengersAre preferred riders because I know them72%
Trip routeShows the route in progress with other passenger’s pick-up/drop-off locations87%Fellow passengersAre also riding alone72%
SafetyAllows my trip to be tracked in real time by a person of my choosing87%Rider experienceCalculates the estimated experiential benefits of using a PR vs. my own vehicle72%
Specialized servicesCreates an initial registration process that clearly communicates policies and procedures 87%Additional servicesPartners with specific organizations 71%
Vehicle selectionHas sufficient storage space for my cargo (e.g., bags, luggage, etc.)87%Vehicle selectionAllows me to reserve my preferred seat location in advance70%
Rider experienceProvides discounts or price locking for pre-booked regular trips 87%Fellow passengersI have ridden with before70%
Rider experienceOffers a program that rewards frequent riders86%Vehicle selectionIs a fragrance-free vehicle69%
Vehicle selectionHas a certified annual maintenance check performed86%Specialized servicesServices those without previous driving experience or those who don’t enjoy driving69%
Trip routeGives the highest priority to me during pick-up/drop-off86%Vehicle selectionAllows me to control the interior temperature and fan speed69%
Rider experienceAllows me to book recurring trips in advance (e.g., every weekday at 7:00 am)86%Vehicle selectionHas the features and amenities I want 68%
Driver selectionAllows me to choose a conversation-friendly or a quiet ride85%Vehicle selectionProvides connectivity features 66%
Vehicle selectionIs disinfected between rides84%Specialized servicesOffers demonstrations, training, and other in-person educational activities to introduce pooled rideshare to brand new users65%
Driver selectionConsults passenger preference for features like temperature setting, music, etc.84%Vehicle selectionIs either pet friendly or pet free64%
Vehicle selectionHas seats other than the middle seat available83%Rider experienceCalculates my accumulated environmental savings by using a PR vs. my own vehicle61%
Specialized servicesServices elderly riders83%Specialized servicesServices non-native English speaking riders59%
Trip routeAllows me the option to get picked up and/or dropped off at a location close to, but not exactly at, my origin/destination for a discounted fare83%Fellow passengersI can view their profile prior to match my preferences, similar to a dating app59%
Additional servicesExplains their data protection and privacy rules82%Specialized servicesHighlights the opportunity to meet others 53%
Additional servicesEnsures leisure/business travelers are aware of available pooled rideshare options at their destination82%Vehicle selectionIs a premium/luxury vehicle53%
Table 11. The seven lowest rated actionable items with a combined rating of 50% or below.
CategoryCombined Percentage of Strongly Agree and Agree with Actionable Items
Specialized servicesServices unaccompanied minor riders50%
Fellow passengersAre a similar age as me50%
Fellow passengersAre the same gender as me50%
Vehicle selectionIs able to accommodate a wheelchair, walker, or assistive device49%
Driver selectionIs the same gender as me46%
Vehicle selectionHas child and/or booster seat(s) for young children42%
Driver selectionOffers me a beverage and/or snack during my trip41%
Disclaimer/Publisher’s Note: The statements, opinions and data contained in all publications are solely those of the individual author(s) and contributor(s) and not of MDPI and/or the editor(s). MDPI and/or the editor(s) disclaim responsibility for any injury to people or property resulting from any ideas, methods, instructions or products referred to in the content.