Article

Electric Vehicles Charged with Solar-PV: A Brazilian Case Study for 2030

by
Danilo da Costa
and
Vladimir Rafael Melian Cobas
*
Excellence Group in Thermal Power and Distributed Generation-NEST, Institute of Mechanical Engineering, Federal University of Itajubá-UNIFEI, Av. BPS 1303, cep 37500-903, Itajubá 37500-903, MG, Brazil
*
Author to whom correspondence should be addressed.
Vehicles 2023, 5(4), 1743-1759; https://doi.org/10.3390/vehicles5040095
Submission received: 8 September 2023 / Revised: 15 November 2023 / Accepted: 24 November 2023 / Published: 30 November 2023
(This article belongs to the Special Issue Sustainable Traffic and Mobility)

Abstract

:
Electric vehicles and photovoltaic power stations can play an important role in replacing fossil fuels. This article presents a case study on the placement of charging stations powered by photovoltaic energy along an important highway in Brazil. A demand model was adopted to elaborate three scenarios for 2030 with different participation levels of electric vehicles in the Brazilian market. An optimized allocation model was used to derive the location and number of charging stations required to meet the charging demand. The results provided a list of adequate locations for installing the charging stations and offered insights into the consumed electricity and greenhouse gas emissions that could be mitigated by these actions. A financial analysis was conducted, and it was determined that the charging costs, based on the Internal Rate of Return calculation, were 10%. These costs were compared to the fueling costs of other traditional vehicles. The results showed that the costs can be 72% lower than the cost of refueling current conventional automobiles. The results of this study can serve as a reference in the public policy debate, as well as for investors in fast charging stations.

1. Introduction

In 2017, a total of 9717 Mtoe of energy was consumed worldwide, with 41.0% derived from fossil fuels. In the same year, 25,606 TWh of electricity was generated globally, and 64.8% of this electricity was generated from fossil fuels (FFs), e.g., coal, oil, oil derivatives, and natural gas. Brazil holds a privileged position in this context. In 2018, the Brazilian energy matrix accounted for a 45.3% share of the global renewable energy sector, while the rest of the world had a 13.7% share in 2016. In 2018, renewable energy constituted 83.3% of the energy matrix, placing Brazil behind only China and the USA [1,2].
The transportation sector is the main contributor to pollution in cities and one of the greatest contributors to greenhouse gas (GHG) emissions worldwide. In Europe, the transportation sector is responsible for about 25% of GHG emissions [3]. In Brazil, the situation is even more problematic since 192.7 Mt CO2 was emitted in 2018, representing 46.3% of all CO2 emissions in the same period. Furthermore, the transportation sector is responsible for 32.7% of energy consumption in the country, making it the largest energy consumer [2]. Electric vehicles (EVs) could help maintain local air quality, and if powered by renewable energy like photovoltaic solar energy, it could significantly reduce CO2 emissions. References [4,5] evaluated the incentive policies for adopting EVs in different countries and analyzed the impacts on market participation. Incentives for adopting EVs can be classified as financial incentives, technological incentives, or charging station infrastructure incentives.
Developing a dedicated infrastructure for recharging EVs is crucial for popularizing the use of EVs. To enable extended trips, highways must have adequate installed charging systems along the main routes. Many private companies and government policies are engaged in developing solutions for fast charging stations along highways. These companies may belong to the petroleum and utility sector, OEMs consortia, and, often, manufacturers of EVs themselves [6,7].
Although Brazil does not yet have a specific incentive program for EVs, a federal program called Route 2030 was established in 2015 to increase the level of involvement of the automotive sector. The program seeks to amplify the participation of the Brazilian automotive industry in developing sustainable environmental principles and good citizenship principles and assist in reducing the costs of various technologies [8]. The program set incentives for the electric mobility sector by reducing the Industrial Product Tax (IPI) for hybrid vehicles and fully electric vehicles [9].
Some incentives in Brazil have sought to ‘electrify’ the Brazilian highway network so that EVs may take longer trips, as stated in [10]. The authors of reference [11] evaluated the incentive policies for adopting EVs in different countries and analyzed the impacts on market participation. These incentives can be classified as financial, technological, or charging station infrastructure incentives. Financial incentives are usually given to consumers and producers and assume the form of credits, reductions, tax exemptions, or direct subsidies. They also come in the form of off-road tax exemptions, lower tariffs for electrical consumption, or free parking privileges. Technological incentives usually involve direct investment in research and development to assist in technological developments and reduce production costs for the mass production of EVs. Finally, infrastructure investments are directly related to EVs. They can be promoted in many ways by investors, managers, or suppliers, who are primarily responsible for the investment, construction, operation, and management of EV charging stations, with the latter being responsible for generating, distributing, and storing electricity.
There are no known studies on how to ‘electrify’ a specific highway in Brazil. The Fernão Dias highway is one of the main Brazilian highways, with about 25,000 vehicles passing through it daily and extending across an area that includes 16.6 million inhabitants [12]. It only has two electric charging stations, which are located in Mariporã, to the south, and in Extrema, to the north. Both stations are equipped with Type 2 connectors with a 22 kW capacity and can only attend one vehicle at a time. These charging stations act as a differential for the business where they are located, and they did not consider a method based on technical–financial criteria.
This article measures the impact of consuming electricity for EV charging and GHG emissions by ‘electrifying’ the Fernão Dias highway using photovoltaic energy. It predicts the potential use of EVs and evaluates the network availability to avoid the impact on the power quality, as stated by [13,14].
Furthermore, we sought to analyze the hypothetical cost or price for the charging service. Three different scenarios were considered for 2030 by applying a demand model with different levels of market penetration for EVs in Brazil; a more detailed study on this cost can be found in [15].
This kind of study could help decision-makers, potential users, and investors understand the potential of EV use in the Brazilian transport network.
These are the contributions of this article:
A mathematic model to predict the electrification of a highway.
The techno-economic evaluation of three different scenarios for this electrification.
The power dimensioning, number, and location of each charging station considering the actual electric network and the future load increase by region involved.

2. Materials and Methods

The method used in this study can be divided into three steps, described as follows. Figure 1 shows the main steps and criteria followed.
The first step of the method is to estimate the number of EVs in operation on the highway (BR-381) in 2030. Historical data were collected on the number of vehicles in operation in Brazil, the number of registered EVs in Brazil, the traffic flow through toll stations on BR-281, the Brazilian Gross Domestic Product (GPD), and the Brazilian population from 2009 to 2018. These data were used in two models, the DGS model and the Bass model, respectively. The first model estimates the number of vehicles in operation in Brazil for 2030, and the second model estimates the percentage of EVs in these numbers. Three scenarios were considered in the Bass model. These were the Base scenario (5% EV share), the Moderate scenario (up to 10% EV share), and the Accelerated scenario (up to 25% EV share). Based on the relationship between the traffic data collected from toll stations along the Fernão Dias highway and the total number of vehicles in operation in Brazil, the daily total EV traffic flow on Fernão Dias for 2030 was estimated, considering the vehicle registration numbers from the states through which the highway passes, i.e., São Paulo and Minas Gerais, respectively, and a safety factor for vehicles from other states.
The second step of the method was to determine the location and quantity of EV charging stations for each scenario according to the daily flows obtained in the previous step, including the number of available EVs in operation in Brazil on BR-381. The method proposed in [16] was used for this. A list of the primary and secondary nodes related to points of interest along the highway was created. The vehicle flows were projected for each section of the highway according to the criteria defined in Section 2.2. A distance analysis was made for each node with respect to the distance between the necessary service areas to host the charging stations based on the parameters defined for each node.
After obtaining the results from the service area allocation model, the availability of the electric energy distribution network and the proximity of each node were analyzed. If the network was unavailable, the projections to reduce the distance between the service areas were adjusted so that service areas were placed closer to available electricity network connection points with adequate capacity for meeting strategic charging demand.
After validating the locations of the charging stations, the model calculated the necessary number of charging stations to meet the demand from the flow of EVs for each respective service area. The posterior node (or the set of posterior nodes) after the service areas was removed from the list. If the list had no nodes, the service allocation process was complete. Otherwise, the process must be repeated for the next node.
With the number of charging stations defined and, by consequence, the daily consumed electric energy for charging the EVs in circulation on Fernão Dias highway, the size and dimension of the photovoltaic systems needed to meet the demand for each scenario were calculated. This was carried out using the PVSystTM V7.2 software system.
With the results of the project dimensions for the photovoltaic systems, the impacts on consumed electricity and the relationship with GHG emissions were measured. These two factors are related to EV charging from photovoltaic systems. The data and method described in [16] were used to evaluate the impact of GHG emissions.
Finally, an economic feasibility analysis was conducted by using market data to determine the selling price of energy for EVs on the highway, taking into account the Internal Rate of Return (IRR) of the investment, which was set at 10%.

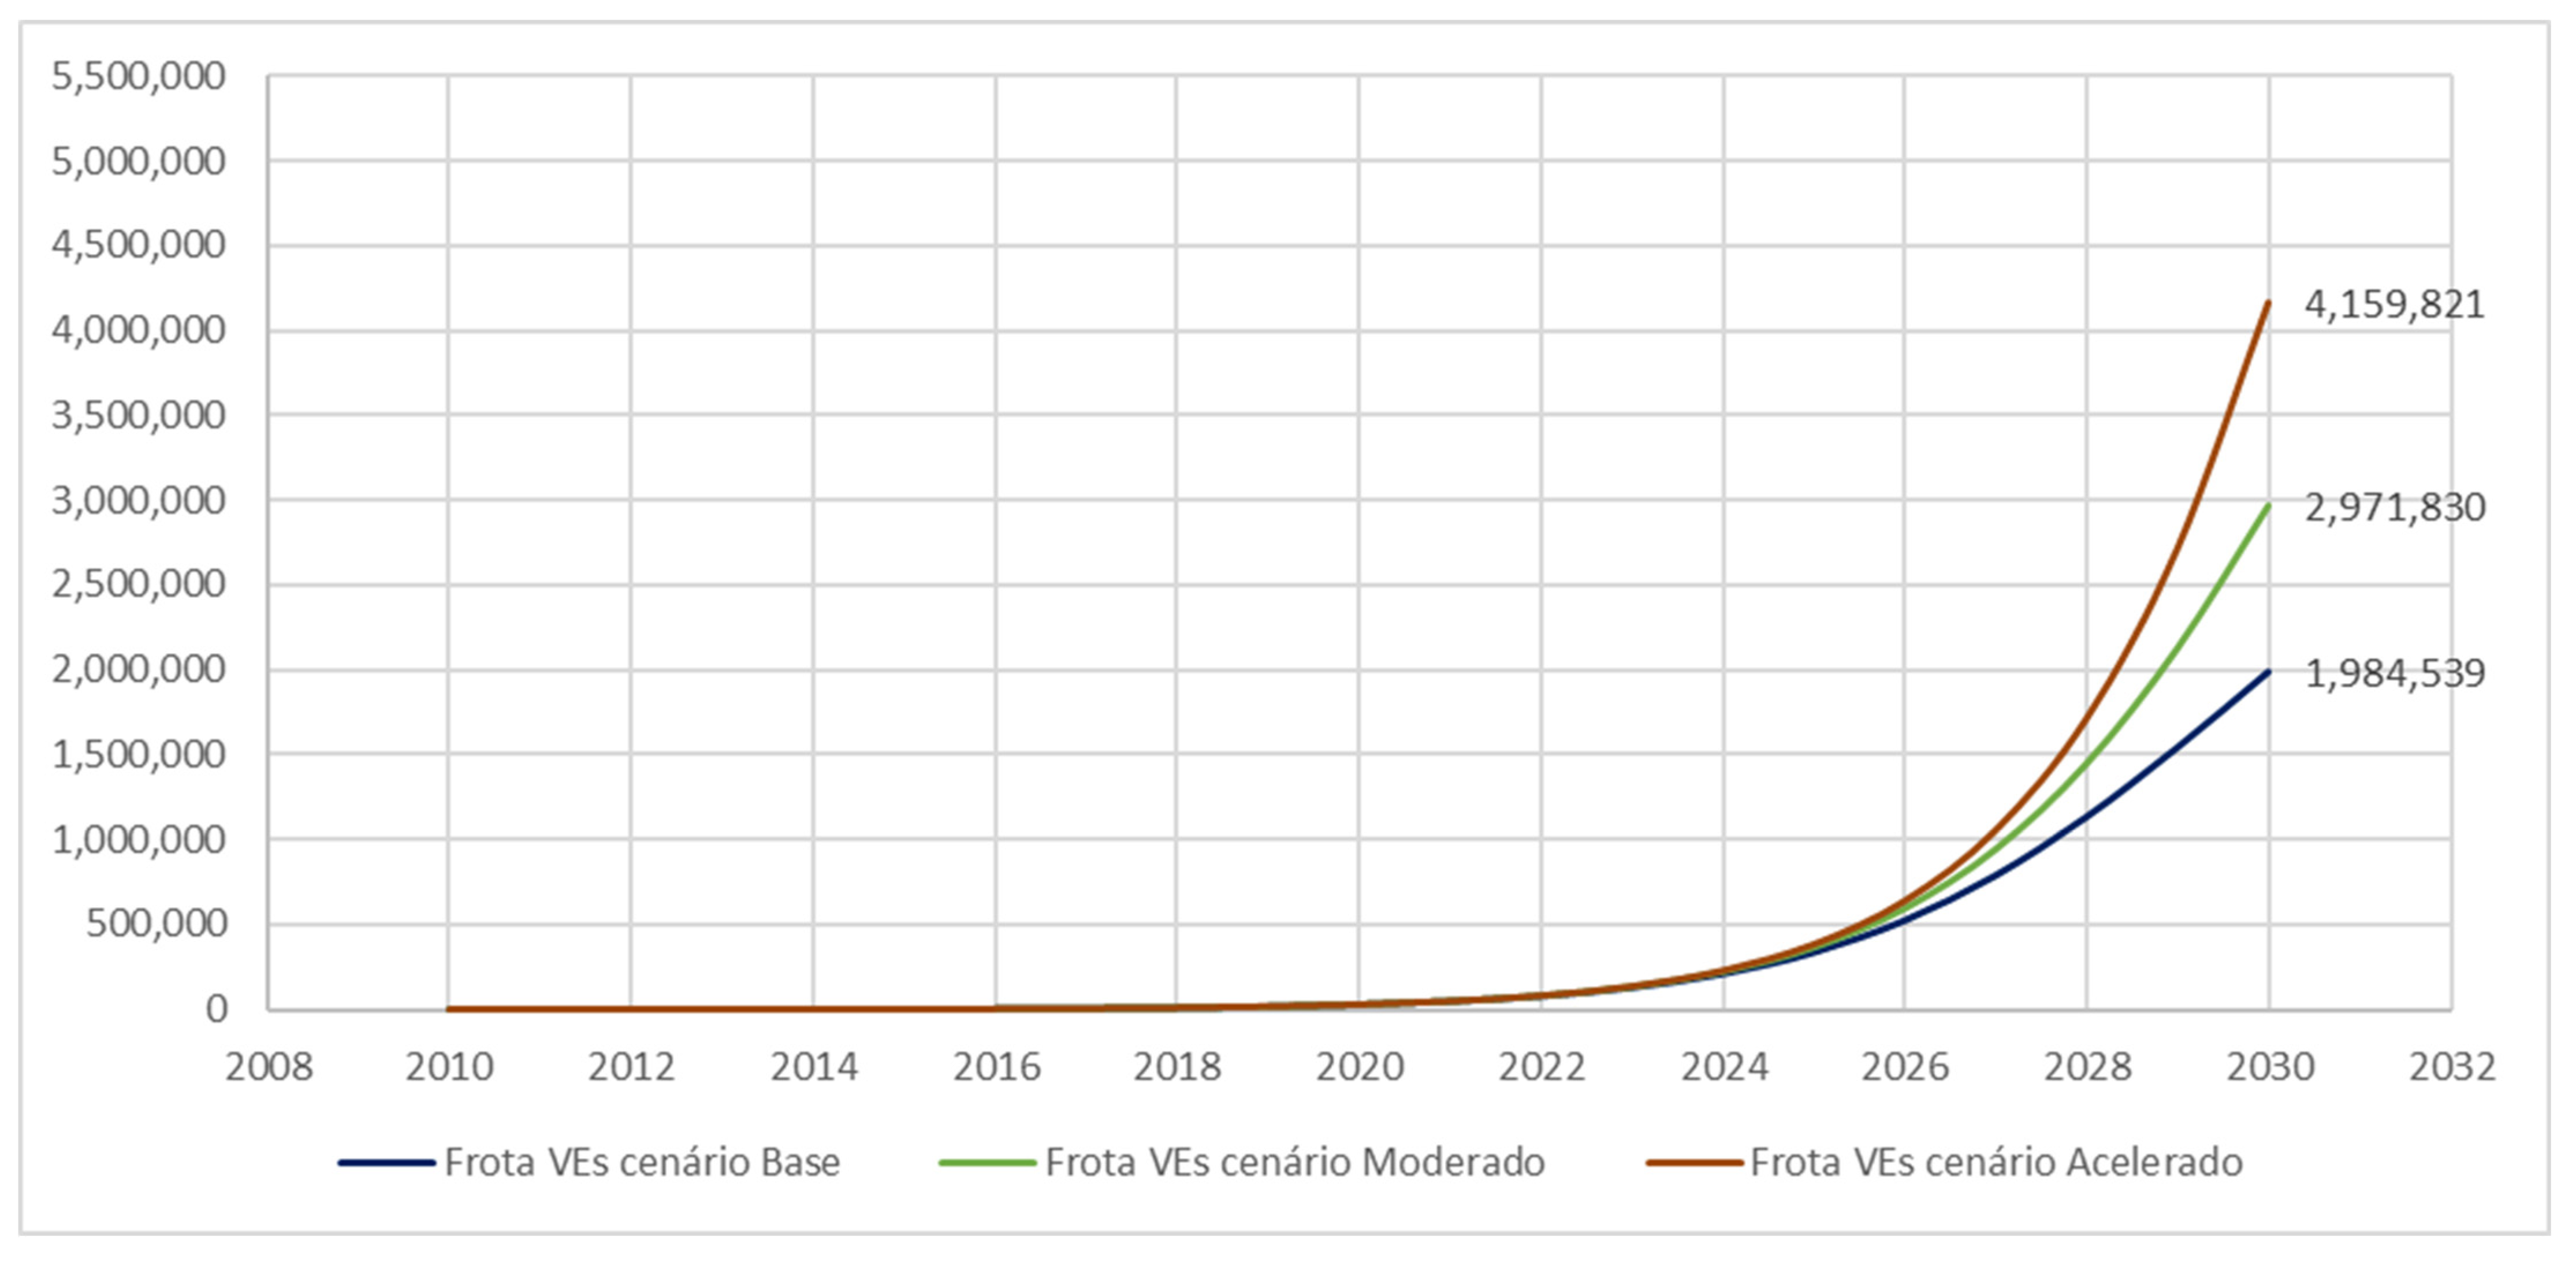
2.1. Estimate the Flow of EVs on the Fernão Dias Highway for 2030

To estimate the daily flow of EVs on the Fernão Dias highway, two projection models were used, the DGS model and the Bass model, as proposed by [17]. The DGS model was developed by [18] to estimate the saturation level of vehicles in the market of a given country, taking into account the number of circulating vehicles, the population, and the per capita income. The model uses the following equation.
V t = γ i θ e α e β i G D P t + ( 1 θ ) V t 1
Data related to the Brazilian population are available in [19], along with the population growth projections from 2019 to 2030. The GDP data per capita from 2009 to 2018 were obtained from [20]. The GDP projections per capita were estimated considering the growth projections presented in the technical notes of the Economic Scenario for the Next Ten Years (2020–2029) [21].
Although the α e β coefficients have already been determined for Brazil by [19], unlike what was obtained in [17], we decided to adjust α e β using the least squares method based on historical data referent to the total number of vehicles in operation from 2009 to 2018. We used data published by the National Syndicate of the Automotive Vehicle Component Industry, available in [22].
Table 1 shows the coefficients adjusted according to the historical data on total circulating vehicles.
To determine the share of EVs in the national automotive sector, the Bass diffusion model was used, as described in [23]. Bass proposes a diffusion model for sales of new products, assuming that the time of purchase is related to the number of previous buyers. The buyers are separated into two categories: innovators, who acquire the product in the early stages after its launch, and imitators, who acquire new products following innovators. The Bass diffusion model is expressed in Equation (2).
F t = 1 e p q t 1 + q p e p + q t
Parameters p and q were adjusted using the least squares method, given the historical data on circulating EVs available in [24]. Due to the fact that the historical series of EVs is relatively recent and because EVs are still quite innovative products, three different scenarios for market penetration were proposed, which were the Base scenario (M = 5%), the Moderate scenario (M = 10%), and the Accelerated scenario (M = 25%). Table 2 shows the adjusted coefficient for each penetration scenario.
Federal Highway BR-381, used for the study, is one of the main highways in Brazil, extends about 1200 kilometers, and crosses through the states of São Paulo, Minas Gerais, and Espirito Santo [25]. The stretch of highway connects the capital cities São Paulo and Belo Horizonte. The highway has 8 toll stations, where about 250,000 vehicles circulate daily. The National Agency of Terrestrial Transportation (ANTT) has made public a set of data regarding the monthly traffic flow registered at the 8 toll stations in both directions from 2009 to 2019 [26]. The ratio of average annual traffic at each toll station and the total number of vehicles in circulation in Brazil from 2009 to 2019 is provided using Equations (3) and (4). It is assumed that this relationship will last from 2020 to 2030.
m = i n T r i F c i n
T r p j = m F c p j
The following considerations were adopted to determine the daily flow of EVs on the Fernão Dias highway:
  • Because the highway is an interstate, the EVs from the states of São Paulo and Minas Gerais that circulate on the highway were considered, with an additional safety margin of 10% for vehicle traffic from other states. The percentage of circulating vehicles from these two states was obtained from [22].
  • The share of EVs circulating in each scenario for 2030 was applied to the projected daily flow of traffic on the highway.
  • The monthly traffic flows available in [26] were divided by the number of days in each month to determine daily traffic flows.

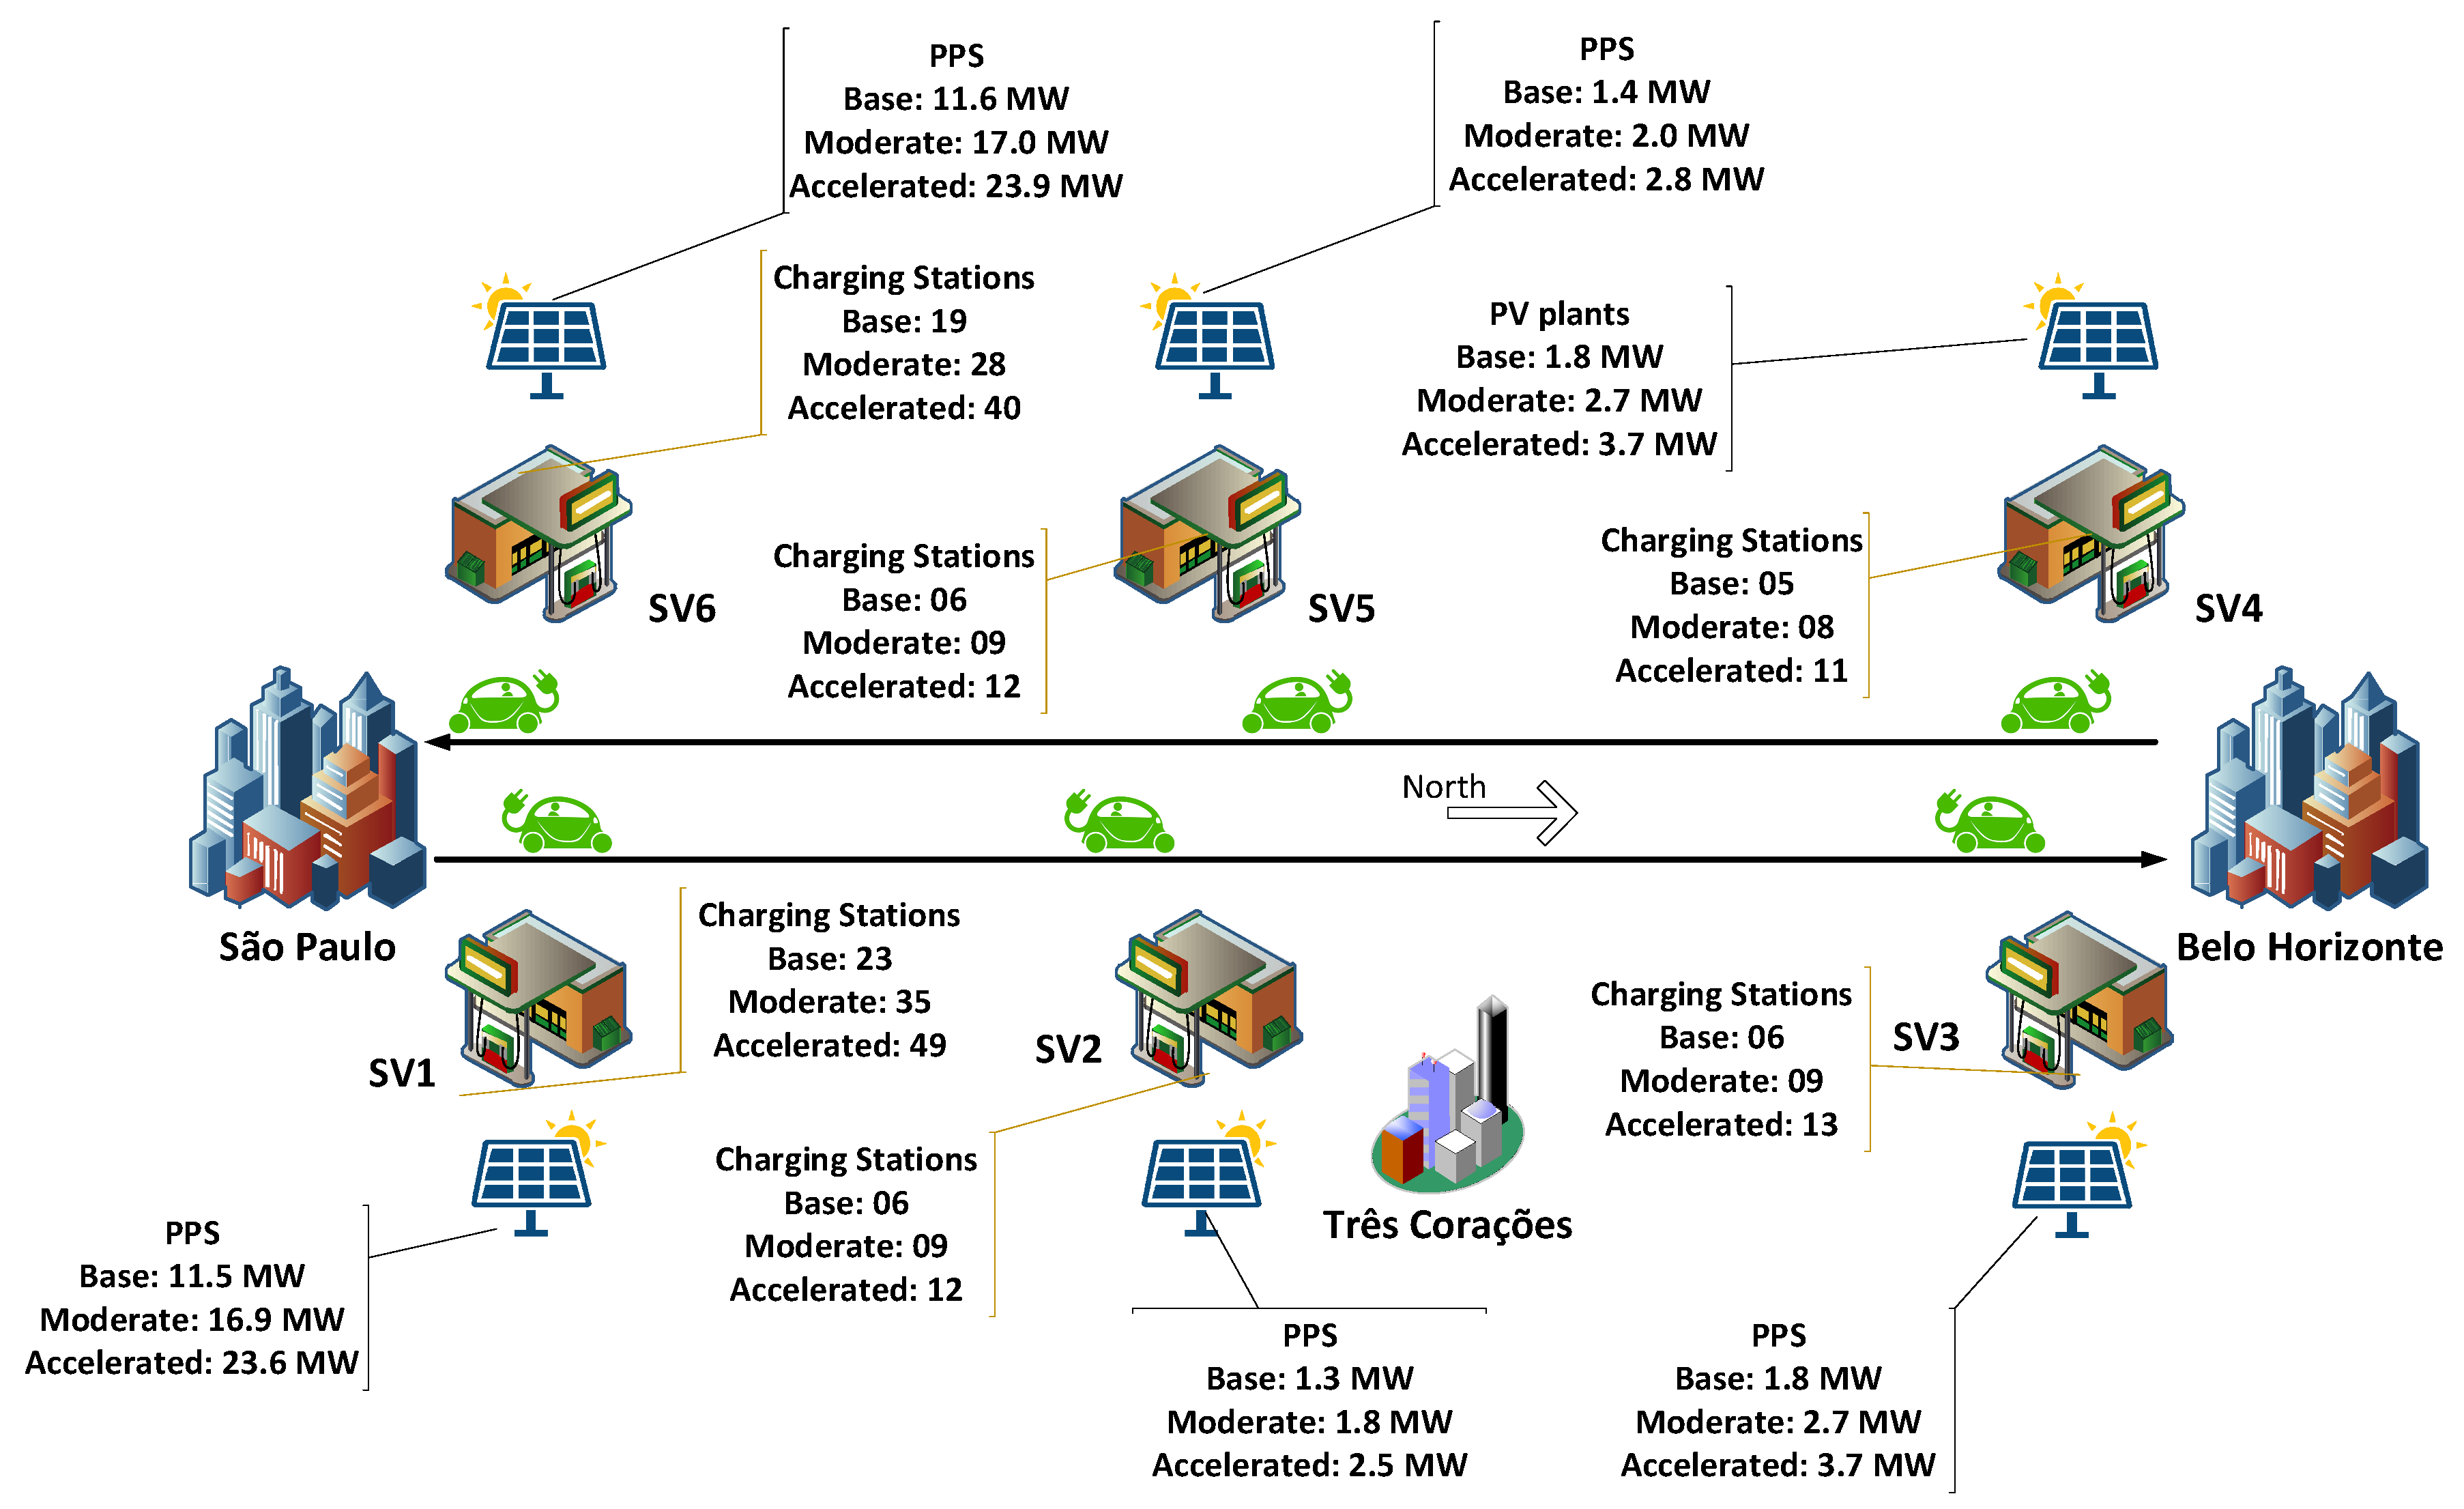
2.2. Estimate the Number of EV Charging Stations Needed along the Highway

The model that was used, developed by [27], considers EV storage capacity, its correlation to the potential of the charging station and the flow of EVs, and also the psychological factors of the drivers themselves.
Figure 2 shows a representation of the highway, illustrating both directions of traffic flow. The dark squares indicate primary nodes that represent important cities along the highway section. The dark circles indicate the secondary nodes and show other relevant points, such as toll stations or border checkpoints. Finally, the figure shows the distance in kilometers between the nodes and a list of nodes and their respective locations. The secondary nodes, as well as the toll cabins, were identified by the Arteris S/A company, where they register the total vehicle flows, and are available in reference [26].
The autonomous operation time expected from each vehicle is provided by manufacturers, but for this study, a safety factor is also considered, taking into account the characteristics of the road and the anxiety of some EV drivers [28]. Practical tests conducted by [29] show that EV drivers feel comfortable using up to 75% to 80% of the autonomous capacity of their vehicles. Given this situation, as presented in [27], the distance between the two service areas analyzed can be evaluated using Equation (5). The number of charging stations (χp) for each service area is given in Equation (6).
d p q = ρ a   r v
χ p = α l γ   f l N p
α l = f r l f m l
N p = φ d P s t a t i o n E a v
Table 3 shows the service areas allocated according to the method presented and the number of charging stations defined for each service sector per scenario. Due to the fact that the Fernão Dias highway is an important route that connects all of MERCOSUL to the northeast of Brazil [30] and that it transports vehicles between states, we decided to allocate a service area at the initial departure points in each direction of traffic flow in order to guarantee complete recharging for EVs at the beginning of their trip on the highway. The rest of the service areas in both directions were allocated according to distance (dpq) as long as there was an available connection point to the electrical grid.

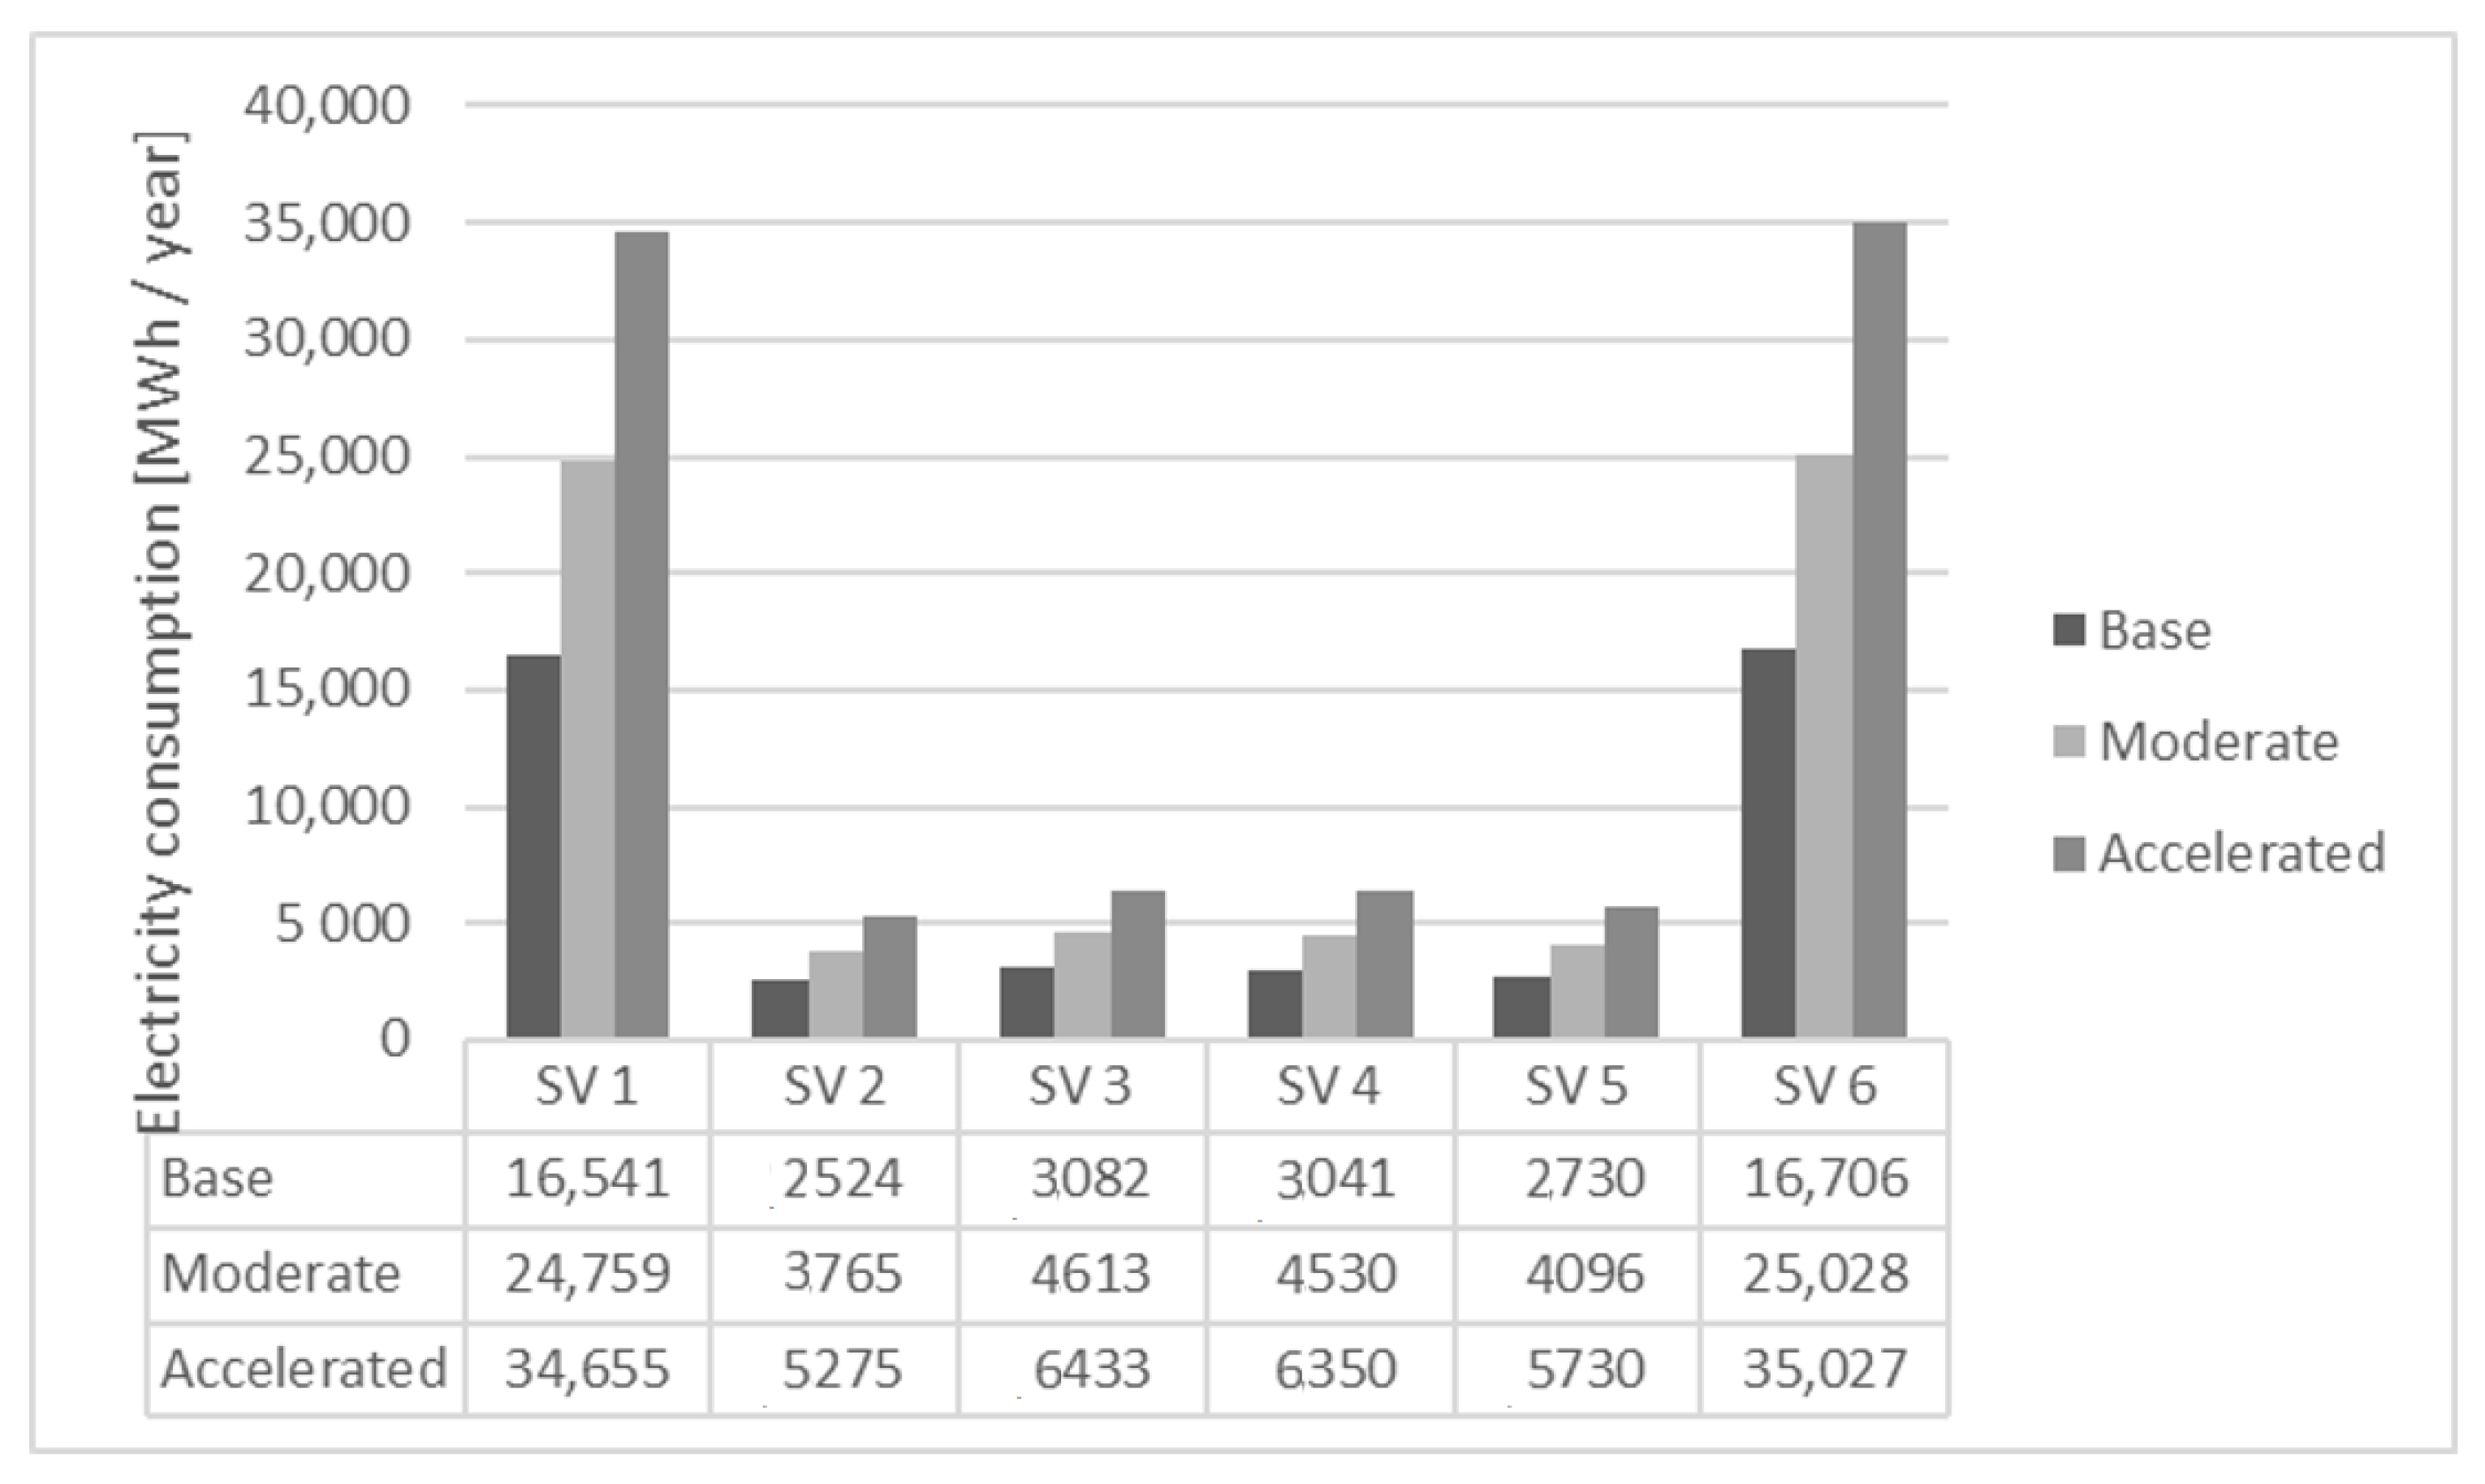
2.3. Project the PPSs Needed to Meet the Demand of the Charging Stations

To properly size the PPSs, the following considerations were adopted:
  • Service areas located in the same city are to be supplied by PPSs in the same coverage area as the local electric energy concessionaire;
  • The PPSs are to be sized to completely meet annual demand for electric energy at the charging stations in order to minimize the costs of recharging EVs;
  • The charging stations are to be modeled according to EFACEC QC45, a model already used in fast charging stations installed along some Brazilian highways, with a minimum yield of 0.94, according to [11,31].
The daily consumption of electric energy needed for recharging EVs per service area can be expressed by Equation (9).
E c s a = E a v f m l χ p η c s
NSEEC is defined as a system under which the active energy injected back into the grid per consumer unit in a micro-distribution or mini-generation modality is provided via a free loan to the local concessionaire and then later compensated by future active electric energy consumption at the same consumer unit or other consumer unit where credits are generated, as long as secondary units are registered under the same name as the first one. These registrations should be made with the Brazilian Federal Revenue Service (Ministry of Finance) using an Individual Taxpayer Registration number (CPF) or a National Register of Legal Entities number (CNPJ) [32]. Ref. [33] explains how the electric energy compensation system works.
The PPSs are located in two different states, so it was necessary to create adjustment factors for compensation of energy credits at peak hours, coming from energy generated in off-peak hours, for each of the energy companies involved, according to [34,35].
By consulting online portals and customer services of each energy company, the available connection points for the PPSs to be installed were verified [36]
The PPSs were sized to attend the service areas using the PVSystTM software, version 6.6.3. In cases where a single PPS with a capacity of 5 MW would be insufficient to meet the energy demands of the service area, additional PPSs were allocated until the total demand was met. Table 4 shows the AC potential of the PPSs sized to meet the charging stations per proposed scenario. All the PPSs were sized by observing the following conditions:
  • Installation of photovoltaic modules on the ground, in unlimited sheds, with azimuth equal to 0° and inclination equal to the latitude of the installation site;
  • Distance between sheds to prevent shading from 8 am to 4 pm at any time of the year;
  • Panels assembled with free air circulation;
  • Thermal losses in the DC circuit are 1.50% at Standard Test Conditions (STC), and voltage drops in the 0.7 V series of diodes.
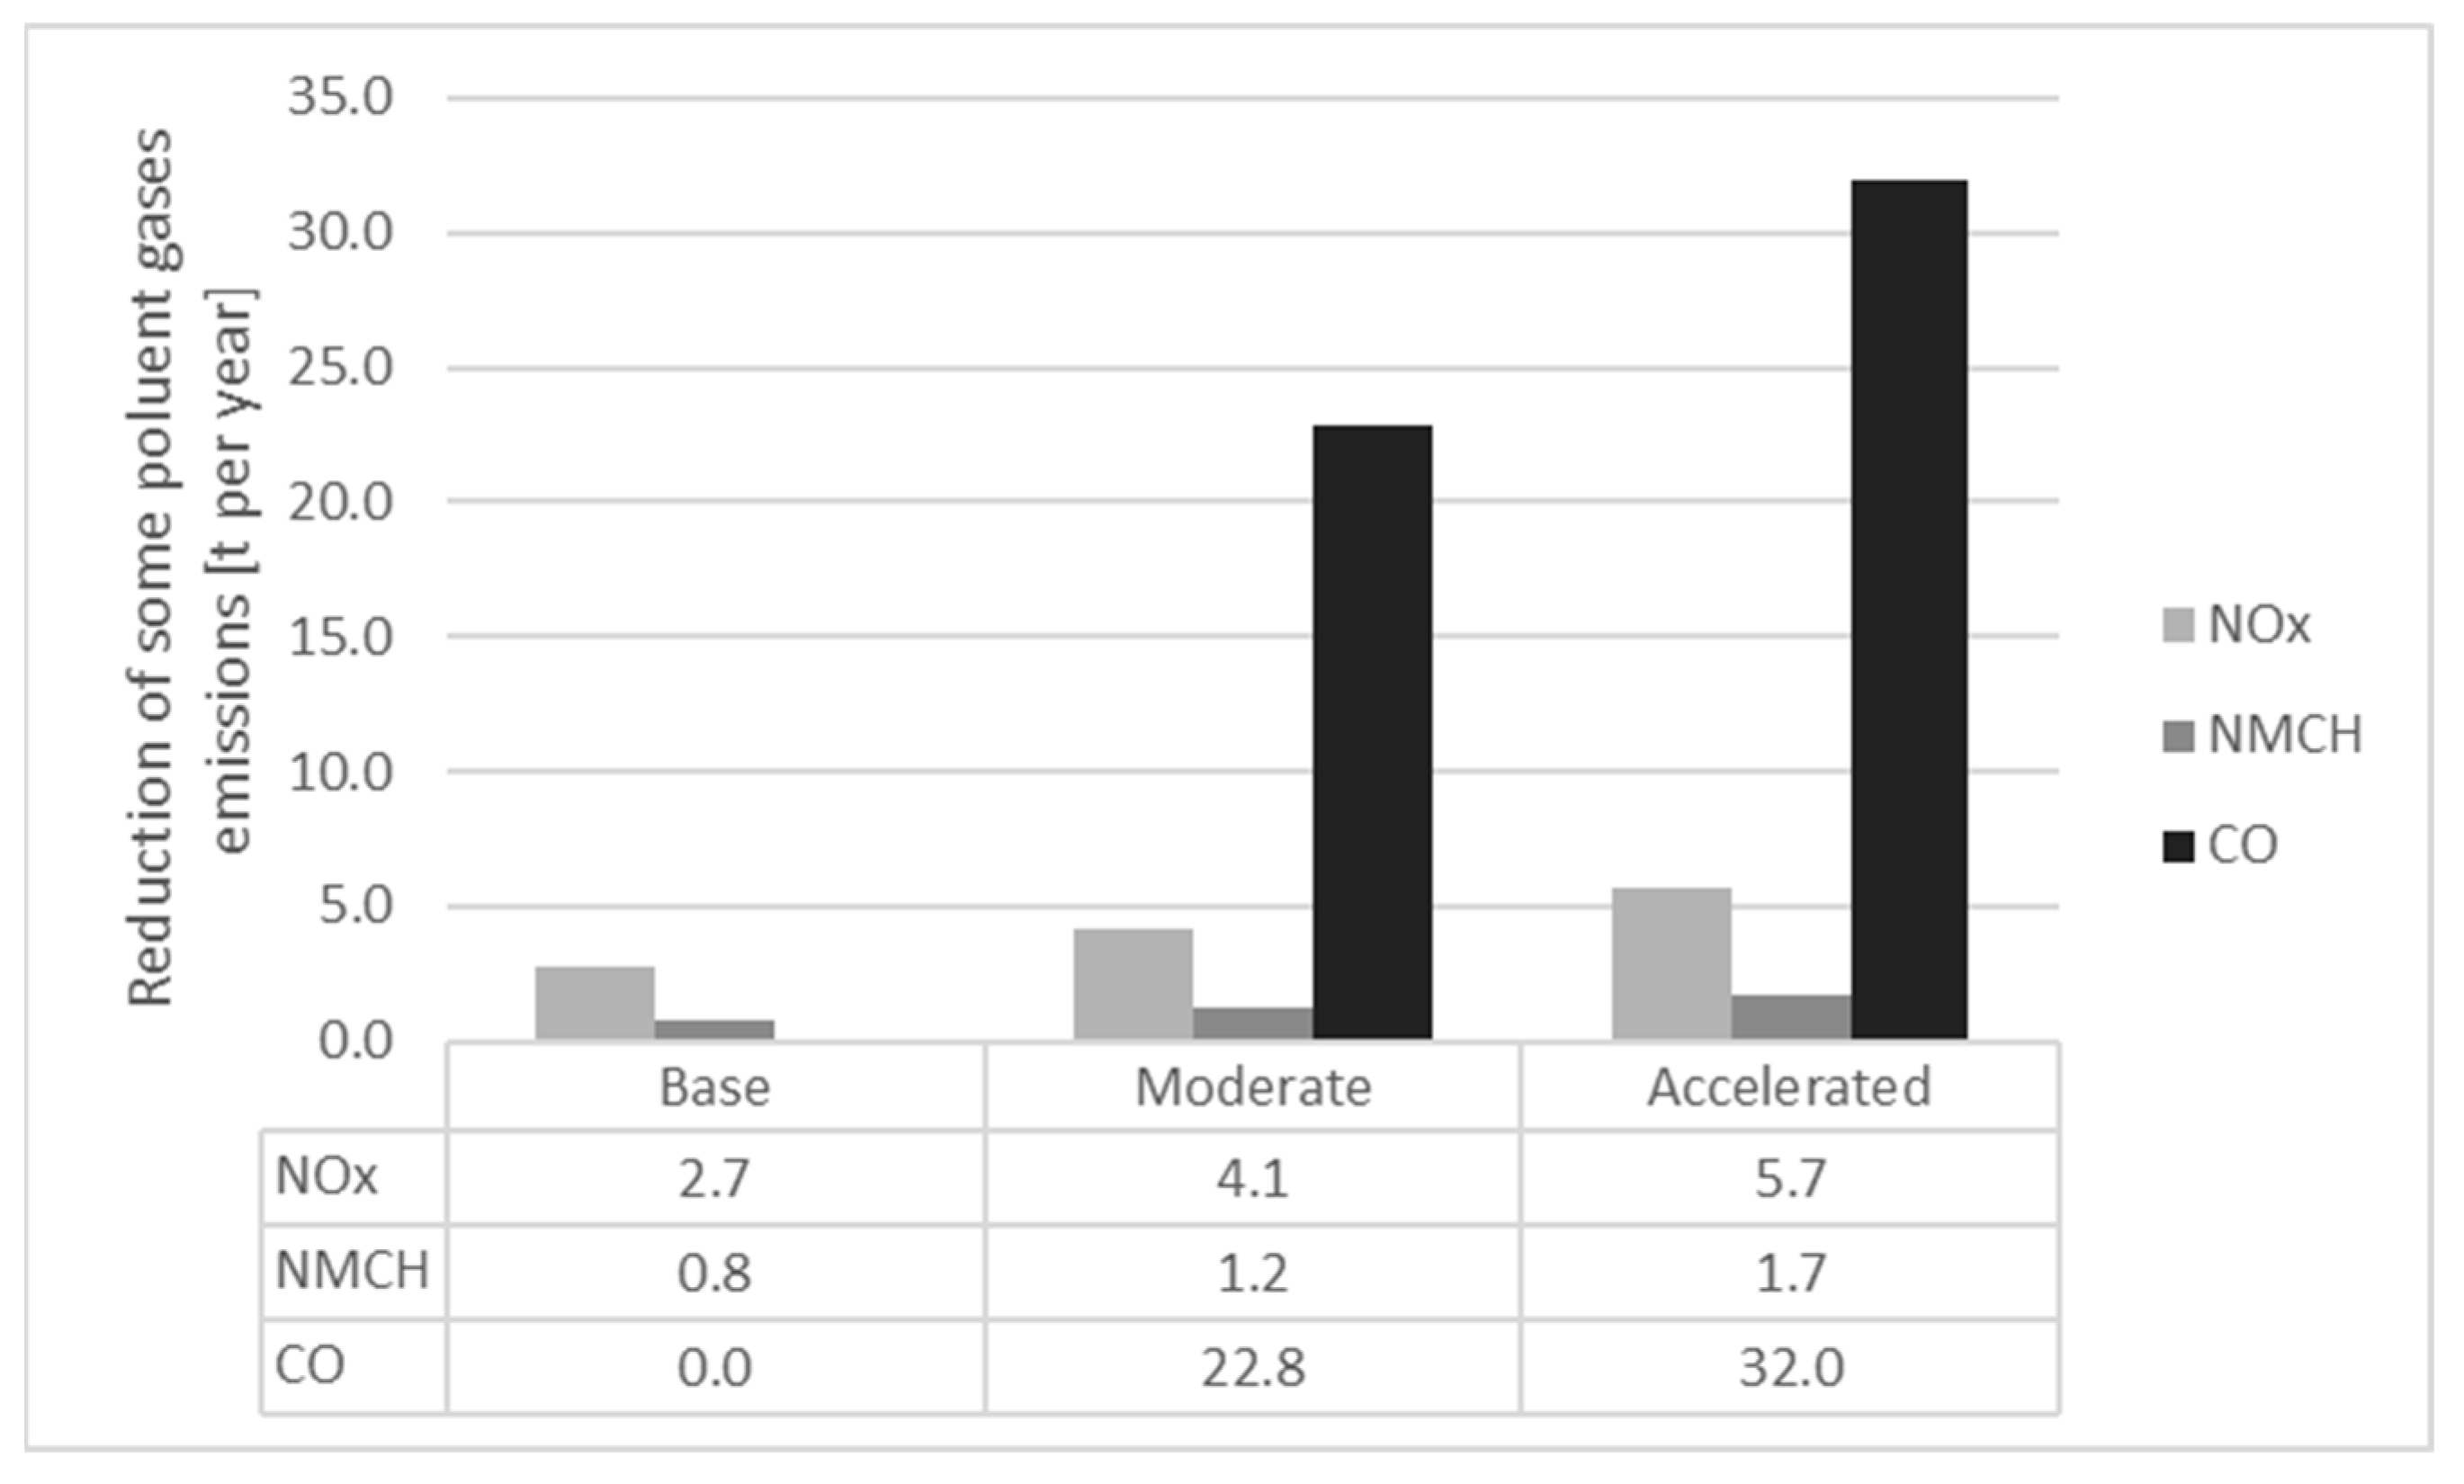
Significant length of the AC circuit cables, estimated at 200 m, with the presence of an external transformer for injecting energy back into the distribution network, disconnected during the night;
Losses in efficiency of the modules at −0.8%;
Other losses are not considered.

2.4. GHG Emissions

The Brazilian transportation sector was responsible for emitting 192.7 Mt of CO2 in 2018, constituting 46.3% of all CO2 emissions in the country in the same year [37]. Many countries have implemented public policies and incentive programs to reduce CO2 emissions in the transportation sector, according to [37,38]. Using EVs with electric energy generation from renewable sources can provide promising alternatives for meeting the goals proposed in Europe and in other countries for reducing CO2 emissions [39].
Ref. [16] published a method for calculating vehicle emissions for Brazil. The report pointed out a series of pollutants that come from the exhaust of automotive vehicles. In general, Equation (10) was used to determine the emissions coming from the total number of vehicles in circulation in a given calendar year.
E = F r I u F e
Ref. [40] published a list of 1034 models and versions of new vehicles in Brazil from 36 different brands for the Brazilian Labeling Program. The report states that NOx, NMHC, and CO, specifically CO2, are GHGs. The emission factors highlighted in the report are obtained from tests and, like km per liter, are obtained under lab conditions, according to NBR-7024.
The gas pollution emissions avoided by using EVs on the Fernão Dias highway in 2030 are given in Equation (11).
E p = i n F r j i     F e j     d
where
  • Ep is the annual rate of pollutant emissions considering t/year;
  • Frji is the number of vehicles with fuel source j that pass through toll booth i;
  • Fej is the pollutant emissions factor (gpollutant/km) for vehicles with fuel source j;
  • d is the distance driven by the vehicles in circulation to toll booth i.
Equation (12) shows the quantity of CO2 that would be emitted annually from the electrical energy generation sector if PPSs were not used for supplying EVs on the Fernão Dias highway.
E a r = i 365 E g e   E c s a

3. Results and Discussions

As starting points for the analysis, Figure 3 presents the projection curve for the total number of vehicles in 2030; Figure 4 shows the projected number of circulating vehicles for the Base scenario, which has been adjusted according to historical data; and Figure 5 shows the projections for EVs under the three scenarios.
According to the projections established in this study based on three scenarios (the Base, Moderate, and Accelerated scenarios), we could expect that EVs will constitute a 3.22%, 4.83%, and 6.75% share of all vehicles on the roads in Brazil by 2030, respectively. The total number of EVs circulating on the Fernão Dias highway can be obtained by collecting data from toll stations installed along the highway. This number would logically correspond to the total demand for EV charging along the highway. This is shown in Table 5.
The allocated service areas with their respective charging stations and PPSs can be identified in Figure 6. The greatest portion of charging stations are located in São Paulo city, where the flow of vehicles is greater. The service areas located in Três Corações and Belo Horizonte are similar, with fewer charging stations. Service areas SV2 and SV5 are located practically halfway along the highway. In general, the service areas in the northern sections of the highway need more charging stations than the service areas in the southern sections of the highway since the maximum projected vehicle flows in the northern part are, on average, 4.6% greater than in the south.
Introducing EVs onto the Fernão Dias highway will result in a significant increase in electrical energy consumption, as shown in Figure 7. Service areas SV1 and SV6 are the largest consumers of electricity in all scenarios, with consumption ranging from approximately 16.5 GWh per year (Base scenario) to about 34.6 GWh per year (Accelerated scenario). These consumption levels are similar to the total electrical consumption of small cities with about 6000 to 18,000 inhabitants and total electric energy consumption levels of 16.00 to 35.00 GWh in 2018 (similar to the Base or Accelerated scenarios, respectively) [19,41]. This electric energy consumption is considerable and could cause small impacts on a national scale. The official Brazilian government estimates that the total final electric energy consumption in 2030 will be between 735.8 and 902.5 TWh [42]. The total consumption for all service areas constitutes only 0.006% of the total final electric energy consumption estimated by the Brazilian government in the Base scenario, 0.009% for the Moderate scenario, and 0.012% for the Accelerated scenario.
The increase in electrical energy consumption due to EV recharging causes increases in GHG emissions if the energy sources used to produce the electrical energy come from fossil fuels (FFs). The total energy generated at the PPSs exceeds the energy consumed by charging stations, and the surplus generation is injected into the grid, which helps supply the energy matrix. During the night and periods of low solar incidence, electric energy can be provided from the grid, which may or may not be generated from renewable sources. In fact, all electrical energy generated at the PPSs is free of CO2 emissions and is used for charging EVs and/or other consumption points along the grid. Table 6 shows the annual reduced CO2 emission rates by using PPSs. The data were based on CO2 emissions from the Brazilian grid, available in [2].
Figure 8 and Figure 9 show the reductions in Nox, NMHC, CO, and CO2. Figure 10 shows the SCC for the three scenarios evaluated in this study. To determine the SCC, the value established for 2030, which was USD 50.00 per metric ton of carbon, was used. The greater the integration of EVs into the national market, the greater the reductions in GHG emissions. Automobiles are responsible for 74.4 × 10³ tons of CO emitted in the metropolitan region of São Paulo, 8.2 × 10³ tons of Nox, and 7.7 × 10³ tons of NMHC, according to [43]. The CO2 emissions were nearly 5.1 million tons of equivalent CO2 in 2018. The emissions reductions observed in the Accelerated scenario, when compared to the above-cited, correspond to 0.07% for Nox, 0.04% for CO, 0.02% for NMHC, and 0.29% for CO2, which is a noticeable reduction.
Figure 9 shows the charging cost per MWh per service area, adjusted to achieve an Internal Rate of Return (IRR) of 10%. The costs ranged from BRL 674.08 (SV6) to BRL 735.46 (SV3) for the Base scenario. The costs ranged from BRL 646.47 (SV3) to BRL 707.47 (SV1) for the Moderate scenario. The Accelerated scenario had lower costs, ranging from BRL 614.68 (SV5) to BRL 707.61 (SV1). SV3 had the highest cost in the Base scenario, while SV1 had the highest cost in the Moderate and Accelerated scenarios.
Table 7 shows a summary of the main financial information of each service area, including the average EBITDA margin value (Earnings before Interest, Taxes, Depreciation, and Amortization), obtained by dividing the EBITDA value by the net revenue. The EBITDA margin is a financial indicator that shows the percentage profitability of the operation of a company before third-party capital is remunerated, before taxes, and before recovering the investment costs [43]. The necessary investments range from 6.35 million Brazilian reais (SV2 Base) to 110.7 million Brazilian reais (SV1 Accelerated). The EBITDA margin ranged from 46.1% (SV2 Moderated) to 60.8% (SV6 Base). From a financial perspective, the Accelerated scenario had the best Return on Investment (ROI), with an average EBITDA margin of 55.6%, followed by the Moderate scenario, with 54.1%, and lastly, the Base scenario, with 52.7%.

4. Conclusions

A method is proposed to project the flow of EVs circulating on a real Brazilian highway until 2030. The models were adjusted based on historical data from the Brazilian automotive market. The three scenarios established for 2030 (Base, Moderate, and Accelerated) were differentiated by the degree of market penetration of EVs. The most adequate areas for installing fast charging stations were identified, as well as the necessary number of them, considering relevant technical aspects for EVs and charging stations and the psychological characteristics of the driver.
Based on the demand for electricity to charge EVs for each scenario, it is possible to plan photovoltaic power stations (PPSs) to supply the charging stations with power. The lowest possible operational costs were also identified, using the NSEEC and clean and renewable energy for charging. The results obtained show a list of possible locations for installing these stations along the Fernão Dias highway, along with the number of necessary stations, the expected electric energy consumption, and the impact on GHGs. Costs related to the charging service for EVs that can be sold on the highway were also presented.
Introducing EV charging stations can result in significant financial gains in terms of reduced GHG emissions and low recharging costs while having a small impact on national energy consumption. The Accelerated scenario shows a reduction of 14,849 tons of CO2 per year for consumption of 34.6 GWh of electricity (0.012% of estimated consumption in 2030), corresponding to about USD 742,444.55 using the SCC calculation system. The average cost for charging EVs is about BRL 650.69/MWh, with a 10% IRR of the investment in the system and a 55.6% EBITDA margin, which guarantees the viability of the project. The costs are even more attractive for the end user, who can save up to 72% when compared to the current fueling costs of traditional internal combustion vehicles.
Although the number of EVs in Brazil is still relatively small, proper infrastructure planning for charging stations will be crucial in expanding EVs in the country, along with using clean energy sources to minimize environmental impacts. This study can be used to support public policy or private investment aimed at promoting the ‘electrification’ of Brazilian highways and expanding the national EV market. Future studies could address other road systems in Brazil, the structure of business models related to recharging services, the impact of future legislative changes that might compete with the NSEEC, and the integration of future charging stations into areas where these services already exist.

Author Contributions

This article is the result of a master thesis of student D.d.C. supervised by V.R.M.C. All authors have read and agreed to the published version of the manuscript.

Funding

This research received no funding support for elaboration or research.

Data Availability Statement

All data referred to in this research are available in the references cited, and if something more is required, contact the authors at the emails provided.

Acknowledgments

The authors would like to thank Conselho Nacional de Desenvolvimento Científico e Tecnológico (CNPQ) of the Brazilian government for their support in the publication of this research under project number 407825/2022-3.

Conflicts of Interest

The authors declare no conflict of interest.

Nomenclature

Vttotal number of vehicles per capita at time t;
γisaturation level, in terms of vehicles per one thousand inhabitants, in country i;
θadjustment speed of vehicle growth according to growth in income, where 0 < θ < 1;
αparameter that determines the value in the Gompertz function for lower-level income classes;
βparameter that corresponds to the level of income in each county at which the maximum saturation level γmax for 831 vehicles for 1.00 habitants is reached
F(t)accumulated fraction of the market potential that adopts the product by time t;
pinnovation coefficient;
qimitation coefficient.
mprojection factor for annual traffic;
Triannual traffic per toll station at year i;
Fcitotal number of vehicles in circulation in year i;
Trpjannual traffic projected for each toll station in year j;
Fcpjtotal number of vehicles in circulation in year j.
dpqdistance between two service areas p and q in km;
ρaautonomous anxiety factor;
rvautonomous range of the vehicle in km;
χpnumber of charging stations;
αlamplification factor;
γnumber of recharging connectors;
flaverage flow of vehicles at the link l (vehicles/day);
Npnumber of EVs that can be directly recharged at each connector at the charging station;
frlmaximum flow of vehicles at the link l in the reference period;
fmlaverage flow of vehicles at the link l in the reference period;
ϕdduration of the day in hours;
Pstationpotential of the charging station in kW;
Eavenergy of the battery system of the vehicle in kWh;
Eannual pollutant rate per year considering (g/year);
Fepollutant emission factor considering (gpollutant/km);
Frnumber of vehicles in circulation;
Iuuse intensity of the vehicle in km/year;
Earthe avoided CO2 emissions by recharging EVs using PPSs (CO2/year);
Egeemissions rate for CO2 in the Brazilian energy matrix (t CO2/MWh);
Ecsaconsumed energy from recharging EVs per service area (MWh/day).

References

  1. Pablo, J.M.S.; de López, M.M.; Bret, A. How Green Are Electric or Hydrogen-Powered Cars? Assessing GHG Emissions of Traffic in Spain, 1st ed.; Springer: Berlin/Heidelberg, Germany, 2016; ISBN 10: 3319324330. [Google Scholar]
  2. IEA. Key World Energy Statistics—2019. Encycl. Ecol. 2018, 4, 50–63. [Google Scholar] [CrossRef]
  3. EPE. Empresa de Pesquisas Energeticas. Energetic National Balance 2019. Report Base Year 2018–2019:67. Available online: https://www.epe.gov.br/pt/publicacoes-dados-abertos/publicacoes/balanco-energetico-nacional-2019 (accessed on 3 June 2020).
  4. European Commission. Transport Emissions. A Eur Strateg Low-Emission Mobil 2016. Available online: https://ec.europa.eu/clima/policies/transport_en#tab-0-0 (accessed on 3 June 2020).
  5. Şahin, M.E. A photovoltaic powered electrolysis converter system with maximum power point tracking control. Int. J. Hydrog. Energy 2020, 45, 9293–9304. [Google Scholar] [CrossRef]
  6. Arroyo, V.; Holsinger, H.; Wolosin, M.; Linquiti, P.; Ahmad, S.; Adkins, L. Policies to Reduce Emissions from the Transportation Sector. Congr Policy Briefs Ser 2008. Available online: https://www.c2es.org/document/policies-to-reduce-emissions-from-the-transportation-sector/ (accessed on 3 June 2020.).
  7. Suski, A.; Remy, T.; Chattopadhyay, D.; Song, C.S.; Jaques, I.; Keskes, T.; Li, Y. Analyzing Electric Vehicle Load Impact on Power Systems: Modeling Analysis and a Case Study for Maldives. IEEE Access 2021, 9, 125640–125657. [Google Scholar] [CrossRef]
  8. ABVE. Government Announces Rota 2030 and Cuts IPI for Electrics 2018. Available online: http://www.abve.org.br/governo-anuncia-rota-2030-e-corta-ipi-para-eletricos/ (accessed on 3 June 2020).
  9. Albuquerque, F. EDP Announces Ultrafast Charging Network for Electric Vehicles 2019. Available online: https://agenciabrasil.ebc.com.br/economia/noticia/2019-10/edp-anuncia-rede-de-recarga-ultrarrapida-de-veiculos-eletricos (accessed on 29 May 2020).
  10. ABVE. Electric Mobility Brasil Installs Electrified Highway on Dutra 2018. Available online: http://www.abve.org.br/electric-mobility-instala-eletrovia-na-dutra/ (accessed on 28 April 2020).
  11. ARTERIS S/A. Fernão Dias 2020. Available online: https://www.arteris.com.br/rodovias/fernao-dias/ (accessed on 10 April 2020).
  12. Ministry of the Environment. National Inventory of Atmospheric Emissions from Road Motor Vehicles—2013. Brasília: 2014. Available online: http://anuario.antt.gov.br/index.php/content/view/5632/1__Inventario_Nacional_de_Emissoes_Atmosfericas_por_Veiculos_Automotores_Rodoviarios.html (accessed on 4 June 2020.).
  13. Sørensen, A.L.; Sartori, I.; Lindberg, K.B.; Andresen, I. A method for generating complete EV charging datasets and analysis of residential charging behaviour in a large Norwegian case study. Sustain. Energy Grids Netw. 2023, 36, 101195. [Google Scholar] [CrossRef]
  14. Rahman, S.; Khan, I.A.; Khan, A.A.; Mallik, A.; Nadeem, M.F. Comprehensive review & impact analysis of integrating projected electric vehicle charging load to the existing low voltage distribution system. Renew. Sustain. Energy Rev. 2021, 153, 111756. [Google Scholar] [CrossRef]
  15. Kim, J.; Oh, H.; Lee, J. Data-driven cost-effective capacity provisioning scheme in electric vehicle charging facility. Comput. Ind. Eng. 2022, 173, 108743. [Google Scholar] [CrossRef]
  16. Baran, R.; Legey, L.F.L. The introduction of electric vehicles in Brazil: Impacts on oil and electricity consumption. Technol Forecast. Soc. Chang. 2013, 80, 907–917. [Google Scholar] [CrossRef]
  17. Dargay, J.; Gately, D.; Sommer, M. Vehicle ownership and income growth, worldwide: 1960–2030. Energy J. 2007, 28, 143–170. [Google Scholar] [CrossRef]
  18. IBGE. Cidades@ 2020. Available online: https://cidades.ibge.gov.br/ (accessed on 14 April 2020).
  19. The World Bank. GDP per Capita (Constant 2010 US$)—Brazil. World Bank Gr—Int Dev Poverty, Sustain n.d. Available online: https://data.worldbank.org/indicator/NY.GDP.PCAP.KD?end=2018&locations=BR&start=1990&view=chart (accessed on 28 February 2020).
  20. EPE. Economic Scenario for the Next Ten Years (2020–2029). Rio de Janeiro: 2019. Available online: https://www.epe.gov.br/sites-pt/publicacoes-dados-abertos/publicacoes/PublicacoesArquivos/publicacao-440/NT%20Cen%C3%A1rio%20Econ%C3%B4mico%2010%20anos%202029%20VF.pdf (accessed on 15 July 2020).
  21. Sindipeças. Rolling Fleet Report—2019 Edition. São Paulo: 2019. Available online: https://www.josepauloecon.com/wp-content/uploads/2020/06/R_FrotaCirculante_2019.pdf?x35660 (accessed on 10 July 2020).
  22. Bass, F.M. A new product growth for model consumer durables. Manag. Sci. 1969, 15, 215–227. [Google Scholar] [CrossRef]
  23. ANFAVEA. Brazilian Automotive Industry Yearbook 2019. São Paulo: 2019. Available online: https://anfavea.com.br/anuario2019/anuario.pdf (accessed on 10 July 2020).
  24. Maxton. Brazil’s Main Highways 2018. Available online: https://maxtonlogistica.com.br/as-principais-rodovias-do-brasil/ (accessed on 10 April 2020).
  25. ANTT. Agencia Nacional de Transporte Terrestre Real Flow of Paying Vehicles. Brasília: 2020. Available online: https://www.sindipecas.org.br/area-atuacao/?co=s&a=frota-circulante (accessed on 10 July 2020).
  26. Napoli, G.; Polimeni, A.; Micari, S.; Andaloro, L.; Antonucci, V. Optimal allocation of electric vehicle charging stations in a highway network: Part 1. Methodology and test application. J. Energy Storage 2020, 27, 101102. [Google Scholar] [CrossRef]
  27. Martins, J.; Brito, F.P.; Pedrosa, D.; Monteiro, V.; João, L. Real-Life Comparison Between Diesel and Electric Car Energy Consumption. In Grid Electrified Vehicles Performance, Design and Environmental Impacts; Nova Science Publishers: New York, NY, USA, 2013; pp. 209–232. ISBN 978-1-62808-839-7. Available online: https://www.novapublishers.com/catalog/product_info.php?products_id=44945 (accessed on 10 July 2020).
  28. Franke, T.; Krems, J.F. Interacting with limited mobility resources: Psychological range levels in electric vehicle use. Transp. Res. Part A Policy Pract. 2013, 48, 109–122. [Google Scholar] [CrossRef]
  29. Soares LFRRM. Bandeirantes, JK and the Duplication that Took More than a Decade: Learn about the History of Fernão Dias. Asf—G1 Sul Minas 2018. Available online: https://g1.globo.com/mg/sul-de-minas/noticia/bandeirantes-jk-e-a-duplicacao-que-demorou-mais-de-uma-decada-conheca-a-historia-da-fernao-dias.ghtml (accessed on 12 June 2020).
  30. Electricmobility. EFACEC QC45 2020. Available online: http://electricmobilitybrasil.com/qc45/ (accessed on 28 April 2020).
  31. ANEEL. Normative Resolution N° 517, de 11 de Dezembro de 2012. Available online: https://www2.aneel.gov.br/cedoc/ren2012517.pdf (accessed on 2 May 2020).
  32. Silva, T.C.; Pinto, G.M.; de Souza, T.A.Z.; Valerio, V.; Silvério, N.M.; Coronado, C.J.R. Technical and economical evaluation of the photovoltaic system in Brazilian public buildings: A case study for peak and off-peak hours. Energy 2020, 190, 116282. [Google Scholar] [CrossRef]
  33. ENEL. ENEL Energy Tariff 2020. Available online: https://www.eneldistribuicaosp.com.br/corporativo-poder-publico/tarifa-de-energia-eletrica (accessed on 21 April 2020).
  34. CEMIG. Energy Tariff CEMIG 2020. Available online: https://www.cemig.com.br/pt-br/atendimento/corporativo/Paginas/tarifas.aspx (accessed on 21 April 2020).
  35. CEMIGAvailability Map 2020. Available online: https://geo.cemig.com.br/mca/Home/IndexData (accessed on 9 July 2020).
  36. European Commission. 2050 Long-Term Strategy 2020. Available online: https://ec.europa.eu/clima/policies/strategies/2050_en (accessed on 20 May 2020).
  37. Council of the European Union. Cutting Emissions: Council Adopts CO2 Standards for Trucks 2020. Available online: https://www.consilium.europa.eu/en/press/press-releases/2019/06/13/cutting-emissions-council-adopts-co2-standards-for-trucks/ (accessed on 20 May 2020).
  38. European Commission. Our Vision for A Clean Planet for All. 2018. Available online: https://ec.europa.eu/commission/presscorner/api/files/attachment/856608/2_LTS_IndustrialTransition.pdf (accessed on 3 May 2020).
  39. EV Compare. EV Compare. EVcompareIo/Cars 2020. Available online: https://evcompare.io (accessed on 20 May 2020).
  40. São Paulo State Government. São Paulo State Energy Yearbook 2019; Secretariat of Infrastructure and Environment: São Paulo, Brazil, 2019; Volume 53. [Google Scholar]
  41. EPE. Demand Scenarios for o PNE 2050. 2018. Available online: https://www.epe.gov.br/sites-pt/publicacoes-dados-abertos/publicacoes/PublicacoesArquivos/publicacao-227/topico-202/Cen%C3%A1rios%20de%20Demanda.pdf (accessed on 2 May 2020).
  42. CETESB. Vehicle Emissions in the State of São Paulo 2018. 2019. Available online: https://cetesb.sp.gov.br/veicular/#:~:text=O%20invent%C3%A1rio%20de%20emiss%C3%B5es%20veiculares,SO2%2C%20todos%20poluentes%20t%C3%B3xicos. (accessed on 10 June 2020).
  43. Dicionário Financeiro. O que é EBITDA? 2020. Available online: https://www.dicionariofinanceiro.com/ebitda/ (accessed on 27 May 2020).
Figure 1. Flowchart of the proposed method.
Vehicles 05 00095 g001
Figure 2. Graphic representation of the highway.
Vehicles 05 00095 g002
Figure 3. Total number of circulating vehicles for 2030.
Vehicles 05 00095 g003
Figure 4. Adjustment of the parameters of the Bass model.
Vehicles 05 00095 g004
Figure 5. Projection scenarios for EVs in 2030.
Vehicles 05 00095 g005
Figure 6. Allocation of service areas and charging stations.
Vehicles 05 00095 g006
Figure 7. Electricity consumption per service area.
Vehicles 05 00095 g007
Figure 8. Reduction of Nox, NMCH, and CO by using EVs on the Fernão Dias.
Vehicles 05 00095 g008
Figure 9. Reduction of CO2 emissions and the social cost of carbon.
Vehicles 05 00095 g009
Figure 10. Cost of recharging EVs on the Fernão Dias.
Vehicles 05 00095 g010
Table 1. DGS model parameters.
ParameterAmount
α−18.85
β−0.23
γ831
θ0.095
V0137.9
t02010
Table 2. Parameters for the Bass diffusion model.
ParametersM5%M10%M25%
p0.000005730.000002780.00000112
q0.4770.4790.479
Table 3. Location of the service areas and the number of charging stations per scenario.
IDNodeWayDist. (km)DescriptionCharging Stations
BaseMod.Acc.
SV 1P1North0São Paulo233549
SV 2P5North287.2Três Corações6912
SV 3P6North282.4Belo Horizonte6913
SV 4P7South0Belo Horizonte5811
SV 5P8South287.2Três Corações6912
SV 6P12South282.4São Paulo192840
Table 4. PPS destined for the service area.
Service AreaLocationLocal
Distributor
PPSs Power for Charging Stations (MW)
BaseMod.Acc.
SV 1São PauloENEL11.516.923.6
SV 2Três CoraçõesCEMIG1.31.82.5
SV 3Belo HorizonteCEMIG1.82.73.7
SV 4Belo HorizonteCEMIG1.82.73.7
SV 5Três CoraçõesCEMIG1.42.02.8
SV 6São PauloENEL11.617.023.9
Table 5. Projected flow of EVs traveling on the Fernão Dias highway by 2030.
North WayBaseModerateAccelerated
MinAveMaxMinAveMaxMinAveMax
T1 272,655291,635344,925408,435436,540516,475571,955611,010723,065
T2 104,755116,800156,220156,950174,835233,965219,730244,915327,405
T3 65,70075,190107,31098,550112,785160,965137,605158,045225,205
T4 37,96044,53067,16056,57566,430100,74079,20593,075140,890
T5 41,24549,27574,46061,68573,365111,32586,505102,930155,855
T6 36,50042,70565,33554,38564,24097,82076,28589,790137,240
T7 37,23043,80065,70055,84565,70098,55078,11091,980137,605
T8 47,08554,38576,28570,44581,395113,88098,550113,515159,505
South WayBaseModerateAccelerated
MinAveMaxMinAveMaxMinAveMax
T1 277,765294,555313,535415,735441,285469,390582,175617,580657,000
T2 105,850116,435138,335158,410174,470206,955221,920244,185289,810
T3 66,43075,555100,74099,645113,150151,110139,430158,410211,335
T4 55,11562,41583,22082,49093,440124,830115,340130,670174,470
T5 40,51548,18070,81060,95572,270106,21585,045101,105148,555
T6 35,40541,97560,59053,29062,78090,88574,46087,965127,385
T7 36,50043,07061,68554,38564,24092,71076,28590,155129,575
T8 45,99053,65570,81068,98579,935105,85096,725112,055148,190
Table 6. Reduced CO2 emission by using PPSs per service area.
Service AreasAvoided CO2 Emissions by PVs (t CO2/Year)
BaseModerateAccelerated
SV1137620602883
SV2210313439
SV3257384536
SV4253377529
SV5227341477
SV6139020822914
Table 7. Financial indicators referent to each service area.
IndicatorScenarioSV1SV2SV3SV4SV5SV6
CAPEXBaseBRL
3,729,553.88
BRL
6,355,152.00
BRL
8,497,152.00
BRL
8,325,820.00
BRL
6,563,784.00
BRL 51,396,148.00
Mod.BRL
9,382,364.60
BRL
9,150,228.00
BRL
12,516,228.00
BRL
12,298,536.00
BRL
9,762,228.00
BRL 75,455,376.00
Acc.BRL 110,727,310.44 BRL 12,557,304.00 BRL
17,211,996.00
BRL
16,776,612.00
BRL
13,781,304.00
BRL 105,947,680.00
OPEXBaseBRL
4,429,311.20
BRL
920,293.20
BRL
1,070,618.11
BRL
972,709.57
BRL
943,563.06
BRL
4,164,968.35
Mod.BRL
6,548,799.84
BRL
1,343,560.66
BRL
1,303,795.36
BRL
1,204,362.79
BRL
1,394,047.96
BRL
6,210,432.35
Acc.BRL
9,218,761.98
BRL
1,540,823.43
BRL
1,846,944.96
BRL
1,651,303,16
BRL
1,590,696.72
BRL
8,717,699.43
EBITDA marginBase60.4%46.5%49.9%51.8%46.6%60.8%
Mod.60.4%46.1%54.7%56.2%46.8%60.4%
Acc.60.2%50.6%53.9%56.1%52.1%60.4%
Disclaimer/Publisher’s Note: The statements, opinions and data contained in all publications are solely those of the individual author(s) and contributor(s) and not of MDPI and/or the editor(s). MDPI and/or the editor(s) disclaim responsibility for any injury to people or property resulting from any ideas, methods, instructions or products referred to in the content.

