Abstract
Electric vehicles (EVs) are experiencing explosive growth in public adoption, causing a major shift in research and development priorities by OEMs toward electrified powertrains. To verify EV drivetrain platforms and software models in the design phase, testbeds with specific capabilities are essential. Full-scale vehicle testbeds are expensive, bulky, dissipative, and not easily reconfigurable or movable, making scaled testbeds more attractive, especially for education and research institutes. To support this cause, this paper reports on the development of a small-scale, modular, hardware-in-the-loop (HIL) testbed platform for the drivetrain of EVs that is cost-effective, efficient, and easily movable and reconfigurable and allows integration of a battery pack. The testbed is comprised of two directly coupled electric machines. The first machine emulates the traction motor and is used to control vehicle speed according to a specified drive cycle. The second machine is used to impose a torque profile on the first machine’s shaft—based on the vehicle’s parameters and driving environment—and emulates a gearbox (if necessary). A systematic two-way scaling approach is adopted to downscale the parameters and driving environment of full-size EVs to a level that can be handled by the testbed and to upscale the test results obtained from the testbed to the full-size vehicle level. The power consumption of the testbed is limited to system losses. A case study involving a full-size EV was performed and the HIL simulation results were compared to the computer simulation results to verify the performance of the testbed.
1. Introduction
The last two decades have witnessed tremendous advances in battery and semiconductor device technologies. These developments, combined with increased interest in reducing global greenhouse gas emissions resulting from the dependence of transportation on fossil fuels, have resulted in an enhanced interest in the development of electrified vehicles. As the propulsion system of electrified vehicles is very different to that of ICE-based vehicles, ample resources need to be dedicated to validating new electrified powertrain designs and innovating methods to achieve higher performance and efficiency. The engineering and development costs of new electric powertrain designs are still very high and can only be afforded by OEMs, tiered suppliers, and large research centers. This has contributed to the higher initial cost of electrified vehicles with respect to their ICE counterparts of similar sizes and power ratings. Smaller organizations and academic institutions usually depend on simulation software tools to perform basic research and participate in collaborative R&D projects with their industrial partners to speed up the development process at a reasonable cost.
Iterative simulations can reveal major errors in design early in the design phase before prototypes are created. For the simulation to work properly, one must create or have the correct models to predict vehicle behavior under various driving conditions. The models currently used for simulating electrified vehicles are found in commonly used software programs and are constantly verified by running the software on hardware. Running these types of tests on the road with full-size hardware is time- and cost-prohibitive. It is also extremely difficult to reproduce all driving conditions. A technique known as hardware-in-the-loop (HIL) simulation is usually used to test and validate specific vehicle functions on an embedded system, where the driving conditions can be controlled.
HIL simulations during the engineering development stage provide an effective environment and platform for the test and performance analysis of hardware devices and their control algorithms. New software models designed during simulation can quickly and easily be tested on the HIL testbed. Compared to real-world experiments, hardware-in-the-loop simulation is characterized by a lower cost, as well as higher safety and reusability [1,2]. The HIL setups reported in the literature for EVs fall under the signal-level, power-level, and mechanical-level categories [3,4,5,6].
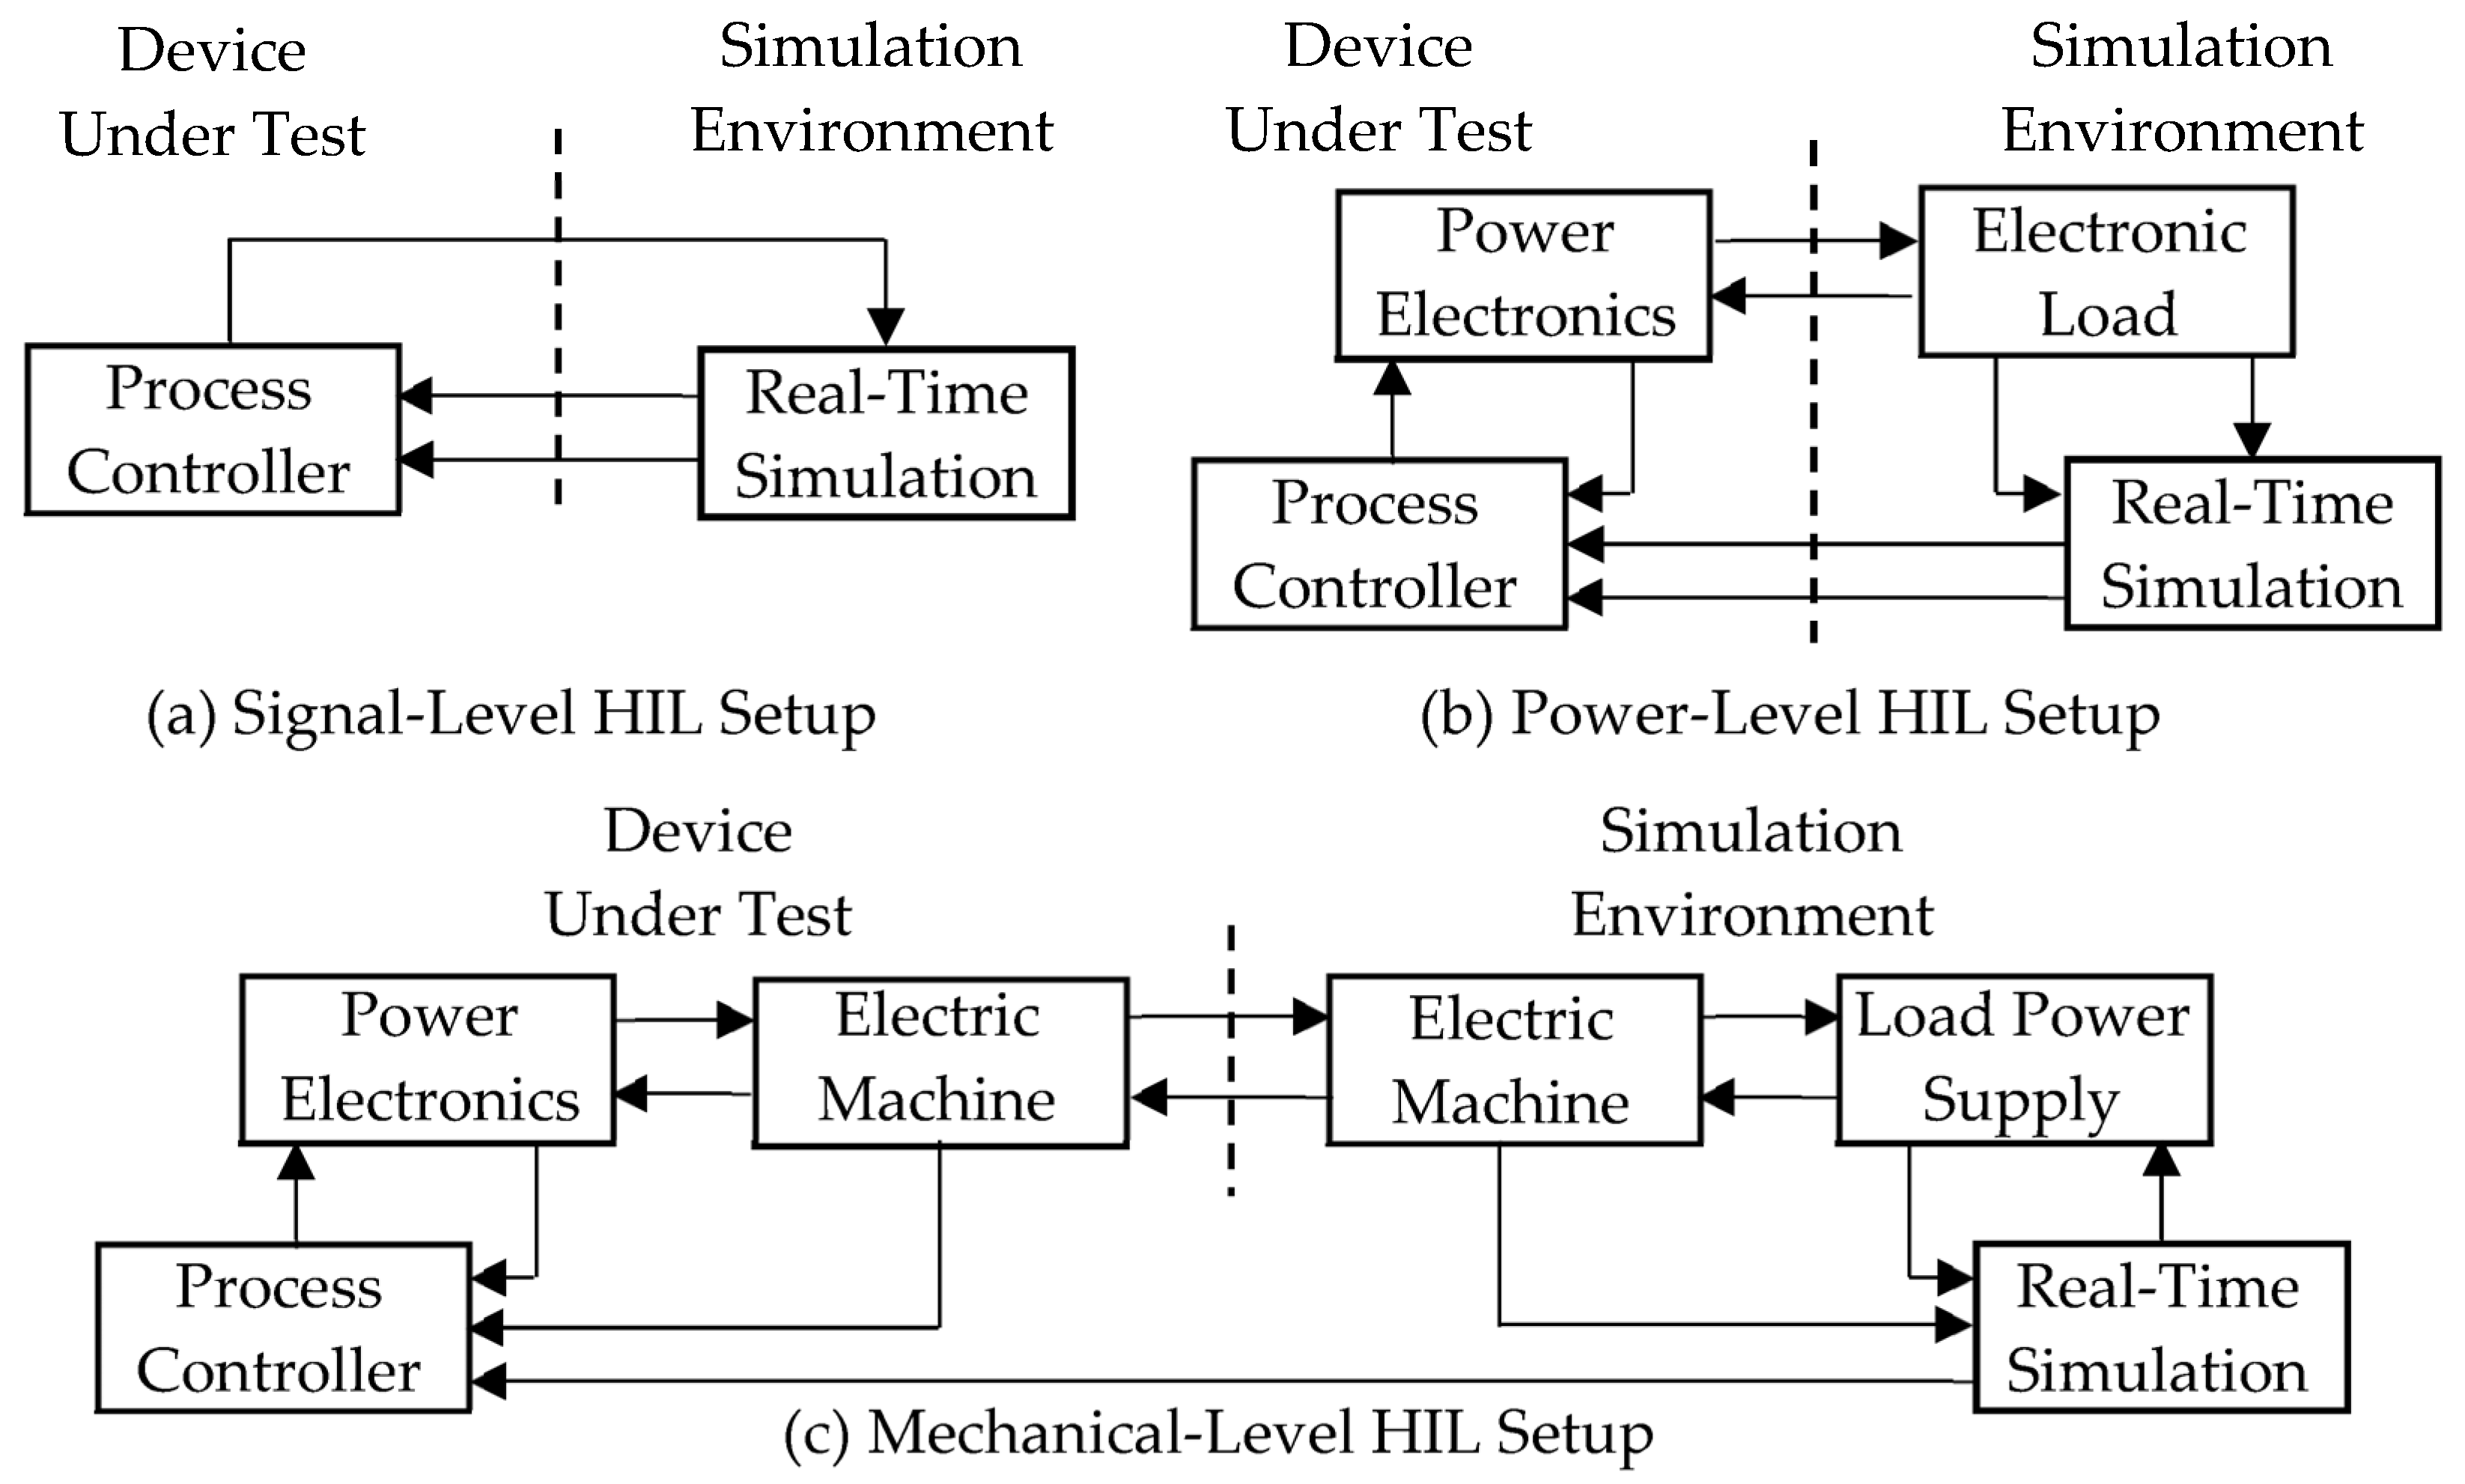
Signal-level setup (Figure 1a) involves testing the device-under-test (DUT) by injecting signals from a simulation environment, representing sensor data, and having the simulation environment read the data coming back from the DUT. Power-level HIL (Figure 1b) is an extension of signal-level HIL setup that involves adding a high-power section to the DUT. The simulation environment still sends representative sensor data to the DUT controller, but the DUT controller controls a physical power electronic system with its own feedback loop. The simulation environment controls an electronic load, which is interfaced to the power electronic system. A further extension of this setup, referred to as mechanical-level HIL (Figure 1c), involves all of the components of the power-level HIL, with the addition of electric machines. The electronic load in the simulation environment is removed and replaced by a load power supply and an electrical load machine, which are connected and controlled by the real-time simulation. On the DUT side, an electric machine is added, which interfaces with the simulation environment through the electrical load machine. The power electronic interface with the electric machine is controlled by the process controller.
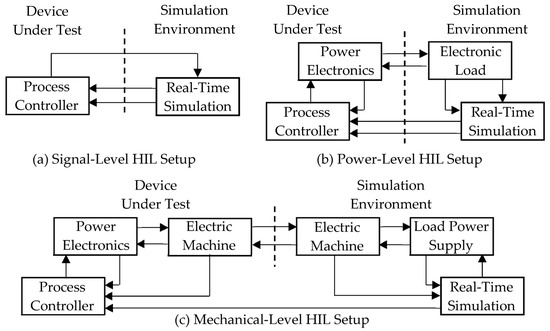
Figure 1.
Main HIL setup types.
The HIL simulations contained within an emulated environment can be reconfigured as many times as desired. HIL simulations with physical machines yield the most accurate real-world test results, but with the caveat of being able to operate in a very specific region according to the size and type of the machine being used. The adaptability of the HIL setup to changes in hardware is dependent on the software models being developed. If the software models are directly correlated with the hardware technology, either an additional software model that bridges the two technologies is needed or the hardware needs to change. Having a modular, small-scale HIL design allows quick changes to the hardware. However, if the software model is purely algorithmic, then the type of hardware does not matter. In addition, software models created for the same hardware technology used in the HIL setup can be used with the creation of a look-up table to scale efficiency.
A literature survey revealed a lack of adequate work on hardware-intensive, small-scale HIL testbeds for electrified vehicles. In fact, the proposed HIL testbeds are mostly software-intensive and operate based on detailed models of powertrain components, and do not reflect with high fidelity real-life conditions [7].
To be able to relate the results obtained from a small-scale testbed to those of a full-size system, several approaches have been introduced. A commonly used methodology is based on physically downscaling a full-size vehicle to one similar in size to a remotely controlled (RC) vehicle and performing actual tests on the miniaturized model [8,9,10]. The limitations of this approach are as follows. The availability of components to choose from to make a scaled vehicle is limited. The scaling factor must be chosen such that all the components within the desired scaled range are available. The model vehicle also requires a relatively large area to navigate in to perform the tests. The environment cannot be controlled precisely and is limited to what can be constructed physically for the RC vehicle to drive on (such as a dedicated treadmill). Additionally, not all test cases can be reproduced with ease and the results for the same case will not be identical in subsequent repetitions of the test. Another scaling methodology is based on the use of an Energetic Macroscopic Representation (EMR) model to represent the system, where user-defined components can be scaled down according to the conservation of energy [11,12]. This method is useful to examine system performance, with many components working together to verify system performance. This methodology involves using models available from simulation tools and requires very accurate models. The development of new models involves going back to the simulation tools and finding a means to verify the model, before implementing it using EMR software.
Motivated by the need for flexible, reconfigurable, and cost-effective tools to verify the performance of evolving electrified vehicle architectures in the design process, the aim of the work reported in this paper was to develop a small-scale, modular, HIL testbed platform for the drivetrain of EVs that is cost-effective, efficient, and easily movable and reconfigurable and allows integration of a battery pack.
The setup presented in the paper follows the mechanical-level HIL setup configuration, where the DUT is scaled instead of being full size. This is, in fact, a scaled mechanical-level HIL setup. The testbed is comprised of two directly coupled electric machines. The first machine (speed machine) emulates the traction motor and is controlled to make the vehicle speed follow the reference set by a pre-determined drive cycle. The second machine (load machine) is controlled to track the torque profile reflecting the vehicle’s parameters and driving environment while emulating a gearbox (if necessary) and compensating for the testbed losses. Both the DUT (speed machine and controller) and simulation environment (load machine and controller) are created using the same hardware and are powered through their own individual power supplies to isolate any potential power issues when running a test cycle. The real-time simulation follows a torque reference and uses the torque feedback from the load machine, while the process controller of the DUT tracks a speed reference and receives speed feedback from the speed machine.
The main reference for the work reported in this paper is the Master’s thesis of the first author of the paper [1]. The main contribution of the work is the development of a low-cost, high-efficiency, small-scale, movable, and reconfigurable, hardware-intensive, modular HIL testbed platform for the experimental study of full-size EVs, enabled by a two-way scaling algorithm. The power consumption of the testbed is limited to system losses, as the power circulates in the system, and except for initialization, very little power needs to be supplied by the external source. Additionally, the load machine in the testbed can emulate a gearbox (if needed), match the moments of inertia of the rotating parts of the testbed with that of the full-size vehicle, and compensate for losses in the testbed so that the speed machine can follow the speed reference irrespective of hardware losses or the differences between the losses of the full-size and reduced-size vehicles.
In this paper, a two-way scaling approach is introduced. Then, the design of a small-scale (6 kVA) modular HIL testbed with two physical electric machines capable of running a reduced-scale realistic test drive cycle is presented. Next, the HIL simulation results are presented and compared to those of computer simulation. Finally, some concluding remarks are made.
2. The Scaling Approach
The forces acting on a vehicle, related to the vehicle’s parameters and environmental conditions, are: (i) Rolling resistance, Froll; (ii) gravitational force, Fg; (iii) aerodynamic drag, Fdrag. In this section, the forces acting on the vehicle and the scaling approach adopted are elaborated on based on [13]. The force to be developed by the traction motor to overcome the forces acting on the vehicle and accelerate/decelerate the vehicle is:
where m is the vehicle mass, a is the acceleration, µ is the coefficient of friction, g is the gravitational acceleration, θ is the road angle, ρ is the air density, Cd I the drag coefficient, Af is the equivalent frontal area, v is the velocity, and vw is the wind velocity against the vehicle’s movement. The developed power of an electric motor, regardless of motor type, is:
where τmotor is the motor-developed torque and ω is the rotor angular velocity.
When scaling a full-scale vehicle down to the testbed setup, the focus is on scaling individual vehicular parameters rather than geometrical scaling. For simplicity, a scaling factor of 1/x (x > 1) is used. Following the laws of kinematics, the mass, acceleration, vehicle velocity, and wind velocity are scaled by a factor of 1/x, while the frontal area is scaled by a factor of 1/x2. Time is kept constant between the full-size and scaled-down systems. If necessary, time can also be scaled as a separate variable, irrespective of the scaling factor 1/x.
Upon scaling the full-size vehicle model, (1) yields:
In (3), subscripts 1 and 2 refer to the full-size and scaled vehicle models, respectively. To allow scaling back of the results to the full-size level, an inverse transformation approach given by (4) was devised, where the full-size vehicle force is obtained using only the scaled model’s parameters.
Noting that the scaling factor for velocity is 1/x, i.e.,
the power of the full-size and scaled vehicles can be obtained using (6), where F is the vehicle force and i = 1 and 2 refer to the full-size and scaled vehicles, respectively.
Equation (2) can be rewritten as:
where J is the moment of inertia, α is the angular acceleration, and ω is the angular velocity. In the testbed setup, the inertial components of each of the two squirrel-cage induction machines (both ACX-2043 from Advanced Motors and Drives, East Syracuse, NY, USA) consist of a larger solid cylinder (the rotor), a smaller solid cylinder (a small protrusion referred to as shaft), and a coupling. The moment of inertia of each machine, Jmachine, can therefore be described as:
where r and m denote the radius and mass and the subscripts r, s, and c refer to the rotor, shaft, and coupling, respectively. Since the velocity and radius are both scaled by the same scaling factor, the angular velocity remains the same for the full-size and scaled vehicle models according to (9).
The concern that the traction motor in the full-size vehicle may assume speeds beyond the capability of the testbed machines can be addressed by including a physical gearbox in the testbed. Most EV transmissions use a gearbox with a single gear ratio to maintain a high motor efficiency across the entire operating region. However, in a testbed setup, which is meant to be capable of testing different vehicles, using a gearbox with a single gear ratio cannot represent gearboxes of different gear ratios. A continuously variable transmission (CVT) is not a desirable option either, due to the relatively low efficiencies of CVTs [14,15]. Changing the angular velocity of the testbed system using a virtual gearbox in software proves to be an advantageous option due to the ease of reconfiguration for different gear ratios. The load machine was therefore given the additional role of realizing a virtual gearbox. The load machine was also made to compensate for the efficiency loss/gain in the speed machine, since the efficiency varies as the machine assumes different operating points while maintaining the same shaft output power. A third additional role for the load machine is compensating for the moment of inertia mismatch between the full-size and scaled vehicles through the addition or subtraction of a torque component.
When incorporating a gearbox (physically or in software), the moment of inertia is changed by the square of the gear ratio [16], as shown by (10).
In (10), Jtotal is the testbed’s overall moment of inertia, JT is the moment of inertia of the speed machine, JG1 is the moment of inertia of the gear on the traction motor side, N1/N2 is the gear ratio, JG2 is the moment of inertia of the gear on the load machine side, JC+L is the moment of inertia of the coupling and load machine, and Jvirtual is the virtual inertia required for the moment of inertia compensation.
Substituting the moment of inertia calculated by (8) into (7) allows the total power of the testbed to be obtained. The testbed speed machine power must match that of the scaled model found in (6) while satisfying the conservation of energy. The fact that with a gearbox implemented in software the shafts of both machines spin at the same speed must be considered in the calculation of the moment of inertia. Depending on the scaling factor chosen for the scaled model and the gear ratio implemented, the amount of virtual inertia that is to be added or subtracted to maintain energy conservation will differ.
Scaling the HIL simulation results obtained from the testbed back to the full-size vehicle level involves utilizing the speed machine torque according to (11).
In (11), τ2 is the testbed speed machine torque, 1/x is the scaling factor, r2 is the testbed speed machine’s rotor radius, and G2 is the testbed virtual gearbox gear ratio. To find the full-size vehicle torque, (11) is multiplied by the full-size vehicle traction motor radius, r1, and divided by the full-size vehicle gear ratio, G1, as in (12).
Finally, the shaft speed of the testbed vehicle model can be brought up to the full-size vehicle level, as given by (13).
In (13), n is the speed in rpm, r is the motor shaft radius, G is the gearbox ratio, and 1/x is the scaling factor. The method to scale the results of the hardware-in-the-loop system back to the full-size vehicle level is straightforward. Through the bidirectional scaling approach, it can easily be verified if the full-size vehicle meets the design criteria and by what margin.
To demonstrate the performance and capabilities of the two-way scaling approach, a “2014 Tesla Model S Performance” was used as the test vehicle. To evaluate the performance of the vehicle, the Environmental Protection Agency (EPA) Urban Dynamometer Driving Schedule (UDDS) drive cycle for battery electric vehicles (BEVs) [17] was used. The full-size vehicle parameters were scaled by a scaling factor of 1/x = 1/2.5, and the parameters of the full-size and scaled models are given in Table 1. Note that the frontal area has been scaled by 1/x2 = 1/6.25.

Table 1.
Full-Size and scaled vehicle parameters (scaling factor: 1/x = 1/2.5).
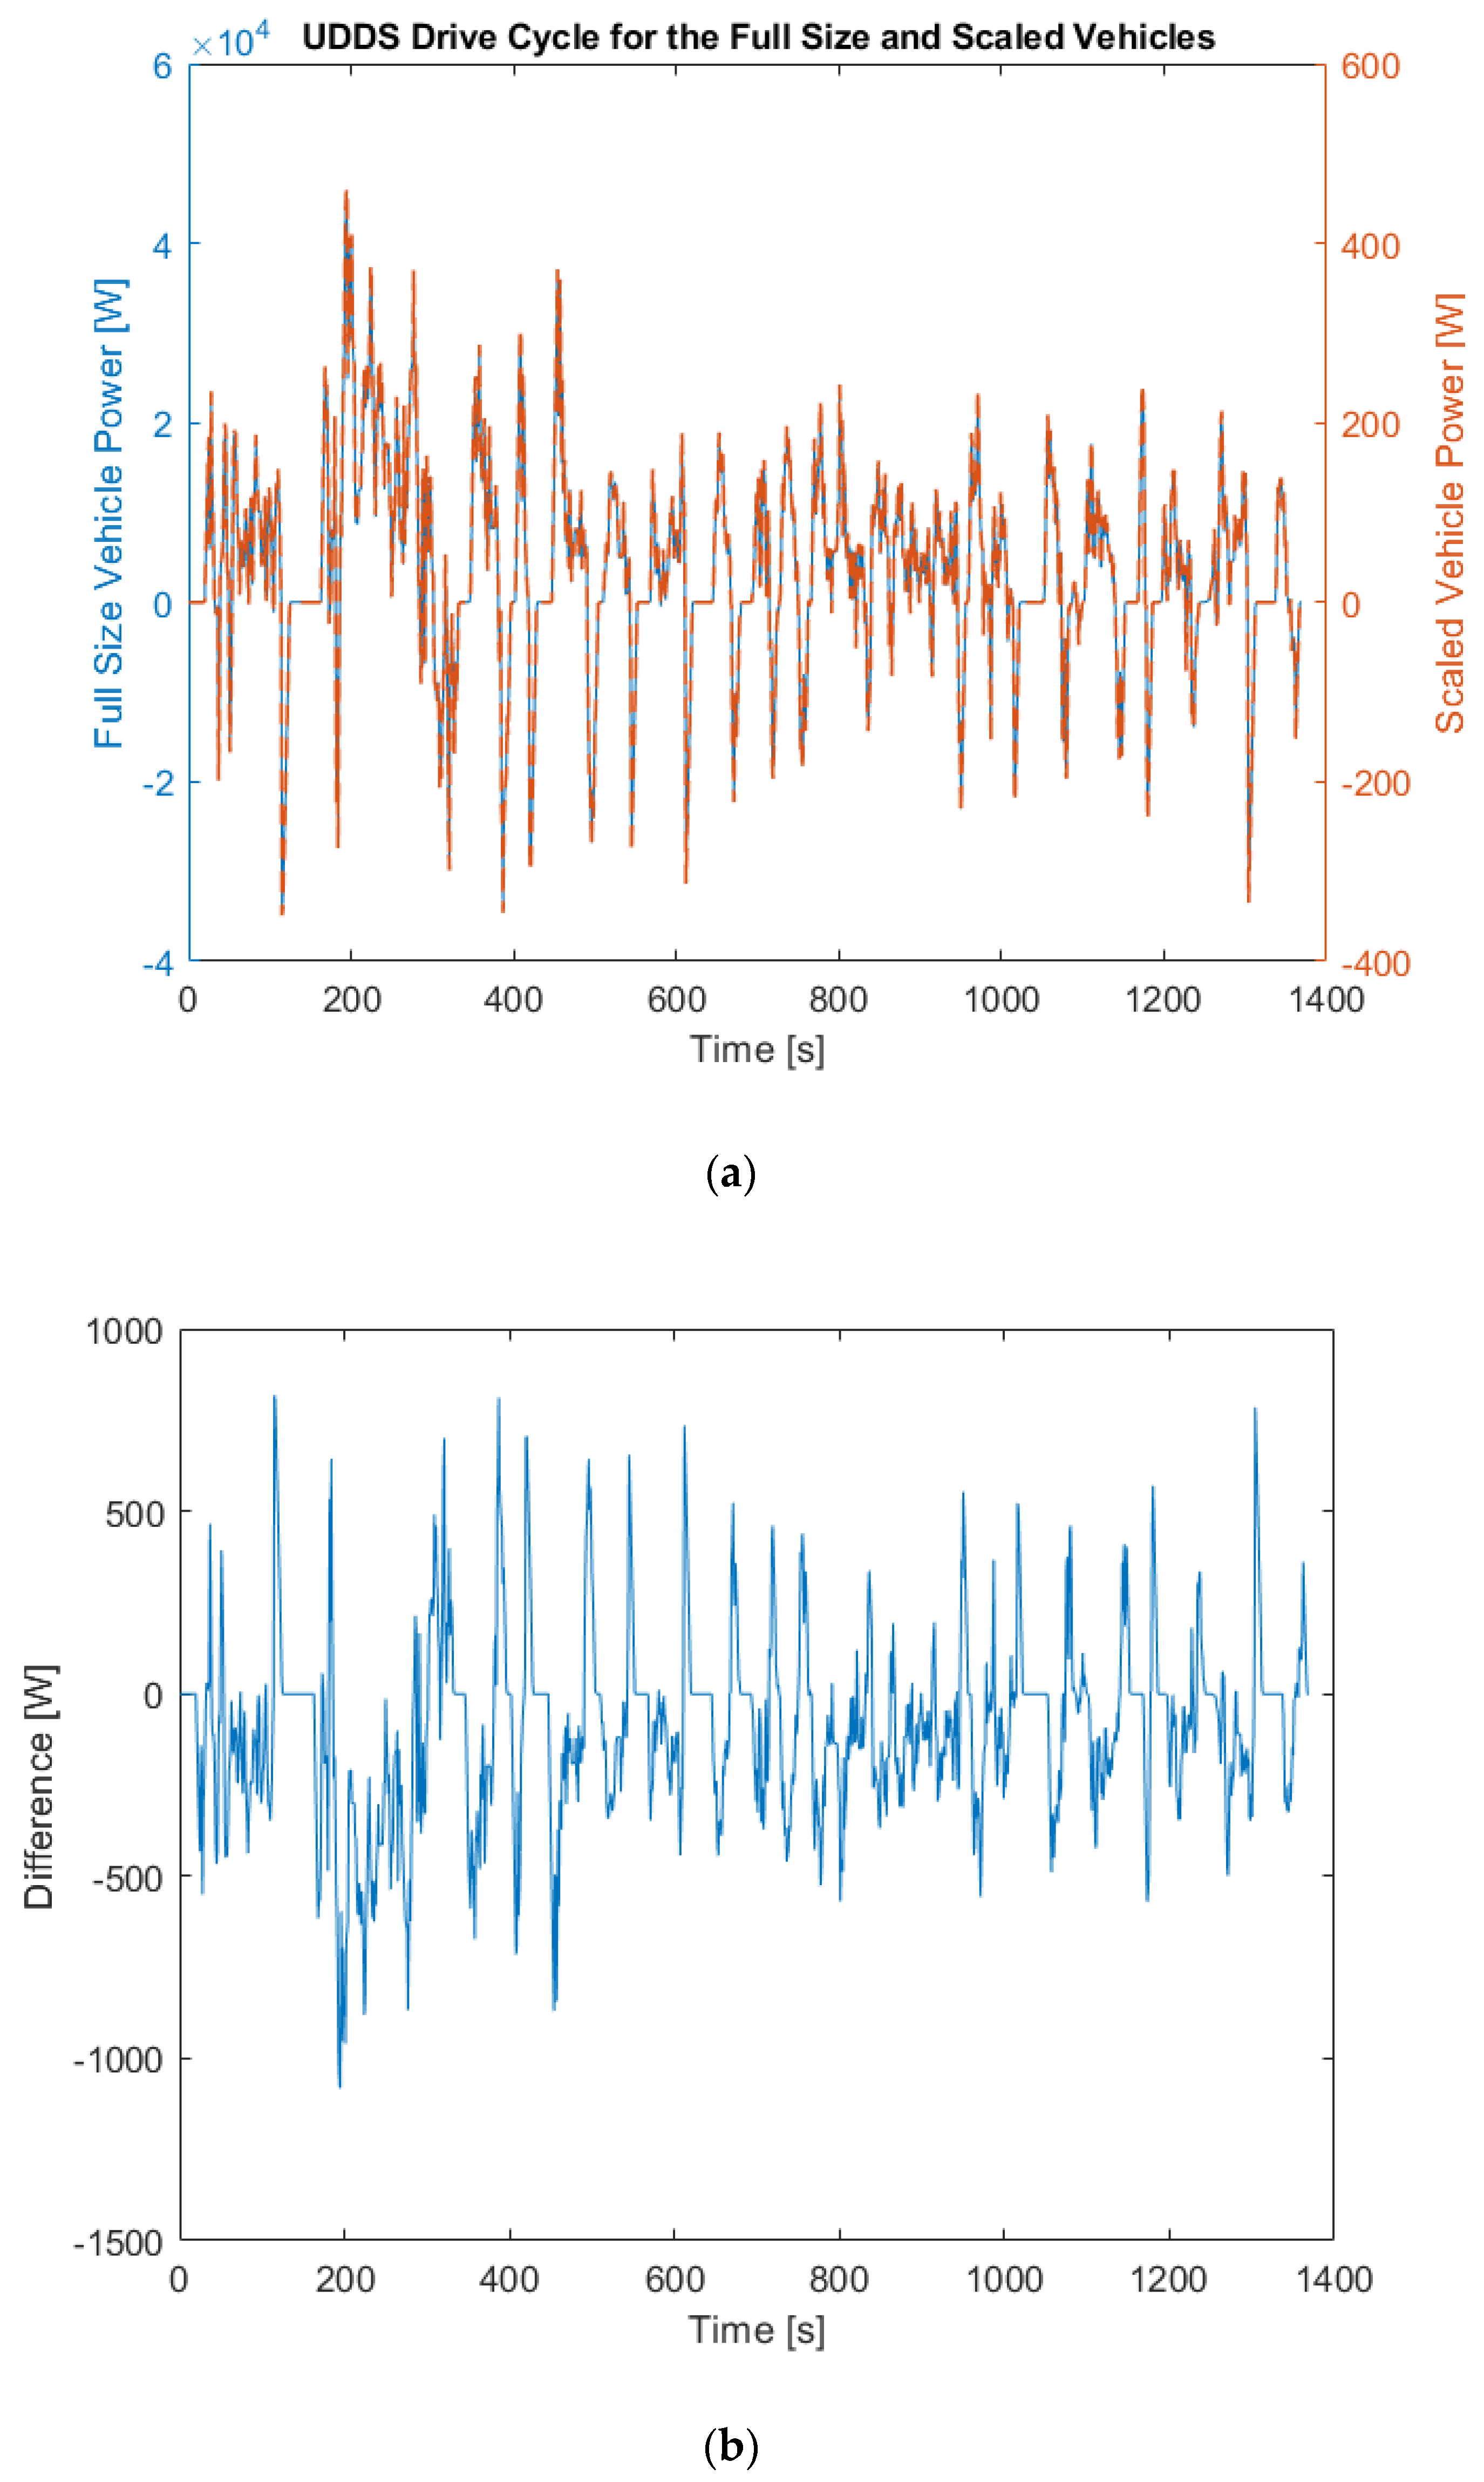
To verify that energy conservation is maintained, and thus validate the scaling approach, the power of the full-size vehicle was overlaid in time with that of the scaled vehicle over the entire drive cycle, as shown in Figure 2a. To further verify the efficacy of the two-way scaling approach, the difference between the power of the full-size vehicle and that of the scaled vehicle when scaled back to the full-size vehicle level is shown in Figure 2b. Upon verification, the scaling approach can be used with confidence.
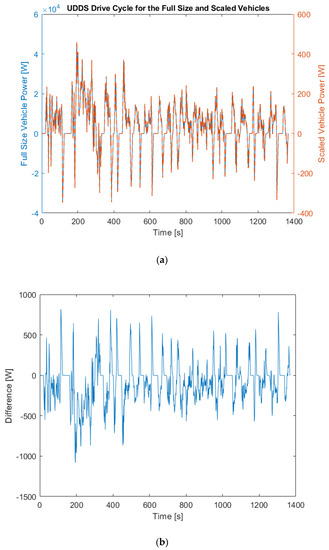
Figure 2.
(a) Powers of full-size and scaled vehicles overlaid in time over the UDDS drive cycle. (b) Difference between the power of the full-size vehicle and the scaled vehicle when scaled back to the full-size vehicle level.
3. Modular HIL Testbed Design
Figure 3 shows a block diagram of the HIL system setup that is comprised of a source, an AC/DC converter, two DC/DC converters, two machines (speed and load), two DC/AC converters (or machine controllers), two shafts, and a mechanical coupling.
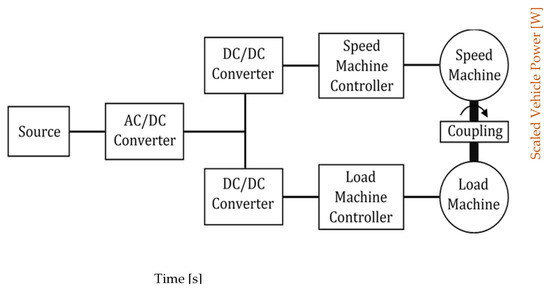
Figure 3.
Block diagram of the HIL system setup.
3.1. AC/DC Converter
The AC/DC converter is fed from an external AC source (such as utility grid) and regulates the voltage at the common DC bus of the two DC/DC converters. The AC/DC converter is bidirectional and rated at 6 kVA. If a DC source (DC grid) is available, the AC/DC converter is replaced by a bidirectional DC/DC converter. Upon completion of the initialization procedure, the power drawn from the source is limited to the system losses, as the main power circulates within the system. The AC/DC converter uses a PM50CL1A120 module from Powerex (western Pennsylvania, USA), with six 1200 V, 50 A IGBTs and a 750 µF capacitor across the DC bus. A soft-start scheme limits the inrush current at start up. At rated power, and with a three-phase, 208 V, 60 Hz AC supply, the rated AC-side current is 16.65 A. The AC-side filter inductors were designed based on (14) to limit the peak-to-peak current ripple to 30% of the rated current, limit electromagnetic interference on low-voltage lines, facilitate current measurements for the microcontroller, and reduce the total harmonic distortion (THD) of AC-side currents [18].
In (14), L is inductance in H, Vdc is the DC bus voltage in V, fs is the switching frequency in Hz, is the maximum peak-to-peak current ripple in A, and m is the modulation index. Using the specifications Vdc = 350 V, fs = 20 kHz, = 5.0 A (30% of 16.65 A), and m = 1, the minimum required inductance was found to be 1.01 mH. The core selected for the inductor was FS-250026-2 by Micrometals, Inc. (Anaheim, USA). The design used a stack of two ferrite cores, with a single 11 AWG winding. The resulting inductance was measured as 1.22 mH at no load. At full load of 16.65 A, with no saturation involved, the inductance was estimated as 1.12 mH. The resultant peak-to-peak current ripple was 4.51 A or 27.1% of the rated current. At maximum load, the total losses were 14.63 W, with a temperature rise of 45 °C. With the AC-side inductor design, the −3 dB point for the low-pass filter was located at 166 Hz.
The DC-side capacitor was designed based on (15) to limit the peak-to-peak voltage ripple to 0.5% of Vdc or 1.75 V [19].
In (15), C is the capacitance in F, Iout is the average value of the rated DC-side current in A, fs is the switching frequency in Hz, and is the maximum peak-to-peak voltage ripple in V. Using the design specifications Iout = 20 A, fs = 20 kHz, and = 1.75 V, the minimum required capacitance was found to be 71.4 µF. With no stray resistance or inductance considered in (15), to ensure a minimum noise attenuation of −40 dB at 20 kHz, the capacitance was increased to 750 µF and was realized by five parallel 150 µF Kemet C4DEHPQ6150A8TK film capacitors.
The real-time controller was created on a Texas Instruments Delfino TMS320F28335 microcontroller. The AC/DC module, excluding DC-side capacitors, is shown in Figure 4.

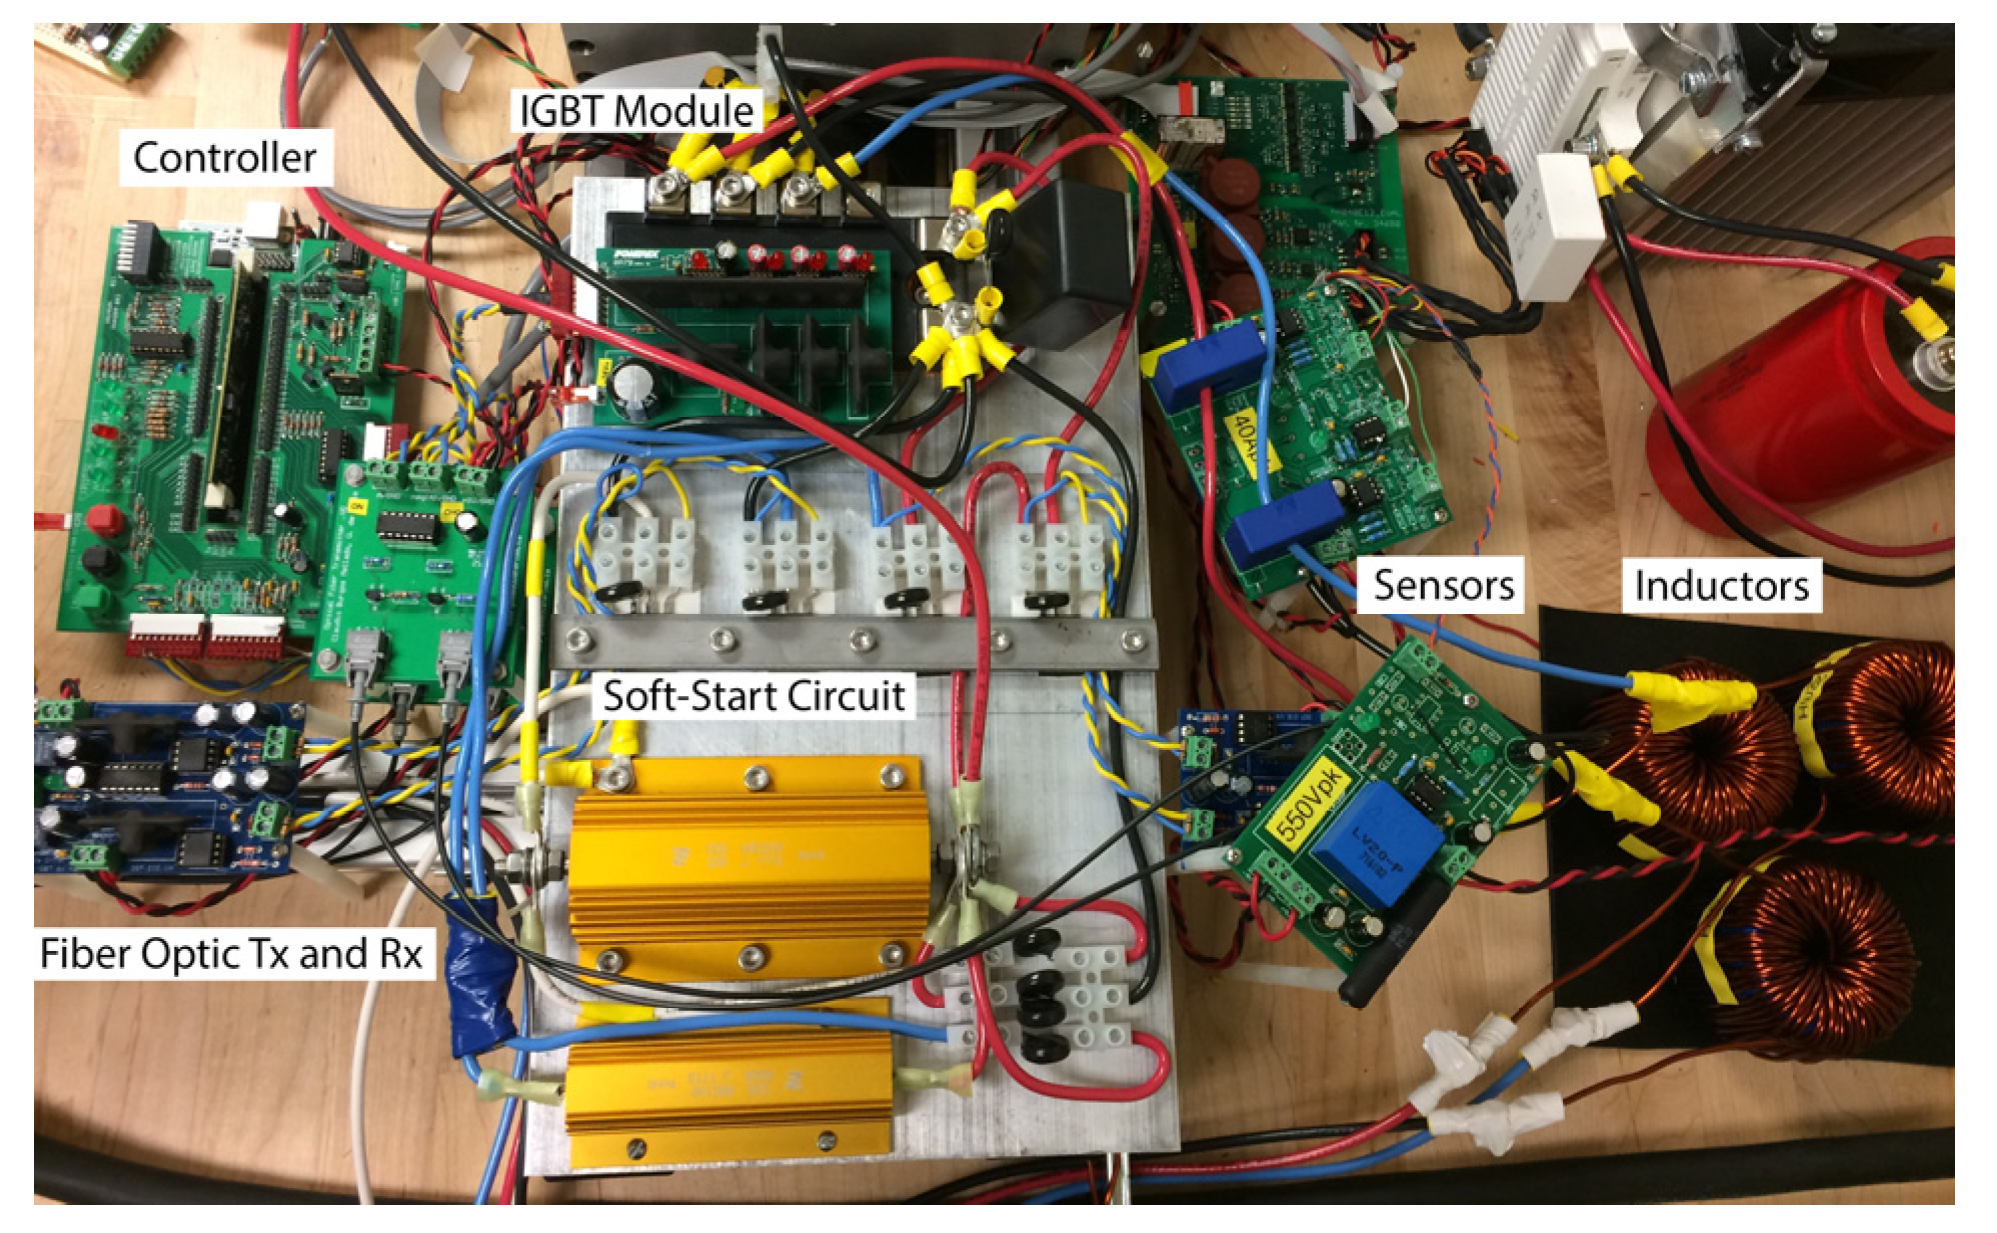
Figure 4.
AC/DC module of the HIL testbed.
The induction machines used in the testbed were rated at 49.7 Vrms and were controlled by two inverters, operating under SVPWM. The DC/DC converters interfaced the 350-V DC bus of the AC/DC converter to the 100 V DC buses of the traction motor and load machine inverters. The 100 V level meets the minimum voltage of 70.3 V required on the DC side of the inverters to ensure proper machine operation.
3.2. DC/DC Converters
The two DC/DC converters use bidirectional buck-boost topology. Powerex CM100DY-12H IGBT switches of 600 V and 100 A were used, with duty ratios in the 10%–90% range.
The low-voltage side inductors were designed for 350 V on the high-voltage side, 100 V on the low-voltage side, a duty cycle of 0.286, a switching frequency of 20 kHz, and a current ripple of 15%. For a 6 kVA power flow at 100 V, the current was 60 A, with a 9 A peak-to-peak current ripple, leading to a minimum inductance requirement of 397 µH. The final inductor design had an inductance of 560 when measured under no load. The resultant peak-to-peak current ripple was 8.21 A or 13.7% of the maximum current. The design used a stack of three ferrite cores, with dual 11 AWG windings in parallel, to take advantage of mutual inductance and reduced ohmic losses. At maximum load, the total losses were 67.87 W, with a 91 °C temperature rise.
Based on the design specification of 0.1% fora capacitor voltage ripple on the low-voltage side, (16) was used to find the minimum required capacitance [20].
In (16), C is capacitance in F, ∆IL is the inductor current peak-to-peak ripple in A, fs is the switching frequency in Hz, and ∆Vo is the capacitor voltage peak-to-peak ripple in V. The minimum required capacitance was found to be 513 µF. An off-the-shelf 1 mF aluminum electrolytic capacitor was used.
The DC/DC converters used the same microcontroller that was used for the AC/DC converter. The control loops for both converters were implemented on the same hardware, with real-time control. Figure 5 shows the DC/DC converter modules.
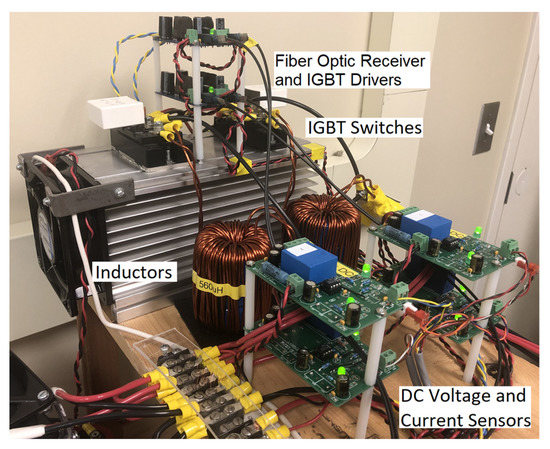
Figure 5.
DC/DC converters without capacitors and controller.
3.3. Electric Machines and DC/AC Converters
The choice of two electric machines for the testbed was made based on availability, as well as size and weight limitations of the lab bench, performance (capability of running a full drive cycle, meeting the torque, speed, and acceleration requirements), and reasonability of price. The DC/AC converter modules were chosen based on availability and machine characteristics.
The specifications of the Advanced Motors and Drives ACX-2043 induction machines used in the testbed are given in Table 2. The drawbacks of the machine type used were low voltage and high current ratings (resulting in extra losses), a relatively low top speed due to back EMF, and higher than necessary torque capability for a testbed.
Table 2.
Induction machine specifications.
Each machine was controlled by a Texas Instruments Delfino TMS320F28335, running the field-oriented control (FOC) algorithm. The microcontroller was also given the task of running the hardware blocks PWM, ADC, I2C (for communication between the modules), UART (for one-way data transfer to the computer), and QEP (for shaft speed measurements). The IGBT module used in the DC/AC converters was Infineon IFS150V12PT4, capable of handling up to 150 Arms and 850 V, with a switching frequency of 20 kHz.
In the control loop, the machine slip is calculated using classical induction machine equations based on the time constant, τ, given by (17).
In (17), Rr is the rotor resistance, Llr is the rotor leakage inductance, and Lm is the magnetization inductance.
To control the speed of the motor, the slip is controlled based on the direct- and quadrature-axis current references. The slip speed of the motor, ωsl, is given by (18).
In (18), ωe is the electrical angular speed, ωr is the rotor angular speed, Rr is the rotor resistance, iqs id the quadrature-axis stator current, Lr is the rotor inductance, and ids is the direct-axis stator current. The time constant τ given by (17) defines how quickly the flux of the motor can follow the reference in the field-weakening mode.
In FOC, the flux and developed torque are controlled by the d- and q-axis components of the stator current, respectively. The flux component of the stator current is estimated by (19).
In (19), ids is the flux component of the stator current, Vrated is the machine rated voltage, frated is the machine rated frequency, Lm is the machine magnetizing inductance, and Lls is the machine stator leakage inductance. The steady-state value of ids needed to achieve the rated motor characteristics was found to be 43.61 A.
Under the rated operating conditions, the maximum torque that can be produced is 13.51 N.m at a stator current of 101.1 A and a rotor base speed of 4021 rpm, according to (20) [21]. Beyond the base speed, field weakening is implemented.
As far as the testbed operation is concerned, the torque and speed capabilities of the machines meet the requirements.
Under indirect field-oriented control, the induction machine can be operated as a motor in three different regions, i.e., the constant/maximum torque region, the constant power/field-weakening region, and the reduced power region. In the constant/maximum torque region, from standstill to base speed, the flux reference is constant unless it is reduced to minimize losses and the power increases linearly with the speed. In the constant power/field-weakening region, beyond the base speed, the flux is reduced inversely proportional to the speed, a constant power is maintained, and a greater speed is achieved at the expense of lower torque and greater slip. Finally, in the reduced power region, the flux is reduced inversely proportional to the square of the speed, resulting in a torque reduction at the same rate while the slip remains constant and the power decreases even further as the stator current decreases while the stator voltage remains constant [22]. In the generating mode, the quadrature-axis current reference reverses sign, and two of the phases in the abc-frame swap places by interchanging the gating signals of the switches of two legs of the DC/AC converter controlling the machine. The field-weakening mode of operation for the testbed machines (even though included in the controllers) was not required due to the scaling approach implemented. The operating region beyond field weakening was not implemented. Regenerative braking was accommodated, as a requirement for testbed operation.
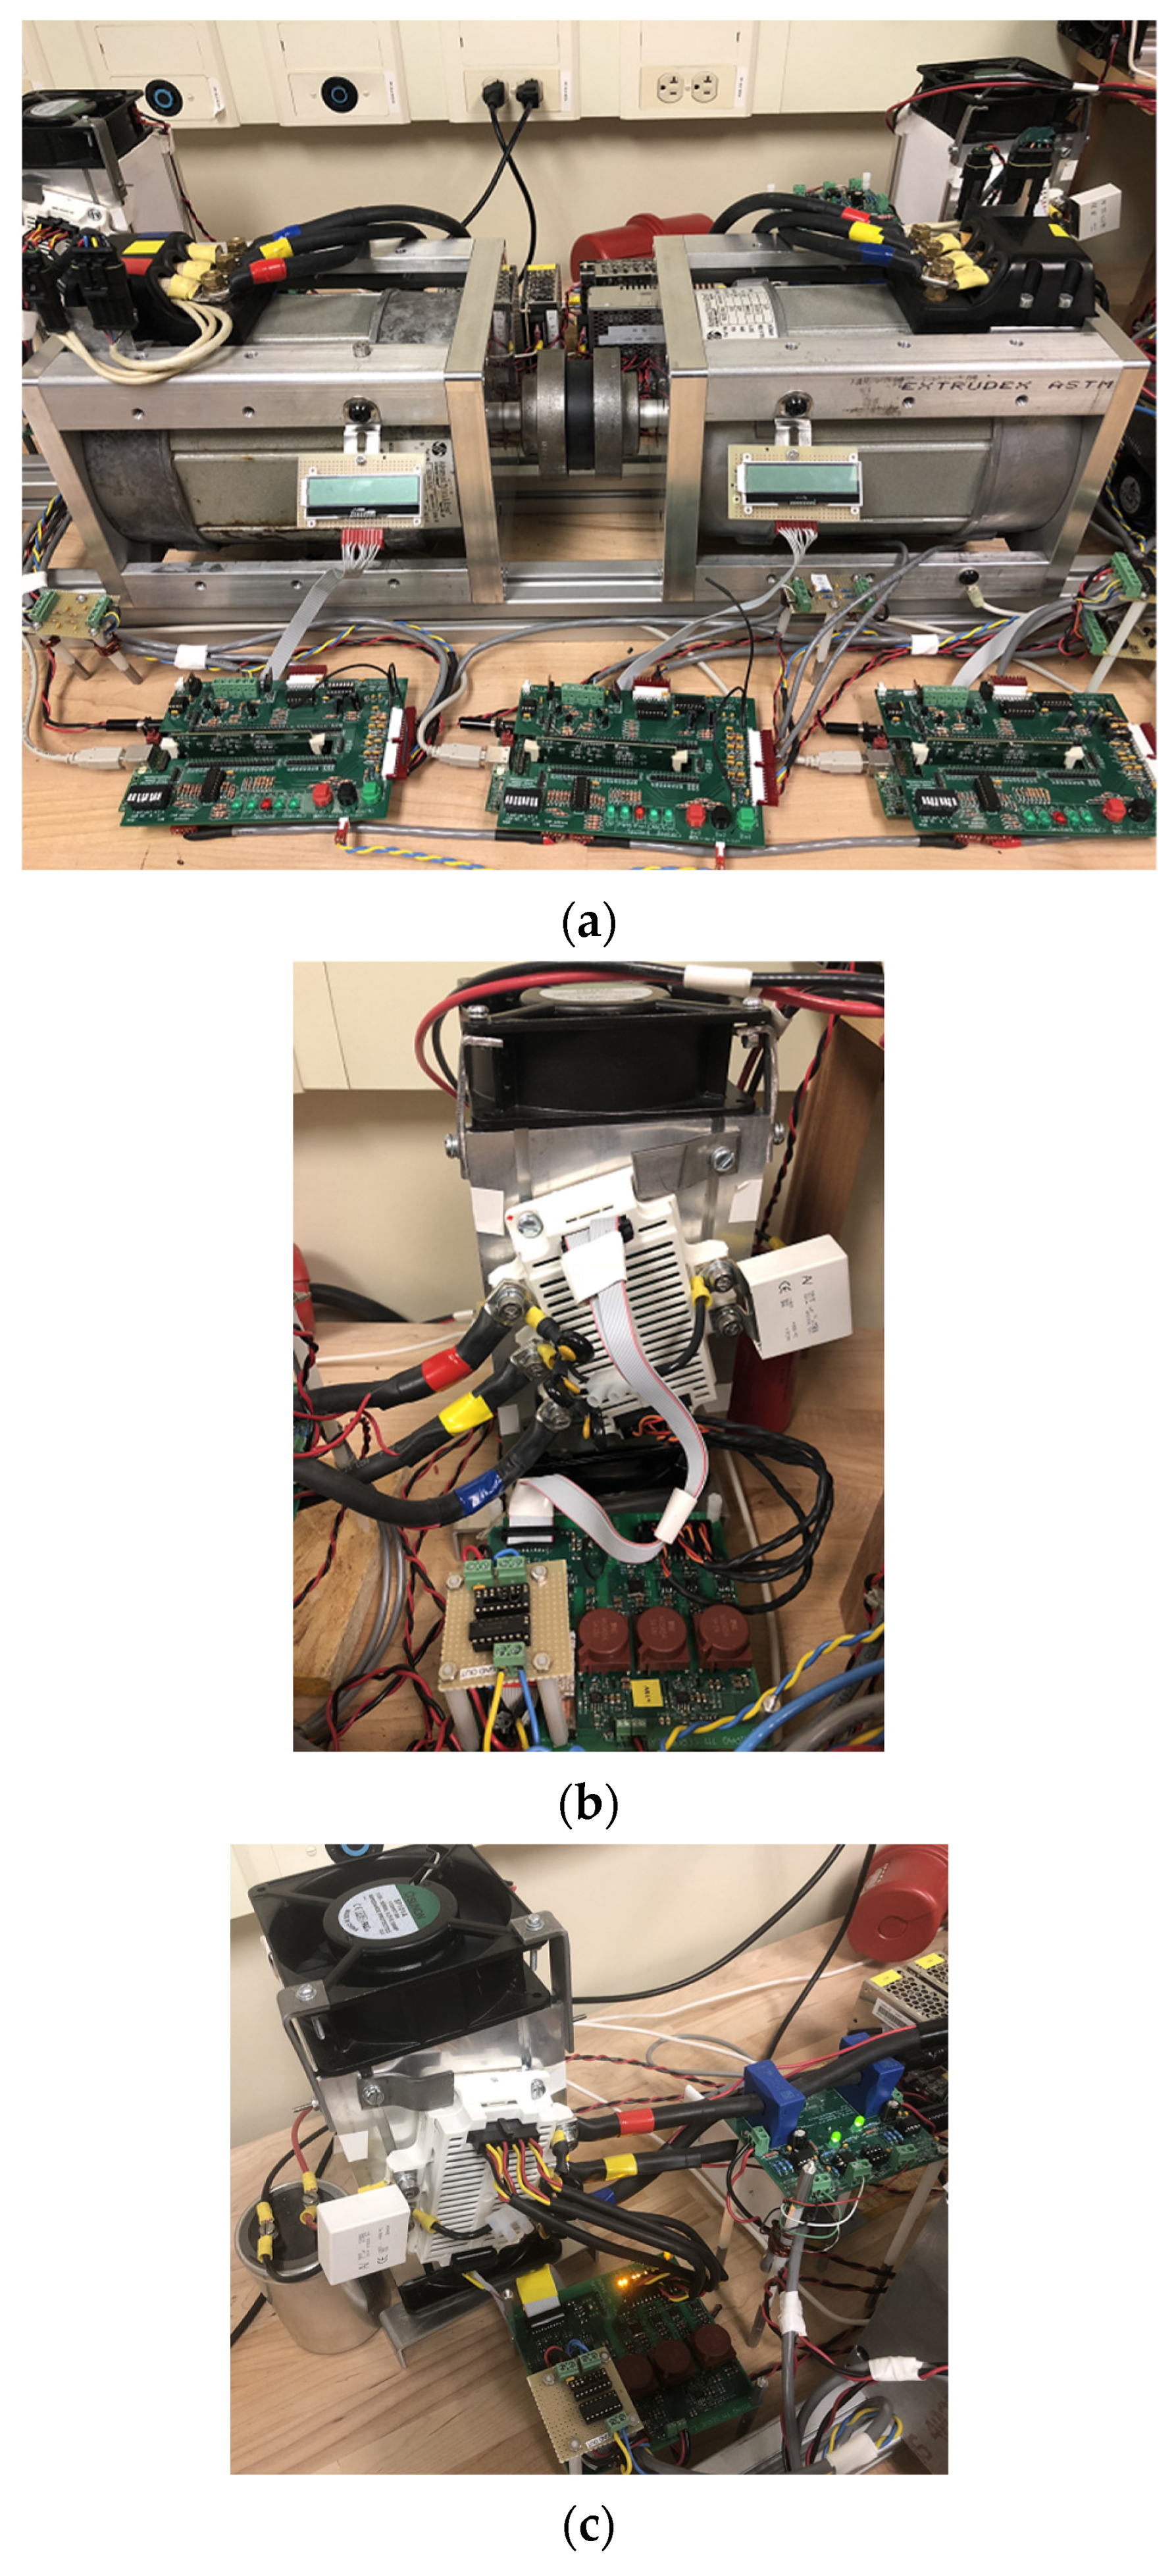
The induction machines and DC/AC converter modules are shown in Figure 6. The motor, cradle, shaft, and controllers are shown in Figure 6a. The IGBT modules, gate drivers and power supplies for the speed and load machine controllers are shown in Figure 6b,c, respectively.
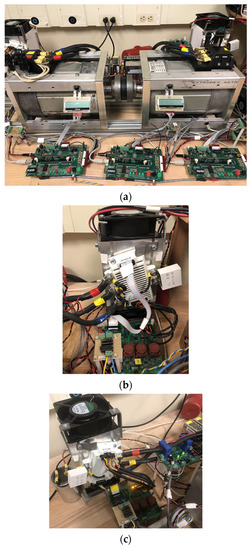
Figure 6.
Induction machines and DC/AC converters. (a) Coupled machines and controllers. (b) Speed machine IGBT module and accessories. (c) Load machine IGBT module and accessories.
3.4. Integration of an Energy Storage System in the Testbed
The testbed allows integration of a scaled battery pack, representing the vehicle’s battery pack for battery-related research. To realize this, the top DC/DC converter in Figure 3 was disconnected from the AC/DC converter. The battery pack was then connected to the traction motor controller’s DC terminals either directly or via the DC/DC converter, with the battery pack connected on the low-voltage side (to allow a battery pack of lower voltage rating) and the traction motor DC/AC converter connected on the high-voltage side.
4. Results and Discussions
The scaled UDDS drive cycle was used to evaluate the performance and capabilities of the testbed under the two-way scaling approach. The simulation results were obtained using PSIM by Powersim, Inc., and were used as a basis for comparison of the HIL simulation results.
The computer simulation results are shown in Figure 7. They represent the scaled test results of the full-size vehicle in the absence of actual test results for said vehicle. It should be noted that when verifying the performance of evolving electrified vehicle architectures in the design process, the goal is to conduct the tests on a scaled testbed prior to having an actual vehicle.
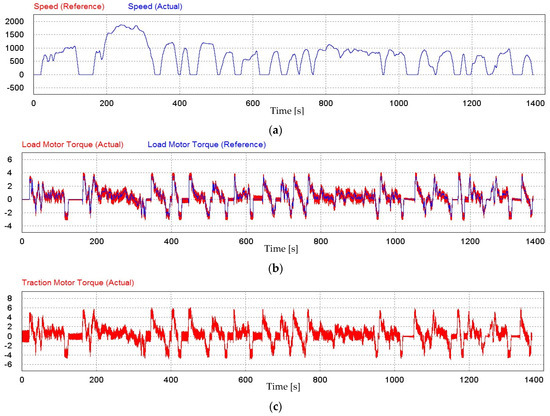
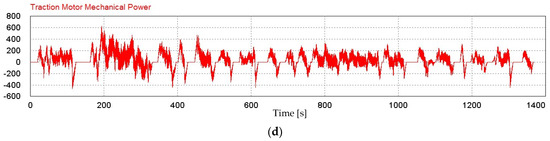
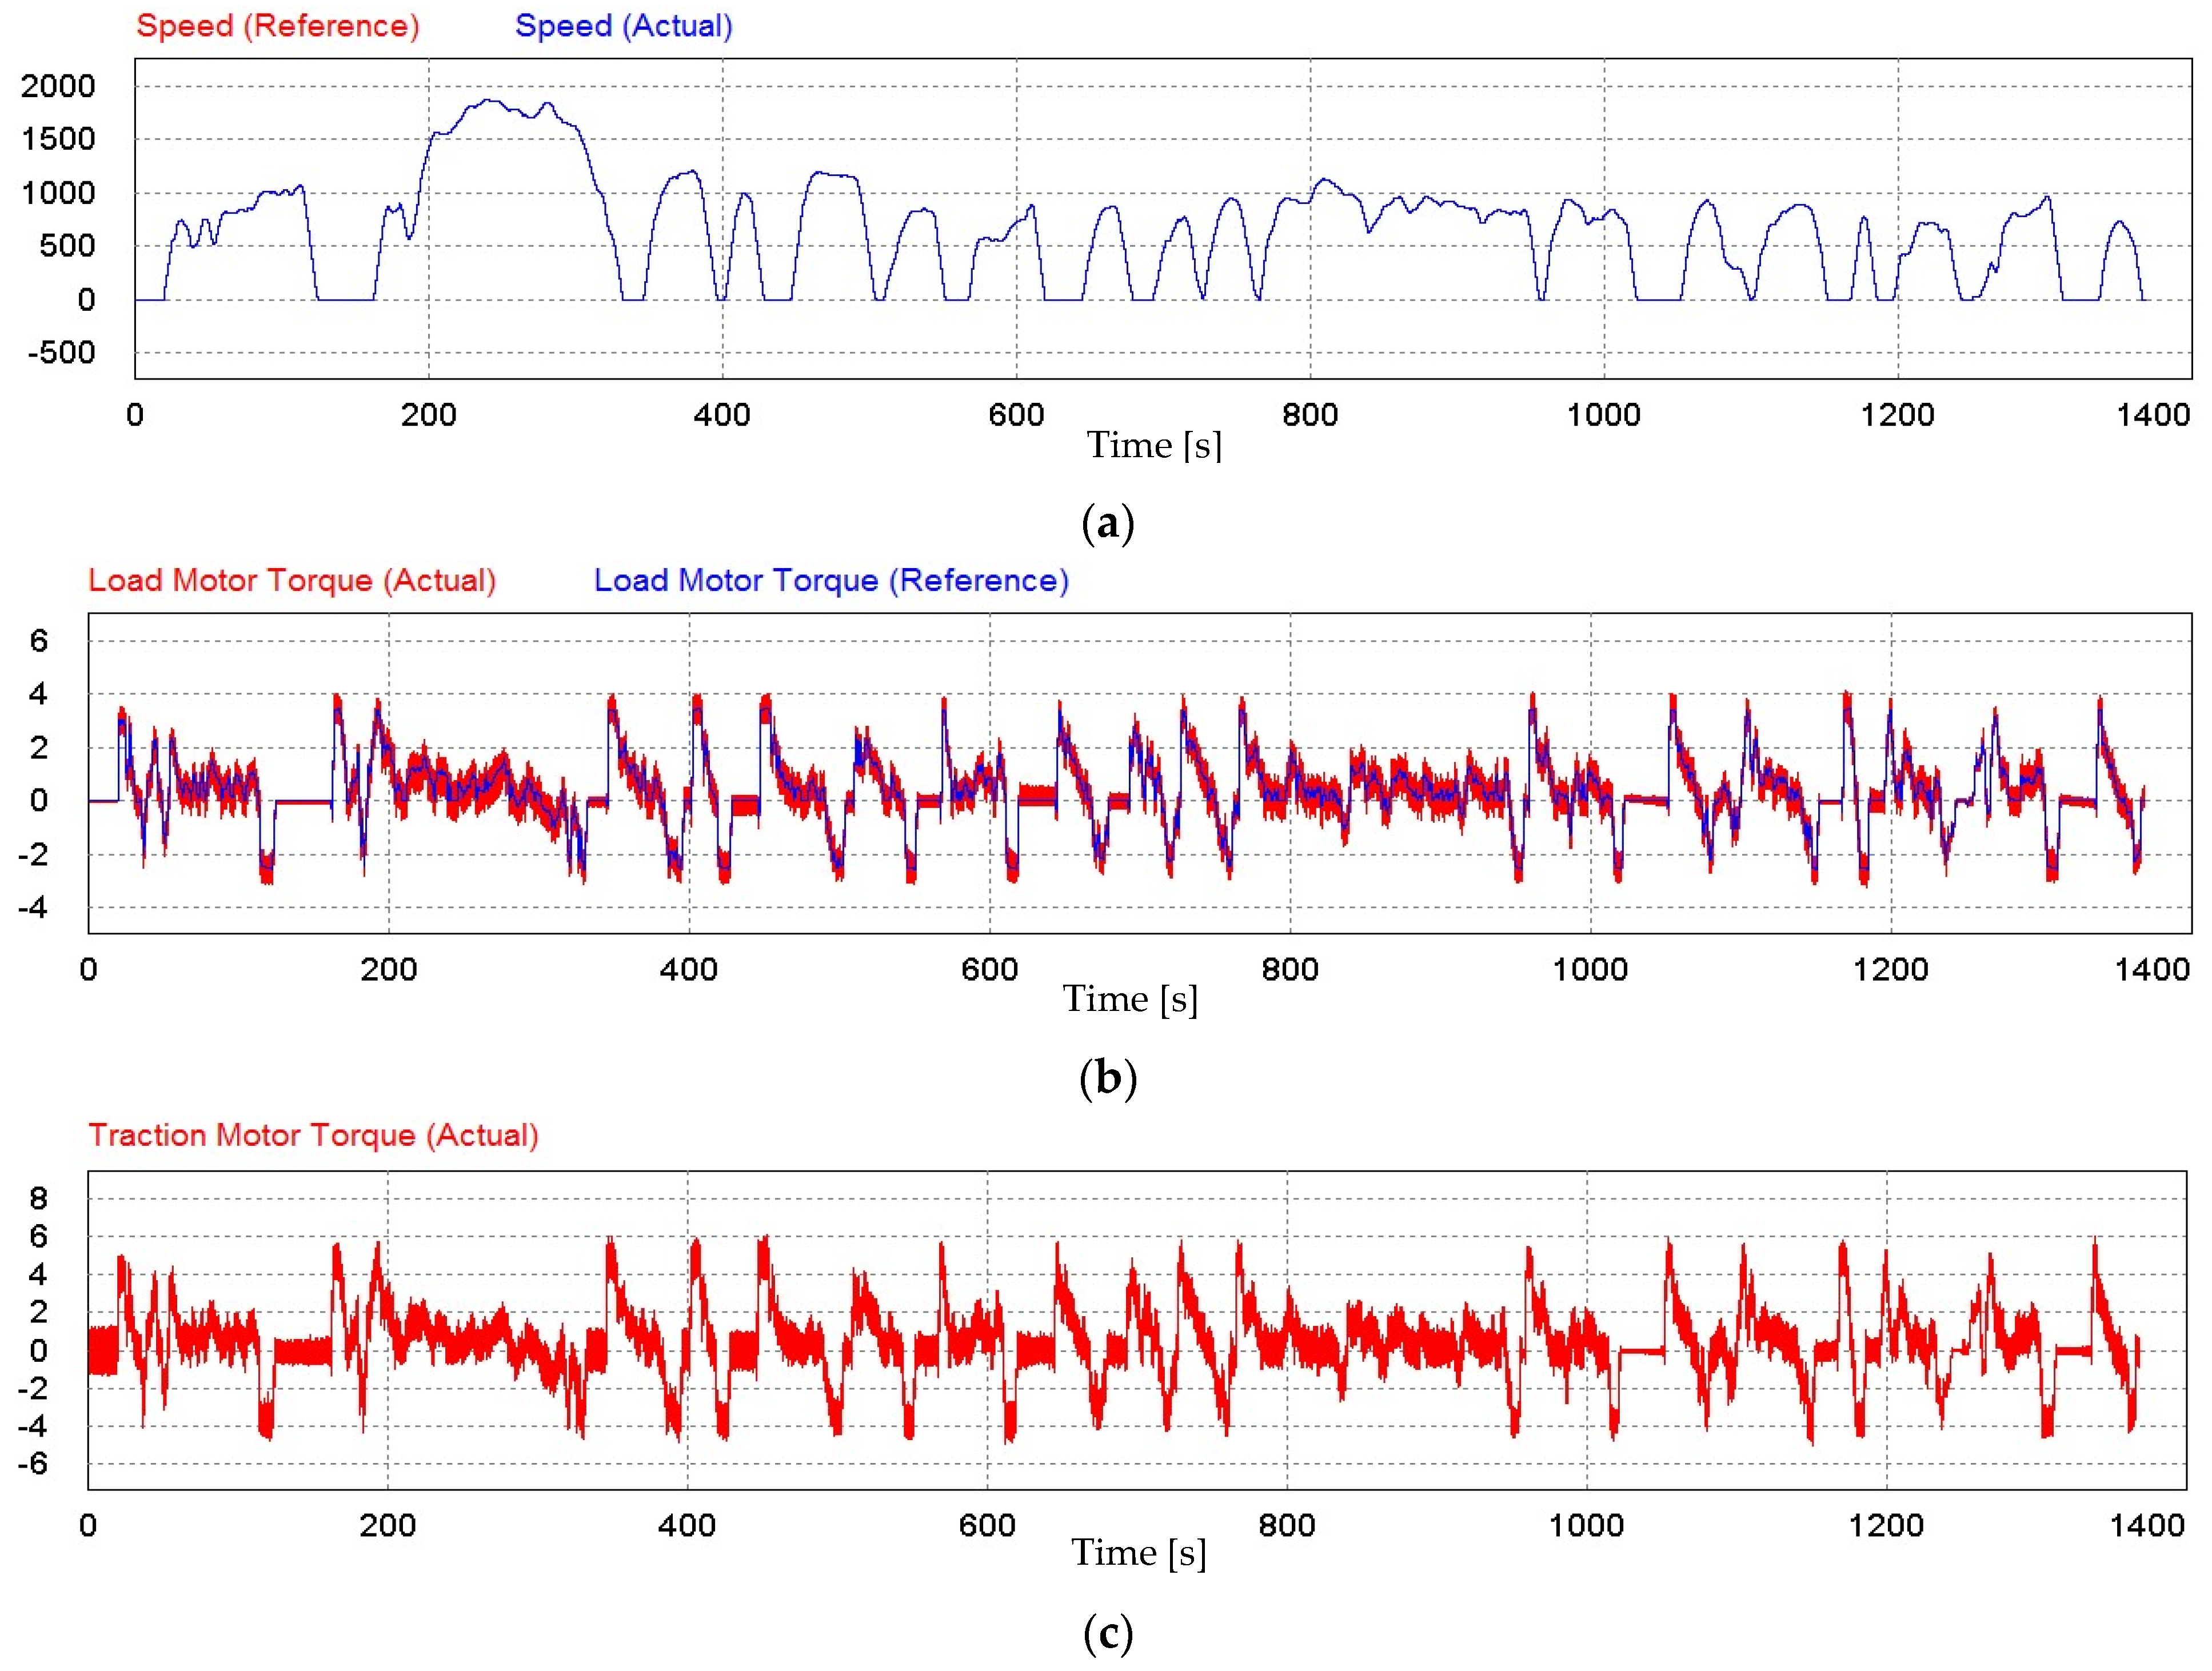
Figure 7.
Computer simulation results. (a) Speed machine’s speed reference and actual speed (rpm). (b) Load machine’s torque reference and actual torque (N.m). (c) Speed machine’s torque (N.m). (d) Speed machine’s developed mechanical power (W).
Figure 7a demonstrates that the speed machine’s speed tracked the speed reference (i.e., the scaled UDDS drive cycle) very closely. Figure 7b shows that the moving average of the load machine’s torque tracked the torque reference very closely. The ripple contents of the torque signal are the natural outcomes of instantaneous torque control. The speed machine’s developed torque, shown in Figure 7c, caused the shaft speed to track the speed reference in the presence of the torque imposed on the shaft by the load machine. Finally, Figure 7d shows the mechanical power developed by the speed machine.
The scaled UDDS drive cycle was run on the HIL testbed to demonstrate the capabilities of the testbed and to verify its performance, based on the simulation results and analytical expectations. The HIL simulation results are shown in Figure 8.
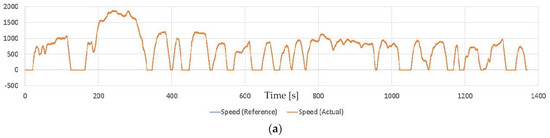
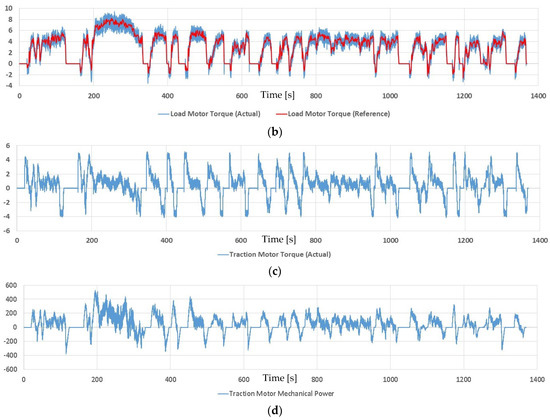
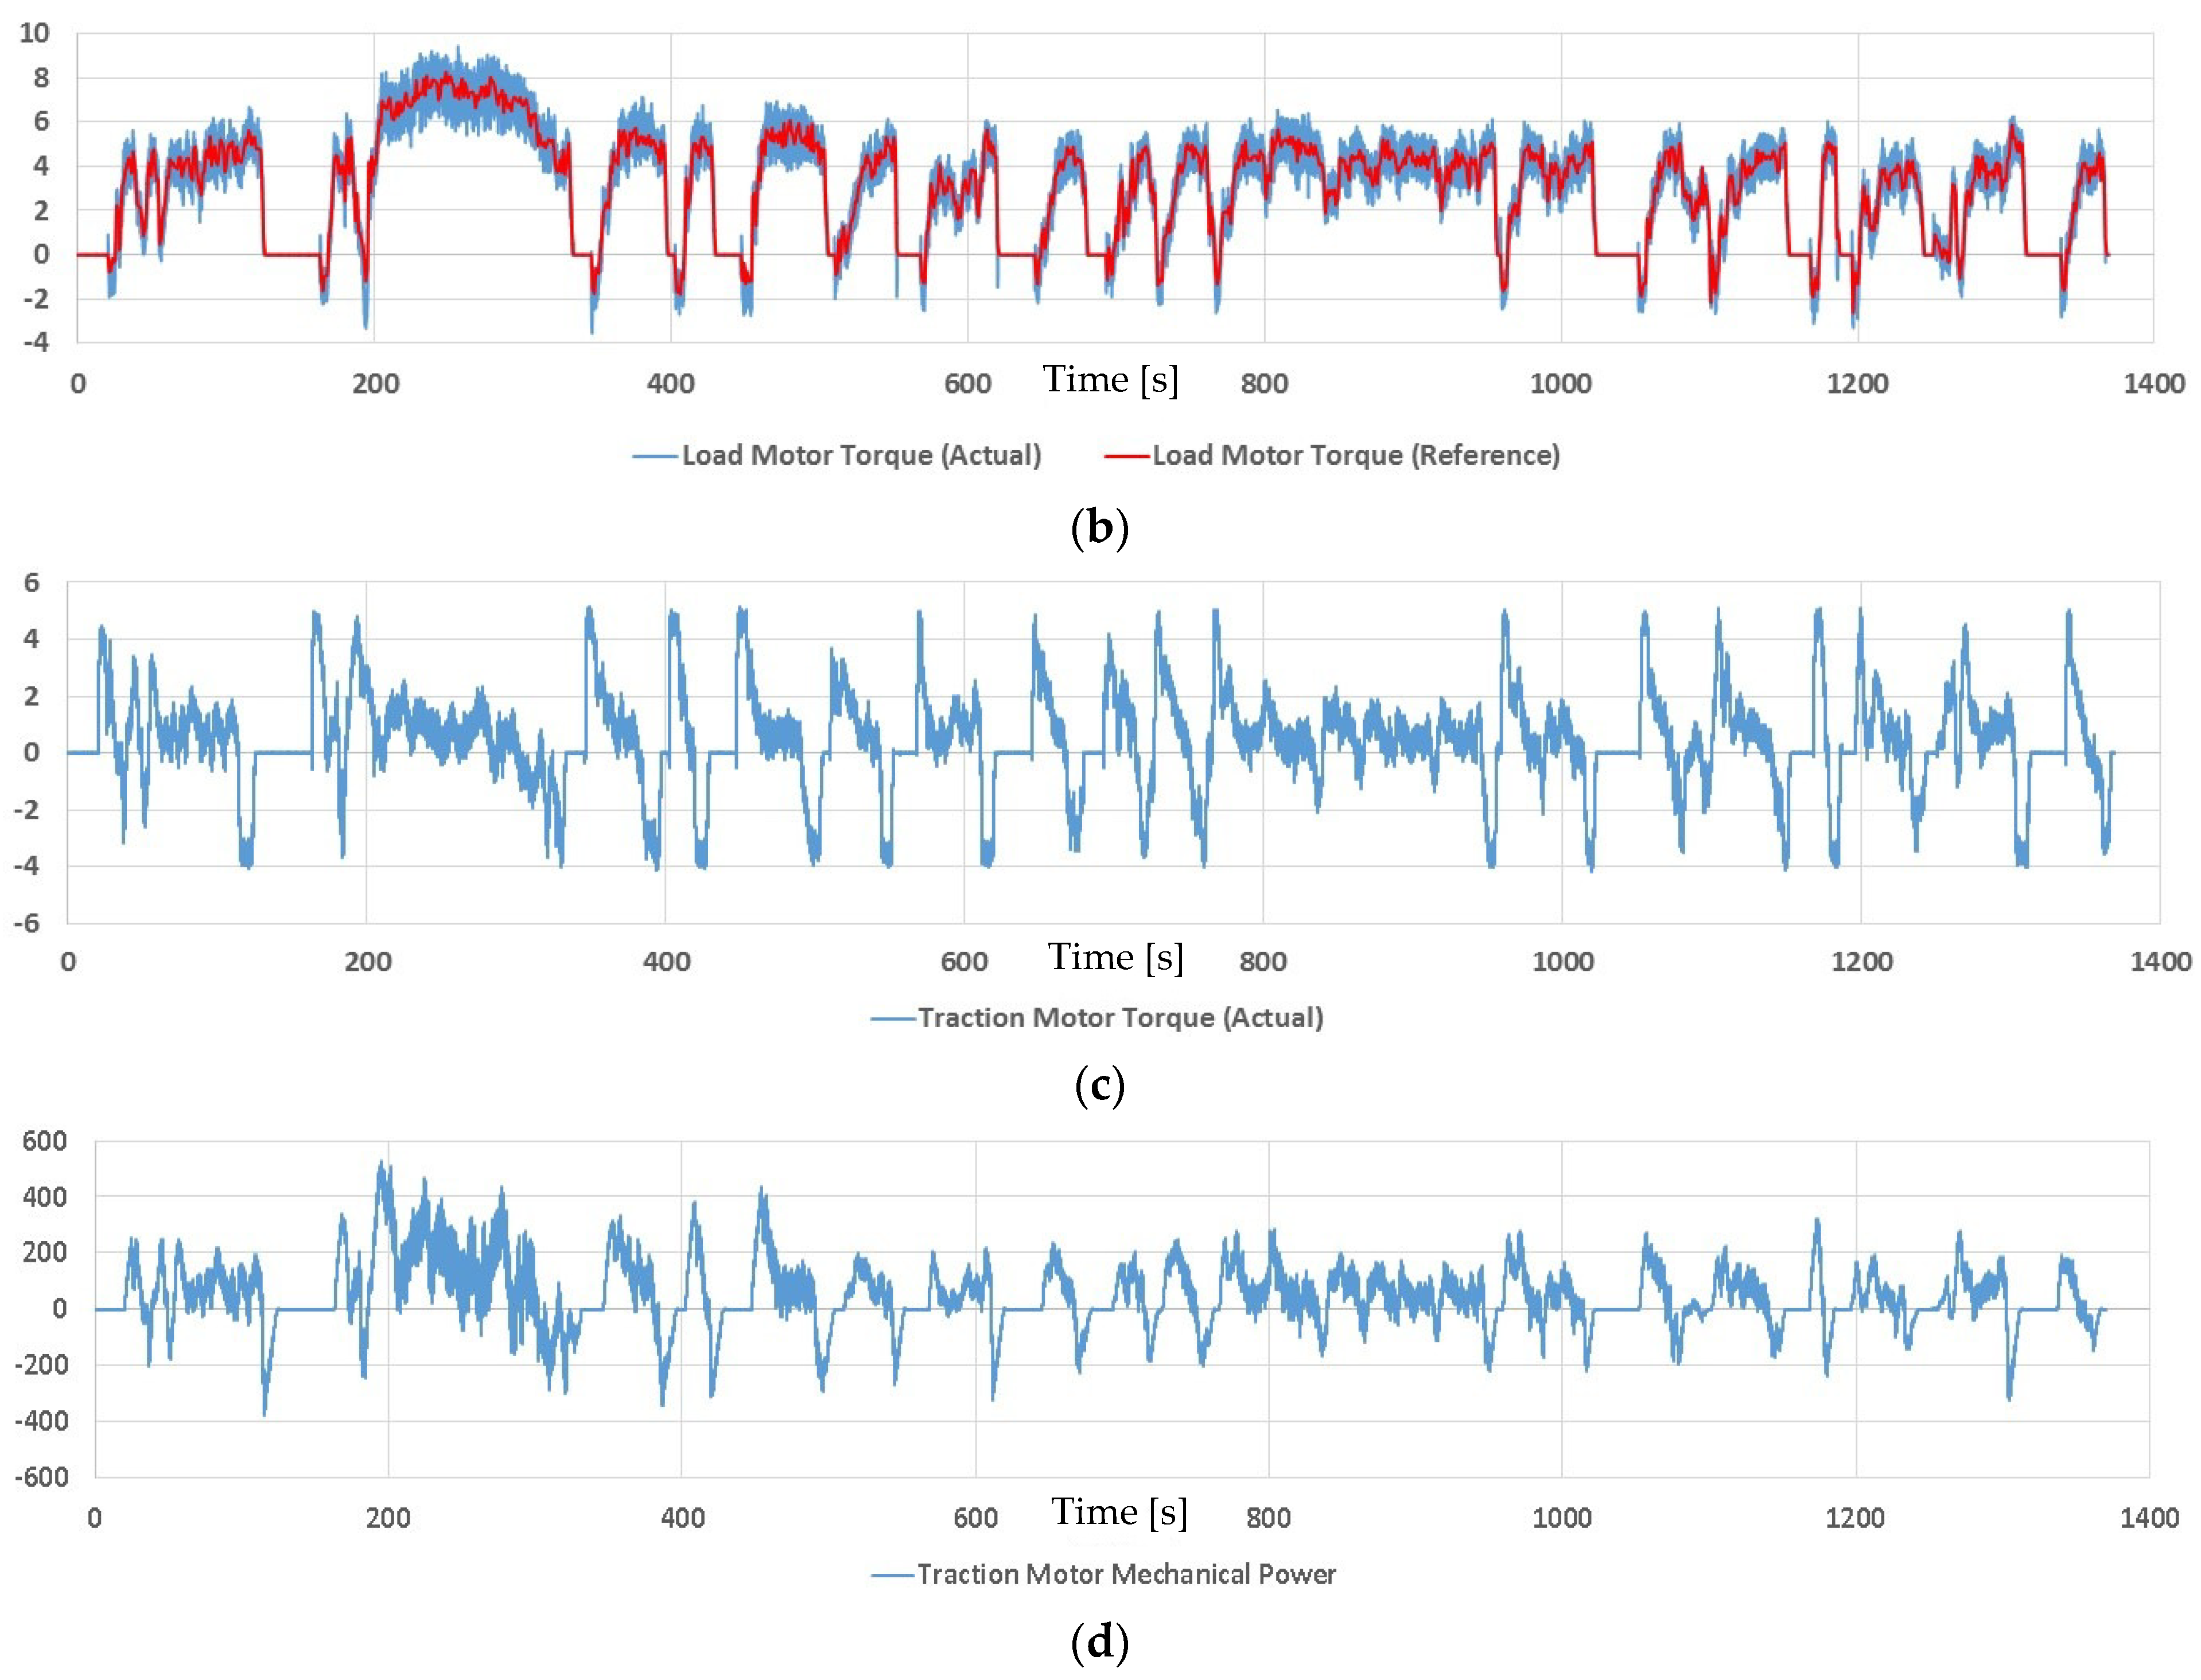
Figure 8.
HIL simulation results. (a) Speed machine’s speed reference and actual speed (rpm). (b) Load machine’s torque reference and actual torque (N.m). (c) Speed machine’s developed torque (N.m). (d) Speed machine’s developed mechanical power (W).
In the HIL simulations, the speed machine’s speed control loop was designed to track the speed reference while respecting the current limits of the hardware. The coincidence of the speed reference and the tracked speed of the speed machine, shown in Figure 8a, demonstrate precise tracking of the speed reference in the HIL simulations.
The load machine’s torque reference and tracked torque are shown in Figure 8b. The differences noticed with respect to the results given in Figure 7b are due to the testbed losses that were not accounted for in the ideal case considered in the computer simulations. The fact that the testbed losses increased proportionally in response to an increase in the shaft speed reveals that the losses were mainly due to friction. The load machine contributes an additional torque component to compensate for the losses in real time, so that the speed machine’s speed can follow the UDDS cycle. Given that the models in the computer simulations could not predict the losses effectively, this feature of the testbed is a clear advantage when refining system models and designs. This advantage removes the requirement to have the HIL system mapped out in an efficiency versus torque versus speed graph with lookup tables in code, which can become even more complicated when the effect of temperature is also considered. The torque ripple results for the computer and HIL simulations were in close agreement. It was observed that the torque ripple for the HIL testbed varied monotonically with speed and that the load machine experienced a torque ripple larger than that of the speed machine. It was also observed that the coupling between the two motors provided some degree of damping/smoothing to the torque oscillations/ripples.
The speed machine’s developed torque, shown in Figure 8c for the HIL simulations, clearly indicates that the torque was compensated effectively, for losses, by the load machine in the testbed, such that the speed machine developed the desired torque at the same rate as indicated by the computer simulation results.
5. Conclusions
This paper presented the development and verification of an efficient, cost-effective, small-scale, two-machine, modular, movable, and reconfigurable HIL testbed, for the study of full-size electrified vehicles in a lab environment. The speed machine represents a scaled traction motor whose shaft speed is controlled to track the corresponding reference. The load machine imposes a torque on the speed machine’s shaft, representing the vehicle parameters and driving environment. It also emulates a virtual gearbox, compensates for testbed losses, and matches the moment of inertia of the rotating parts of the testbed to that of a full-size vehicle. A two-way systematic scaling approach was introduced and implemented to allow scaling down of the parameters of and driving environment of a full-size EV to within the capabilities of the HIL testbed and scaling back the HIL simulation results to the full-size vehicle level. The HIL testbed, together with the high-fidelity two-way scaling approach, allows tests and performance studies to be performed on new designs of EV platforms in early stages of development, in a cost-effective manner. A case study involving a 2014 Tesla Model S Performance and UDDS drive cycle was performed. In all operating points investigated, the speed and torque tracking in the HIL testbed were in close agreement with that in computer simulations that represent the scaled test results of the full-size vehicle in the absence of actual test results for said vehicle.
Author Contributions
Conceptualization, M.R.K. and M.K.; methodology, M.R.K.; software, M.R.K.; validation, M.R.K. and M.K.; formal analysis, M.R.K.; investigation, M.R.K.; resources, M.R.K.; data curation, M.R.K.; writing—original draft preparation, M.R.K.; writing—review and editing, M.K.; visualization, M.R.K.; supervision, M.K.; project administration, M.K.; funding acquisition, M.K. All authors read and agreed to the published version of the manuscript.
Funding
This research received no external funding.
Data Availability Statement
All data are contained within the article.
Conflicts of Interest
The authors declare no conflict of interest.
References
- Kardasz, M. Design and Implementation of a Modular Test Bed Platform for Hardware-In-the-Loop Simulation of Electric Vehicles. Master’s Thesis, University of Waterloo, Waterloo, ON, Canada, 2019. [Google Scholar]
- Fang, K.; Zhou, Y.; Ma, P.; Yang, M. Credibility Evaluation of Hardware-in-the-Loop Simulation Systems. In Proceedings of the 2018 Chinese Control and Decision Conference (CCDC), Shenyang, China, 9–11 June 2018; pp. 3794–3799. [Google Scholar]
- Bouscayrol, A. Different types of Hardware-In-the-Loop simulation for electric drives. In Proceedings of the 2008 IEEE International Symposium on Industrial Electronics, Cambridge, UK, 30 June–2 July 2008; pp. 2146–2151. [Google Scholar]
- Hongyu, W.; Zhiqiang, Y.; Yong, F.; Yunqian, Q.; Zhiming, L. Development of pure electric vehicle powertrain controller based on hardware in the loop platform. In Proceedings of the 6th IEEE International Conference on Software Engineering and Service Science (ICSESS), Beijing, China, 23–25 September 2015; pp. 498–502. [Google Scholar]
- Zhu, Y.; Hu, H.; Xu, G.; Zhao, Z. Hardware-in-the-Loop Simulation of Pure Electric Vehicle Control System. In Proceedings of the 2009 International Asia Conference on Informatics in Control, Automation and Robotics, Bangkok, Thailand, 1–2 February 2009; pp. 254–258. [Google Scholar]
- Tabbache, B.; Aboub, Y.; Marouani, K.; Kheloui, A.; Benbouzid, M. A simple and effective hardware-in-the-loop simulation platform for urban electric vehicles. In Proceedings of the 2012 First International Conference on Renewable Energies and Vehicular Technology, Hammamet, Tunisia, 26–28 March 2012; pp. 251–255. [Google Scholar]
- Schwartz, D. Developing a HIL-Based Software Platform for Testing Electric and Hybrid Vehicle Powertrains. Master’s Thesis, University of Arkansas, Fayetteville, AR, USA, 2018. [Google Scholar]
- Patil, C.; Longoria, R.; Limroth, J. Control prototyping for an anti-lock braking control system on a scaled vehicle. In Proceedings of the 42nd IEEE International Conference on Decision and Control (IEEE Cat. No. 03CH37475), Maui, HI, USA, 9–12 December 2003; Volume 5, pp. 4962–4967. [Google Scholar]
- Fajri, P.; Lot, N.; Ferdowski, M.; Landers, R. Development of an Educational Small Scale Hybrid Electric Vehicle (HEV) Setup. In Proceedings of the 2013 IEEE International Electric Vehicle Conference (IEVC), Santa Clara, CA, USA, 23–25 October 2013; pp. 1–6. [Google Scholar]
- Verma, R.; Vecchio, D.; Fathy, H. Development of a Scaled Vehicle with Longitudinal Dynamics of an HMMWV for an ITS Testbed. IEEE/ASME Trans. Mechatron. 2008, 13, 46–57. [Google Scholar] [CrossRef]
- Lotrakul, P.; Pereirinha, P.; Bouscayrol, A. Reduced-Scale Hardware-In-the-Loop Simulation of an Urban Electric Minibus Using Energetic Macroscopic Representation. In Proceedings of the 2017 IEEE Vehicle Power and Propulsion Conference (VPPC), Belfort, France, 14–17 December 2017; pp. 1–6. [Google Scholar]
- Mayet, C.; Bouscayrol, A.; Delarue, P.; Chattot, E.; Dekik, I. Reduced-Scale-Power Hardware-In-the-Loop Simulation of a Subway Line. In Proceedings of the 2015 IEEE Vehicle Power and Propulsion Conference (VPPC), Montreal, QC, Canada, 19–22 October 2015; pp. 1–6. [Google Scholar]
- Kardasz, M.; Kazerani, M. Systematic electric vehicle scaling for test bed simulation. In Proceedings of the 2016 IEEE Transportation Electrification Conference and Expo (ITEC), Dearborn, MI, USA, 27–29 June 2016; pp. 1–6. [Google Scholar]
- Prakash, S.; Hofman, T. Clamping Strategies for Belt-Type Continuously Variable Transmissions: An Overview. In Proceedings of the 2017 IEEE Vehicle Power and Propulsion Conference (VPPC), Belfort, France, 11–14 December 2017; pp. 1–6. [Google Scholar]
- Gunji, D.; Fujimoto, H. Efficiency analysis of powertrain with toroidal continuously variable transmission for Electric Vehicles. In Proceedings of the 39th Annual Conference of the IEEE Industrial Electronics Society (IECON), Belfort, France, 10–13 November 2013; pp. 6614–6619. [Google Scholar]
- Fajri, P.; Ahmadi, R.; Ferdowsi, M. Equivalent vehicle rotational inertia used for electric vehicle test bench dynamic studies. In Proceedings of the 38th Annual Conference on IEEE Industrial Electronics Society (IECON), Montreal, QC, Canada, 25–28 October 2012; pp. 4115–4120. [Google Scholar]
- United States Environmental Protection Agency. Vehicle and Fuel Emissions Testing-Dynamometer Drive Schedules. EPA Urban Dynamometer Driving Schedule (UDDS). 2015. Available online: https://www.epa.gov/vehicle-and-fuel-emissions-testing/dynamometer-drive-schedules (accessed on 1 October 2018).
- Grandi, G.; Loncarski, J. Evaluation of current ripple amplitude in three-phase PWM voltage source inverters. In Proceedings of the 2013 International Conference-Workshop of Compatibility and Power Electronics, Ljubljana, Slovenia, 5–7 June 2013; pp. 156–161. [Google Scholar]
- Vujacic, M.; Hammami, M.; Srndovic, M.; Grandi, G. Evaluation of DC voltage ripple in three-phase PWM voltage source inverters. In Proceedings of the 26th IEEE International Symposium on Industrial Electronics (ISIE), Edinburgh, UK, 19–21 June 2017; pp. 711–716. [Google Scholar]
- Mohan, N.; Undeland, T.; Robbins, W. Power Electronics: Converters, Applications, and Design; John Wiley and Sons Inc.: Toronto, ON, Canada, 1995. [Google Scholar]
- Bose, B. Modern Power Electronics and AC Drives; Prentice Hall: New Jersey, NY, USA, 2002. [Google Scholar]
- Krishnan, R. Electric Motor Drives: Modeling, Analysis, and Control; Prentice Hall: Hoboken, NJ, USA, 2001. [Google Scholar]


Disclaimer/Publisher’s Note: The statements, opinions and data contained in all publications are solely those of the individual author(s) and contributor(s) and not of MDPI and/or the editor(s). MDPI and/or the editor(s) disclaim responsibility for any injury to people or property resulting from any ideas, methods, instructions or products referred to in the content. |
© 2023 by the authors. Licensee MDPI, Basel, Switzerland. This article is an open access article distributed under the terms and conditions of the Creative Commons Attribution (CC BY) license (https://creativecommons.org/licenses/by/4.0/).