Article

Adaptive Transmission Suspension of V2N Uplink Communication Based on In-Advanced Quality of Service Notification

Department of Electrical and Mechanical Engineering, Nagoya Institute of Technology, Graduate School of Engineering, Gokiso-cho, Showa-ku, Nagoya 466-8555, Japan
*
Author to whom correspondence should be addressed.
Vehicles 2023, 5(1), 203-222; https://doi.org/10.3390/vehicles5010012
Submission received: 19 October 2022 / Revised: 11 January 2023 / Accepted: 3 February 2023 / Published: 7 February 2023

Abstract

:
There are levels of automation in autonomous driving, and each level requires different performances of wireless communication, such as quality, delay time, and throughput. Therefore, the vehicle is required to adaptively control the level of automation when the performance of the wireless communication changes. In particular, it is essential to have a sufficient in-advance time for changing the level of automation. To ensure this time, an in-advance quality of service notification (IQN) has been considered in the fifth-generation mobile communications system (5G) standardization groups, in which predictive information about the quality of service is provided to vehicles from base stations. However, any specific utilizations of IQN for quality enhancement of wireless transmission were not considered. Therefore, in this study, we assume IQN as a prediction of throughput value and propose an improvement scheme for the uplink vehicle-to-network communication by distributing the traffic load and reducing the congestion of base stations. The effectiveness of the proposed scheme is evaluated via the summation of transmitted bits and counts when the target base stations connected by the target vehicles are fully loaded. The numerical results show that the proposed scheme realizes the reduction of network congestion without degrading the throughput performances of the vehicles.

1. Introduction

Recently, the demand for wireless communication for new services of connected cars has increased rapidly, and a significant amount of research has been conducted on vehicle-to-everything (V2X) data exchanges [1,2,3,4,5,6,7,8]. Typically, V2X involves vehicle-to-vehicle (V2V), vehicle-to-infrastructure, vehicle-to-pedestrian, and vehicle-to-network (V2N) communications. Reliable and low-latency communication is required in V2X because it is used to control cars. The specifications of V2X are standardized in IEEE802.11p [9] and long-term evolution (LTE) [1,2] protocols. In a cellular V2X (C-V2X) system, users can connect to existing base stations and new infrastructures for road-side units are not required. Thus, C-V2X is attracting increasing attention and has been standardized in fifth-generation mobile communications systems (5G) as well [10].
An important purpose of V2X communication is to realize autonomous driving. Autonomous driving is classified into six levels defined by the Society of Automotive Engineers [11], and each autonomous level requires different performance of wireless communication in terms of the quality of service (QoS). Furthermore, the required QoS of wireless communication changes according to factors such as traffic jams and vehicle speed. Moreover, it requires a few seconds to control changes in the lane, speed, or autonomous level of a vehicle [12,13]. Therefore, to satisfy these requirements of wireless quality and margin time, the 5G Automotive Association (5GAA) has requested the 3rd Generation Partnership Project (3GPP) to provide a function for in-advance QoS notification (IQN), which allows a base station to predict QoS and notify vehicles [12]. A white paper on IQN [13] defined it as a predictive notification mechanism for wireless QoS proposed by 5GAA, where mobile networks periodically inform the predictive QoS value to interested user terminals. Using this information, applications in the user terminal can adequately prepare for a change in QoS. Specifically, the main user of this mechanism should be a vehicle, and the vehicle should reserve sufficient time to prepare for changes in driving control by utilizing the IQN. As examples of using IQN, [13] introduces in-advanced braking of remote-controlled vehicles, an extension of the inter-vehicle distance in autonomous platooning, and a handover from an autonomous driving system to a driver. Thus, this conventional study only considers the IQN utilization of vehicle controls.
In contrast, in cellular systems, a base station controls the wireless resource scheduling for user terminals [14], where a proportional fairness criterion is adopted [15]. However, when the number of connected users increases, wireless resources are saturated and the throughput of each user decreases. This is a problem of using C-V2X with many vehicles because the decreasing throughput causes an increase in transmission delay.
Here, it is also supposed that IQN can improve wireless network performances. However, to the best of our knowledge, only a little research has been conducted to improve wireless communication using IQN. Therefore, in this paper, we propose a network congestion alleviation scheme to avoid network performance degradation in a crowded C-V2X system, by independently and adaptively suspending low-priority data transmission for each vehicle using IQN. In particular, we assume that the predicted value of QoS obtained from IQN is a throughput value, and newly propose an adaptive transmission suspension scheme to improve the performance of wireless networks. The proposed scheme decreases the probability of congestion of base stations, without decreasing the amount of data transmitted from vehicles, by perceiving how crowded the base stations are and distributing the load. Furthermore, in the proposed scheme, no algorithm change is required at base stations. We demonstrate the effectiveness of the proposed method by conducting numerical simulations to evaluate performance indicators for the summation of the transmitted data and count of full loads at the base stations. Our new contribution is as follows:
  • Propose a specific algorithm to adaptively assess the volume of transmitting data on a vehicle side using IQN.
  • Construct a method to improve the network performance of uplink V2N communication using IQN.
  • Show that the congestion can be reduced by utilizing IQN during heavy network traffic.
Note that if the only purpose is to improve network performance, IQN is considered unnecessary for vehicles of the user terminals. In this paper, we propose a new method to use IQNs to improve network performance in addition to the original use of IQNs to prepare for application mode changes on the user terminal side, at the same time. The motivations of this study are to use IQN for network congestion mitigation to contribute to robust autonomous driving systems, and to improve the performance of V2N. The reason why congestion mitigation using IQN contributes to autonomous driving is that as automation progresses, more cooperative control is required and the amount of information transmitted via V2X increases, which raises the performance requirements of V2N [16]. However, 5G systems, especially non-standalone systems, at present, generally have small uplink capacity, resulting in lower throughput when accommodating a large number of V2N terminals. As a result, the number of terminals that can be upgraded to a higher level of automation is reduced. We believe that in addition to the automatic level switching by IQN, the proposed method improves communication throughput by exploiting IQN, thereby contributing to smoother level switching and automation promotion.
In the following, related works are introduced in Section 2. The performance indicators used in this paper, the wireless communication flowchart, and the proposed transmission decision flowchart using IQN are described in Section 3. The numerical results are shown in Section 4 to validate the proposed scheme, and the conclusions are drawn in Section 5.

2. Related works

2.1. Scheduling Method

In cellular systems, each base station conducts access control for user terminals at each cell [14,17]. As an access control algorithm for an enhanced mobile broadband (eMBB) scenario of 5G, demand-assign scheduling is generally used, where the base station balances the system capacity and fairness among users according to users’ access requests [15]. Therefore, when the number of access users increases considerably, the throughput performance of all users in the cell uniformly degrades. This increases the transmission time for the same amount of data. In contrast, in current cellular systems, advanced congestion control, where multiple base stations work together in multiple cells based on proactive user data traffic requirements according to user mobility, is not used. Thus, conventional scheduling algorithms are not sufficient for dynamic V2X traffic in which vehicles have high mobility and require frequent handovers.
For more efficient frequency use, a few wireless access control schemes based on machine learning have been proposed [18,19]. In these schemes, the base station conducts access control using in-advance training data for supervising or using frequent feedback data from users. However, these schemes are not implemented in current cellular systems owing to the dynamic mobility of user terminals, and the dynamic V2X scenario in this study is also not suitable for machine learning. Hence, machine learning-based scheduling is not considered in this study.

2.2. Congestion Control Method

As described above, because congestion control is important to realize reliable and low-latency transmission in V2X scenarios, some congestion control methods for V2X have been studied. European Telecommunications Standards Institute (ETSI) proposed distributed congestion control mechanisms in [20,21] and the IEEE802.11p protocol in [22]. The basic approach of these schemes is that base stations determine the communication status of each user terminal and then prevent traffic congestion by adaptively adjusting the transmission power, packet length, or transmission period for each user terminal. Thus, congestion control is closed in the area where a certain cell and sidelinks reach, and is not proactive but active control. Improved congestion control schemes have been proposed in [23,24,25,26], but these are also active control. The authors of [27] proposed a capacity enhancement scheme by applying a non-orthogonal multiple access (NOMA) scheme for V2X. However, this scheme does not use proactive control.
A detailed review of general congestion control schemes is given in [28]. Among the reviewed schemes, many use priority transmission based on data priority [29]. Priority transmission is realized by weighing a fairness coefficient of scheduling for high-priority data. However, it is still a base station technique effective for a single cell and its surroundings. The scheme proposed in this paper can enable control in multiple cells; however, the data priority architecture itself (as described in Section 3.4) is the same as that in these conventional schemes.
The transmission suspension technique is widely used in wireless access systems. The main objective of such suspension in carrier sense multiple access with collision avoidance (CSMA/CA) of wireless LAN systems is to avoid interference among transmitting users [30,31]. To realize this, a carrier sense is performed before transmission, and if the channel is busy, the transmission is suspended for a while and the carrier sense is performed again. In contrast, the objective of the self-directive suspension scheme proposed in this paper is to alleviate network loads, and not to avoid interference; meanwhile, the suspension concept is the same as that of conventional schemes. In the proposed scheme, each vehicle autonomically suspends a part of low-priority data transmission based on proactive IQN information, as described in Section 3.5.

2.3. Handover Method

In current cellular systems, base stations collaboratively control a cell handover of users crossing inter-cells; each user cannot control the handover by itself and can only request for it through base stations [14,17]. If a self-decision of the handover at each user is permitted, the decision must be relayed to the base stations by users using any control channels, which may result in an increased consumption of other wireless resources. In the proposed scheme described in Section 3.3, the handover is normally conducted among multiple cells under the conventional protocol, and no additional process is required for the handover.

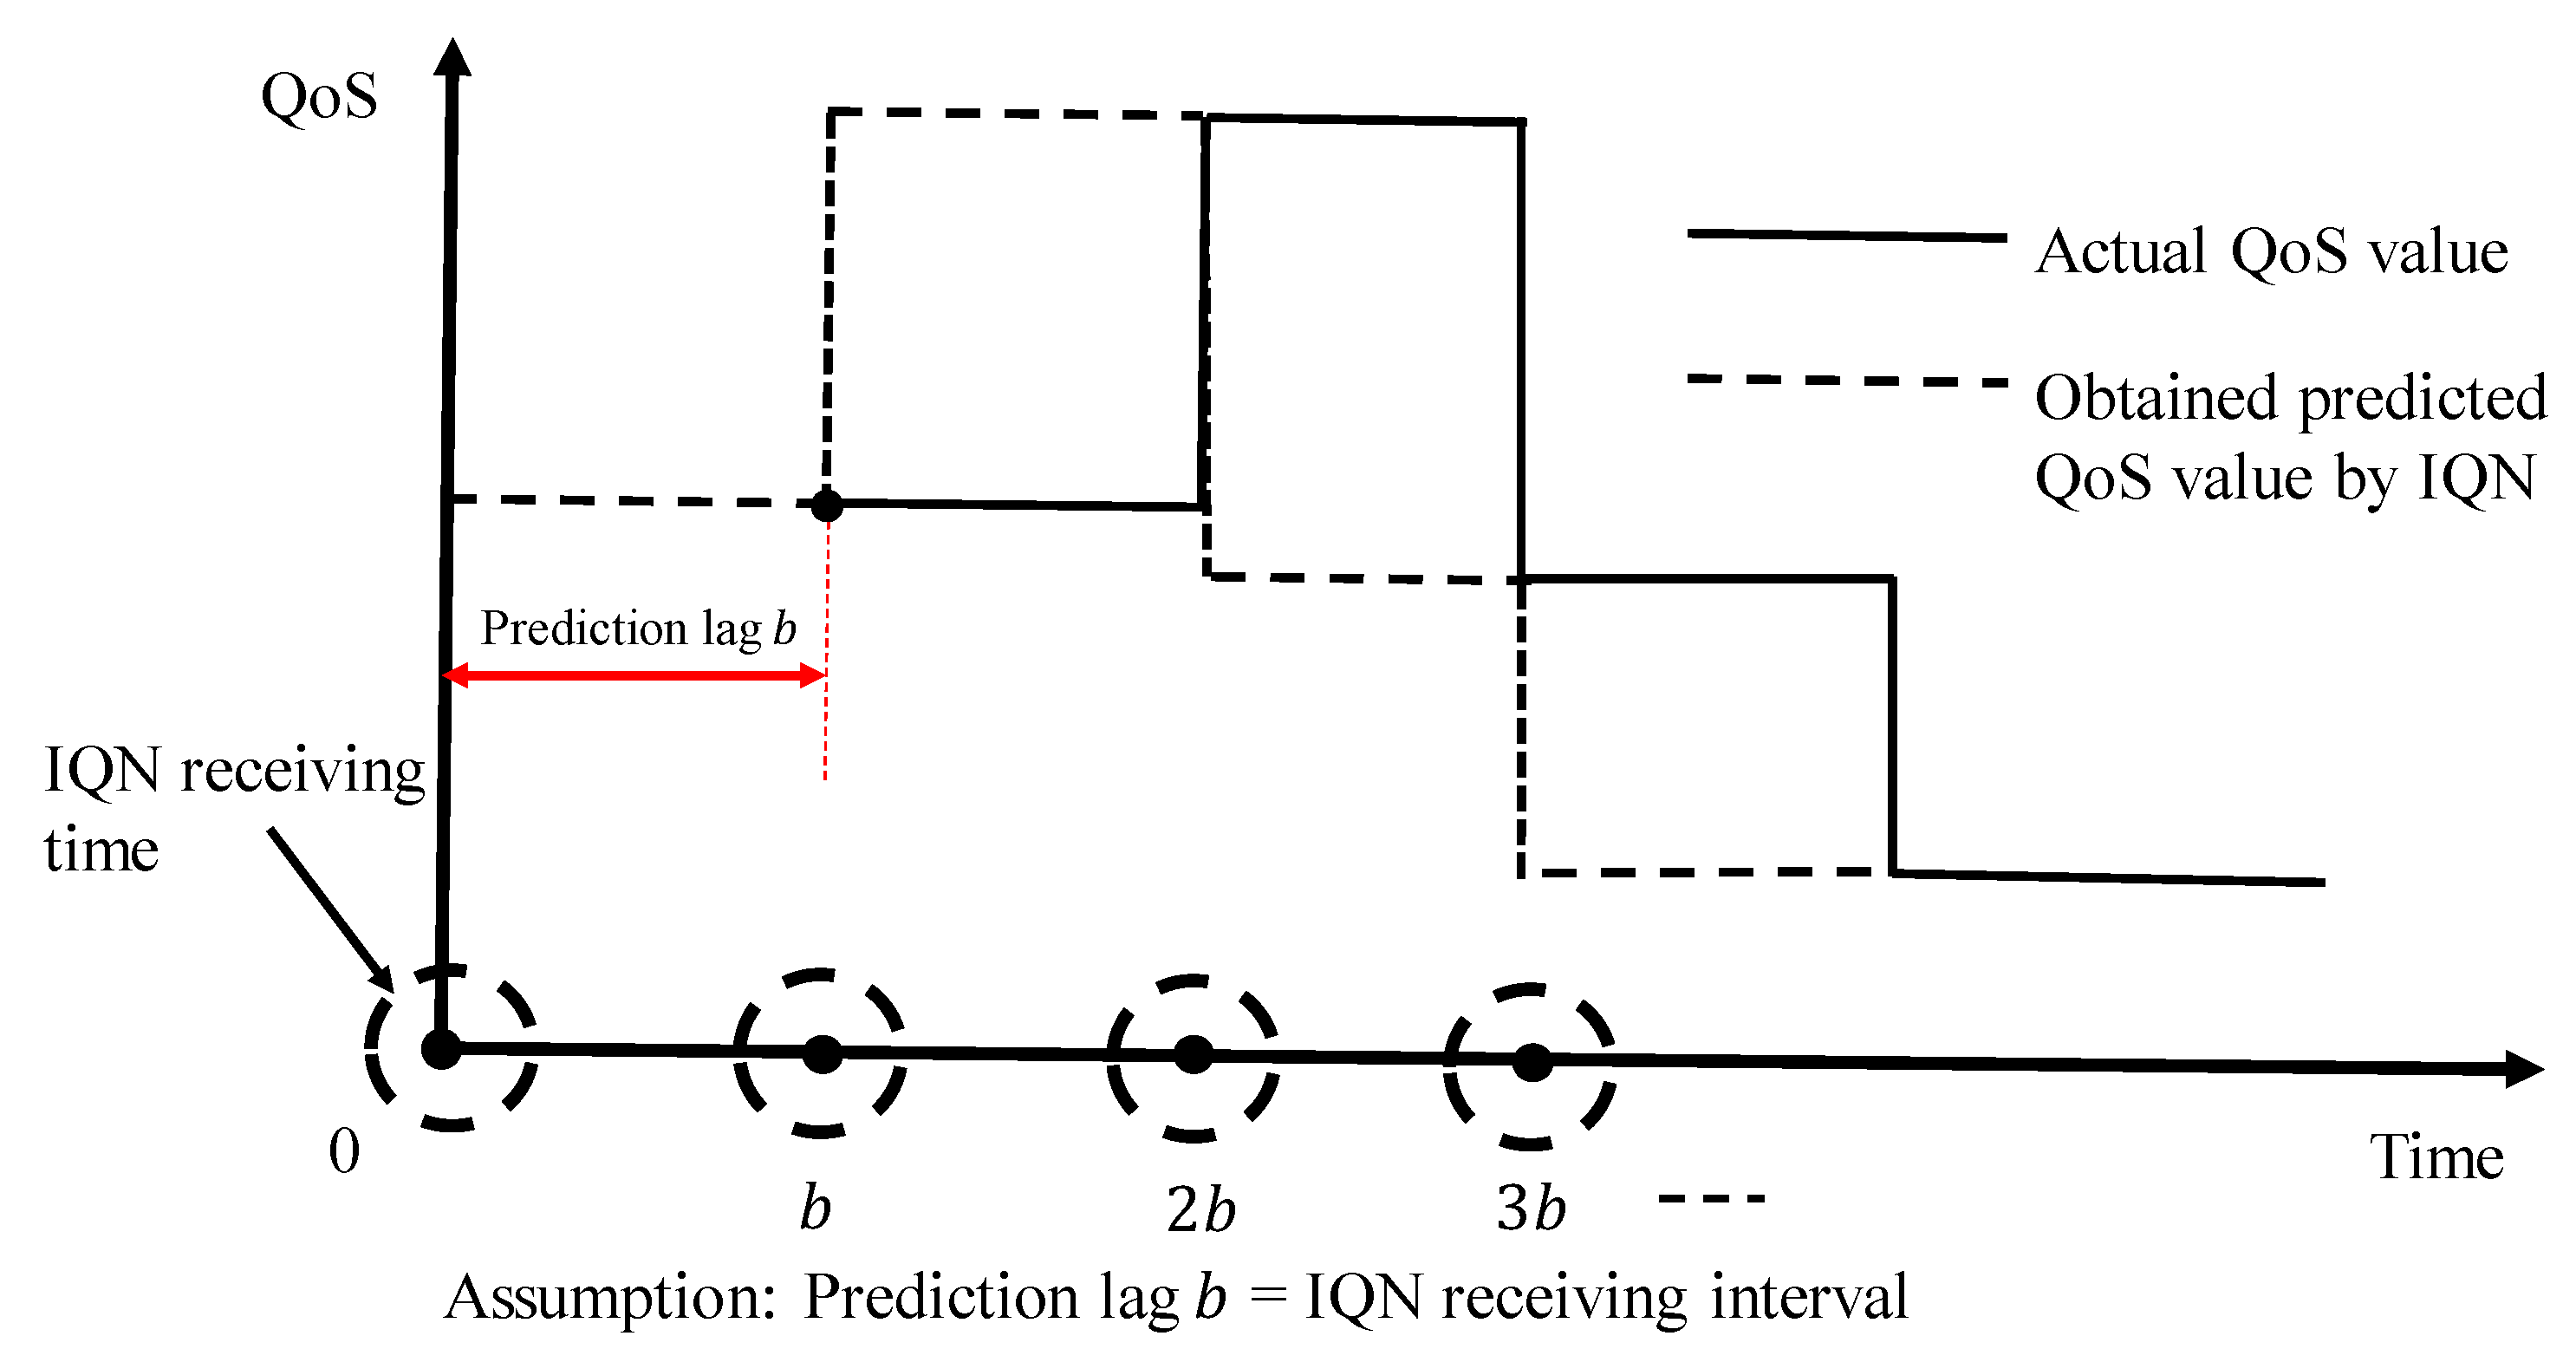
2.4. In-Advanced Quality of Service Notification

As described in Section 1, IQN is a new mechanism proposed by 5GAA; it is effective for advancing autonomous driving. There are many ways to utilize IQN. A previous study [13] has introduced its use in controlling vehicles. Congestion control using IQN has not yet been considered.
To summarize, in conventional works, only base stations control wireless access with an active feedback criterion. In contrast, in the proposed scheme, each vehicle autonomically and proactively detects network congestion with the help of IQN and suspends a part of the transmission data to realize multi-cell congestion control without changing the conventional cellular protocols of scheduling and handover.

3. Proposed Communication System Based on In-Advanced QoS Notification

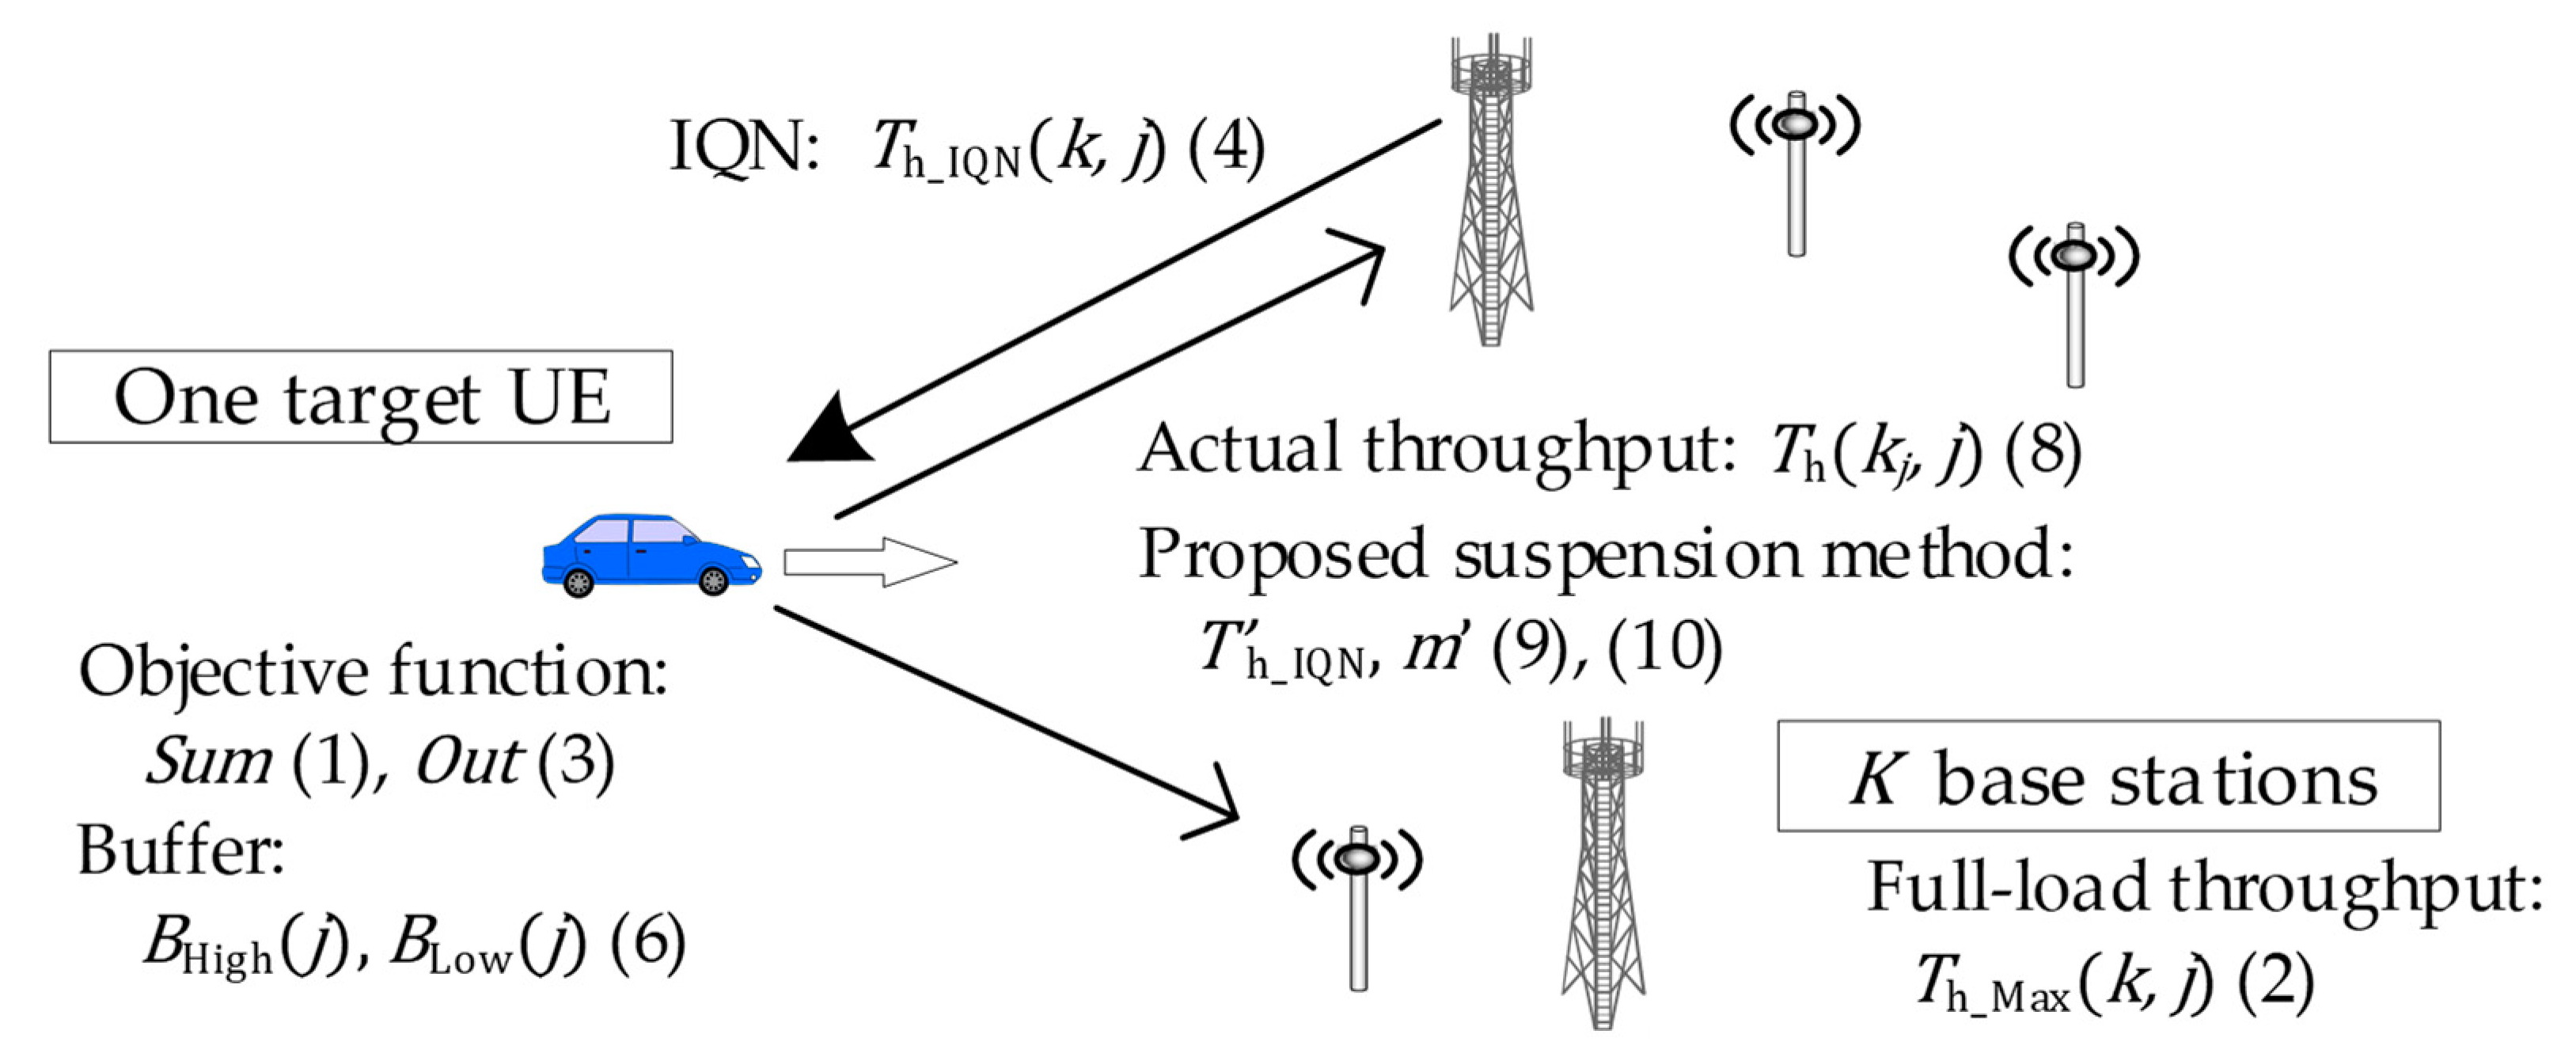
3.1. Outline of Proposed Algorithm

Figure 1 shows an outline of the system model and proposed algorithm. The vehicles use wireless access networks of a heterogenous cellular system, where the macro and small cells exist as shown in Figure 1a. The overview of the proposed algorithm is shown in Figure 1b. The base station periodically transmits IQN to vehicles; each vehicle autonomically decides the handover request and the required throughput of low-priority data based on the IQN information and transmits this. Then, the optimization functions of S u m and O u t , the throughput and congestion indicators defined in Section 3.2, are balanced. Because there are two optimization functions, the proposed algorithm is categorized as multi-purpose optimization. In conventional scheduling algorithms of cellular systems, a central base station optimizes the system capacity and fairness among user terminals based on feedback from them. Thus, this multi-purpose optimization can be conducted by quasi-optimizing schemes such as divide and conquer or dynamic programming. However, in this study, the optimization problem corresponds to multi-agent optimization where each vehicle autonomically determines the answer in multiple cells and is categorized as a game strategy [32]. Here, IQN is essentially designed to be used for each vehicle, and any collaborative or information sharing of other vehicles is not included. Furthermore, if more optimized solutions are required at each vehicle as base station scheduling, inter-vehicle information needs to be shared, which requires additional V2V links or optional IQN information. However, using additional wireless resources for V2V links or making additional specifications in IQN is not practical. Therefore, in this study, we use a non-cooperative game algorithm for optimization.
Specifically, in this study, we focus on a novel utilization of IQN, in which the network performance is improved by each vehicle’s dispersive decision based on IQN, which is originally designed for vehicle control. The improvement of the algorithm in terms of game theory will be considered in future work.
Considering the complexity of the proposed algorithm, the input and output are IQN information and the request throughput of low-priority data calculated by the immediately preceding IQN, respectively. Then, the required calculation complexity and memory space become O K and the memory for one IQN information, respectively. That is, the proposed algorithm is simple and incurs a small cost.

3.2. Performance Indicator

In this study, we assume two performance indicators to evaluate the proposed scheme; “ S u m ” that is the summation of the transmitted bits from a target vehicle, and “ O u t ” that is the total count of base stations that become fully loaded on every timestep. It is assumed that all base stations on the field are numbered as k where 0 k < K , K is the number of base stations, and the target vehicle connects to one base station at a time, which is labeled as base station k j . We define T h k j , j [Mbps] as the vehicle’s actual throughput at time j , and t Res [s] as the time resolution, where T h k , j = 0 when k k j . Consequently, S u m is defined by
S u m = j = 0 N 1 T h k j , j t Res
in the time period from 0 to N 1 , where N is the end time when a target vehicle passes through a target road area. A larger S u m value is better. We assume that a base station is congested when it is fully loaded, and we define O u t as the summation of counts when the target base stations connected to the target vehicle are fully loaded for the time ranging from 0 to N 1 . In particular, a base station is recognized as fully loaded at time j when
T h _ Max k , j = T h other k , j + T h k , j
is satisfied, where T h _ Max k , j [Mbps] is the capacity of base station k , T h other k , j is the sum of other vehicle throughputs (i.e., the throughput of vehicles other than the target vehicle). In this study, T h other k , j is assumed to be a random number following a Poisson distribution. In [33,34,35], the Poisson distribution was adopted as a traffic model for 5G ultra-reliable and low-latency communications (URLLC) to send FTP data; it was also used in [36] for a performance analysis of LTE vehicular safety service. Thus, a Poisson distribution is also used in this study. Specifically, when T h k j , j of a user is changed by the proposed control, it simultaneously changes T h other k ,   j for other users. However, to confirm the effectiveness of the proposed architecture, we assume the following model for simplicity: each base station accommodates many types of users other than vehicles whose total number is more than 30, and even if T h k j , j is changed, the traffic change is smoothed in total and T h other k ,   j is not affected. This assumption is supported by central limit theorem, in which sample sizes over 30 are often considered sufficient [37], and thus the assumption of T h other k ,   j can be practical. In addition, T h _ Max k , j in base station k is originally calculated by the propagation channel condition, selected user pattern, and a modulation and coding scheme (MCS) for each user. However, in this paper, it is simplified by omitting the calculation from the radio propagation part, and is specified as the parameter of maximum system capacity when the Poisson distribution traffic for each user is assumed as in [38].
O u t is the summation of the counts when (2) of all the base stations on the field is satisfied. Then, O u t is represented as follows:
O u t = k = 0 K 1 j = 0 N 1 δ k ,   j ,     δ k ,   j = 1     i f   T h _ Max k , j = T h other k , j + T h k , j 0                 otherwise                
Here, O u t is in an ideal state when considering the maximization of frequency efficiency. However, in this study, it is assumed that full load should be avoided because there is no room to accommodate the fluctuation of each user’s traffic. In other words, O u t should be small. Therefore, the objective of this study is to reduce O u t while keeping S u m as high as possible.

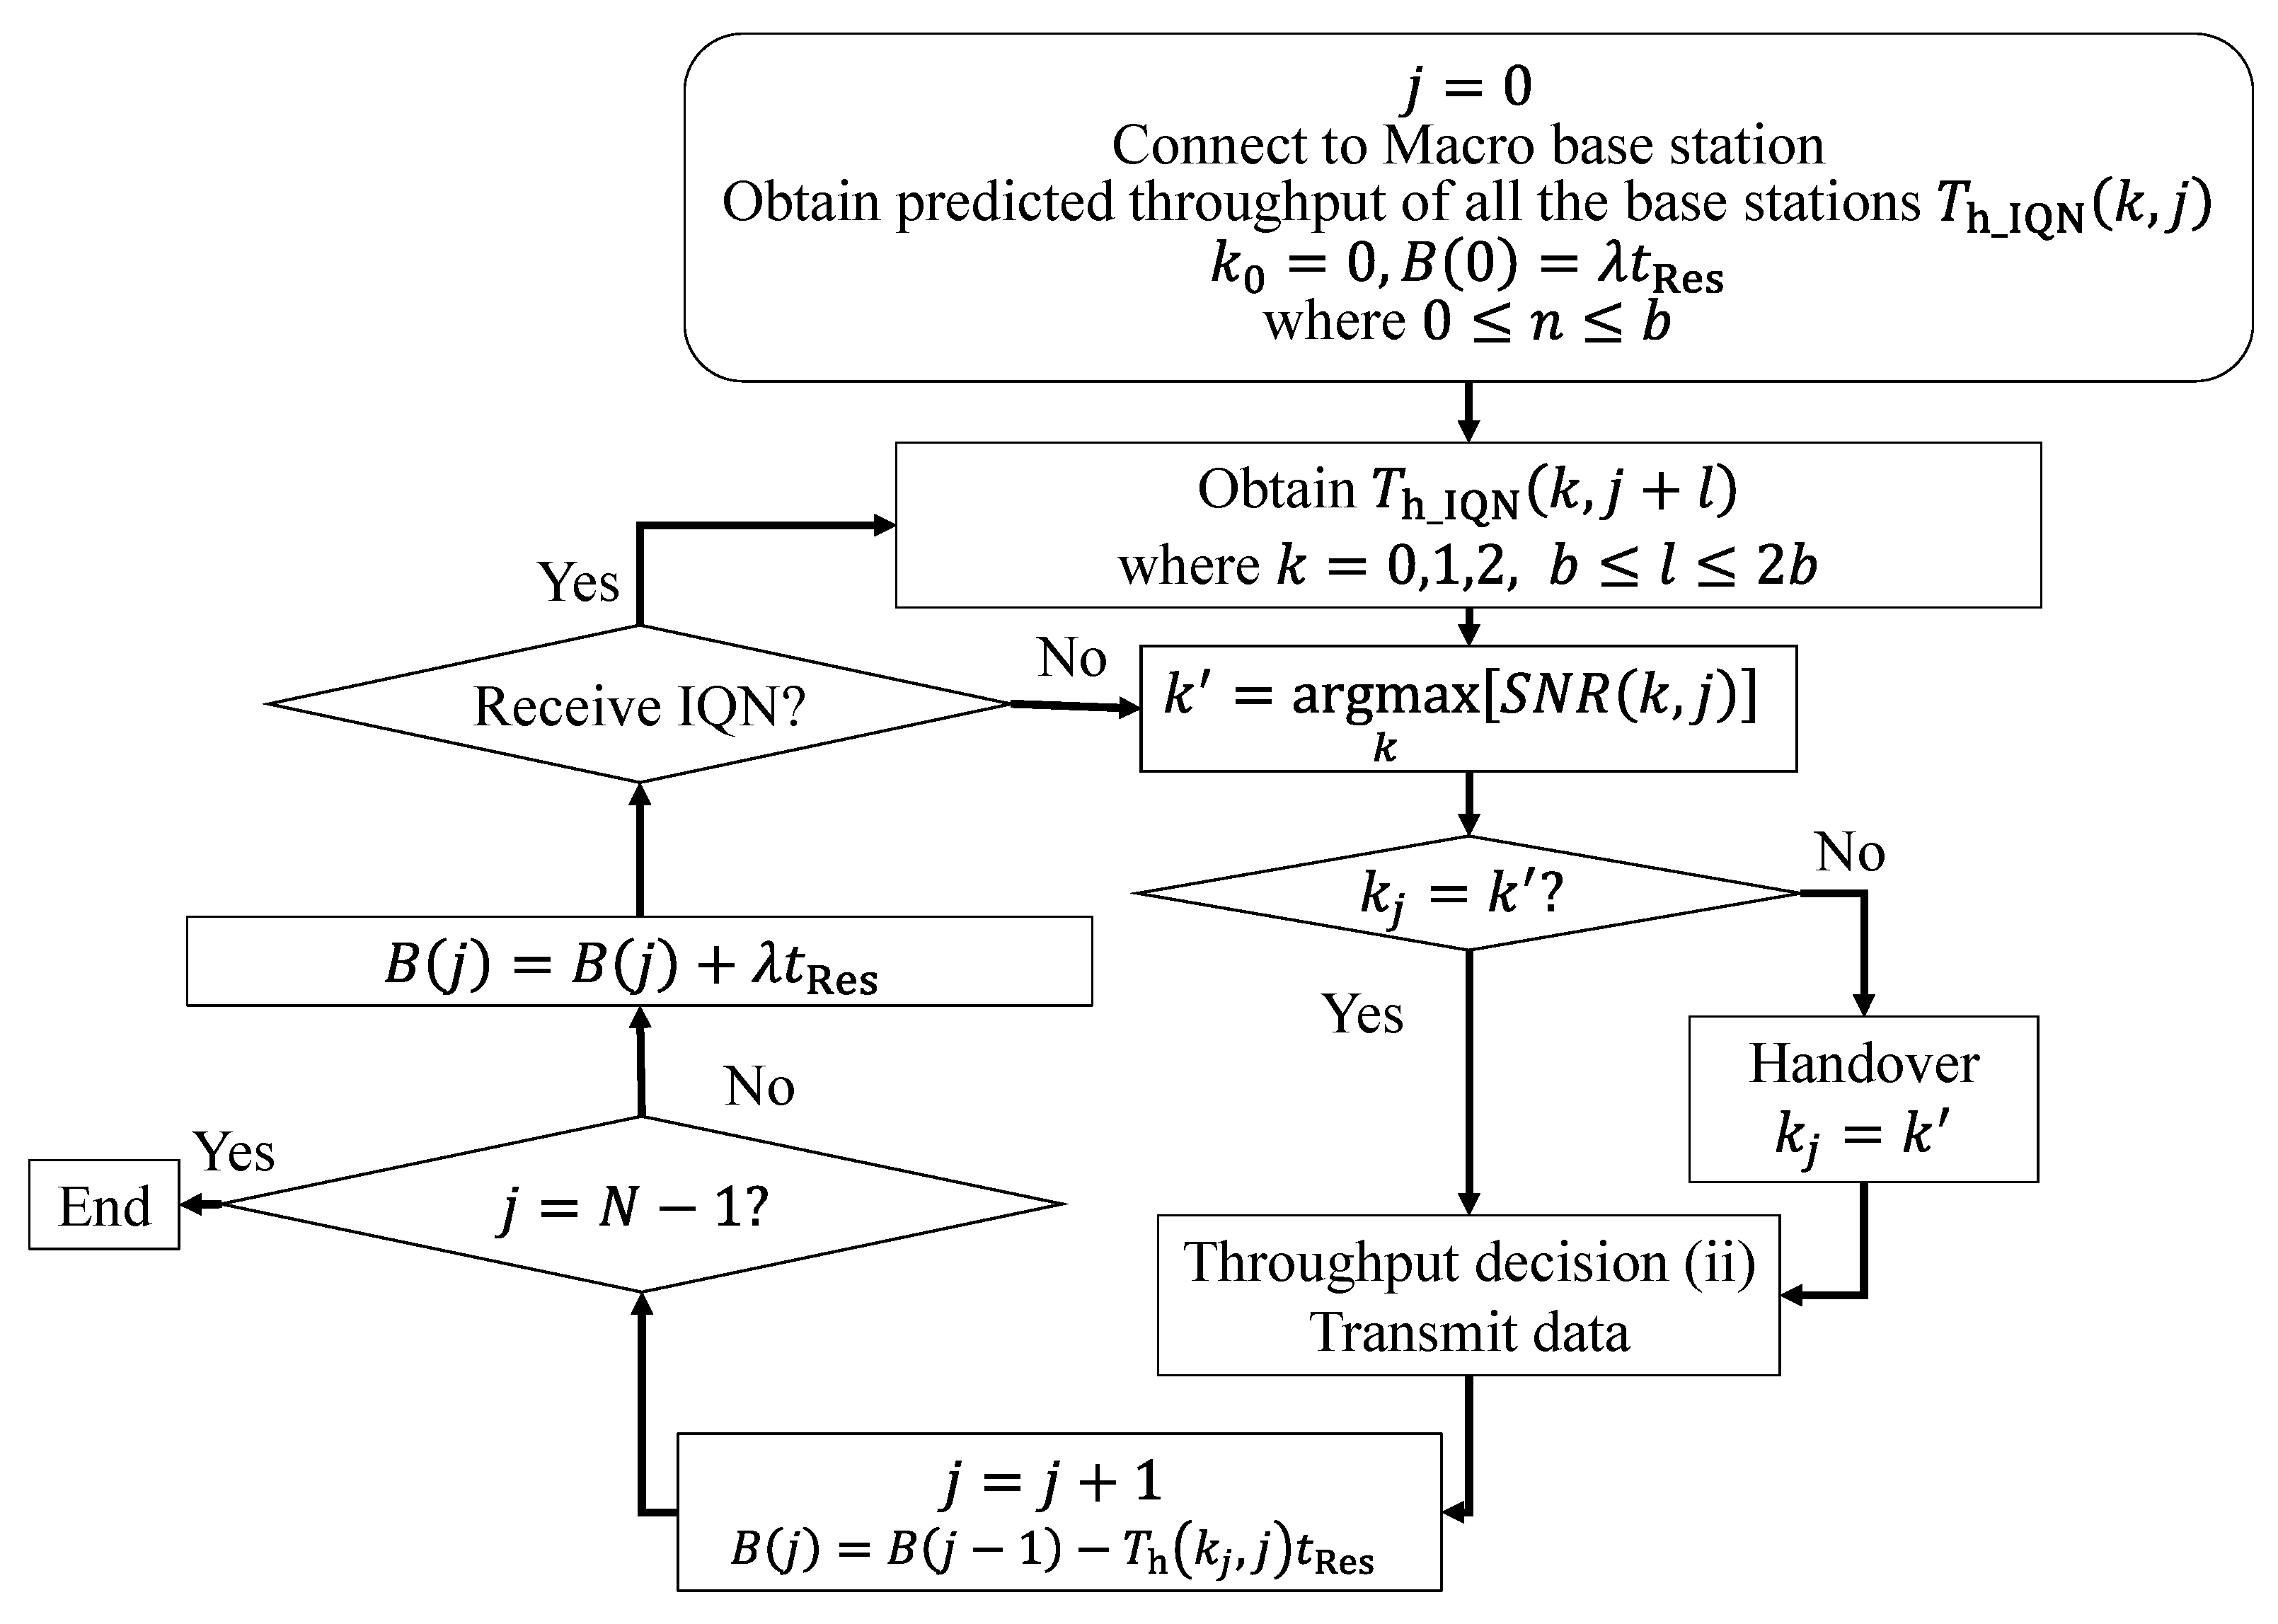
3.3. Transmission Flowchart Based on In-Advanced QoS Notification

IQN is the notification of QoS prediction between base station and vehicle [9]. We assume that the IQN information is a predicted available throughput value of base stations, and the prediction is perfectly performed by the base stations and perfectly informed to the vehicles. Figure 2 shows an overview of the proposed algorithm with main parameters of this study. One target vehicle and K base stations exist, and the target vehicle periodically receives IQNs from one of the base stations, calculates a few parameters, and adaptively changes the uplink transmission volume. Because of the independent control, this model does not lose generality even when there are many vehicles. Detailed explanations of the equations in the figure are given in the following. The relation between IQN received time and QoS predicted time is shown in Figure 3. The vehicle is notified of the QoS value that is effective at the time from b to 2 b by the IQN received at time j = 0 , hence b is a prediction lag. In addition, it is assumed that the vehicle receives IQN periodically at the interval of b . Then, the vehicle receives IQN at time j and obtains T h _ IQN k , j + l [Mbps] that includes predicted throughput values of all base stations from time j + b to j + 2 b , where   b l 2 b . Here, it is theoretically possible to perform time-waiting suspension of low-priority data using IQN for the same base station. However, because vehicles are usually moving, this study assumes that suspended data are sent to a nearby base station using handover.
We assume that T h _ IQN k , j is a throughput value and the following relationship holds.
T h _ IQN k , j = T h _ Max k , j T h other k , j
Based on (4), the maximum transmission throughput T h _ available k j , j of the target vehicle at time j is given by:
T h _ available k j ,   j = min T h _ IQN k j , j , T h _ MCS S N R k j , j
where S N R k j , j is the received signal-to-noise ratio (SNR) between the vehicle and base station   k j , and T h M CS is the throughput value calculated using a MCS table [39]. Here, S N R k j , j can be obtained at the vehicle side using the received downlink signals in the time-division duplex system of 5G, or information in the physical downlink control channel (PDCCH). Using (5), the proposed scheme adjusts the actual transmission throughput as the minimum value between the IQN value and SNR-based throughput. Figure 4 shows the transmission flowchart of the target vehicle using IQN. We assume that the vehicle is connected to a macro base station at time j = 0 , and T h _ IQN k , j is already known for 0 j b . The buffer to be transmitted from the vehicle is denoted as B j [Mbit], and B 0 = λ t Res , in which λ is the average data generation rate. Next, the vehicle receives IQN and obtain   T h _ IQN k , j + l for b l 2 b . Then, the vehicle searches for the base station k , which maximizes the SNR. If k is different from k j , the vehicle requests a handover to the current base station, and sets k j = k . The actual throughput (actual transmitting data volume) is then determined by the proposed algorithm described in the Section 3.4, and the data in the buffer are transmitted. After transmission, the vehicle sets j j + 1 , updates B j as B j + λ t Res , and confirms whether it is still in the target area, i.e., j < N . In such a case, the predicted QoS is updated when the IQN is received, and this flowchart is iterated until time N .

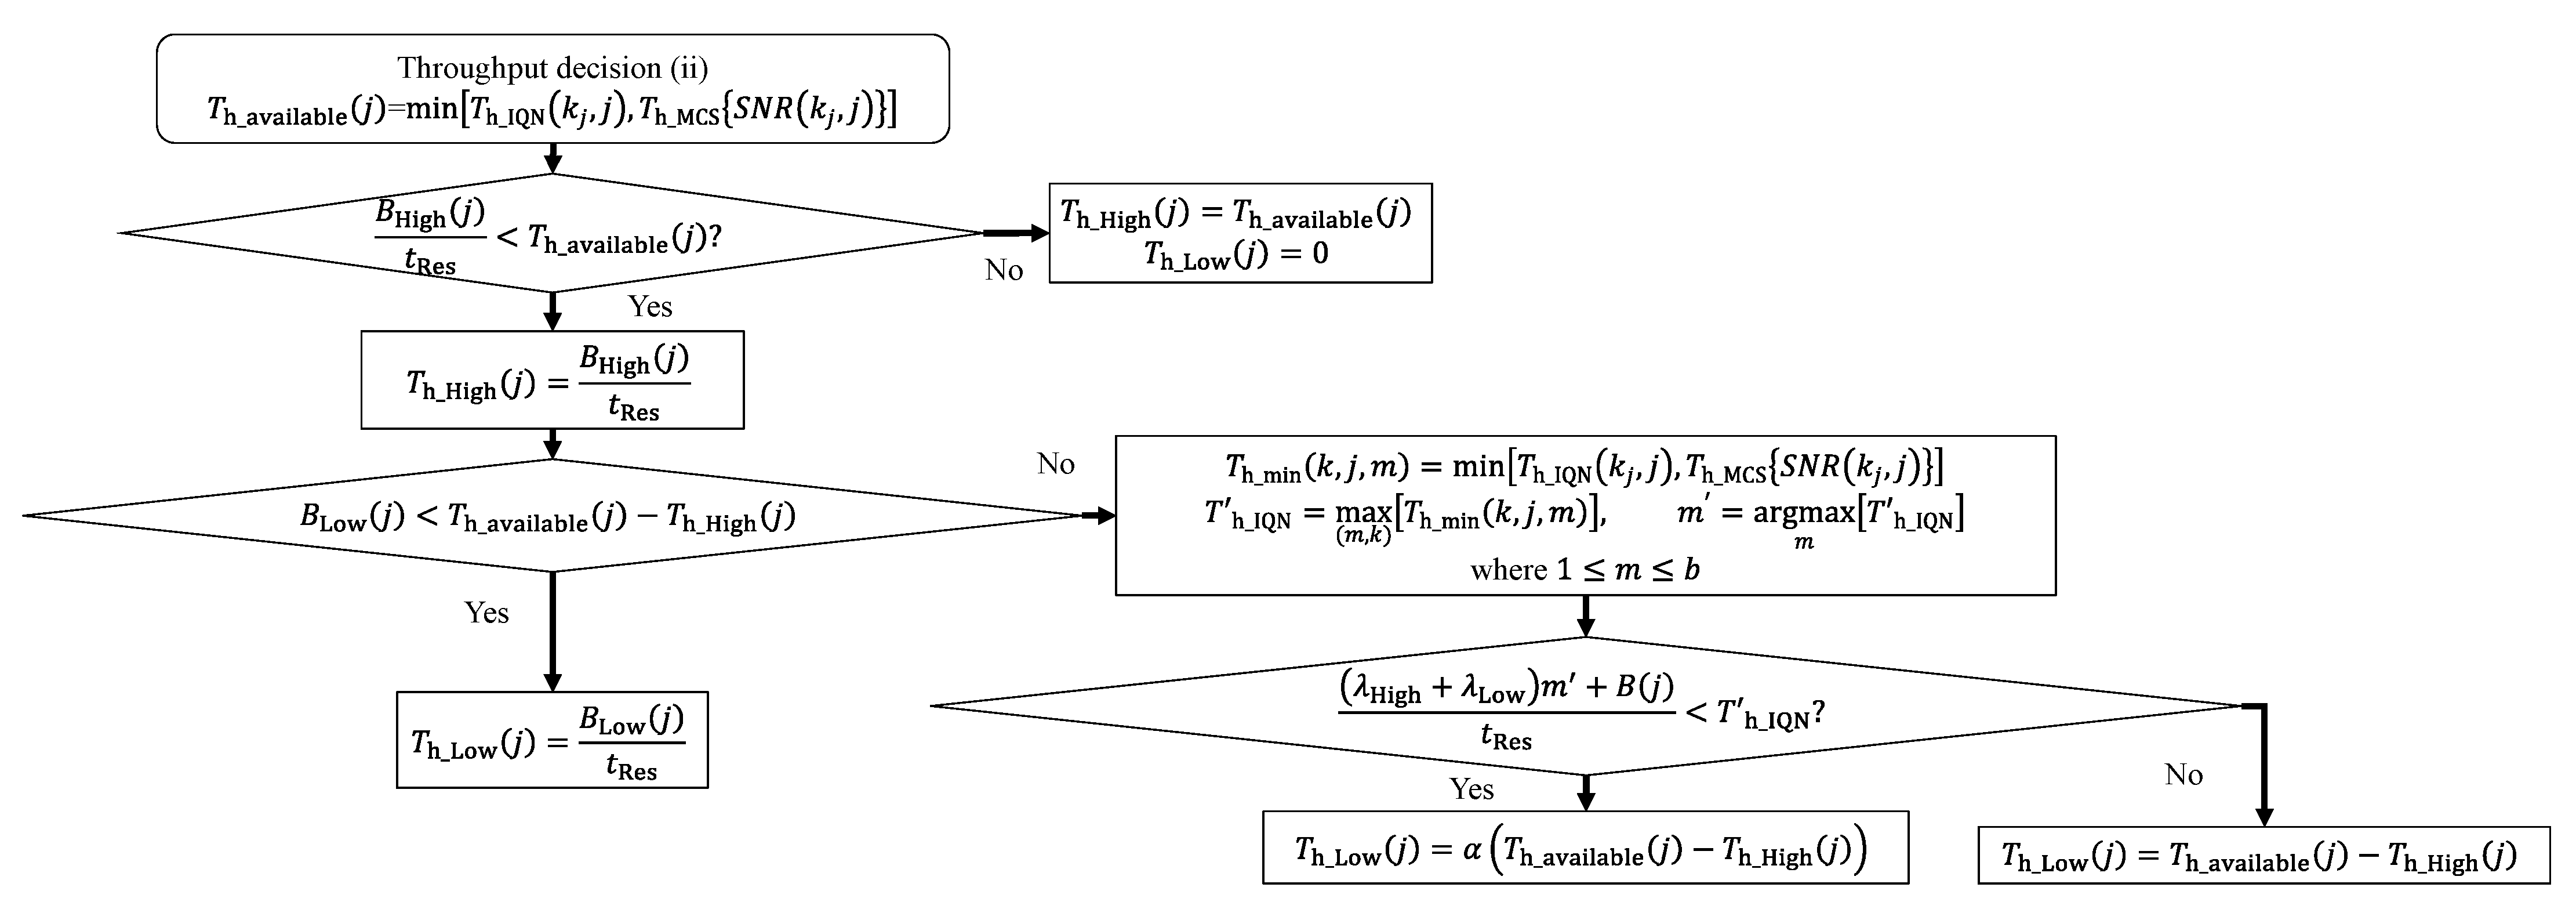
3.4. High and Low Priority Data

We assume that the vehicle generates two types of data: high and low priority data. The high priority data needs high immediacy and are used for applications utilizing information such as location data or velocity information of the dynamic map. A typical configuration of the high priority data is 100 byte generated every 100 ms [40]. On the other hand, the low priority data does not need immediacy but high throughput. They consist of information such as entertainment information or movies. Consequently, we define the generation rate of high and low priority data as λ High and λ Low [Mbps], respectively, and buffer to be transmitted as B High j and B Low j [Mbit], respectively. In this study, we consider only these two data, and the following equations hold.
B j = B High j + B Low j
λ = λ High + λ Low
We define the high and low priority throughputs as T h _ High j and T h _ Low j [Mbps], respectively, and therefore, the following equation holds.
T h k j , j = T h _ High j + T h _ Low j

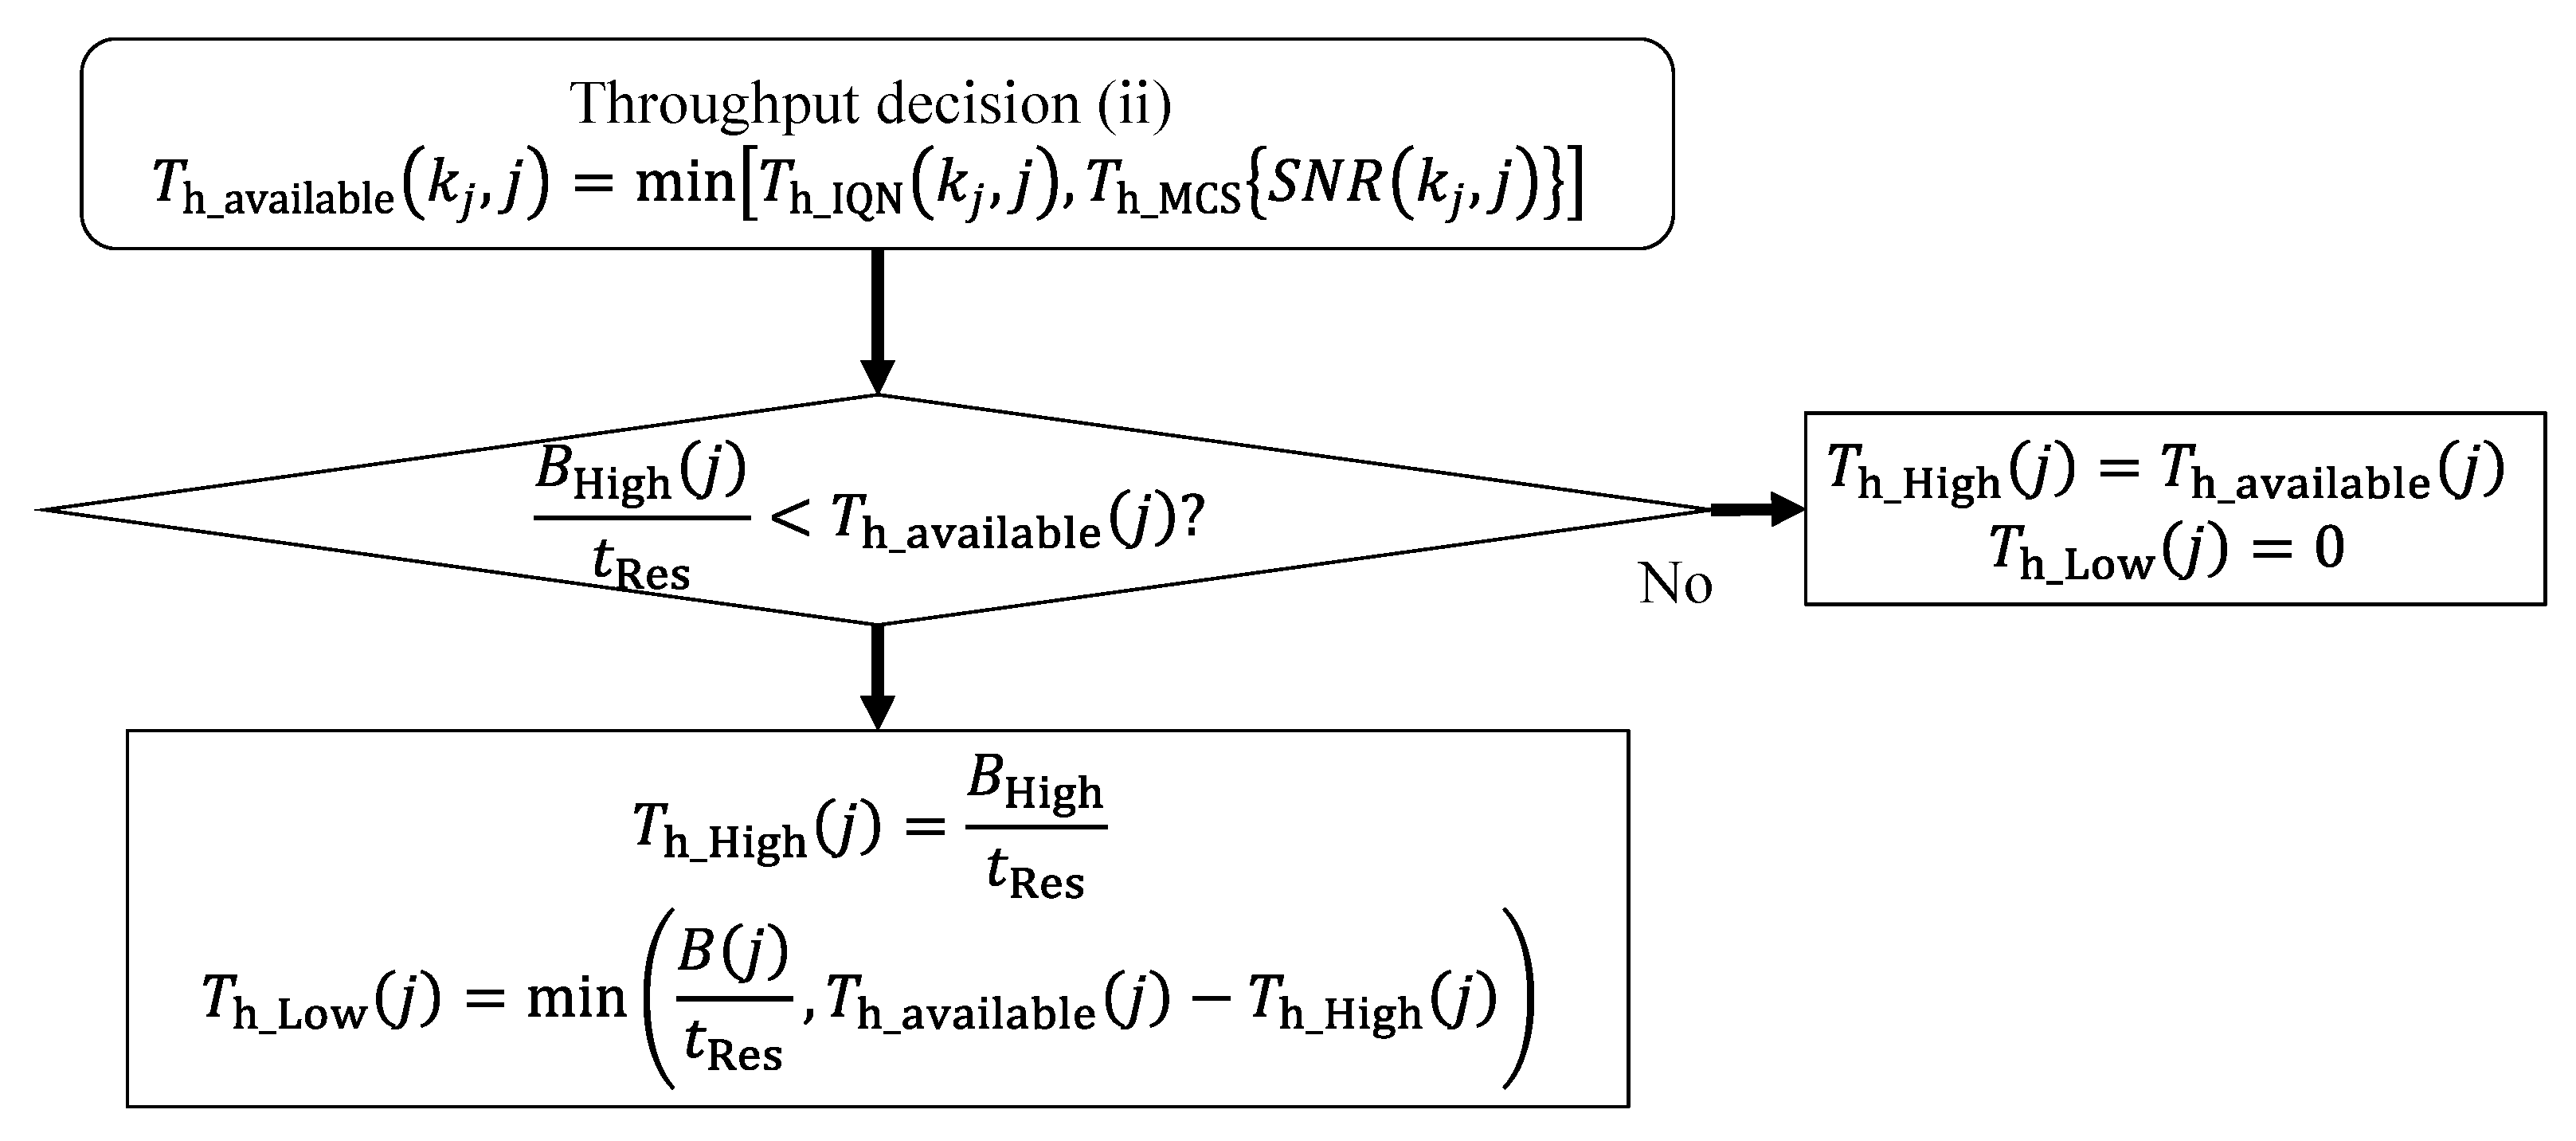
3.5. Proposed Adaptive Transmission Suspension Flowchart

Figure 5 shows the throughput decision algorithm of the proposed adaptive transmission suspension scheme. First, the available throughput T h _ available j is obtained using (5). Next, the target vehicle compares T h _ available j with the required throughput to transmit high priority data, given by B High j / t Res . Because the high priority data should be transmitted immediately, when T h _ available j is larger than B High j / t Res , the vehicle makes the actual high-priority data throughput as T h _ High j = B High j / t Res . If not, the vehicle makes T h _ High j = T h _ available j . In this case, there is no additional margin to transmit low priority data, and hence, the vehicle decides T h _ Low j = 0 and finishes the flowchart. Next, the target vehicle compares T h _ available j T h _ High j with the required throughput to transmit low priority data, given by B Low j / t Res . When T h _ available j T h _ High j is larger, the vehicle recognizes that the current base station is not crowded, makes the actual throughput as T h _ Low j = B Low j / t Res , and finishes the flowchart. If not, the vehicle searches for the maximum incoming throughput Q o S and its time m within the IQN information. In particular, using T h _ IQN k , j + m and   S N R k , j , the Q o S for time j + 1 to j + b and time m for 1 m b are searched, as shown in Figure 5. The T h _ IQN and m are obtained as follows:
T h _ min k , j , m = min T h _ IQN k j , j , T h _ MCS S N R k j , j
T h _ IQN = max m ,     k T h _ min k , j , m ,       m = argmax m T h _ IQN
Next, the vehicle compares the T h _ IQN with λ High + λ Low m + B j / t Res that is the estimated required traffic at time m . When T h _ IQN is larger, the vehicle decides that the queued data in the buffer can be transmitted at time m , even if some of the current data transmission is suspended, and makes T h _ Low j = α T h _ available j T h _ High j , where 0 α 1 . That is, 100 1 α % of the current required traffic is suspended. When coefficient α is small, a large amount of data is suspended, and S u m decreases significantly when the instantaneous SNR at time m decreases and the MCS level also decreases. Thus, α is a dominant factor of the proposed algorithm. When T h _ IQN is small, the vehicle decides that there is no suspension effect, and sets T h _ Low j = T h _ available j T h _ High j . The conventional throughput decision flowchart is shown in Figure 6, where IQN is not used. First, the vehicle calculates T h _ available j , and compares T h _ available j with B High j / t Res . When B High j / t Res is larger, the vehicle makes throughput T h _ High j = B High j / t Res and T h _ Low j = 0 . If not, the vehicle makes T h _ High j = B High j / t Res and T h _ Low j = min T h _ available j T h High j ,   B Low j / t Res . Thus, the vehicle does not consider any congestion of the base stations.

4. Numerical Results

We show the performance of the proposed scheme in a few scenarios by conducting numerical simulation using MATLAB. The simulation scenario and the full-load capacity of base station and the T h _ MCS performance with the configurations of 5G are described in Section 4.1 and Section 4.2, respectively. An example of link budget used in this simulation and the throughput performances are shown in Section 4.3. The S u m and   O u t performances are described in Section 4.4 using the proposed scheme. Four scenarios are considered to express the congestion of macro and small base stations. The performance with several values of suspension coefficient α is evaluated in Section 4.5. Hereafter, the congestion of base stations is simulated by changing the value of T h other k , j .

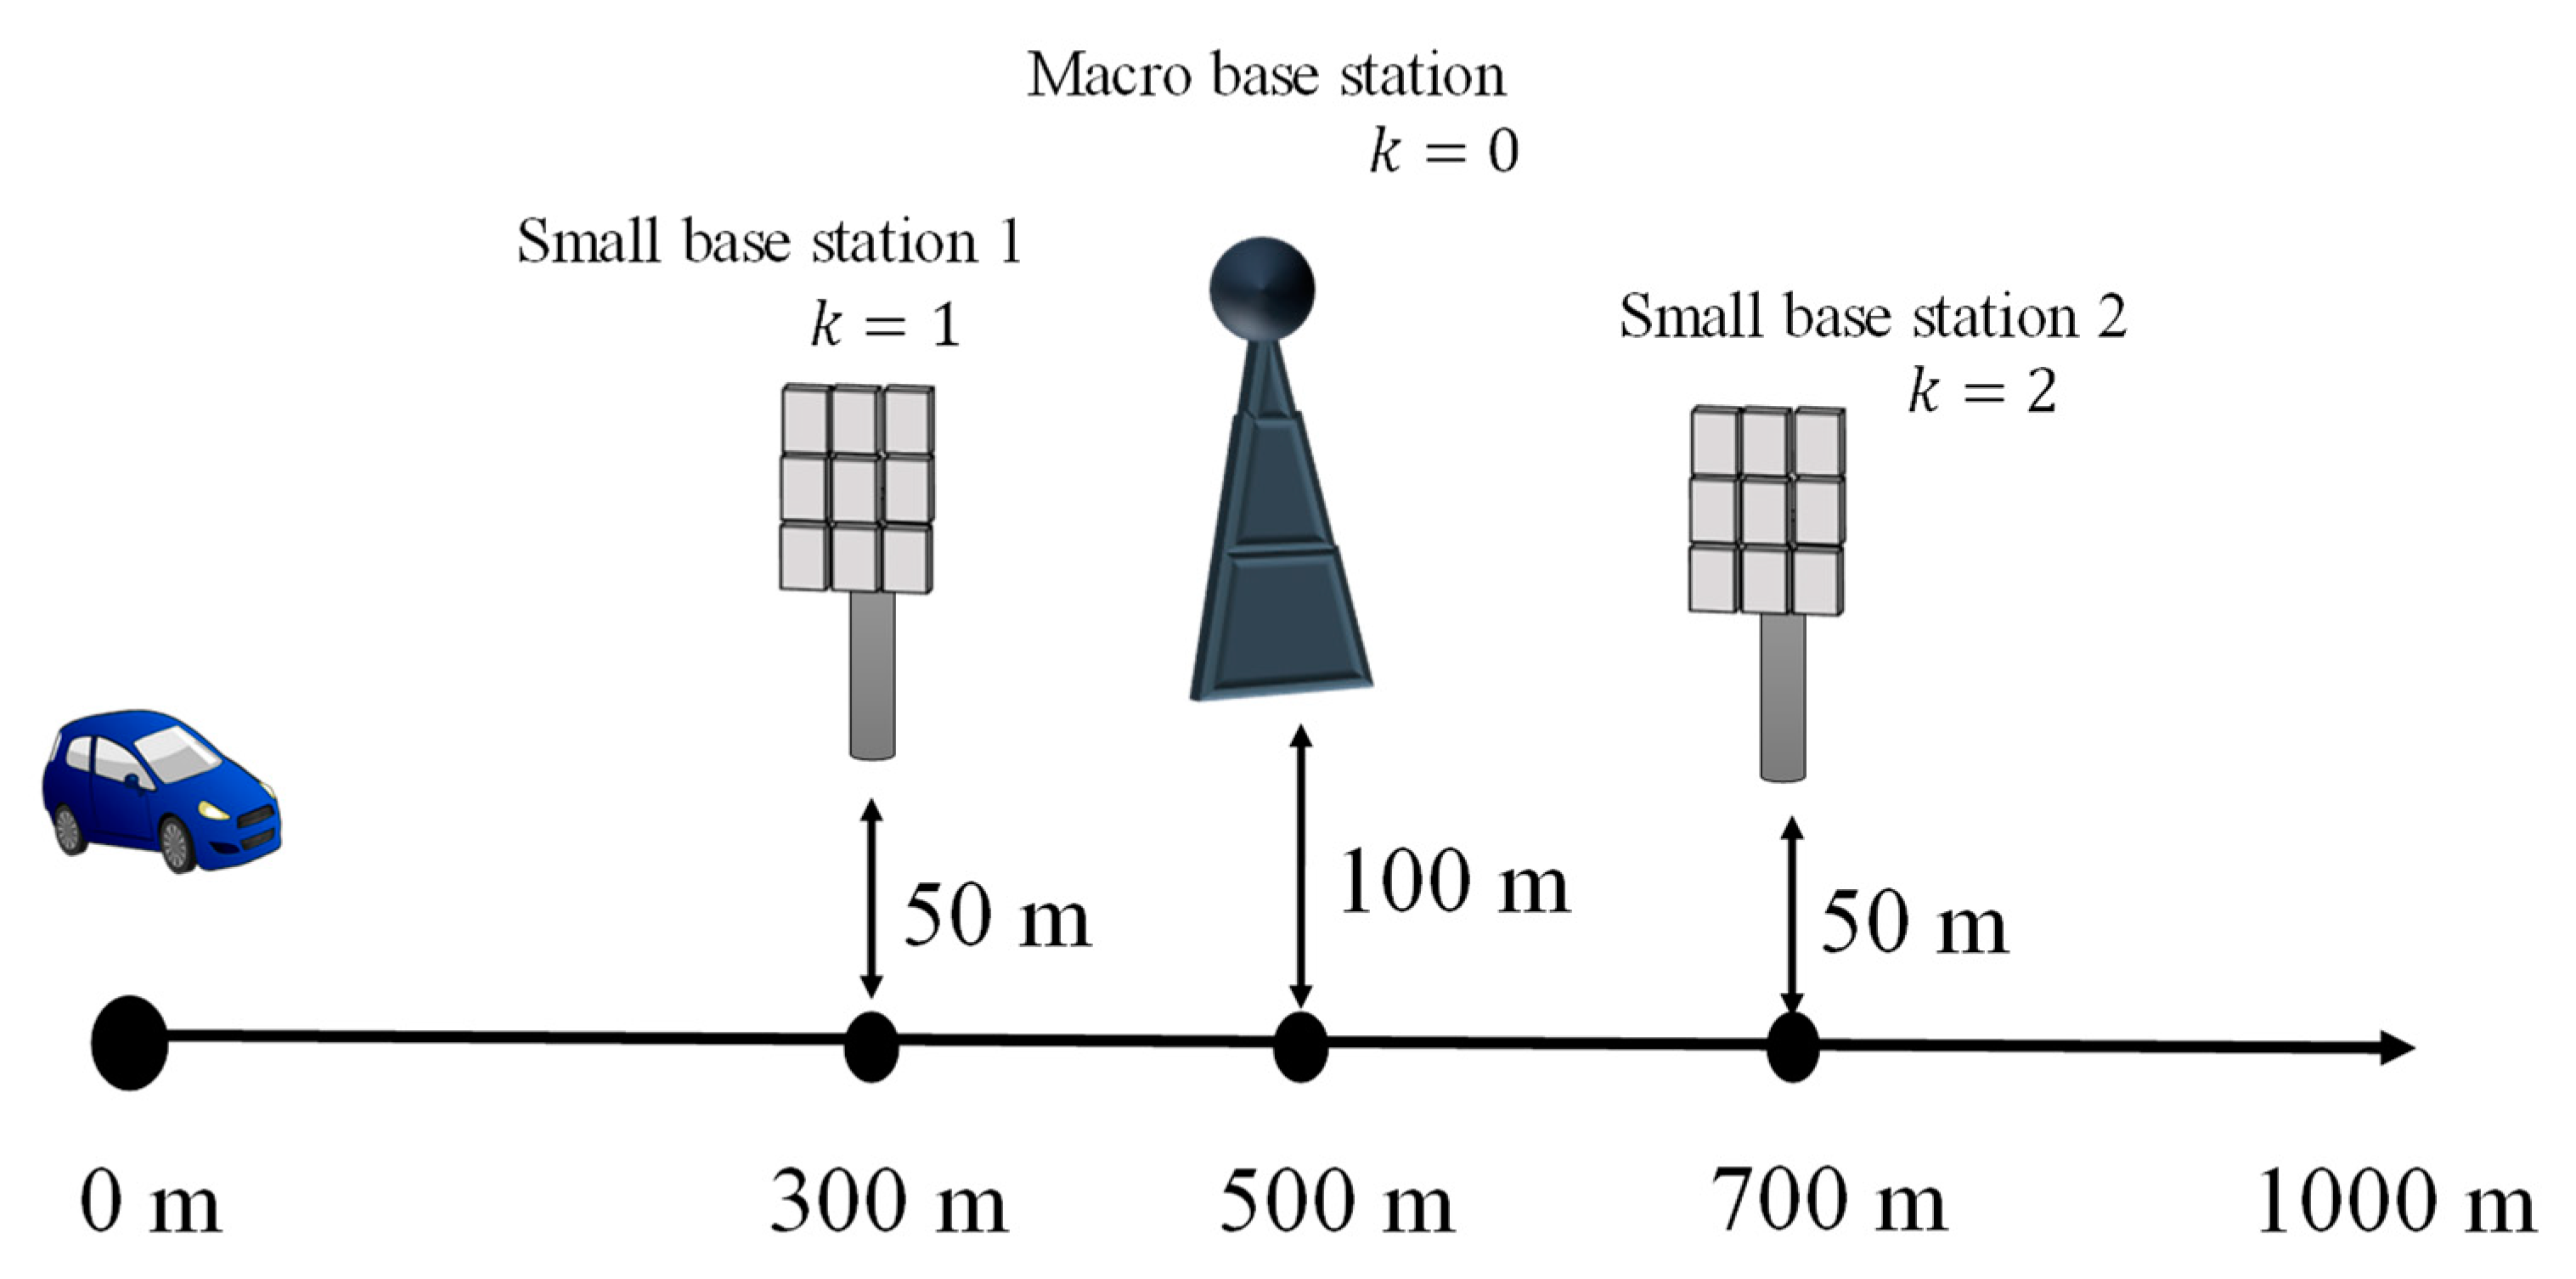
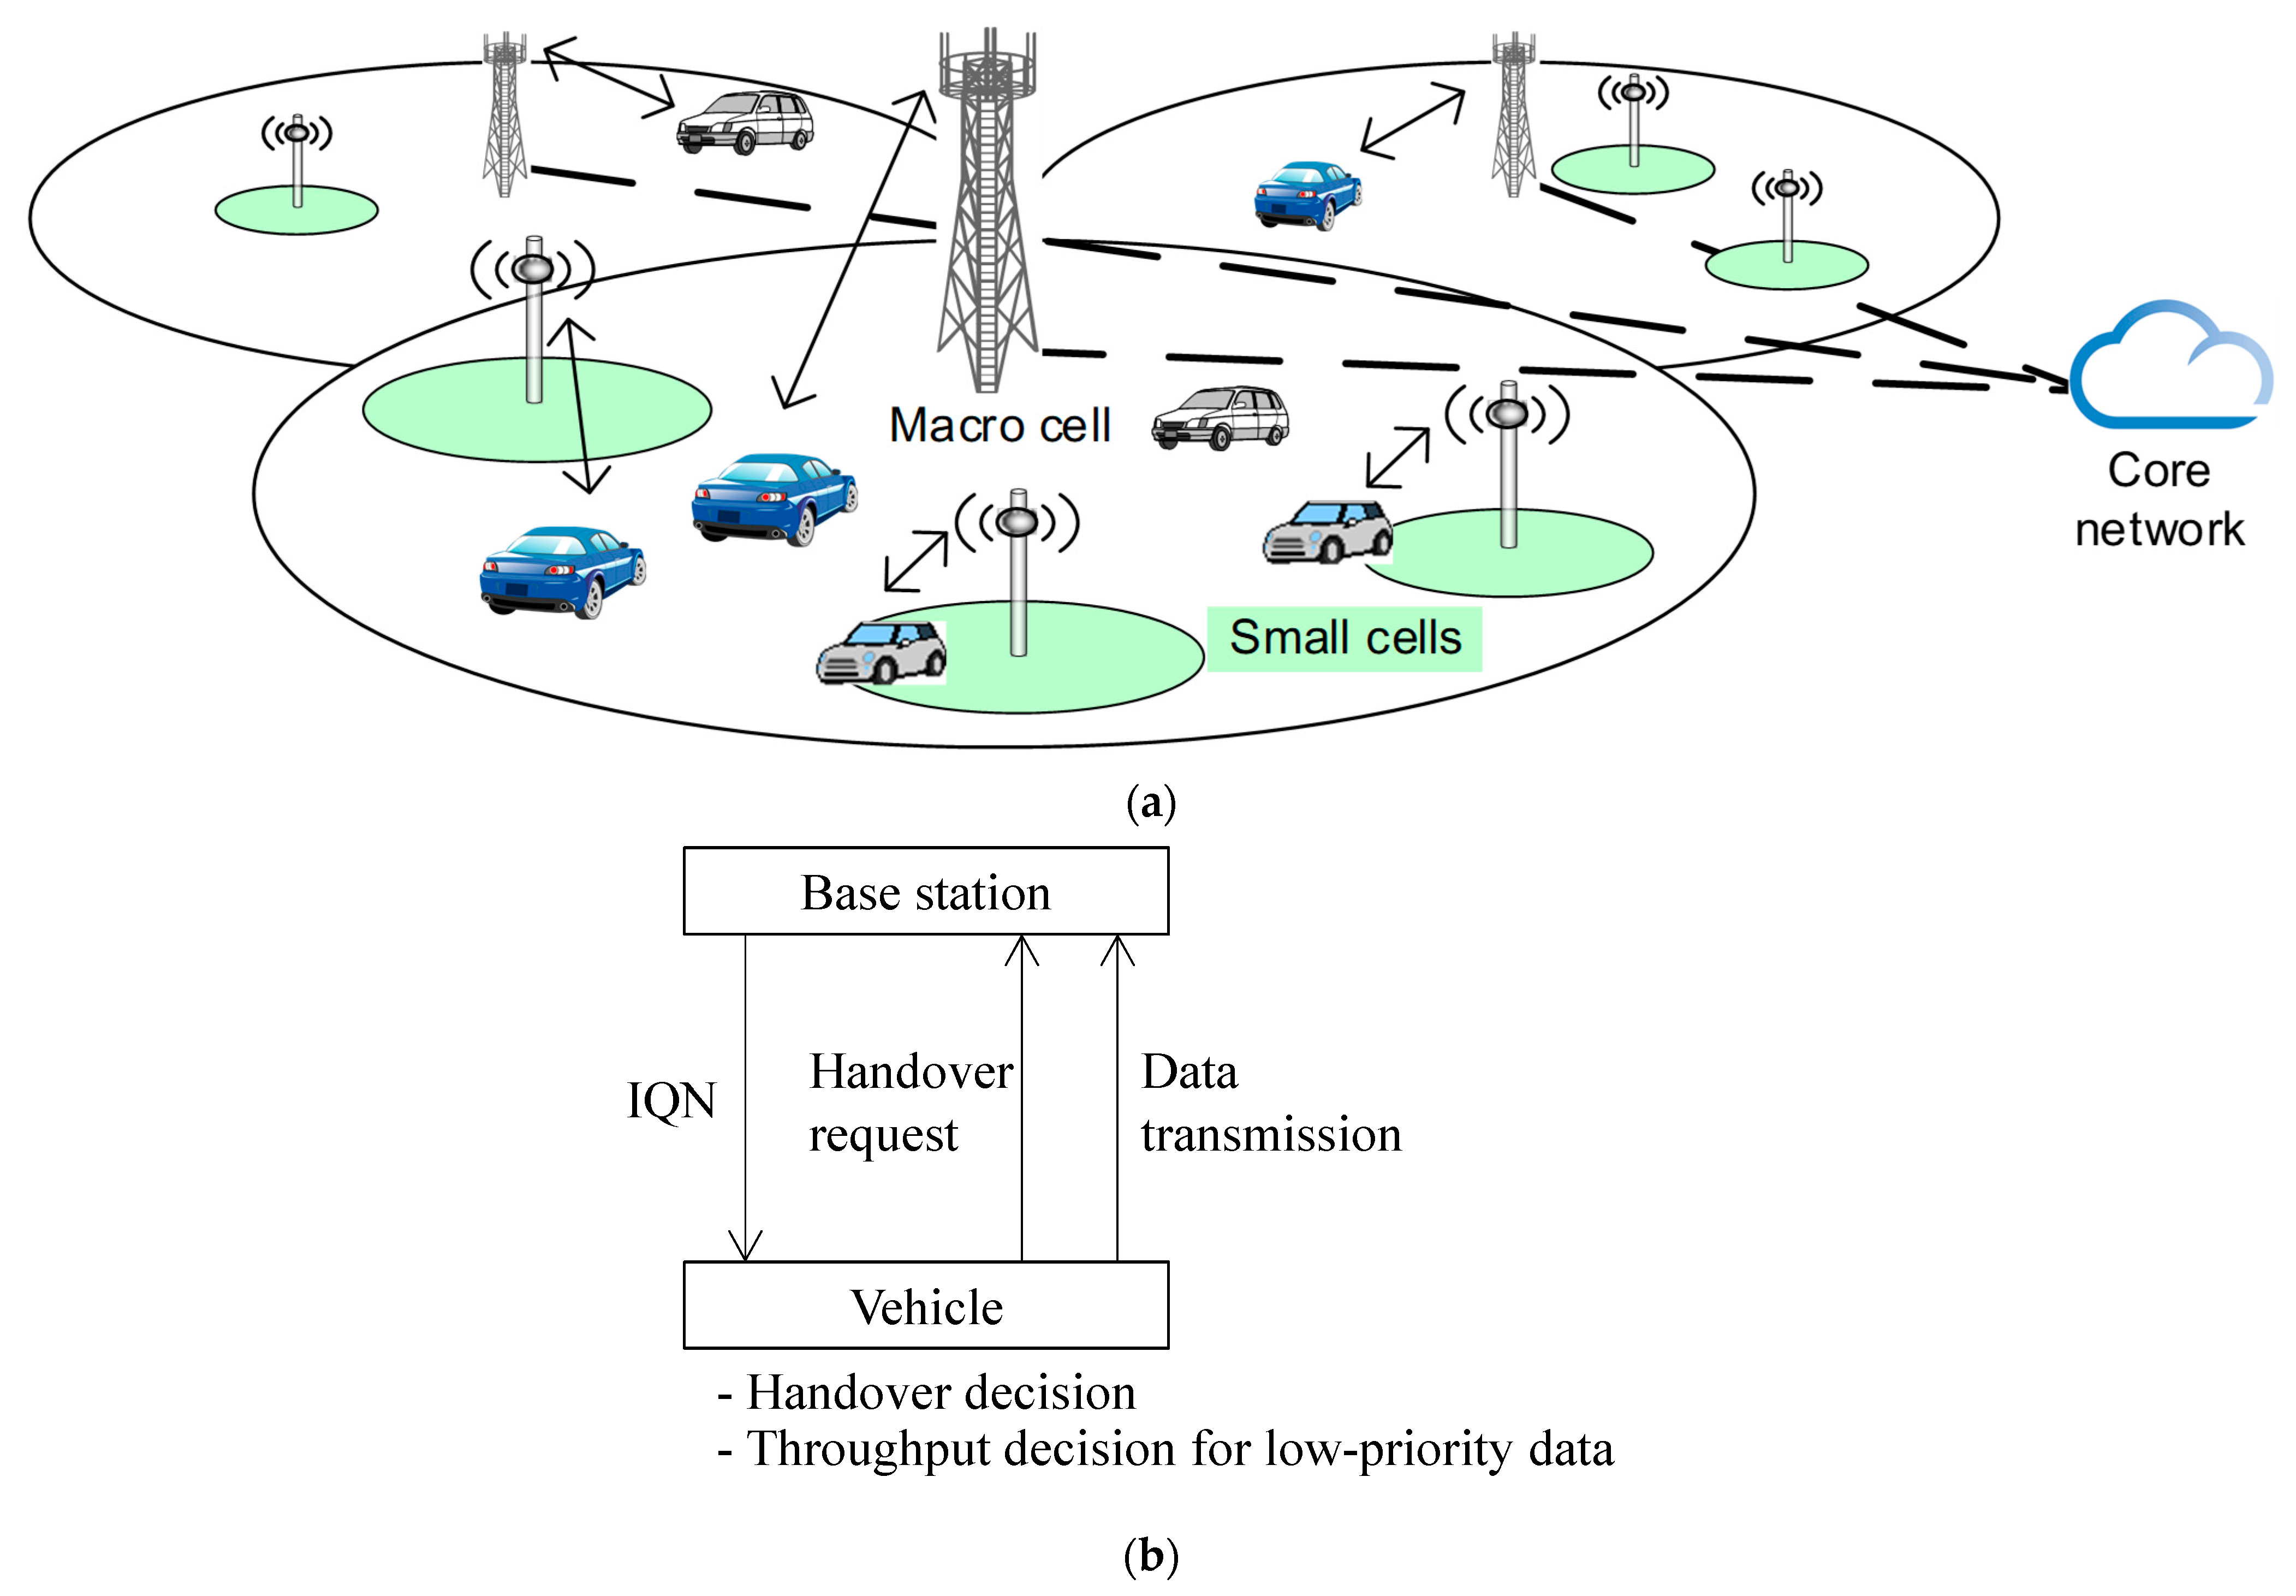
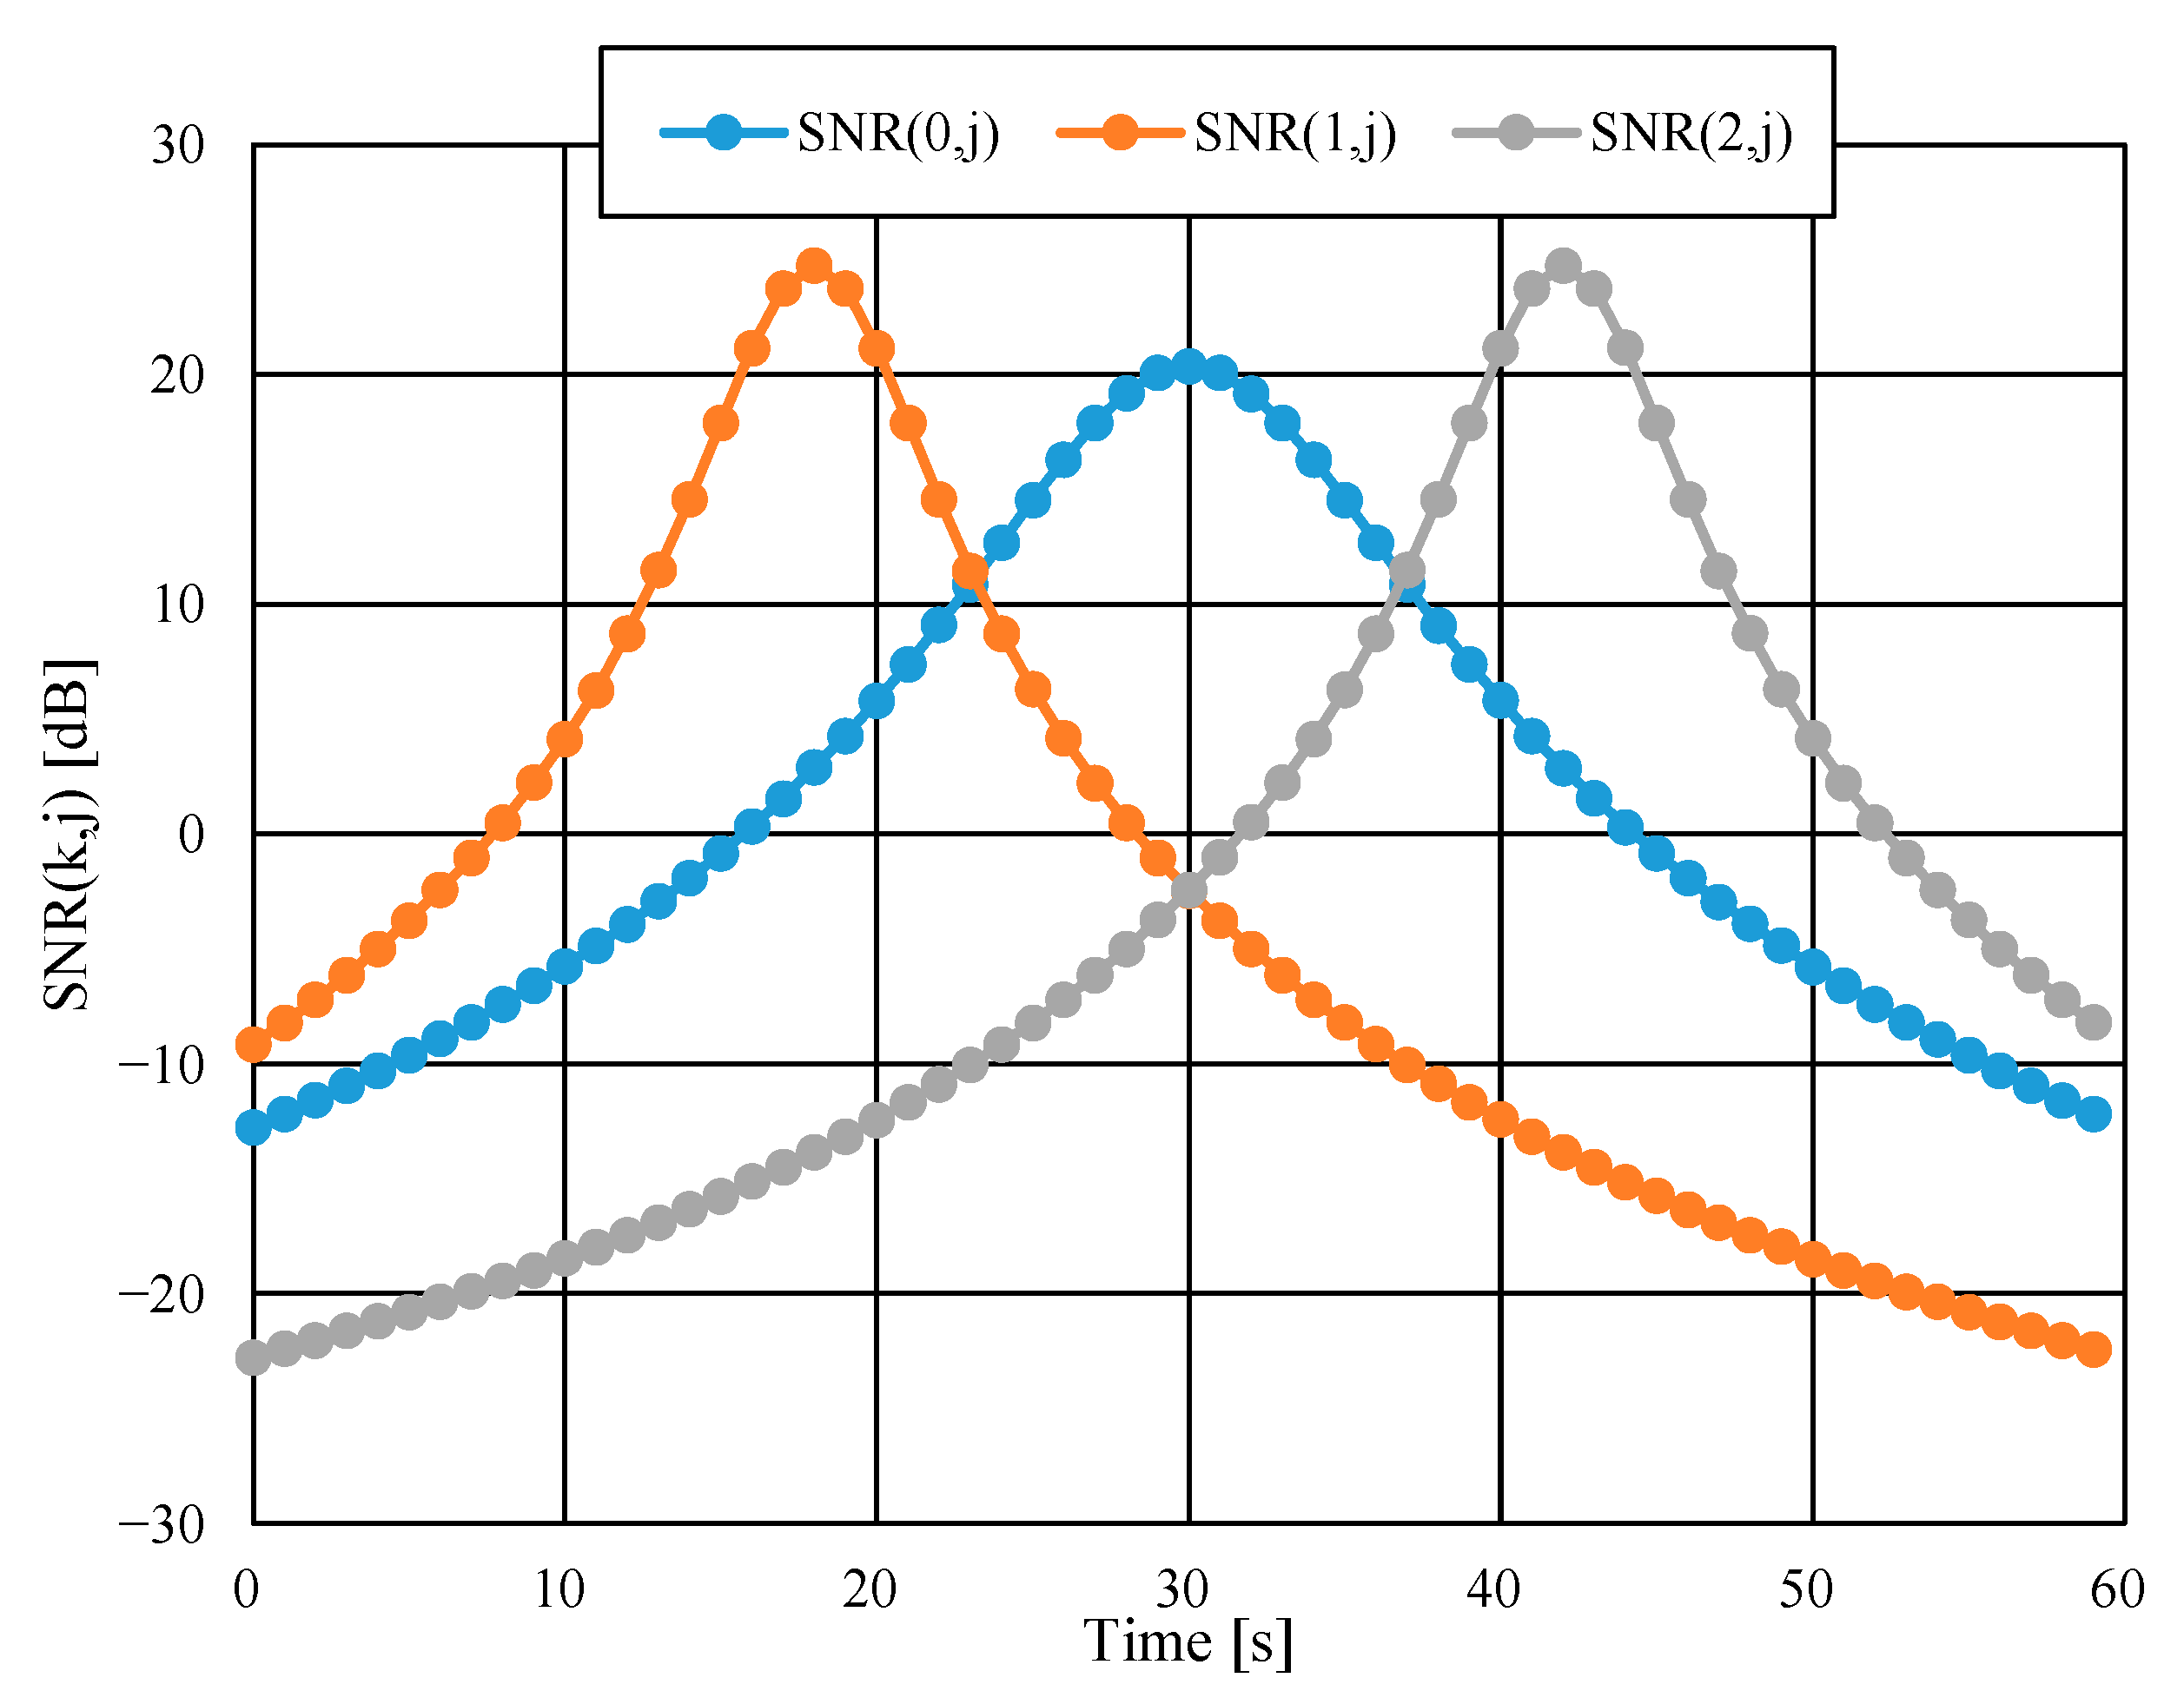
4.1. Simulation Scenario

Figure 7 shows the simulation scenario used in this study. The target vehicle runs a 1-km long straight road from left to right at a constant speed of 60 km/h. There are three base stations ( K = 3 ) comprising a heterogeneous network: one macro base station and two small base stations. The macro base station, labeled as k = 0 , is deployed at 500 m from the left with an antenna height of 25 m, and the small base stations 1 and 2, labeled as   k 1 , 2 , are located at 300 m and 700 m, respectively, both with the antenna height of 10 m. These values are taken from 5G standard models [41] (Table 1, Table 2 and Table 3), where the vehicle velocity is between 10 and 120 km/h, and the inter-site distance of base stations in a dense urban scenario is 200 m. Note that because we focus on evaluating the basic performance of the proposed scheme, the simulation scenario is configured as a simple one. More complicated scenarios such as those with multiple vehicles or area expansion will be considered in future studies.
The average received S N R k , j trajectory at each base station is shown in Figure 8 using the parameters shown in Table 1 and Table 2. The horizontal and vertical axes represent the time and average SNR, respectively. The results confirm that S N R k , j for each k becomes the maximum when the vehicle passes through each base station. Typically, the base station with the maximum S N R k , j changes at time j = 23 s and 37 s. Thus, it can be said that the vehicle is likely to perform handover a few times at the above-mentioned times because of change in SNR and the fading effect. It can be observed from Figure 8 that the maximum average SNR is 23.5 dB in this scenario.
Figure 9 shows the connection rate of the vehicle to each base station. It was confirmed that the higher the SNR, the higher the connection rates. It was also found that the vehicle tended to perform handover from small base station 1 to macro base station at time 23–24 s, and from macro base station to small base station 2 at time 36–37 s. The result coincides with the one shown in Figure 8.

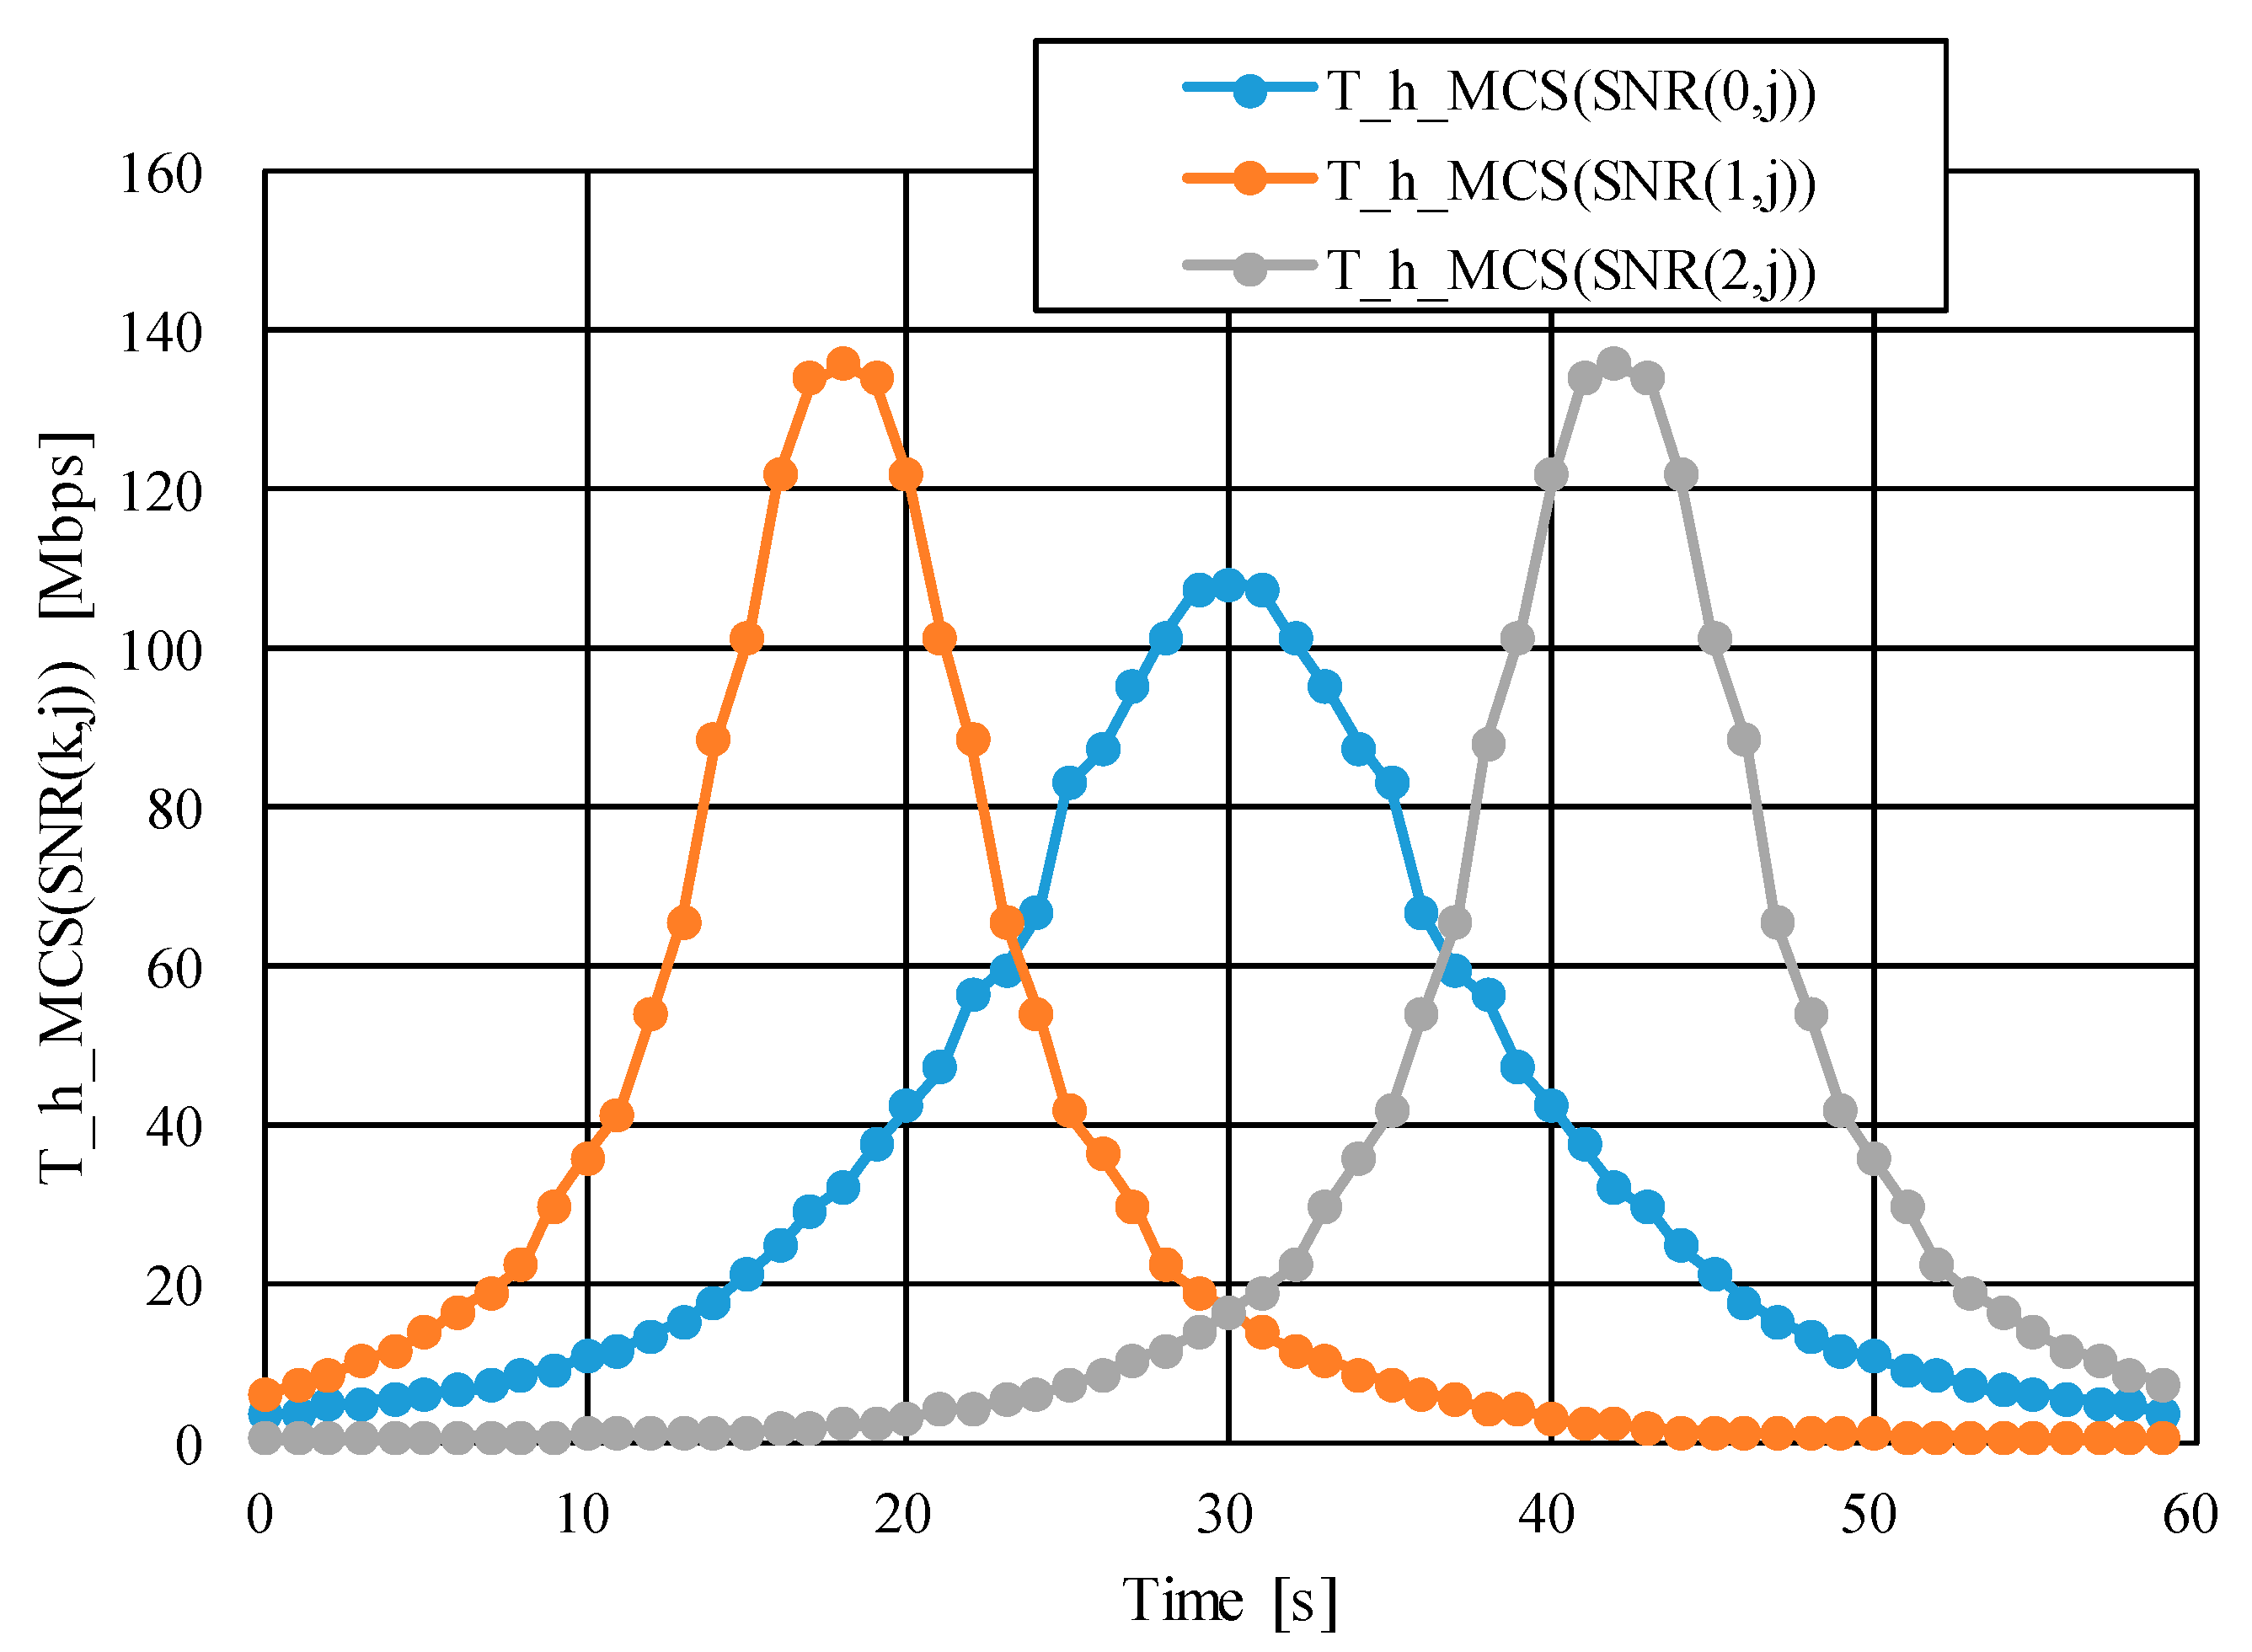
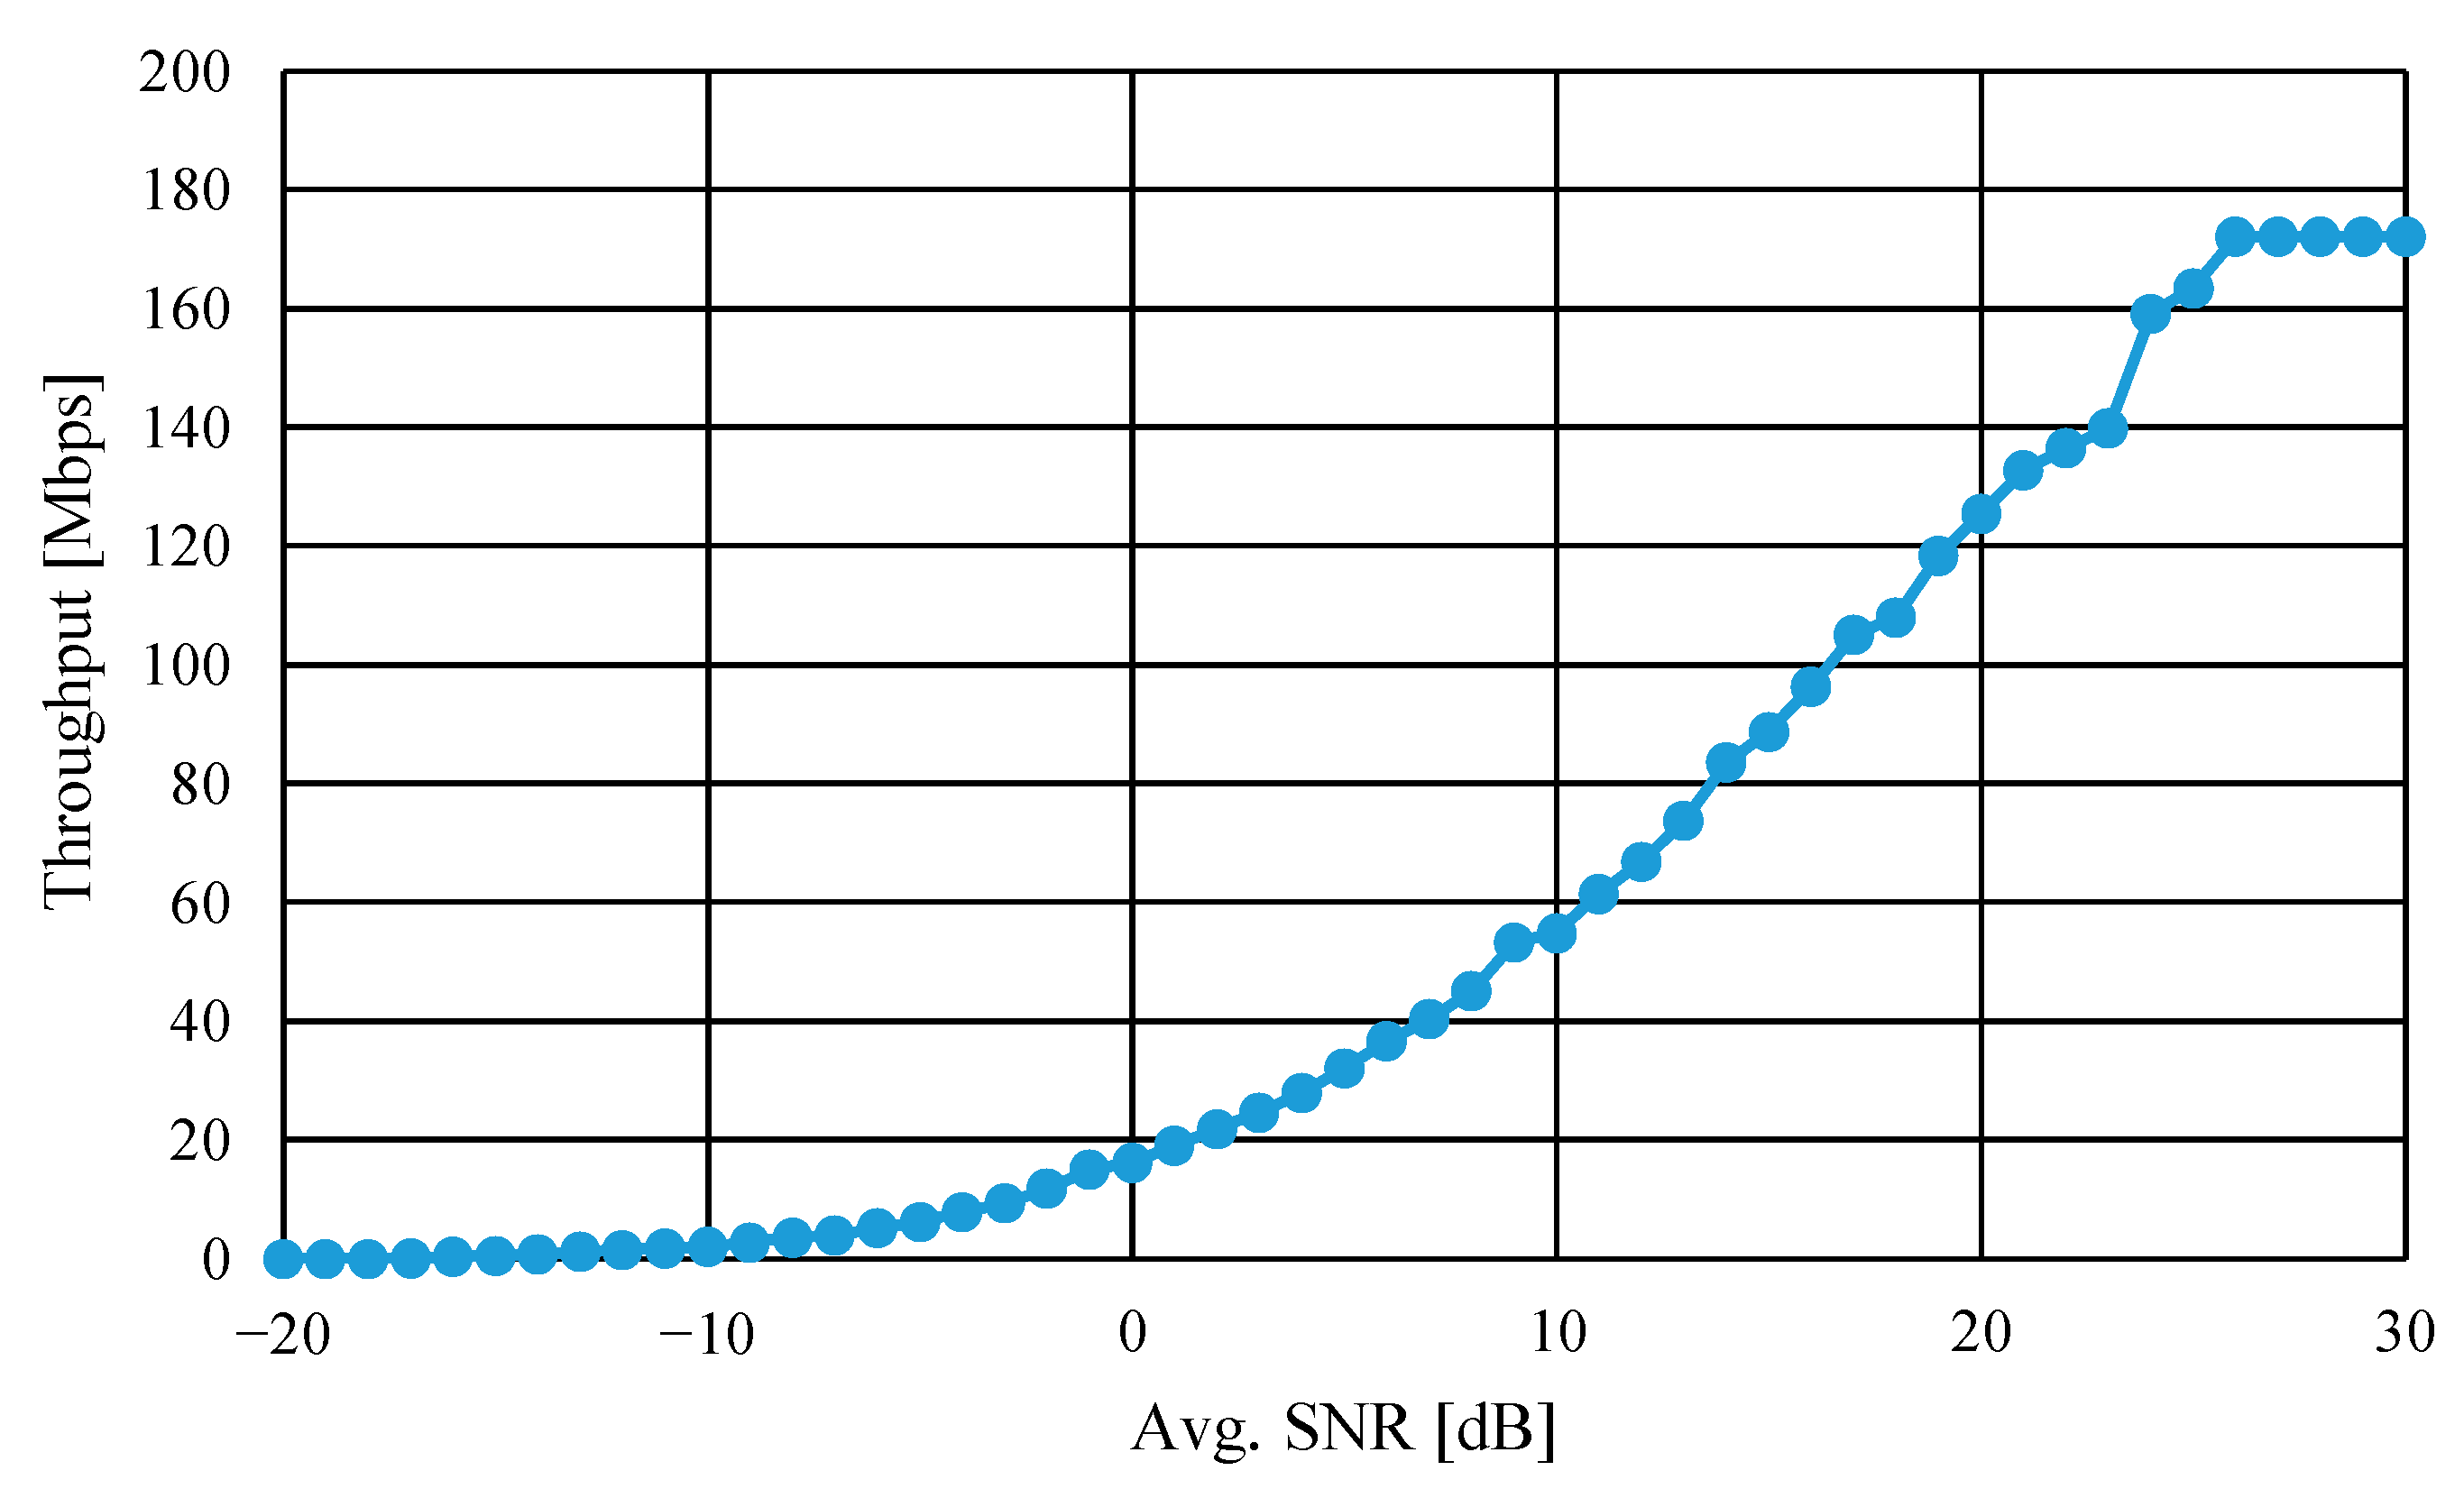
4.2. Throughput Calculation

To obtain T h _ MCS , we evaluated the simple one-link throughput performance versus received SNR under the condition shown in Table 1 and the MCS table shown in [39] by conducting the MATLAB simulation. The result is shown in Figure 10, where the retransmission is not considered. It is shown that the limitation of uplink throughput is 172.08 Mbps at the received SNR of 26 dB. Therefore, the capacity of the base station is set to T h _ Max k ,   j = 172.08 Mbps. Next, T h _ MCS S N R k , j versus time in the simulation scenario was calculated as shown in Figure 11, which was obtained by adopting the result obtained from Figure 10. The plots shown in Figure 11 are calculated by obtaining the average of 100,000 trials. The result confirms that T h _ MCS S N R k , j is basically following the result obtained from Figure 8, and that the user throughput is smaller than T h _ Max even when the SNR becomes the maximum in the scenario such as at time 18 s or 42 s. Hereafter, we use the throughput values of Figure 10 as T h _ MCS S N R k , j .

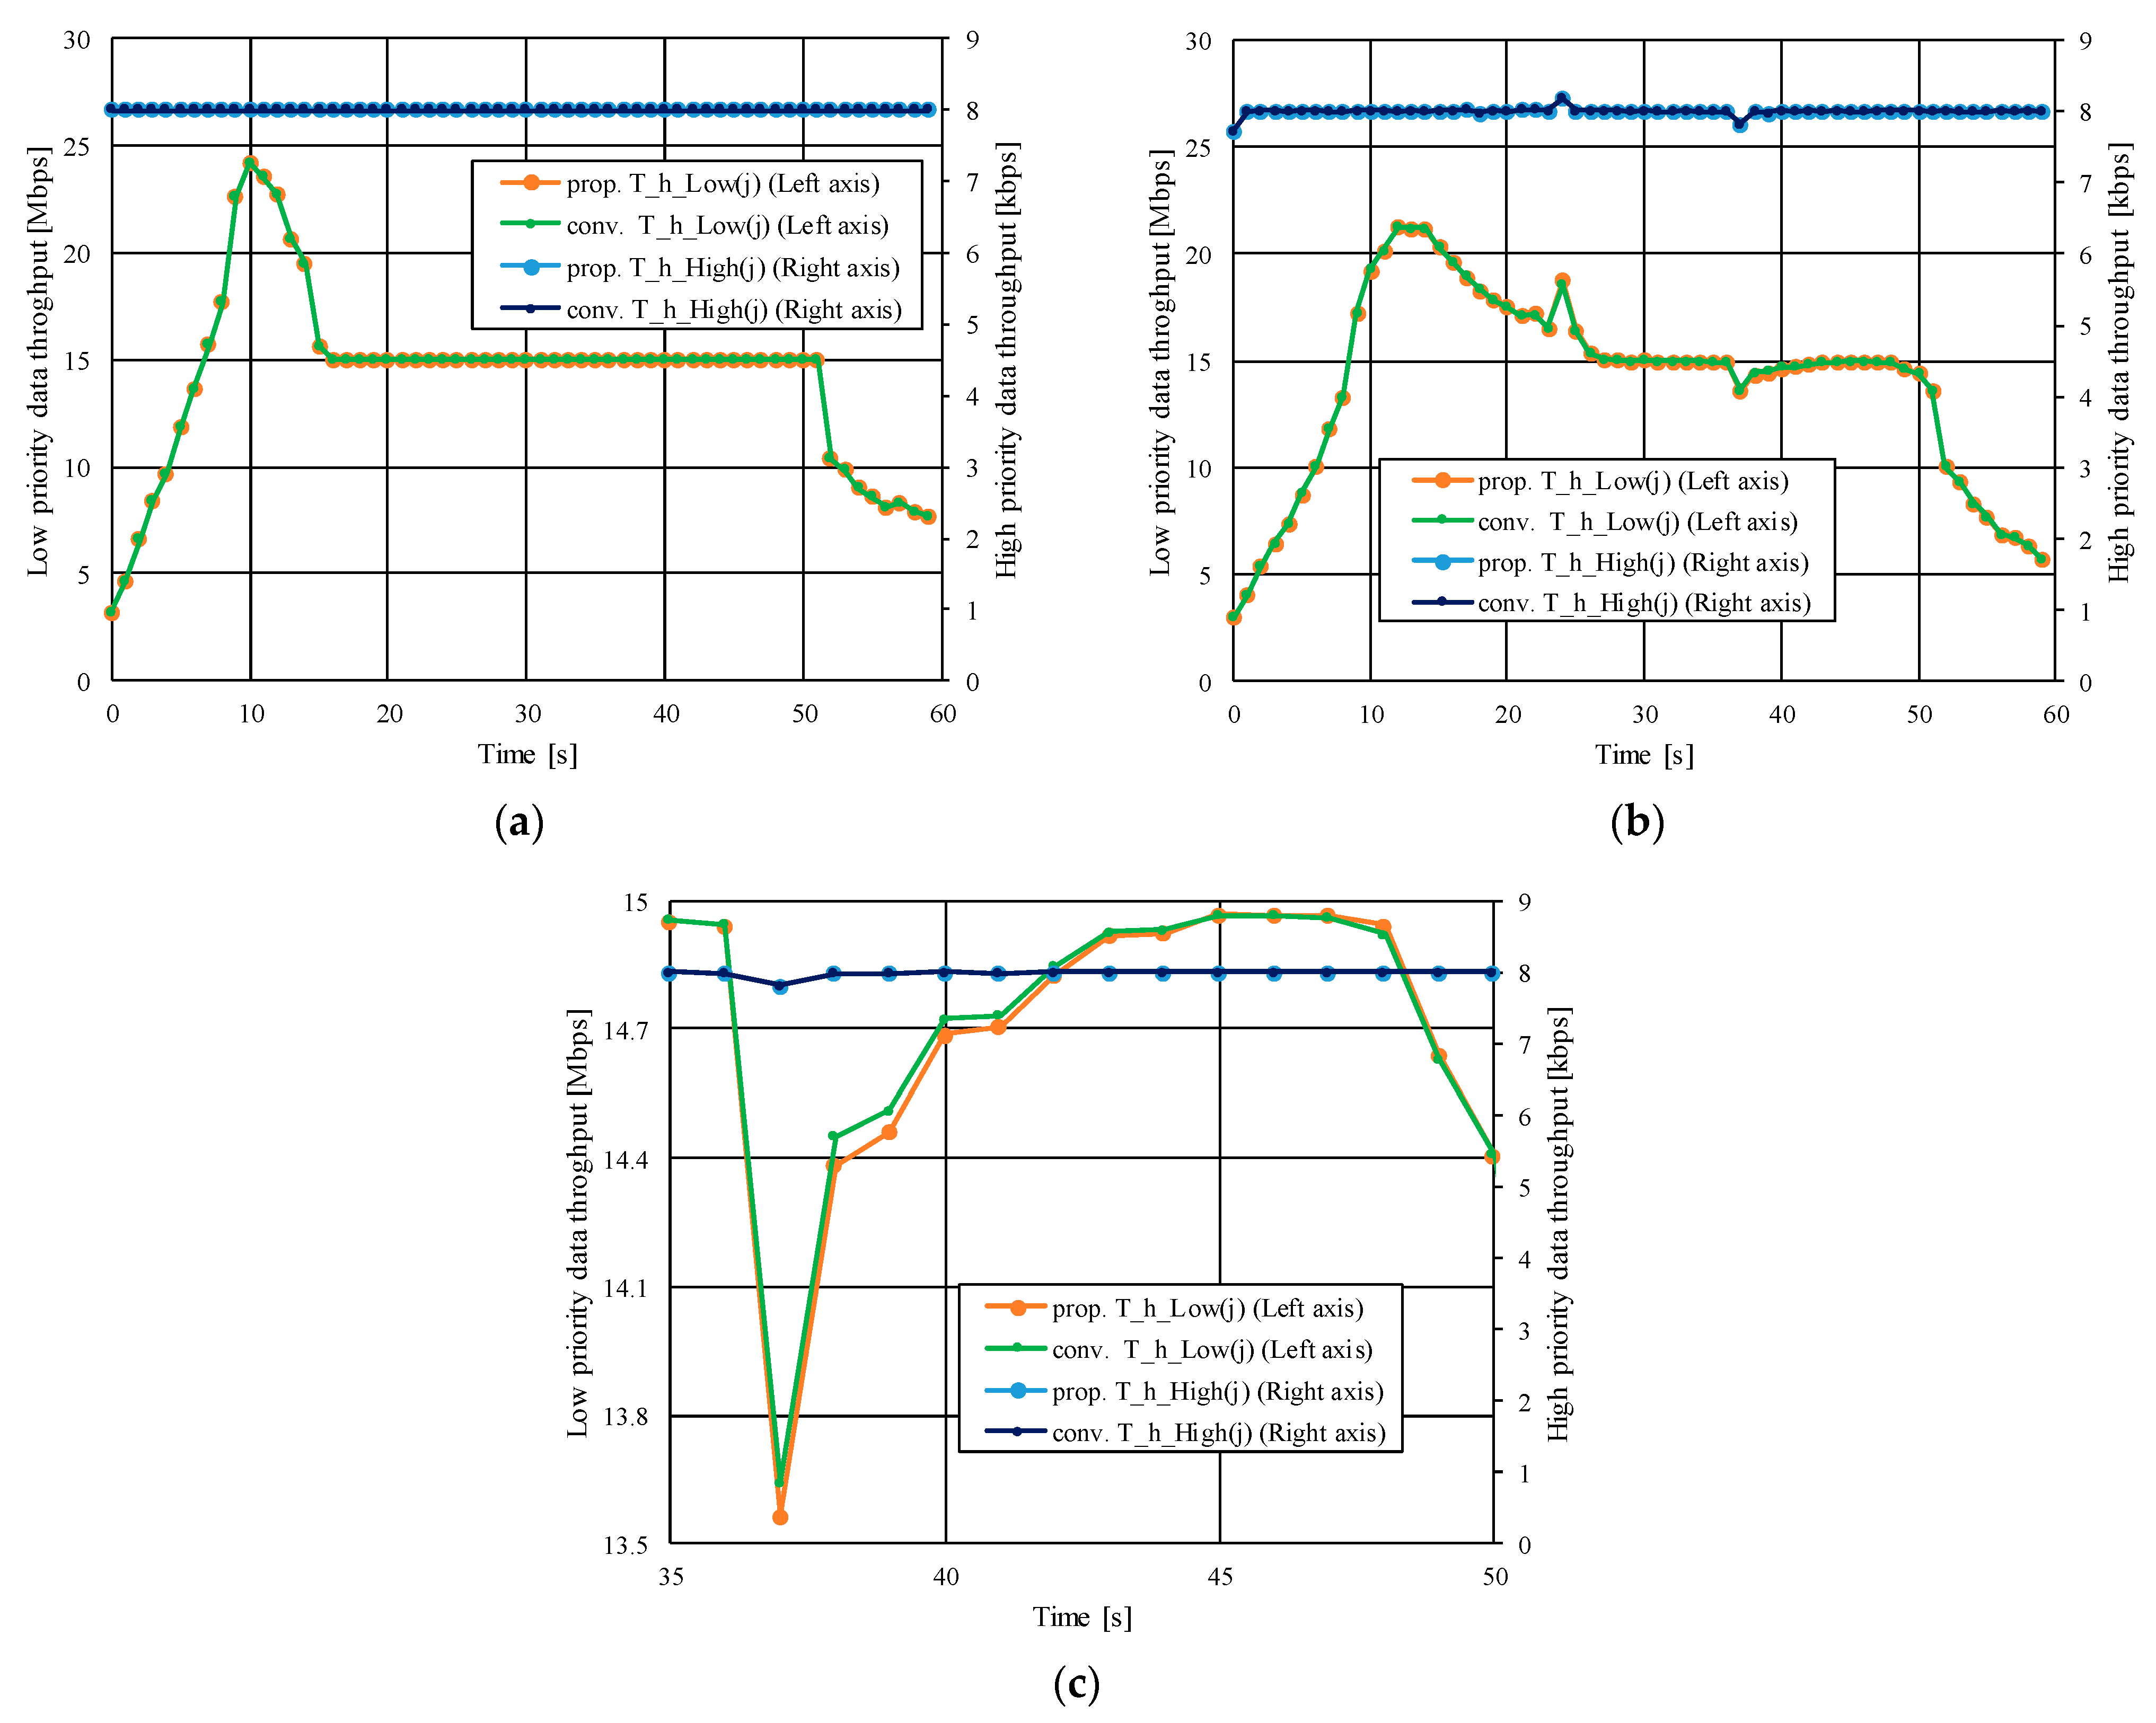
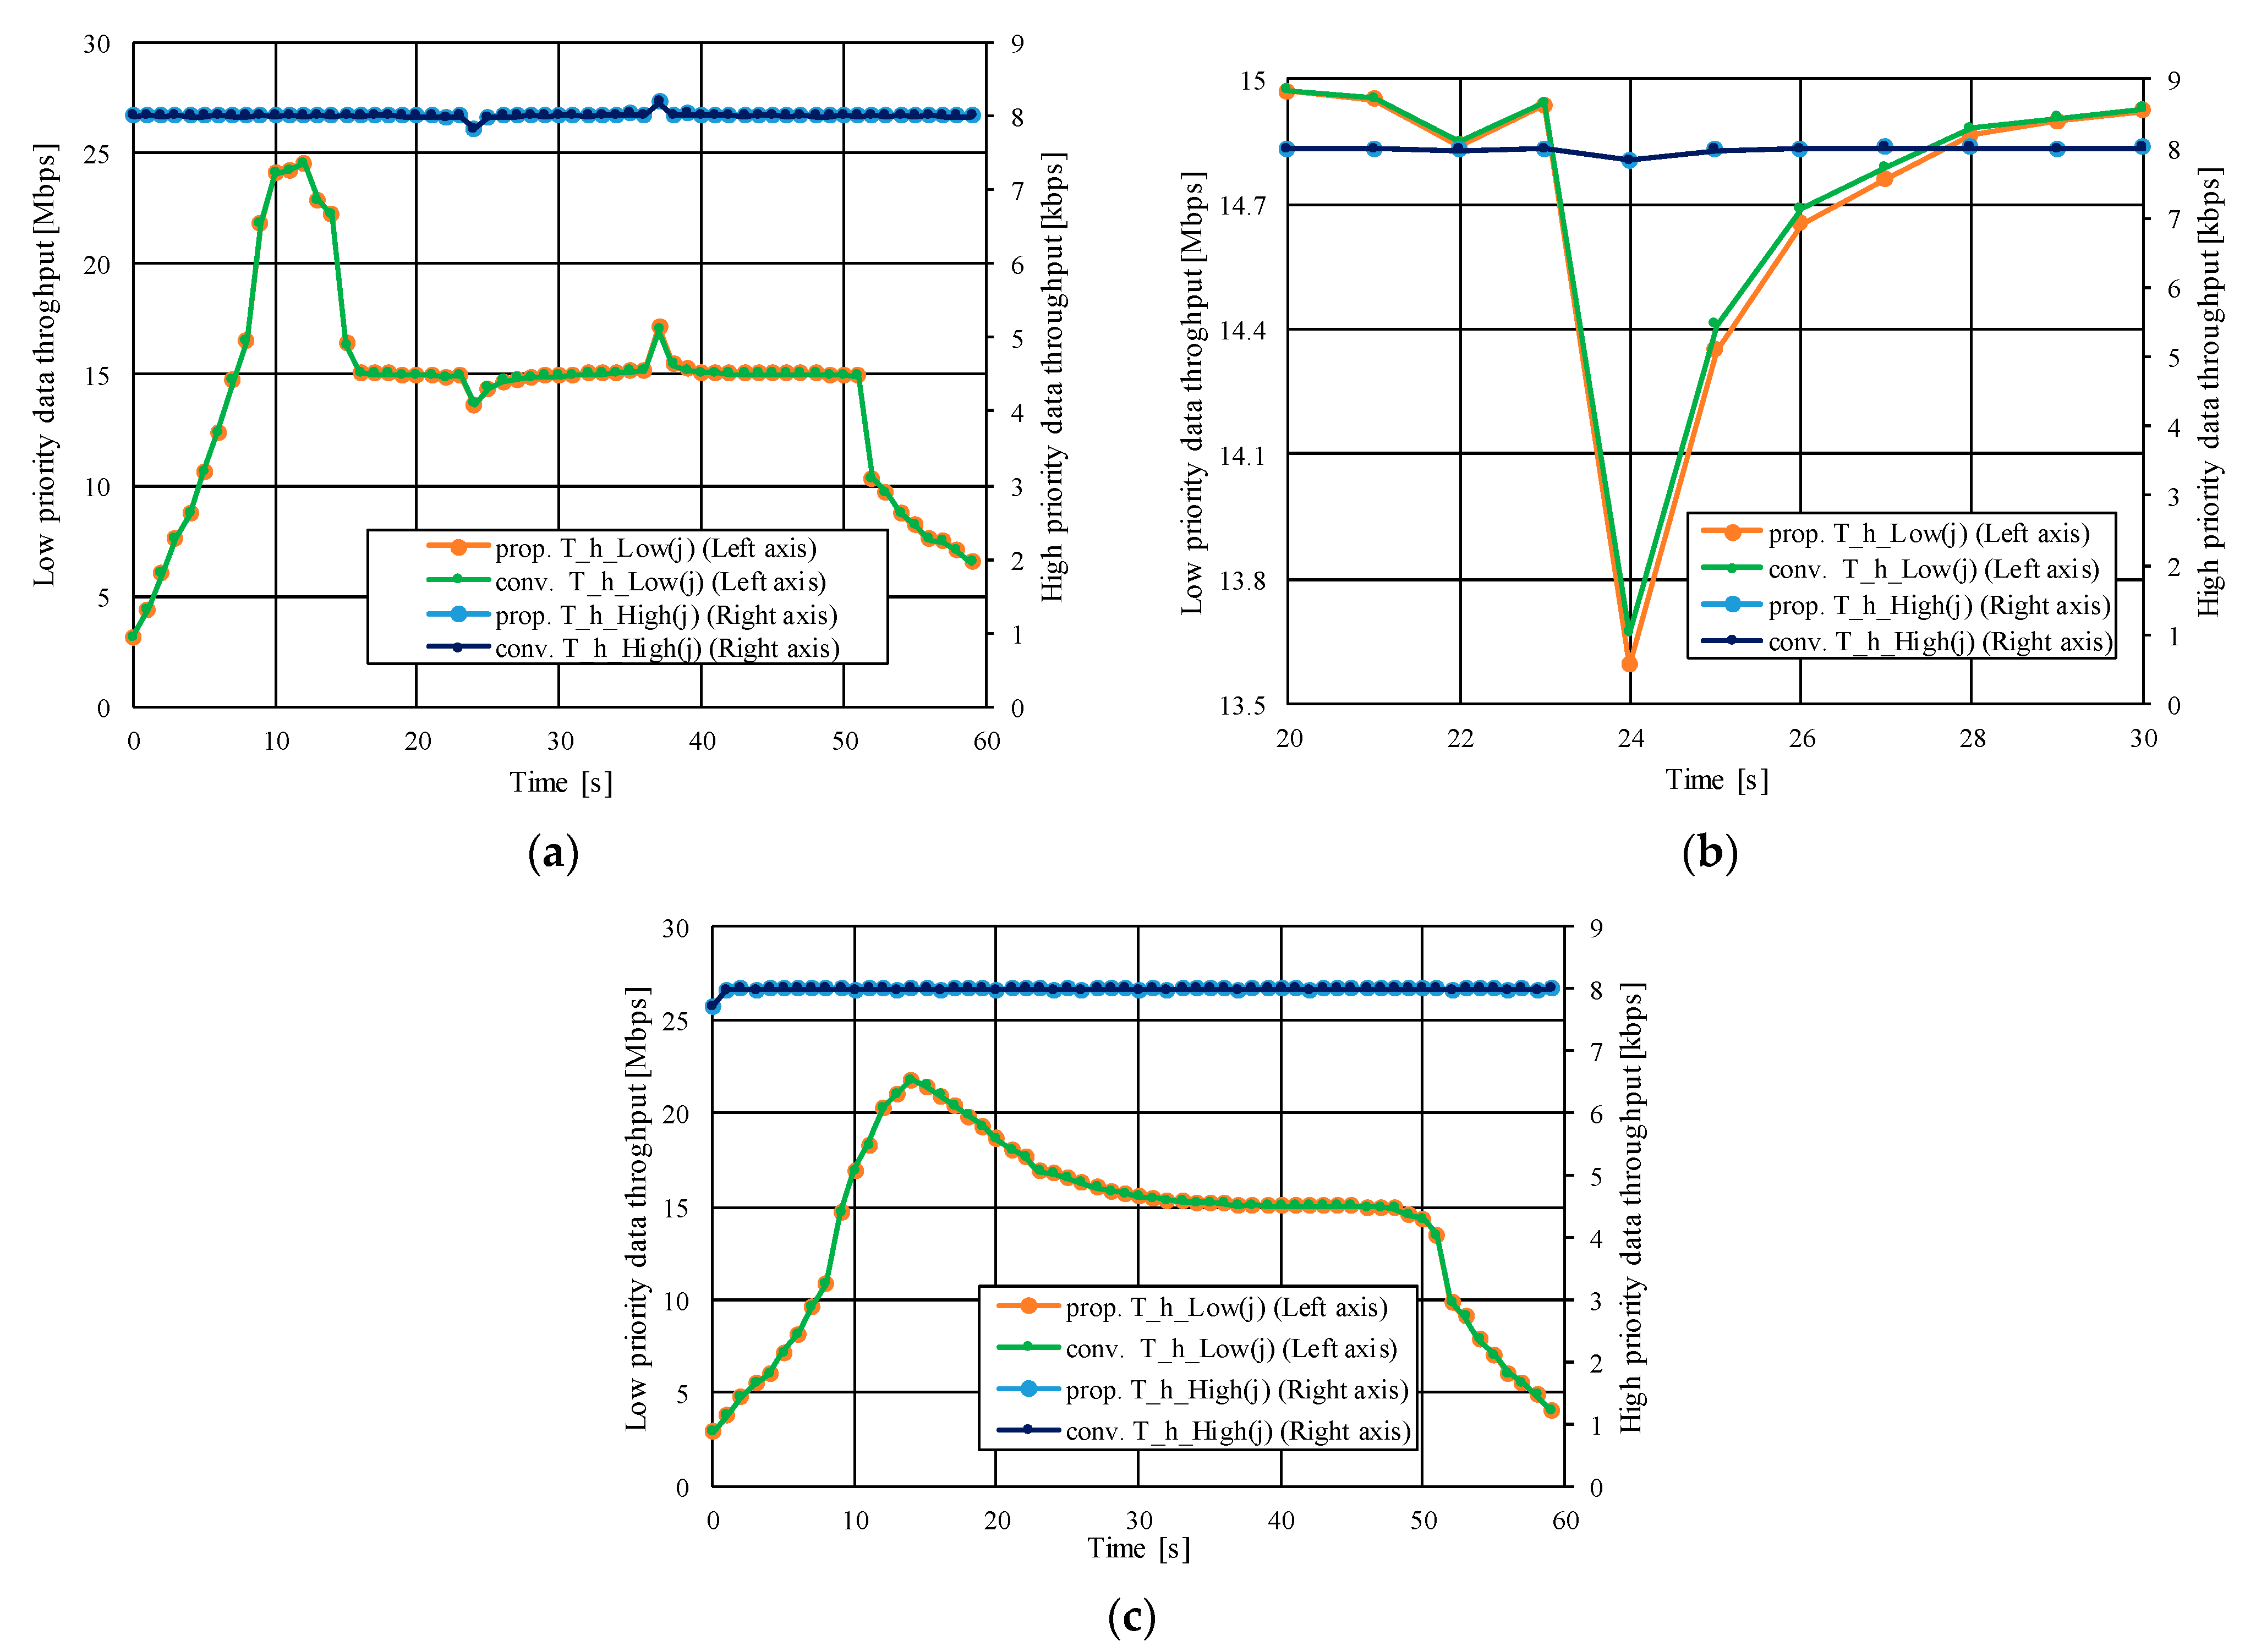
4.3. Throughput Characteristics on Different Congestion Conditions

We calculated the throughput characteristics using the parameters shown in Table 1, Table 2 and Table 3, and α = 0.95 . The generation rates of high and low priority data are 8 Kbps and 15 Mbps, respectively. We evaluated the characteristics under four scenarios shown in Table 4. Each scenario has the following conditions: (A) all base stations are empty, (B) macro base station is empty but two small base stations are crowded, (C) macro base station is crowded but two small base stations are empty, and (D) all the base stations are crowded. Here, x ¯ is the average of x .
The throughput characteristics under scenario A are shown in Figure 12a, where the horizontal and vertical axes represent time and throughputs of low (left) and high (right) priority data, respectively. It can be observed from the results that T h _ High j is constantly transmitted at 8 kbps and T h _ Low j increases from 0 s to 10 s. This is because small base station 1 is empty and S N R 1 , j increases during this time. After this time, the vehicle completely transmits the stored data in the buffer, and immediately transmits the data after 15 s. Then, T h _ Low j decreases after 50 s because the distance between the vehicle and small base station 2 increases and S N R 2 , j decreases. The proposed scheme does not suspend the data because all base stations are empty, and as a result, the characteristics of the proposed and conventional schemes are the same.
Figure 12b shows the throughput performances of scenario B, where the low-priority throughput increases at 24 s because the vehicle transmits the accumulated data stored in the congested small base station 1 area to empty macro base station. In addition, the proposed scheme suspends the data transmission at 37 s when the vehicle tends to perform handover from macro base station to congested small base station 2. Then, there is about 0.05 Mbps throughput degradation compared to the conventional scheme because of the mismatch between the planned transmission suspension and an actual impossible transmission due to the SNR degradation of the connected small base station 2 by multipath fading. Figure 12c shows the enlarged view of Figure 12b, where the summation of degradation throughout scenario B is 0.3 Mbits. However, this is sufficiently small compared to the summation of the generated whole data of 900.48 Mbits, and hence, this degradation can be negligible.
Figure 13a shows the throughput characteristics of scenario C. It can be seen that the low-priority throughput decreases at 24 s when the vehicle tends to perform handover from empty small base station 1 to the congested macro base station. Because the macro base station is congested and S N R 0 , j is not high enough to transmit the data immediately, there exists some accumulated buffer. The proposed scheme then causes the transmission suspension of the low-priority data in the buffer to the congested macro base station. Sometimes the vehicle cannot transmit the suspended data due to the instantaneous SNR degradation. Consequently, 0.1 Mbps of throughput degradation occurs compared to the conventional scheme. Figure 13b shows the enlarged view of Figure 13a. Similar to scenario B, the summation of degradation of the proposed scheme is 0.05 Mbits, which is sufficiently small compared to the summation of the generated data of 900.48 Mbits.
The throughput characteristics of scenario D are shown in Figure 13c. In this case, all base stations are congested, and the proposed scheme do not suspend the transmission at all. In particular, there is no margin to accommodate suspended data in forthcoming time, and the proposed scheme cannot perform suspension. Thus, there is no difference in the throughput performances of the proposed and conventional schemes. In addition, because the traffic is always equally congested, there is no rapid change in throughput around handovers shown in Figure 12b and Figure 13a.

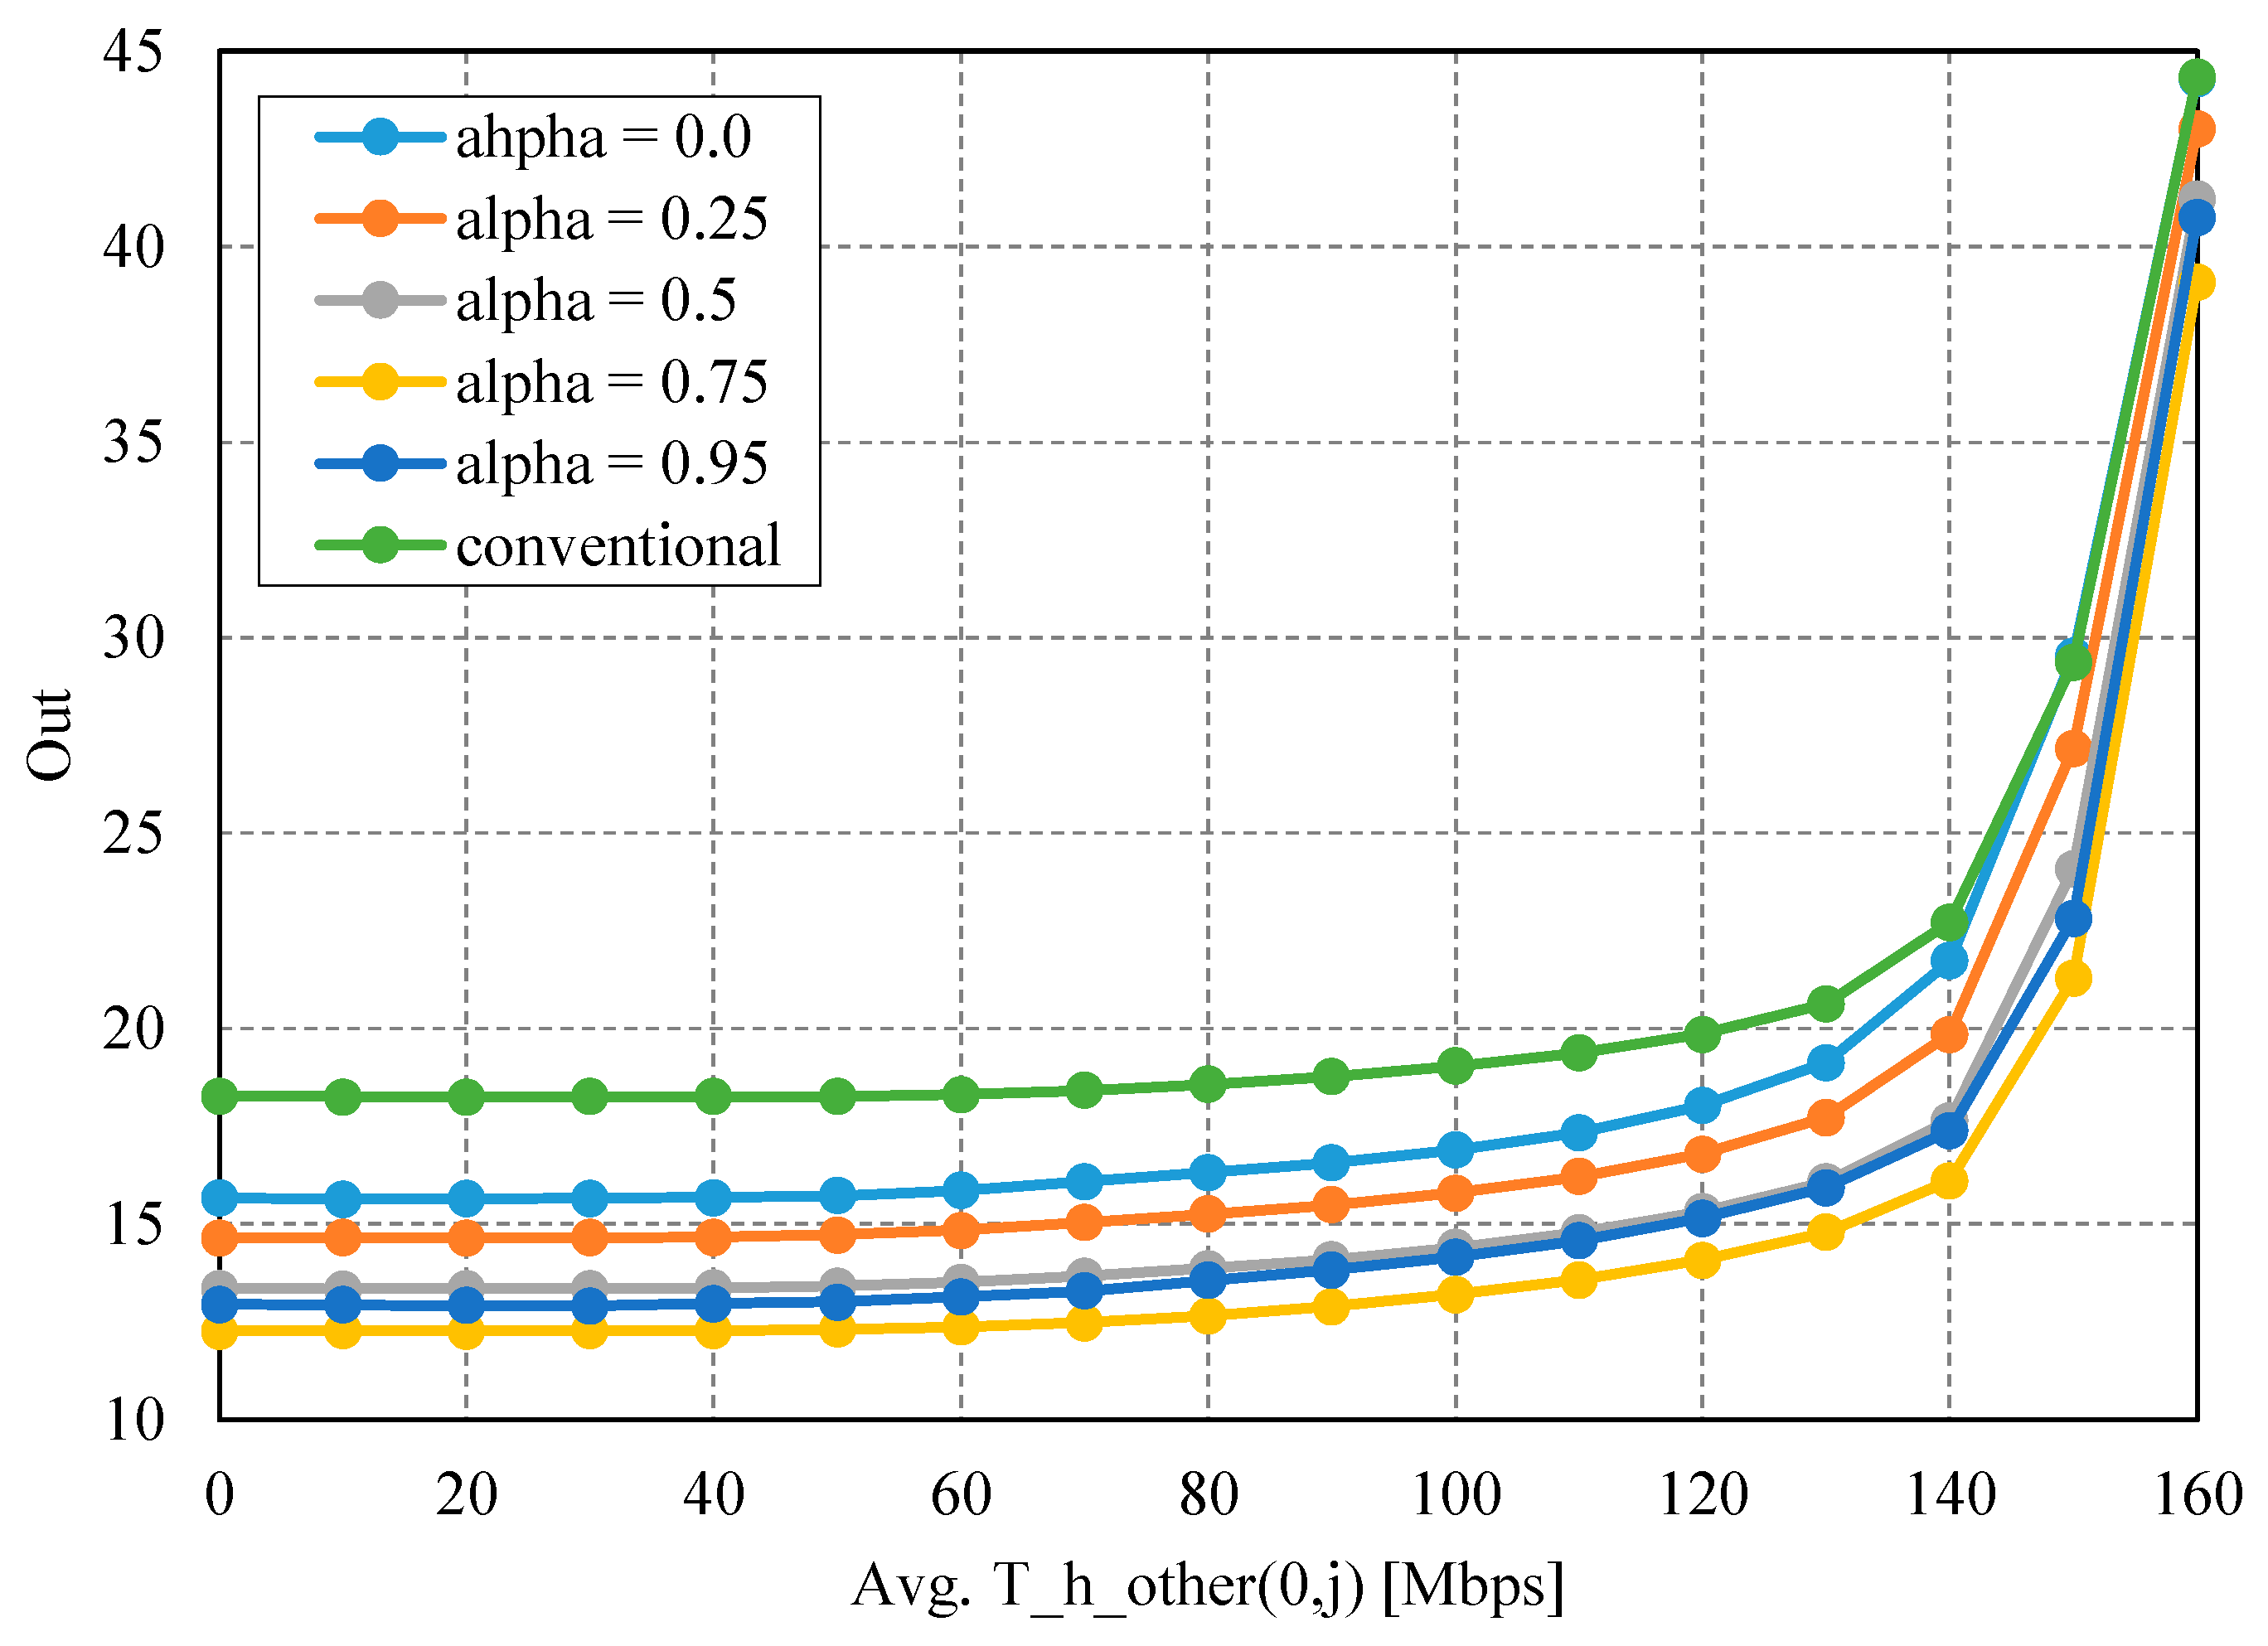
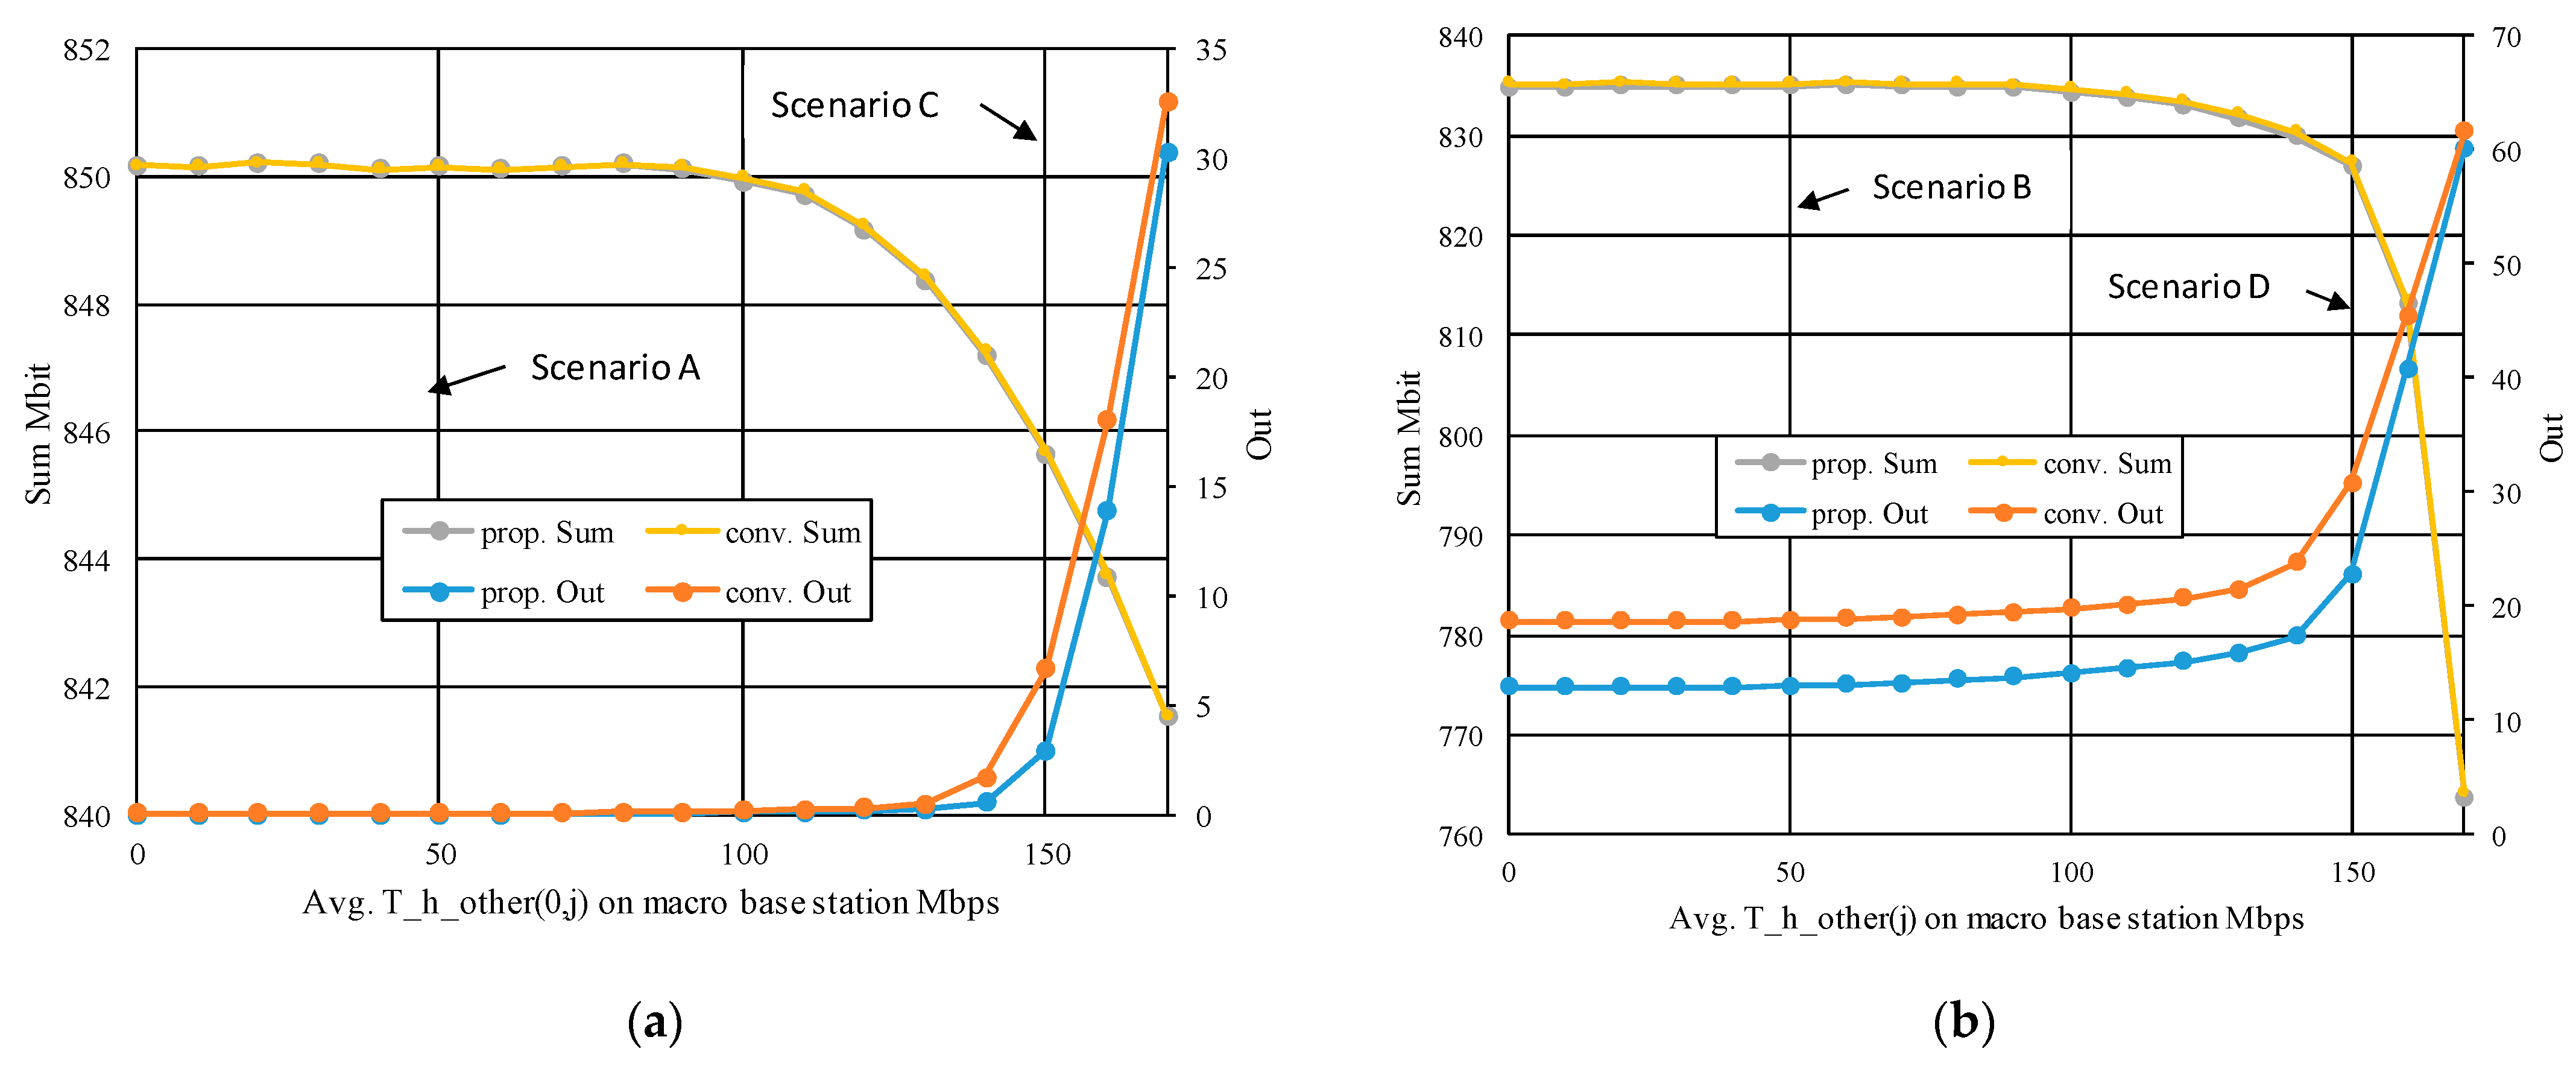
4.4. Sum and Out Characteristics

We evaluated S u m and O u t performances using the parameter T h other 1 , j ¯ = T h other 2 , j ¯ = 50 Mbps and α = 0.95 . Figure 14a shows the results where the horizontal and vertical axes represent T h other 0 , j ¯ , and S u m (left) and O u t (right), respectively. It can be confirmed that the Sum of the proposed scheme is almost the same as that of the conventional scheme. This is because only 5% of throughput is suspended in the proposed scheme. Moreover, this suspension occurs only when the vehicle is able to perceive that any of the connecting base stations will be empty after a few timesteps by using IQN, so that the suspended data can be transmitted later. Thus, the degradation of S u m is suppressed. For the O u t performance, it can be observed that the proposed scheme clearly reduces the number of O u t counts in the region of 150 Mbps to 170 Mbps of average T h other 0 , j , but there is almost no effect of reducing the congestion below 150 Mbps. This is because the small base stations are empty, and can afford to accommodate traffic. Thus, the congestion only occurs near the traffic limit of macro base station at 172.08 Mbps, as shown in Table 3, and in this situation, the proposed scheme works effectively. Thus, it is confirmed that the proposed scheme exploits IQN and reduces the congestion of the base stations.
Figure 14b shows the same S u m and O u t performances with T h other 1 , j ¯ = T h other 2 , j ¯ = 150 Mbps, which simulates the congested small base stations. It can be observed that the degradation of Sum remains small in the proposed scheme, even in the crowded scenario. This is because of the small suspension rate of 5%, and the utilization of the IQN as described in Figure 14a. In contrast, the Out performance of the proposed scheme is better than that of the conventional scheme in all regions. In this regard, the conventional scheme does not consider the congestion of base stations, whereas the proposed scheme prudently avoids congestion, and effectively improves the Out performance in crowded situations.

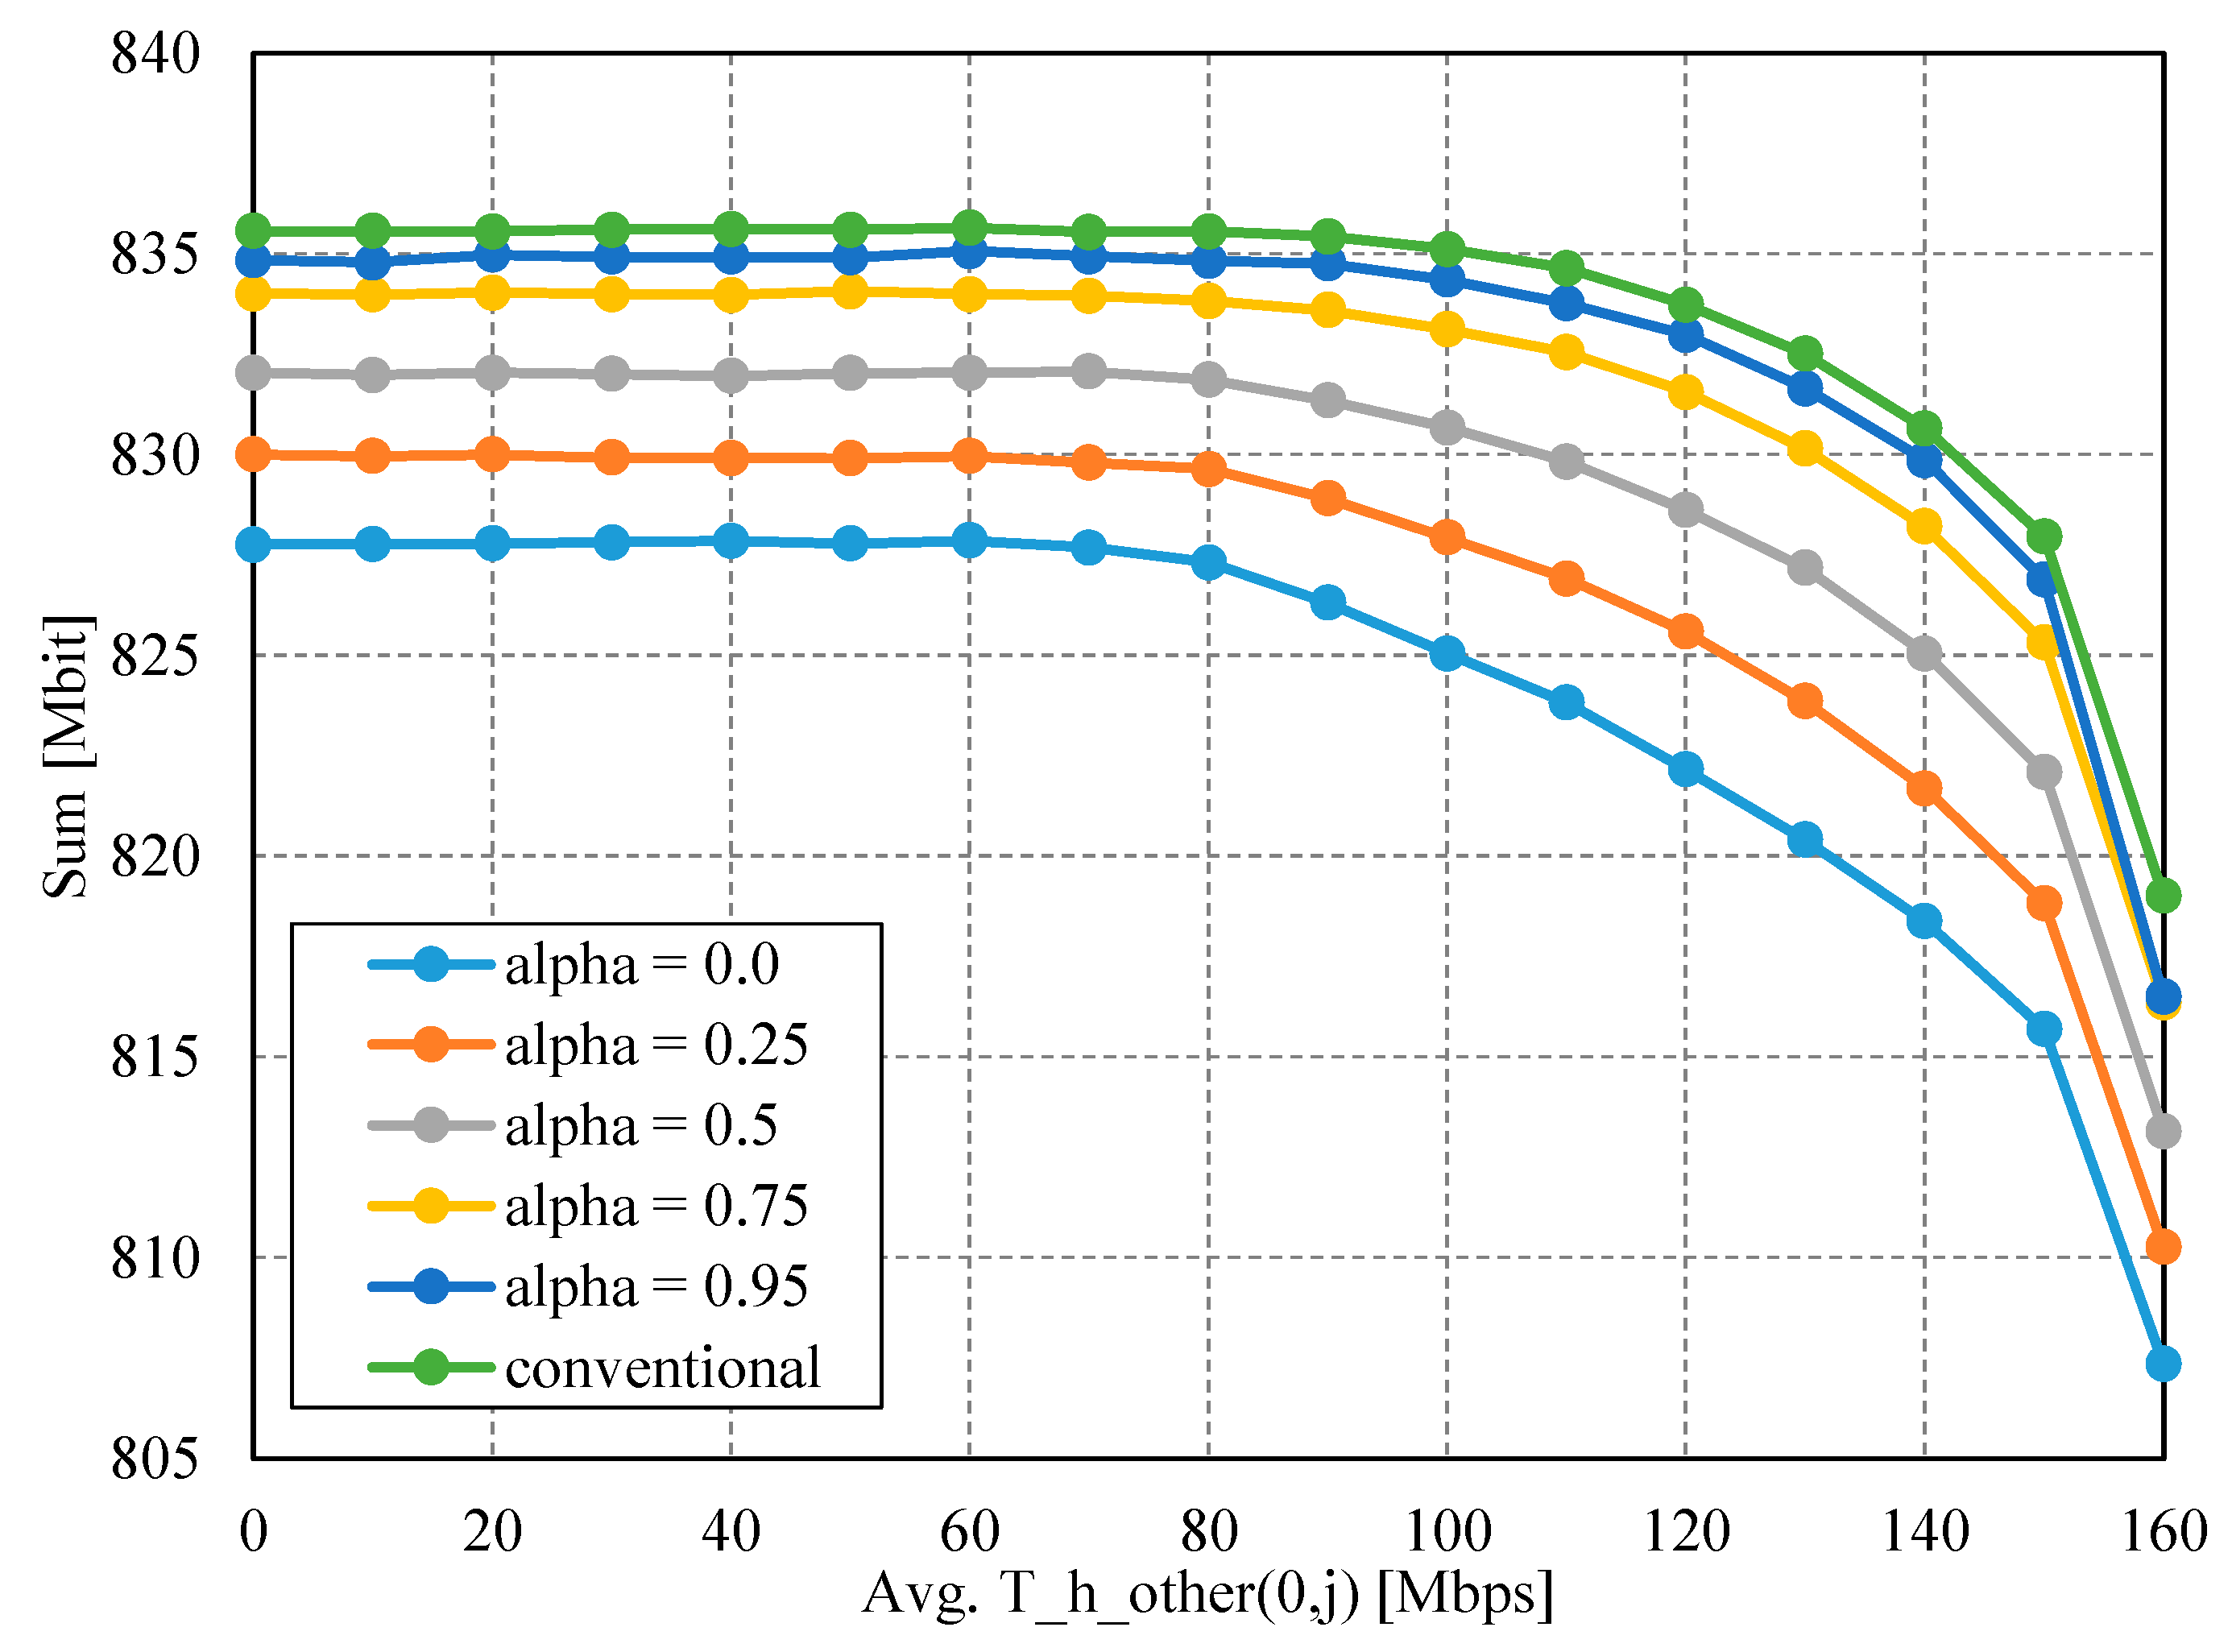
4.5. Suspending Coefficient

As described in Section 3.5, the transmission ratio α is an important coefficient to balance the throughput and congestion reduction in the proposed scheme. We evaluated S u m and O u t characteristics using parameter α .
T h other 1 , j ¯ = T h other 2 , j ¯ = 150 Mbps is assumed to simulate the congested small base stations in the same way as shown in Figure 14b. Figure 15 shows the S u m performance. When α is set to 1, the performance becomes the same as the conventional scheme because of no suspension. We change α from α = 0.0 to 0.75 with a step of 0.25 and 0.95. It can be confirmed that when α is larger, S u m also becomes lager in the proposed scheme, although all curves are lower than that of the conventional scheme. This is because when α is smaller, more data are suspended, and sometimes the accumulated bits cannot be transmitted due to an instantaneous SNR reduction or a handover. Because no suspension occurred in the conventional scheme, the best S u m performance was obtained. Figure 16 shows the O u t performances, where a better O u t is obtained with larger α . However, the performnace is slightly degraded at α = 0.95 . When α is small, the suspended data increase and B j becomes larger according to time processing. Consequently, the buffer becomes large, and the suspension condition is not satisfied in the lower part of Figure 5. Therefore, full data transmission was always selected, and the congestion could not be reduced. It was shown that α should be sufficiently large in the proposed scheme, i.e., the data suspension should not be large in the IQN-based predictive transmission. Although the optimal α may change according to T h other k ,   j and the channel model, the result of Figure 16 indicates that the optimal volume of data suspention exists with regard to the congestion reduction performance.

5. Conclusions

In this paper, we proposed an improvement scheme for uplink V2N communication based on IQN. By suspending a part of the transmitting data in a vehicle according to the QoS prediction provided by base stations via IQN, the congestion of base stations can be decreased without decreasing the summation of transmission data from the vehicle. It was clarified through numerical simulations that the proposed scheme was effective in the case of crowded multiple base stations in a heterogeneous network due to large data traffic of other vehicles.
In future studies, we will consider more complex scenarios in which the IQN does not provide a predicted throughput but rather a predicted delay time of communication, which is more important for V2X to contribute to a higher level of safe, autonomous driving.

Author Contributions

Conceptualization, R.H. and E.O.; methodology, R.H. and E.O.; software, R.H.; validation, R.H.; formal analysis, R.H. and E.O.; investigation, R.H. and E.O.; resources, R.H.; data curation, R.H.; writing—original draft preparation, R.H.; writing—review and editing, R.H. and E.O.; visualization, R.H.; supervision, E.O.; project administration, R.H. and E.O. All authors have read and agreed to the published version of the manuscript.

Funding

This research received no external funding.

Data Availability Statement

The data presented in this study are available on request from the corresponding author.

Acknowledgments

We would like to thank Hidenori Akita of DENSO CORPORATION for research collaboration and insightful comments.

Conflicts of Interest

The authors declare no conflict of interest.

References

  1. Chen, S.; Hu, J.; Shi, Y.; Peng, Y.; Fang, J.; Zhao, R.; Zhao, L. Vehicle to everything (V2X) services supported by LTE-based systems and 5G. IEEE Commun. Stand. Mag. 2017, 1, 70–76. [Google Scholar] [CrossRef]
  2. Chen, S.; Hu, J.; Shi, Y.; Zhao, L. LTE-V: A TD-LTE-Based V2X Solution for Future Vehicular Network. IEEE Internet Things J. 2016, 3, 997–1005. [Google Scholar] [CrossRef]
  3. Moto, K.; Mikami, M.; Serizawa, K.; Yoshino, H. Field Experimental Evaluation on 5G V2N Low Latency Communication for Application to Truck Platooning. In Proceedings of the 2019 IEEE 90th Vehicular Technology Conference (VTC2019-Fall), Honolulu, HI, USA, 22–25 September 2019; pp. 1–5. [Google Scholar] [CrossRef]
  4. Saeed, U.; Hämäläinen, J.; Mutafungwa, E.; Wichman, R.; González, D.; Garcia-Lozano, M. Route-based Radio Coverage Analysis of Cellular Network Deployments for V2N Communication. In Proceedings of the 2019 International Conference on Wireless and Mobile Computing, Networking and Communications (WiMob), Barcelona, Spain, 21–23 October 2019; pp. 1–6. [Google Scholar]
  5. Kim, Y.; Lee, H.Y.; Hwang, P.; Patro, R.K.; Lee, J.; Roh, W.; Cheun, K. Feasibility of Mobile Cellular Communications at Millimeter Wave Frequency. IEEE J. Sel. Top. Signal Process. 2016, 10, 589–599. [Google Scholar] [CrossRef]
  6. Cheon, Y.; Kim, Y. Millimeter-wave phased array antenna with wide beam coverage. In Proceedings of the 2016 10th European Conference on Antennas and Propagation (EuCAP), Davos, Switzerland, 10–15 April 2016; pp. 1–3. [Google Scholar]
  7. EOkamoto; Okada, H.; Ishii, Y.; Makido, S. Performance improvement of low-latency V2I uplink using superposed cooperative V2V transmission. In Proceedings of the 2017 IEEE 86th Vehicular Technology Conference (VTC-Fall), Toronto, ON, Canada, 24–27 September 2017. [Google Scholar]
  8. Ishikawa, H.; Okamoto, E.; Okada, H.; Makido, S. Performance improvement of V2I uplink transmission on far vehicles using frequency scheduling-based cooperative V2V relay transmission. In Proceedings of the 2020 IEEE 17th Annual Consumer Communications & Networking Conference (CCNC), Las Vegas, NV, USA, 10–13 January 2020. [Google Scholar]
  9. Gozalvez, J.; Sepulcre, M.; Bauza, R. IEEE 802.11p Vehicle to Infrastructure Communications in Urban Environments. IEEE Commun. Mag. 2012, 50, 176–183. [Google Scholar] [CrossRef]
  10. 3GPP. Release 16. Available online: https://www.3gpp.org/specifications-technologies/releases/release-16 (accessed on 2 February 2023).
  11. SAE International. Taxonomy and Definitions for Terms Related to Driving Automation Systems for On-Road Motor Vehicles. Available online: https://www.sae.org/standards/content/j3016_201806/ (accessed on 2 February 2023).
  12. 5GAA Working Group 2. LS Reply to 3GPP on Time-Criticality of In-Advance QoS Notification. SP-180934. October 2018. Available online: https://www.3gpp.org/ftp/tsg_sa/TSG_SA/TSGS_82/Docs/SP-180934.zip (accessed on 1 November 2022).
  13. 5GAA. Making 5G Proactive and Predictive for the Automotive Industry. White Paper. 2019, pp. 1–26. Available online: https://5gaa.org/5gaa-releases-white-paper-on-making-5g-proactive-and-predictive-for-the-automotive-industry/ (accessed on 1 November 2022).
  14. 3GPP TR 21.914 V14.0.0. Summary of Rel-14 Work Items. May 2018. Available online: https://www.scirp.org/(S(351jmbntvnsjt1aadkozje))/reference/referencespapers.aspx?referenceid=3130168 (accessed on 1 November 2022).
  15. Higuchi, K.; Benjebbour, A. Non-orthogonal Multiple Access (NOMA) with Successive Interference Cancellation for Future Radio Access. IEICE Trans. Commun. 2015, 98, 403–414. [Google Scholar] [CrossRef]
  16. 3GPP TS22.186 V16.2.0. Enhancement of 3GPP support for V2X scenarios; Stage 1. June 2019. Available online: https://www.etsi.org/deliver/etsi_ts/122100_122199/122186/15.03.00_60/ts_122186v150300p.pdf (accessed on 1 November 2022).
  17. 3GPP. Release 15. Available online: https://www.3gpp.org/specifications-technologies/releases/release-15 (accessed on 2 February 2023).
  18. Jiang, C.; Zhang, H.; Ren, Y.; Han, Z.; Chen, K.-C.; Hanzo, L. Machine Learning Paradigms for Next-Generation Wireless Networks. IEEE Wirel. Commun. 2016, 24, 98–105. [Google Scholar] [CrossRef]
  19. Morocho-Cayamcela, M.E.; Lee, H.; Lim, W. Machine Learning for 5G/B5G Mobile and Wireless Communications: Potential, Limitations, and Future Directions. IEEE Access 2019, 7, 137184–137206. [Google Scholar] [CrossRef]
  20. ETSI TS 102 687 V1.2.1. Intelligent Transport Systems (ITS); Decentralized Congestion Control Mechanisms for Intelligent Transport Systems Operating in the 5 GHz Range; Access Layer Part. 2018. Available online: https://www.google.com/url?sa=t&rct=j&q=&esrc=s&source=web&cd=&cad=rja&uact=8&ved=2ahUKEwjkutuI5IL9AhWRF4gKHXYyCWwQFnoECBEQAQ&url=https%3A%2F%2Fwww.etsi.org%2Fdeliver%2Fetsi_ts%2F102600_102699%2F102687%2F01.02.01_60%2Fts_102687v010201p.pdf&usg=AOvVaw3Zgzja225d_txXc0CM-bgW (accessed on 1 November 2022).
  21. ETSI TS 103 574 V1.1.1. Intelligent Transport Systems (ITS); Congestion Control Mechanisms for the C-V2X PC5 Interface; Access Layer Part. Nov. 2018. Available online: https://www.google.com/url?sa=t&rct=j&q=&esrc=s&source=web&cd=&cad=rja&uact=8&ved=2ahUKEwjxmO_b44L9AhXbQN4KHbxiCWUQFnoECBwQAQ&url=https%3A%2F%2Fwww.etsi.org%2Fdeliver%2Fetsi_ts%2F103500_103599%2F103574%2F01.01.01_60%2Fts_103574v010101p.pdf&usg=AOvVaw0MXq8V0smpV3VF21XG9QTM (accessed on 1 November 2022).
  22. Bazzi, A. Congestion Control Mechanisms in IEEE 802.11p and Sidelink C-V2X. In Proceedings of the 2019 53rd Asilomar Conference on Signals, Systems, and Computers, Pacific Grove, CA, USA, 3–6 November 2019. [Google Scholar]
  23. Mansouri, A.; Martinez, V.; Harri, J. A first investigation of congestion control for LTE-V2X mode 4. In Proceedings of the IEEE Wireless On-demand Network systems and Services Conference (WONS), Wengen, Switzerland, 22–24 January 2019; pp. 56–63. [Google Scholar]
  24. Kang, A.; Jung, S.; Bahk, S. Sensing-Based Power Adaptation for Cellular V2X Mode 4. In Proceedings of the IEEE International Symposium on Dynamic Spectrum Access Networks (DySPAN), Seoul, Republic of Korea, 22–25 October 2018; pp. 1–4. [Google Scholar]
  25. Haider, A.; Hwang, S.-H. Adaptive Transmit Power Control Algorithm for Sensing-Based Semi-Persistent Scheduling in C-V2X Mode 4 Communication. Electronics 2019, 8, 846. [Google Scholar] [CrossRef]
  26. Sepulcre, M.; Gozalvez, J.; Lucas-Estan, M.C. Power and Packet Rate Control for Vehicular Networks in Multi-Application Scenarios. IEEE Trans. Veh. Technol. 2019, 68, 9029–9037. [Google Scholar] [CrossRef] [Green Version]
  27. Di, B.; Song, L.; Li, Y.; Han, Z. V2X Meets NOMA: Non-Orthogonal Multiple Access for 5G-Enabled Vehicular Networks. IEEE Wirel. Commun. 2017, 24, 14–21. [Google Scholar] [CrossRef]
  28. Kafi, M.A.; Djenouri, D.; Ben-Othman, J.; Badache, N. Congestion Control Protocols in Wireless Sensor Networks: A Survey. IEEE Commun. Surv. Tutor. 2014, 16, 1369–1390. [Google Scholar] [CrossRef]
  29. Wang, C.; Li, B.; Sohraby, K.; Daneshmand, M.; Hu, Y. Upstream congestion control in wireless sensor networks through cross-layer optimization. IEEE J. Sel. Areas Commun. 2007, 25, 786–795. [Google Scholar] [CrossRef]
  30. Ziouva, A.; Antonakopoulos, T. CSMA/CA performance under high traffic conditions: Throughput and delay analysis. Comput. Commun. 2022, 25, 313–321. [Google Scholar] [CrossRef]
  31. Pratt, W.A., Jr.; Nixon, M.J.; Rotvold, E.D.; Pramanik, R.S.; Lennvall, T.P. Suspending transmissions in a wireless network. U.S. Patent 8,169,974 B2, 1 May 2012. [Google Scholar]
  32. Bacci, G.; Lasaulce, S.; Saad, W.; Sanguinetti, L. Game Theory for Networks: A tutorial on game-theoretic tools for emerging signal processing applications. IEEE Signal Process. Mag. 2015, 33, 94–119. [Google Scholar] [CrossRef]
  33. Navarro-Ortiz, J.; Romero-Diaz, P.; Sendra, S.; Ameigeiras, P.; Ramos-Munoz, J.J.; Lopez-Soler, J.M. A Survey on 5G Usage Scenarios and Traffic Models. IEEE Commun. Surv. Tutorials 2020, 22, 905–929. [Google Scholar] [CrossRef]
  34. Benjebbour, A.; Kitao, K.; Kakishima, Y.; Na, C. 3GPP defined 5G requirements and evaluation conditions. NTT Docomo Tech. J. 2018, 19, 13–23. [Google Scholar]
  35. Esswie, A.A.; Pedersen, K.I. Null Space Based Preemptive Scheduling for Joint URLLC and eMBB Traffic in 5G Networks. IEEE Globecom Workshops 2018, 1–6. [Google Scholar] [CrossRef]
  36. Li, W.; Ma, X.; Wu, J.; Trivedi, K.S.; Huang, X.-L.; Liu, Q. Analytical Model and Performance Evaluation of Long-Term Evolution for Vehicle Safety Services. IEEE Trans. Veh. Technol. 2016, 66, 1926–1939. [Google Scholar] [CrossRef]
  37. RHogg, V.; Tanis, E.A.; Zimmerman, D.L. Probability and Statistical Inference; Macmillan: New York, NY, USA, 1977. [Google Scholar]
  38. Sagkriotis, S.E.; Panagopoulos, A.D. Optimal FFR Policies: Maximization of Traffic Capacity and Minimization of Base Station’s Power Consumption. IEEE Wirel. Commun. Lett. 2015, 5, 40–43. [Google Scholar] [CrossRef]
  39. 3GPP TS 38.211. 5G; NR; Physical Channels and Modulation. Ver 15.10.0, December 2021. Available online: https://www.3gpp.org/dynareport/38211.htm (accessed on 1 November 2022).
  40. Sasaki, K.; Suzuki, N.; Makido, S.; Nakao, A. Vehicle control system coordinated between cloud and mobile edge computing. In Proceedings of the 2016 55th Annual Conference of the Society of Instrument and Control Engineers of Japan (SICE), Tsukuba, Japan, 20–23 September 2016; pp. 1122–1127. [Google Scholar]
  41. 3GPP TS 38.214. 5G; NR: Physical Layer Procedures for Data. Ver 15.16.0, March 2022. Available online: https://www.3gpp.org/dynareport/38214.htm (accessed on 1 November 2022).
Figure 1. Outline of proposed system; (a) system model, (b) overview of proposed algorithm.
Vehicles 05 00012 g001
Figure 2. Overview of proposed algorithm with main parameters.
Vehicles 05 00012 g002
Figure 3. Relationship between received and predicted IQNs.
Vehicles 05 00012 g003
Figure 4. Transmission flowchart of vehicle.
Vehicles 05 00012 g004
Figure 5. Proposed throughput decision flowchart at vehicle.
Vehicles 05 00012 g005
Figure 6. Conventional throughput decision flowchart at vehicle.
Vehicles 05 00012 g006
Figure 7. Simulation scenario.
Vehicles 05 00012 g007
Figure 8. Average uplink SNR of each base station.
Vehicles 05 00012 g008
Figure 9. Connection rate of each base station in this scenario.
Vehicles 05 00012 g009
Figure 10. T h _ MCS S N R performance versus uplink SNR.
Vehicles 05 00012 g010
Figure 11. T h _ MCS throughput of each base station.
Vehicles 05 00012 g011
Figure 12. Throughput characteristics; (a) Scenario A. (b) Scenario B, (c) enlarged view of Scenario B.
Vehicles 05 00012 g012
Figure 13. Throughput characteristics; (a) Scenario C, (b) enlarged view of Scenario C, (c) Scenario D.
Vehicles 05 00012 g013
Figure 14. S u m (left) and O u t (right) performances; (a) with empty small base stations, (b) with crowded small base stations.
Vehicles 05 00012 g014
Figure 15. S u m characteristics versus T h other 0 , j ¯ with parameter of α .
Vehicles 05 00012 g015
Figure 16. O u t characteristics versus T h other 0 , j ¯ with parameter of α .
Vehicles 05 00012 g016
Table 1. Configurations of wireless transmission based on 5G.
Channel ModelTapped Delay Line-C [39]
Subcarrier spacing kHz30
Number of resource blocks133
Waveform [39]Cyclic prefix-OFDM
Channel estimationPerfect
Error correction codeLow-density parity check code
Number of transmitter/receiver antennas(1.1)
Moving speed km / h 60
Maximum modulation order6
Number of simulation iterations100,000
Table 2. Link budget of V2N uplink.
Transmitter
Equivalent isotropically radiated powerdBm18.6
Propagation channel
Base station model-MacroSmall
Path loss model [39]-UMaUMi
Carrier frequencyGHz2.03.7
Receiver
Rx antenna heightm2510
Rx antenna gaindBi55
Noise figuredB44
N0dBm/Hz−169−169
BandwidthMHz5050
Table 3. Simulation parameters of IQN and data traffic.
Time resolution t Res s1
Simulation time N s60
IQN available time lag b s5
IQN receiving intervals5
Data generation ratio of high priority λ High Mbps15
Data generation ratio of low priority λ Low Mbps 8 × 10 3
Base station capability T h _ Max Mbps172.08
Modulation and coding scheme (MCS) tableN/A[39]
Suspending coefficient α N/A0.95
Table 4. Simulation conditions of other user throughputs.
Scenario T h other 0 , j ¯ T h other 1 , j ¯ T h other 2 , j ¯
A505050
B50150150
C1505050
D150150150
Disclaimer/Publisher’s Note: The statements, opinions and data contained in all publications are solely those of the individual author(s) and contributor(s) and not of MDPI and/or the editor(s). MDPI and/or the editor(s) disclaim responsibility for any injury to people or property resulting from any ideas, methods, instructions or products referred to in the content.

