Article

Idle-Free Campaign Survey Results and Idling Reductions in an Elementary School

1
Department of Atmospheric Sciences, University of Utah, Salt Lake City, UT 84112, USA
2
Division of Pulmonary Medicine, School of Medicine, University of Utah, Salt Lake City, UT 84132, USA
3
Department of City & Metropolitan Planning, University of Utah, Salt Lake City, UT 84112, USA
4
NEXUS Institute, University of Utah, Salt Lake City, UT 84112, USA
5
Public Health Program, School of Nursing and Health Sciences, Westminster College, 1840 S 1300 E, Salt Lake City, UT 84105, USA
6
Department of Life, Earth and Environmental Sciences, West Texas A&M University, Natural Sciences Building 324, Canyon, TX 79016, USA
*
Author to whom correspondence should be addressed.
Vehicles 2022, 4(3), 865-902; https://doi.org/10.3390/vehicles4030048
Submission received: 16 August 2022 / Revised: 26 August 2022 / Accepted: 2 September 2022 / Published: 7 September 2022

Abstract

:
Air pollution near schools is particularly problematic. Pollution emissions from vehicle idling at or around schools may have significant effects on children’s health including increased rates of asthma and childhood leukemia. Outdoor pollution emissions from idling vehicles can also infiltrate into the schools resulting in health hazards both in school drop-off zones as well as inside nearby buildings. An Idle-Free Campaign was enacted at an elementary school to reduce idling among parents dropping off and picking up students. The campaign involved a focus group, surveys, informational events and materials, and vehicle counting efforts before and after the campaign. The surveys found that regardless of gender or level of education, parents were very concerned about air pollution concerns associated with idling and were willing to take steps to reduce their children’s exposure. Furthermore, the vehicle counting efforts showed a 17% reduction in idling vehicles and a 37% reduction in idling time following the anti-idling campaign. These findings show that a multi-pronged approach involving parents, teachers, staff, bus drivers, and delivery truck drivers, may be an effective tool to reduce idling at schools thus reducing children’s exposure.

1. Introduction

1.1. Air Pollution and Health

The term “air pollution” refers to the presence of gas or aerosol substances in the atmosphere that accumulate sufficiently to impact human health or ecosystem health [1]. These may be the result of human activities (including agriculture, industry, and transportation) or natural events (including wildfires) [2]. For ambient air pollution monitoring, the United States Environmental Protection Agency (EPA) focuses primarily on six key “criteria” air pollutants: carbon monoxide, lead, nitrogen dioxide, ozone, particulate matter, and sulfur dioxide [3]. These pollutants are common to all of the United States (U.S.) and are hazardous to human health and the environment [3].
According to a report from the World Health Organization (WHO), on a global scale, air pollution is increasingly prevalent [4]. Today, a mere 9% of all people live in areas where the WHO air quality guidelines are met [5]. In the U.S., air quality has improved over the past decades [6]. According to the EPA, the total emissions of the criteria air pollutants have fallen by 73% [6]. Additionally, the number of unhealthy air quality days (by the EPA’s Air Quality Index [AQI]) has also been dropping [7]. In 2000, there were 2076 days, while in 2017, there were only 729 [6]. According to the EPA, the four main sources of air pollution are stationary sources, mobile sources, fires, and biogenics [6]. Transportation, covered under mobile sources, is one of the greatest sources of air pollution, particularly in urban areas [8]. In Organisation for Economic Co-operation and Development (OECD) countries, for example, transportation is responsible for half of all particulate matter emissions [8]. In the U.S., 55% of nitrogen oxide emissions are due to transportation [9]. Overall, the transportation sector contributes to emissions for each of the criteria air pollutants [10,11,12,13,14,15].
Despite the overall decreases in air pollution levels observed across the U.S., emerging research continues to link numerous health effects to indoor and outdoor air pollution [16,17,18,19]. Air pollution near schools is particularly problematic and an important research focus area in recent years. Increased levels of air pollutants have been found to occur during drop-off and pick-up times at schools and, vehicle idling at or around schools can have significant effects on children’s health [20,21]. Children are particularly susceptible to the effects of air pollution, largely because their lungs are still developing [22]. Links between exposure to air pollution and childhood obesity [23,24], increased susceptibility to acute lower respiratory infections [25], otitis media [26], neurodevelopment [27], and childhood leukemia [28] have been observed.

1.2. Previous Idle-Free Efforts

Vehicle idling is a substantial air pollution concern that can worsen air quality near schools [29,30]. Many different strategies have been employed to combat pollution emissions resulting from vehicle idling at schools. The EPA, for example, has launched the Clean School Bus Idle Reduction Campaign which discourages school buses from idling unnecessarily [31]. Cutting bus idling not only improves air quality near schools but can also save school districts money in fuel costs [31]. Air pollution has also been discouraged legally. Salt Lake City (SLC) has an idle-free ordinance banning unnecessary idling in a vehicle for more than two minutes [32,33].
Eghbalnia, et al. [34], implemented an anti-idling campaign aimed to increase education on the negative health effects of idling with the goal of decreasing idling time for school buses and other vehicles during drop-off and pick-up times at four Cincinnati schools. Their results showed the anti-idling campaign was effective in increasing awareness of both mitigation strategies.
Researchers in Perth, Australia, created a 4-week anti-idling campaign with the goal of reducing vehicle idling and objectively decreasing air pollutants in 10 primary schools in the area [35]. This study found that 8 out of the 10 intervention schools had decreased particulate matter and driver idling behavior during pick-up and drop-off times after the 4-week anti-idling campaign.
The Simcoe Muskoka District Health Unit designed an anti-idling pilot program targeting specific communities and elementary schools over an 8-month period [36]. Their program aim was to decrease the incidence of vehicle idling at these targeted schools and to quantify the program success by comparing schools that participated in the study to “control schools” that did not participate. The anti-idling campaign included assemblies, an air quality banner contest, classroom activities, anti-idling information shared with the school community, and a driver contact event. In the District of Muskoka, the intervention school showed an 8% decrease in idling incidence after the anti-idling campaign compared to a 10% increase in idling incidence in the control school. In Simcoe County, the study found a 32% decrease in idling incidence after the anti-idling campaign and a 13% decrease in the control school. Overall, the study found the anti-idling campaign was successful in decreasing idling incidence in school communities.
To reduce air pollution at schools, the EPA created the Idle-Free Schools Toolkit for a Healthy School Environment which offers guidelines for running idling reduction campaigns [37]. The toolkit suggests that idle-reduction campaigns follow a typical school year, beginning in September and ending in April [37]. It is recommended that campaigns begin with preliminary observations followed by the distribution of informational materials on idling reduction and driver contact events [37]. Finally, the campaign should be evaluated for its effectiveness [37].

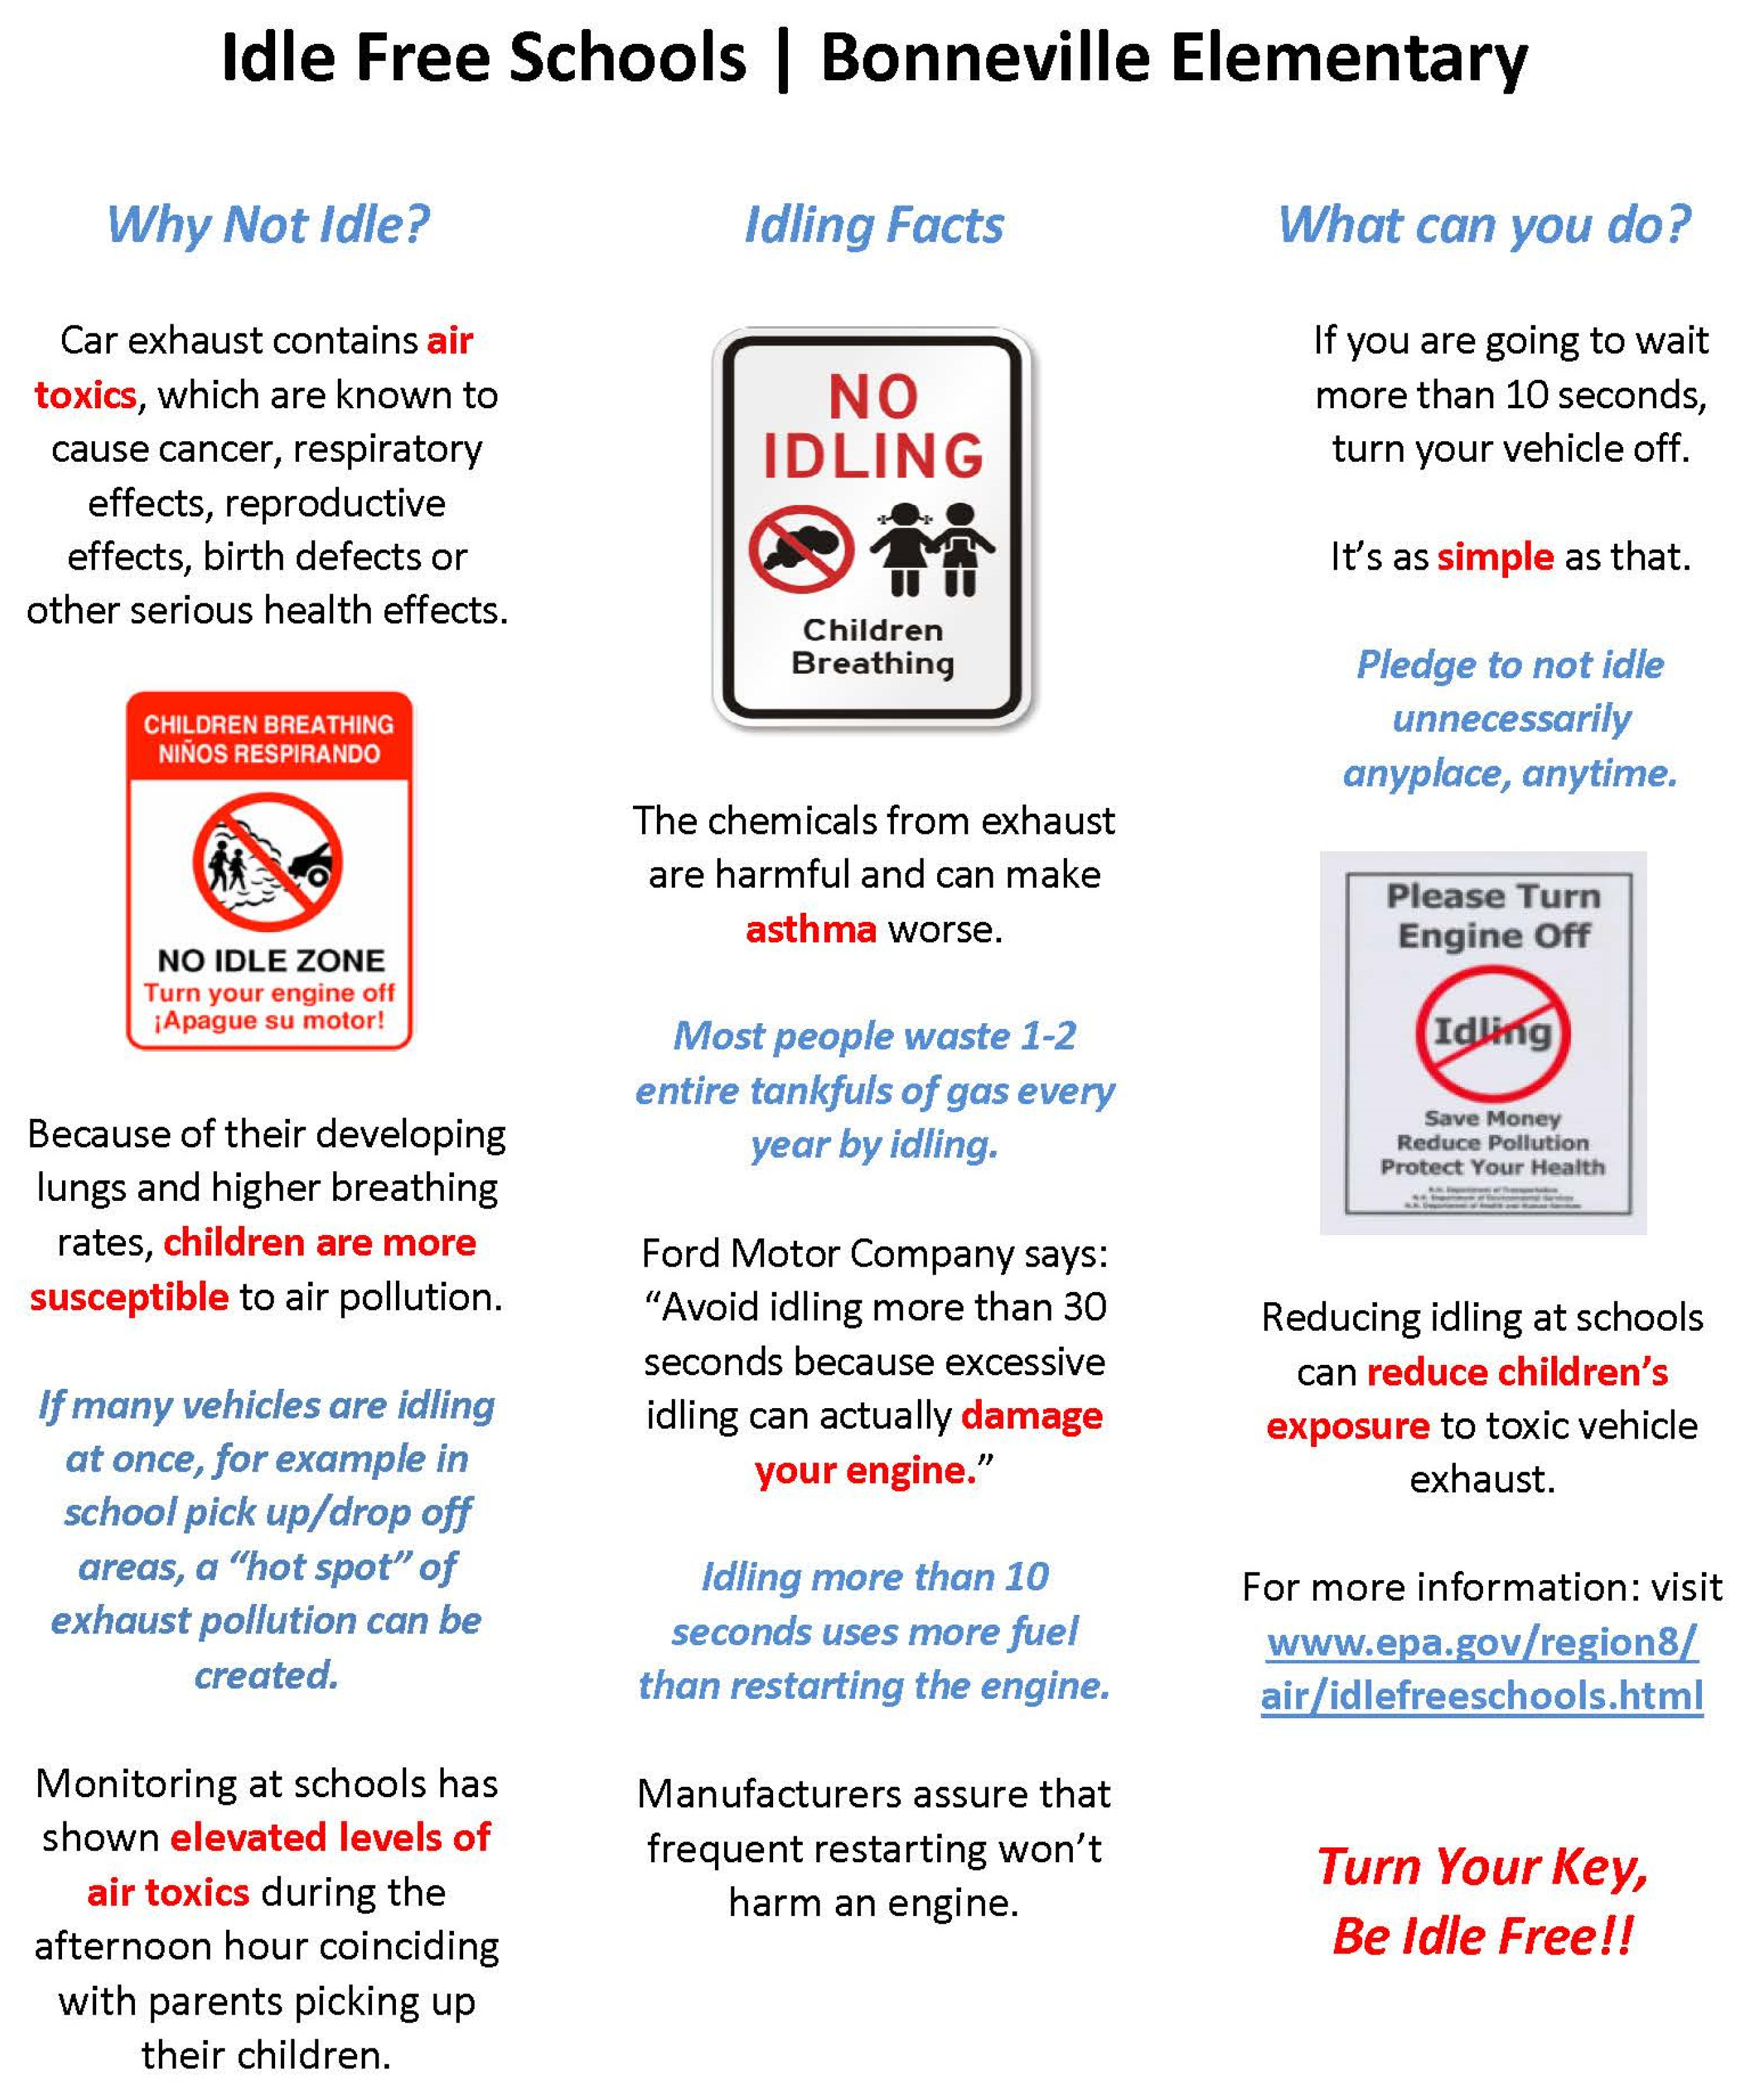
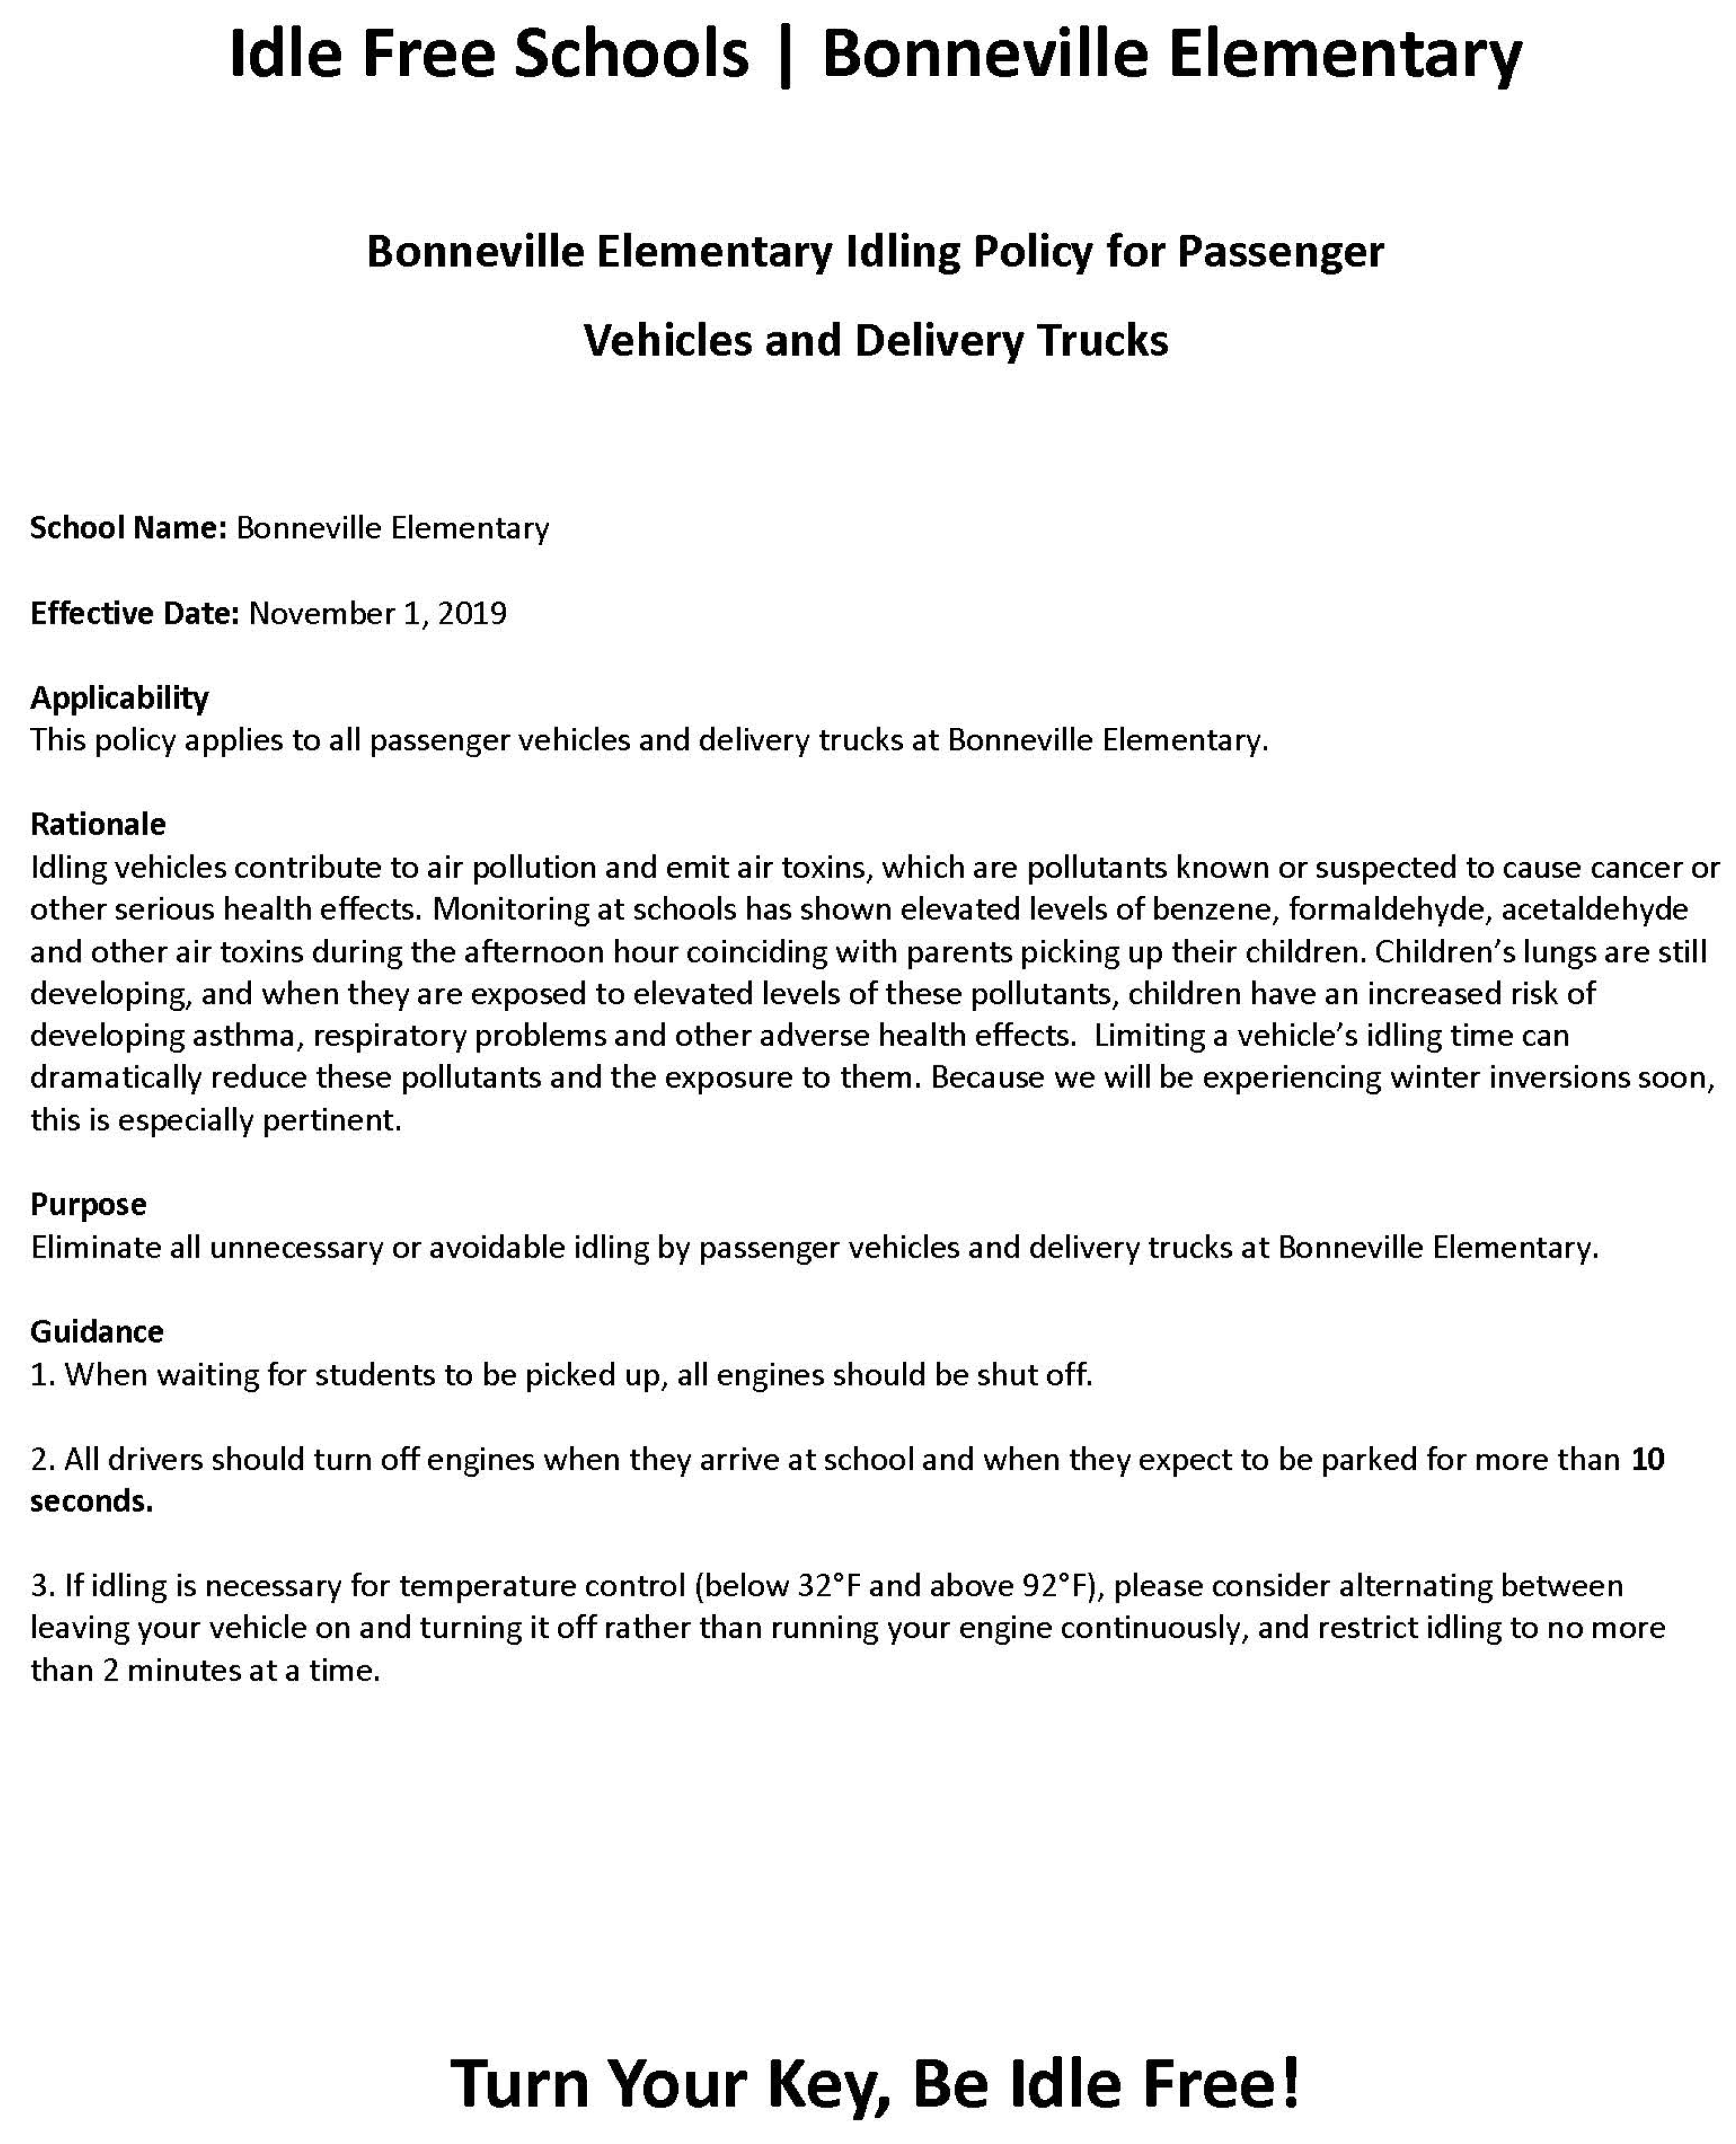
1.3. Bonneville Elementary School Idle-Free Campaign

In the 2018–2019 academic year, the chair of the Clean Air Committee (CAC) at Bonneville Elementary School, a school in the Salt Lake City School District (SLCSD), expressed interest in utilizing the EPA’s Idle-Free Schools Toolkit for a Healthy School Environment the following school year (2019–2020) to reduce idling at drop-off and pick-up times. The CAC chair was also interested in partnering with Westminster College to conduct research and assist with the campaign. The goals of this study were to evaluate how parents perceive idling, and by extension, air pollution and the effectiveness of idle-reduction campaigns in schools. To reach these goals, a focus group and community survey were implemented and evaluated alongside an idle-free campaign supported by indoor and outdoor air pollutant measurements by The University of Utah Department of Atmospheric Sciences and Salt Lake County Health Department Air Quality Bureau. The EPA’s Idle-Free Schools Toolkit for a Healthy School Environment was used as a basis for the idle-free campaign and modified based on the focus group and survey given to the Bonneville Elementary School community. This research study was approved by the Bonneville Elementary School Parent Teacher Association (PTA) and CAC after incorporating feedback from both. The use of air pollution measuring devices was also approved by Salt Lake City School District [38].

2. Materials and Methods
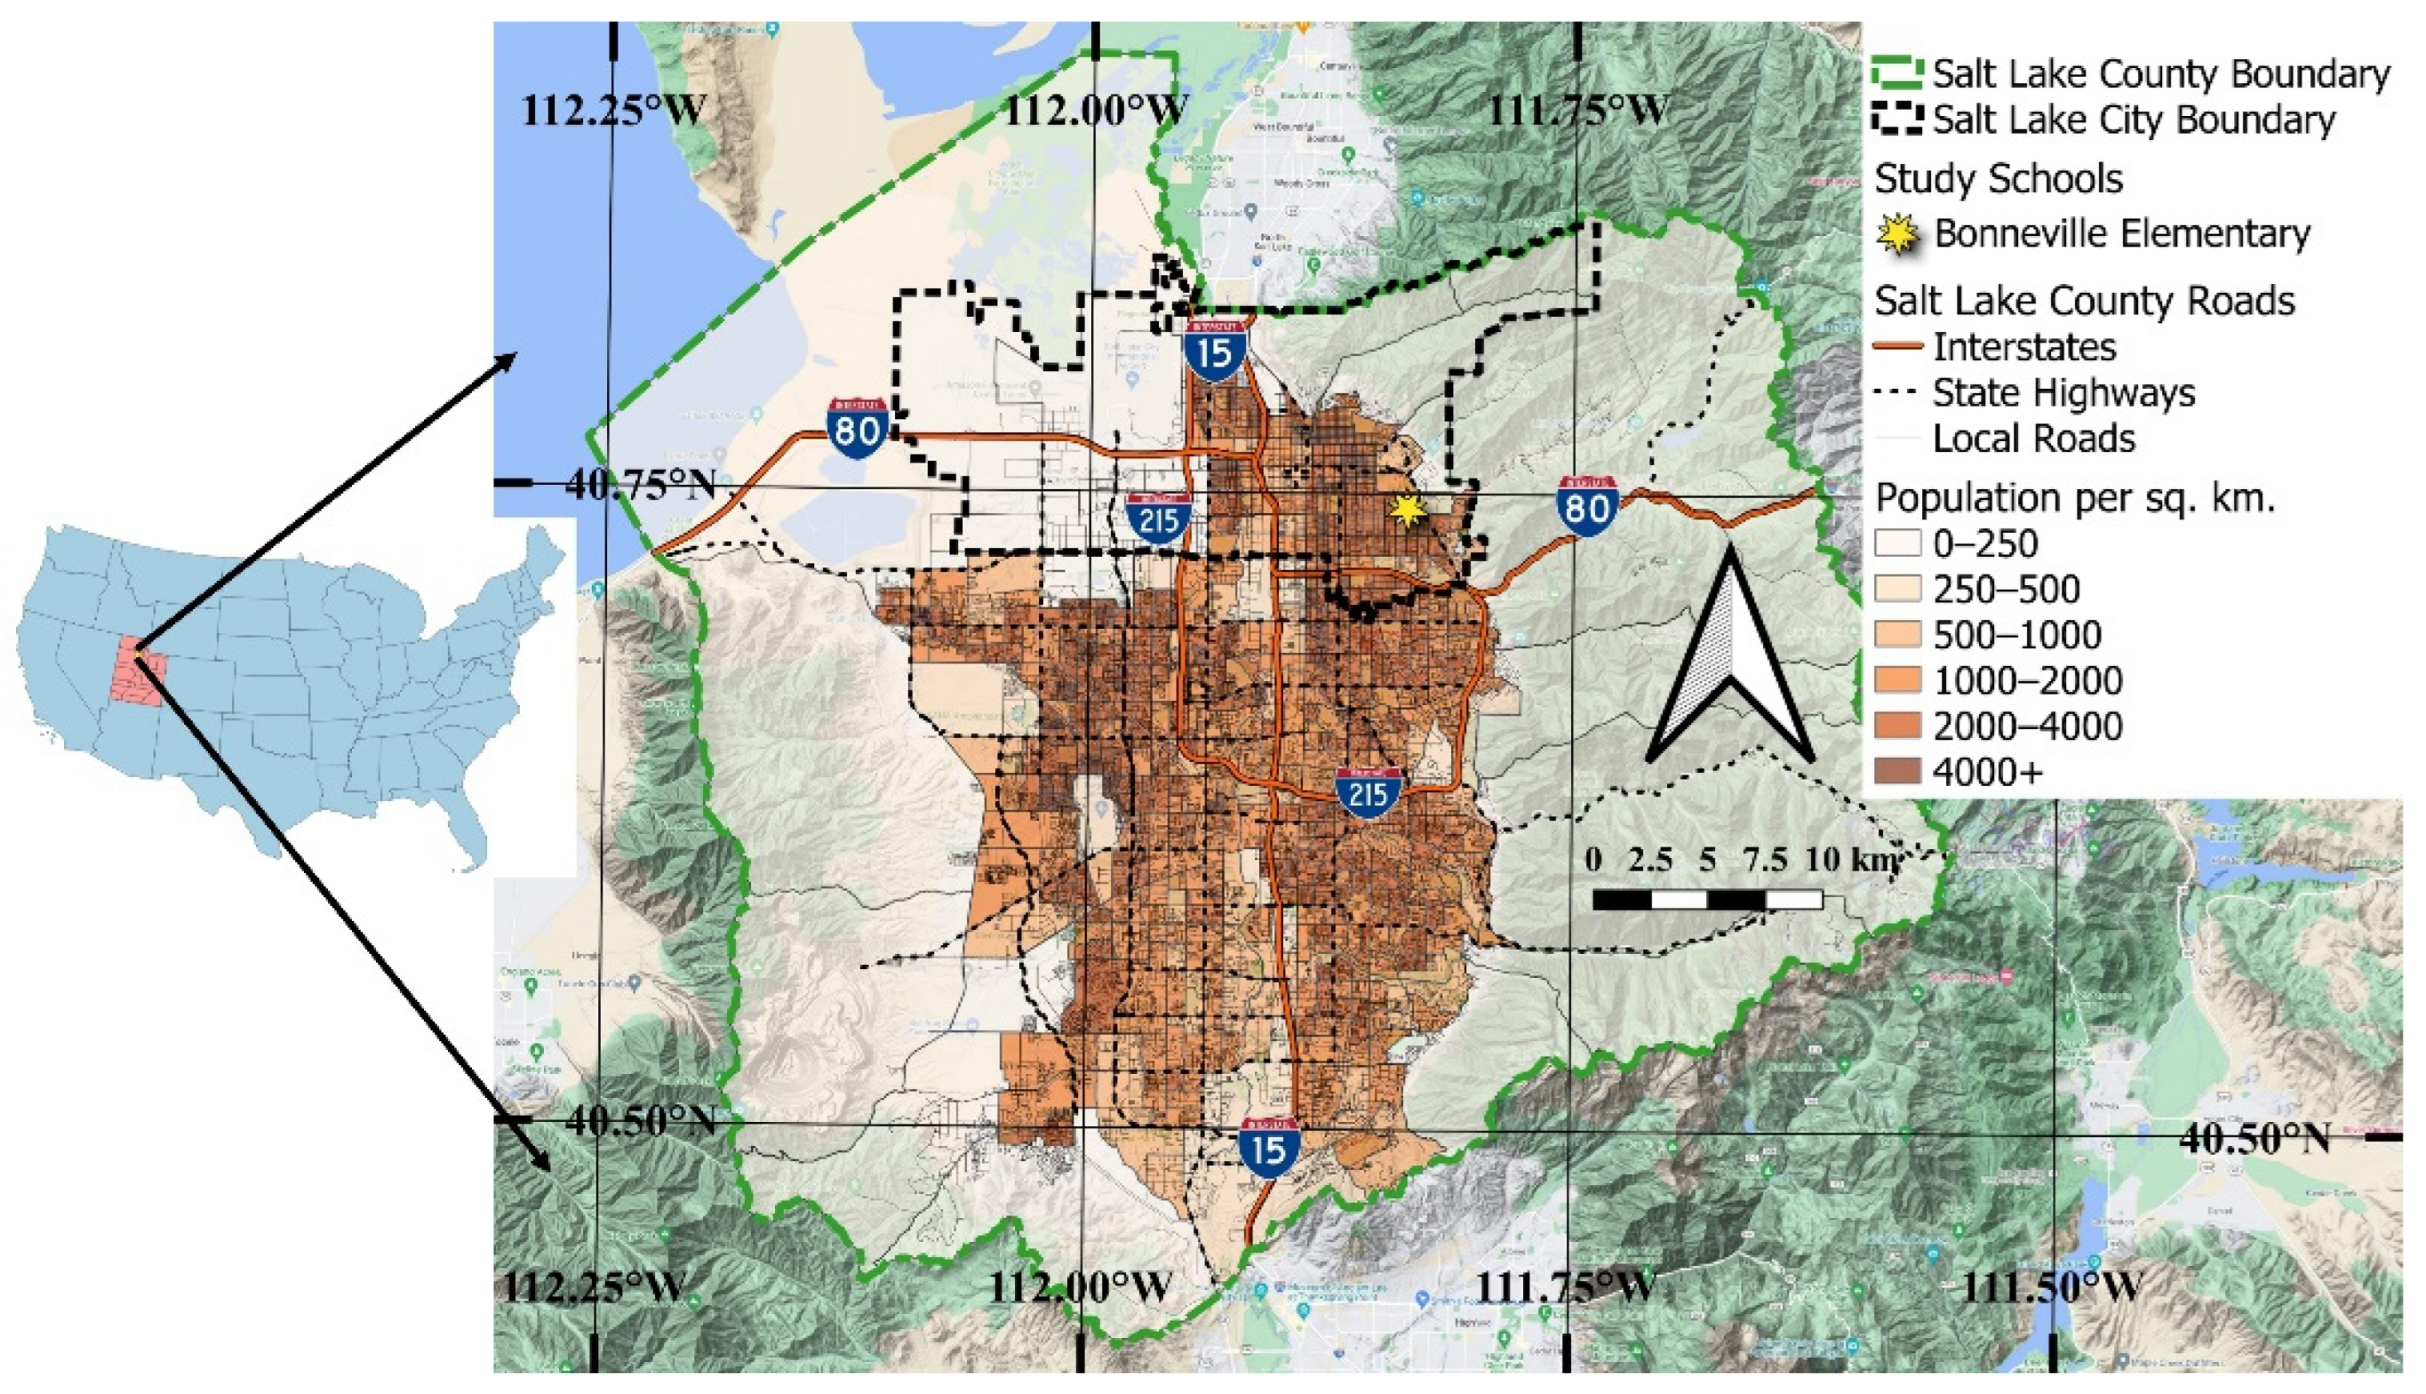
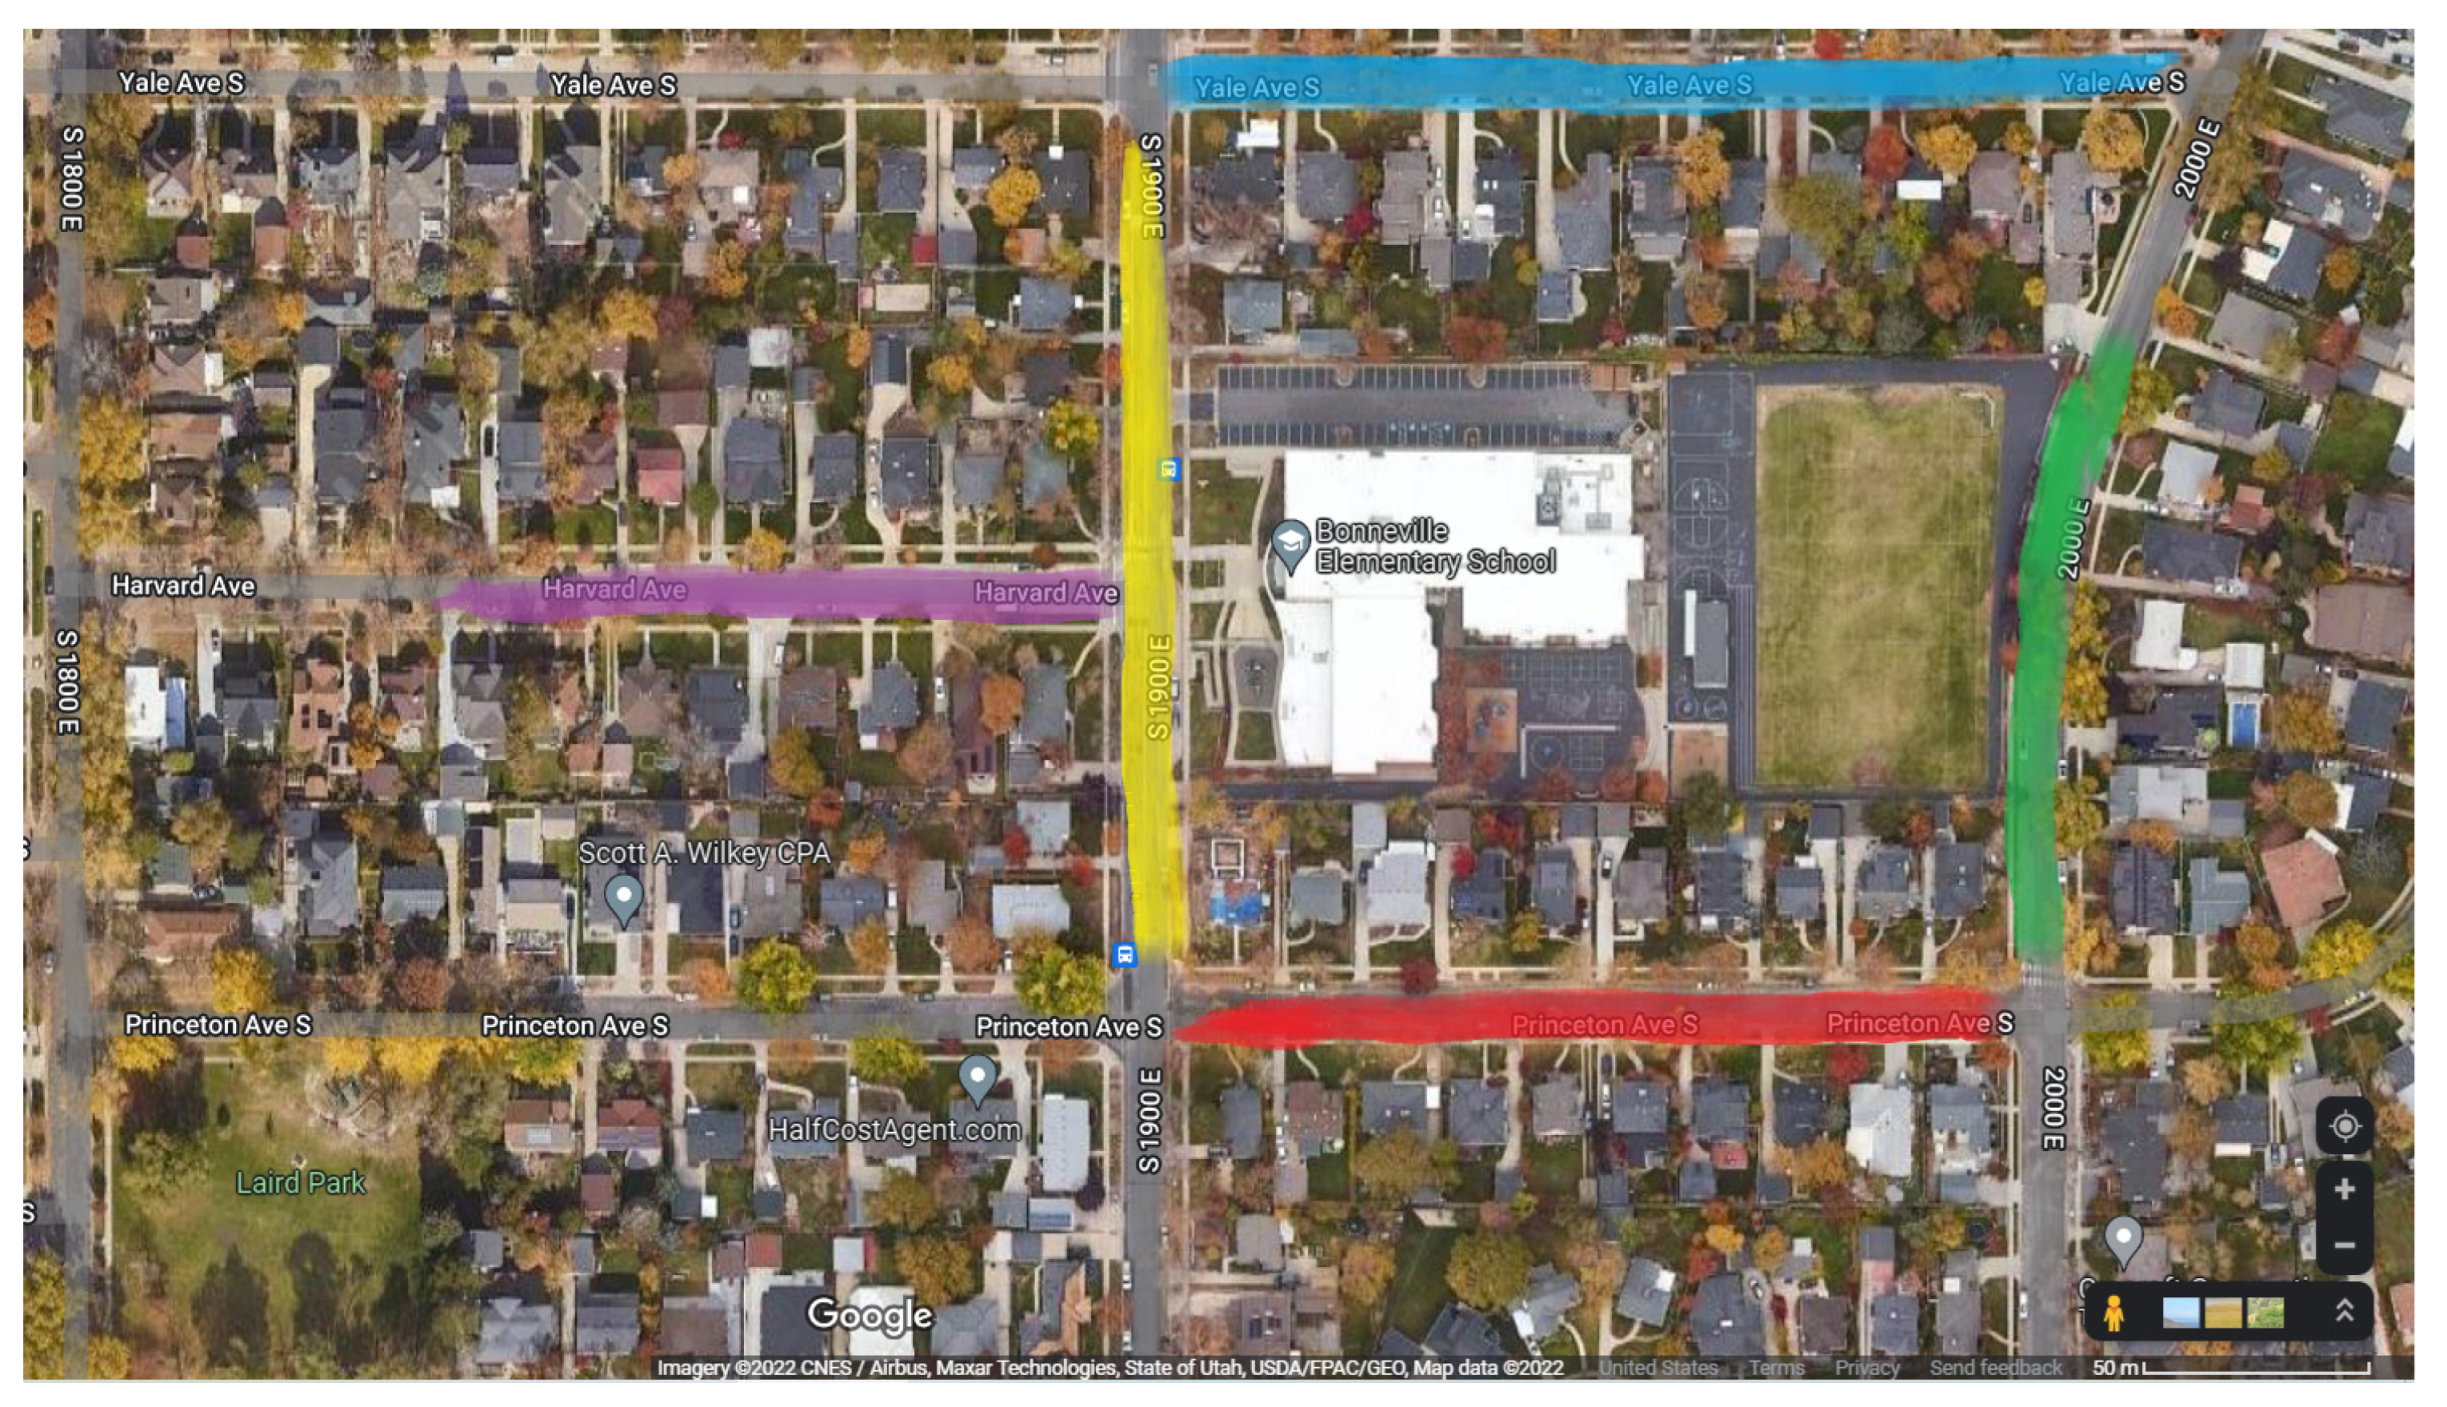
2.1. Study Site

Utah is a state in the rapidly growing American West region of the United States. The complex topography of Utah’s urban valleys, along with its high elevation, increasing population, and associated emissions, causes multiple air quality concerns. In 2021, the American Lung Association ranked SLC as the 12th most polluted city nationwide for ozone pollution and the 17th most polluted city in the U.S. for short-term particulate pollution [39]. Bonneville Elementary School is located in the eastern part of SLC (40.74417 N, −111.83618 W [40], Elevation 1420 MASL [41]).
SLC (Figure 1) is located at the intersection of two major interstate highways (I-80 and I-15) with large industrial facilities collocated with these major traffic corridors. Traffic density and congestion in Salt Lake County (SLCo) have increased by nearly 10% annually between 2010 and 2020 [42,43]. Although the introduction of lower-emitting Tier 3 light-duty vehicles and accompanying fuels has reduced emissions from the traffic sector, increased traffic volume and density is negating a portion of these benefits. Additionally, ambient outdoor air quality in SLCo suffers from both transported and local production of pollution associated with distant and regional wildfires and dust storms, including dust with hazardous metals from the exposed bed of the shrinking Great Salt Lake [44]. The topography surrounding SLCo, which includes three mountain ranges (Wasatch, Oquirrh, and Traverse) and the Great Salt Lake, traps pollutants during the winter months [45,46,47]. Consequently, the summer and winter months are the worst seasons of the year for air quality in SLCo, marked by elevated ozone [48] and PM2.5 [49,50], respectively, which affect indoor air quality as well [51].

2.2. Focus Group

The goal of the focus group was to access the beliefs, perceptions, and values parents held on vehicle idling, air pollution, and their children’s health as well as a future idle-free campaign. Parents of Bonneville Elementary School students were invited to participate in a 1 h focus group on 8 April 2019. The focus group information was emailed to the school community by the school principal. The email read: “We want your opinion on vehicle idling at Bonneville Elementary! If you’re interested in attending a focus group on 8 April at 7:00 p.m. to discuss air quality and children’s health, please email [contact] at [contact’s email]. Light refreshments will be served.” Since there were not enough participants signed up for the 8 April date, it was pushed back to 22 April (Earth Day). A consent form and script for the focus group were also included. All four participants of the focus group signed the consent form. Information from the focus group was recorded using two cell phones and one note-taker, while an additional person took notes on an easel for the participants to see. All notes and recordings were stored using password protection. Participants were asked not to provide any identifying information during the recording. All questions asked in the focus group were created with the CAC and approved by the PTA and principal. Themes were generated from the focus group using Microsoft Excel [52]. Language barrier considerations were addressed, and it was determined that a translator would not be necessary.

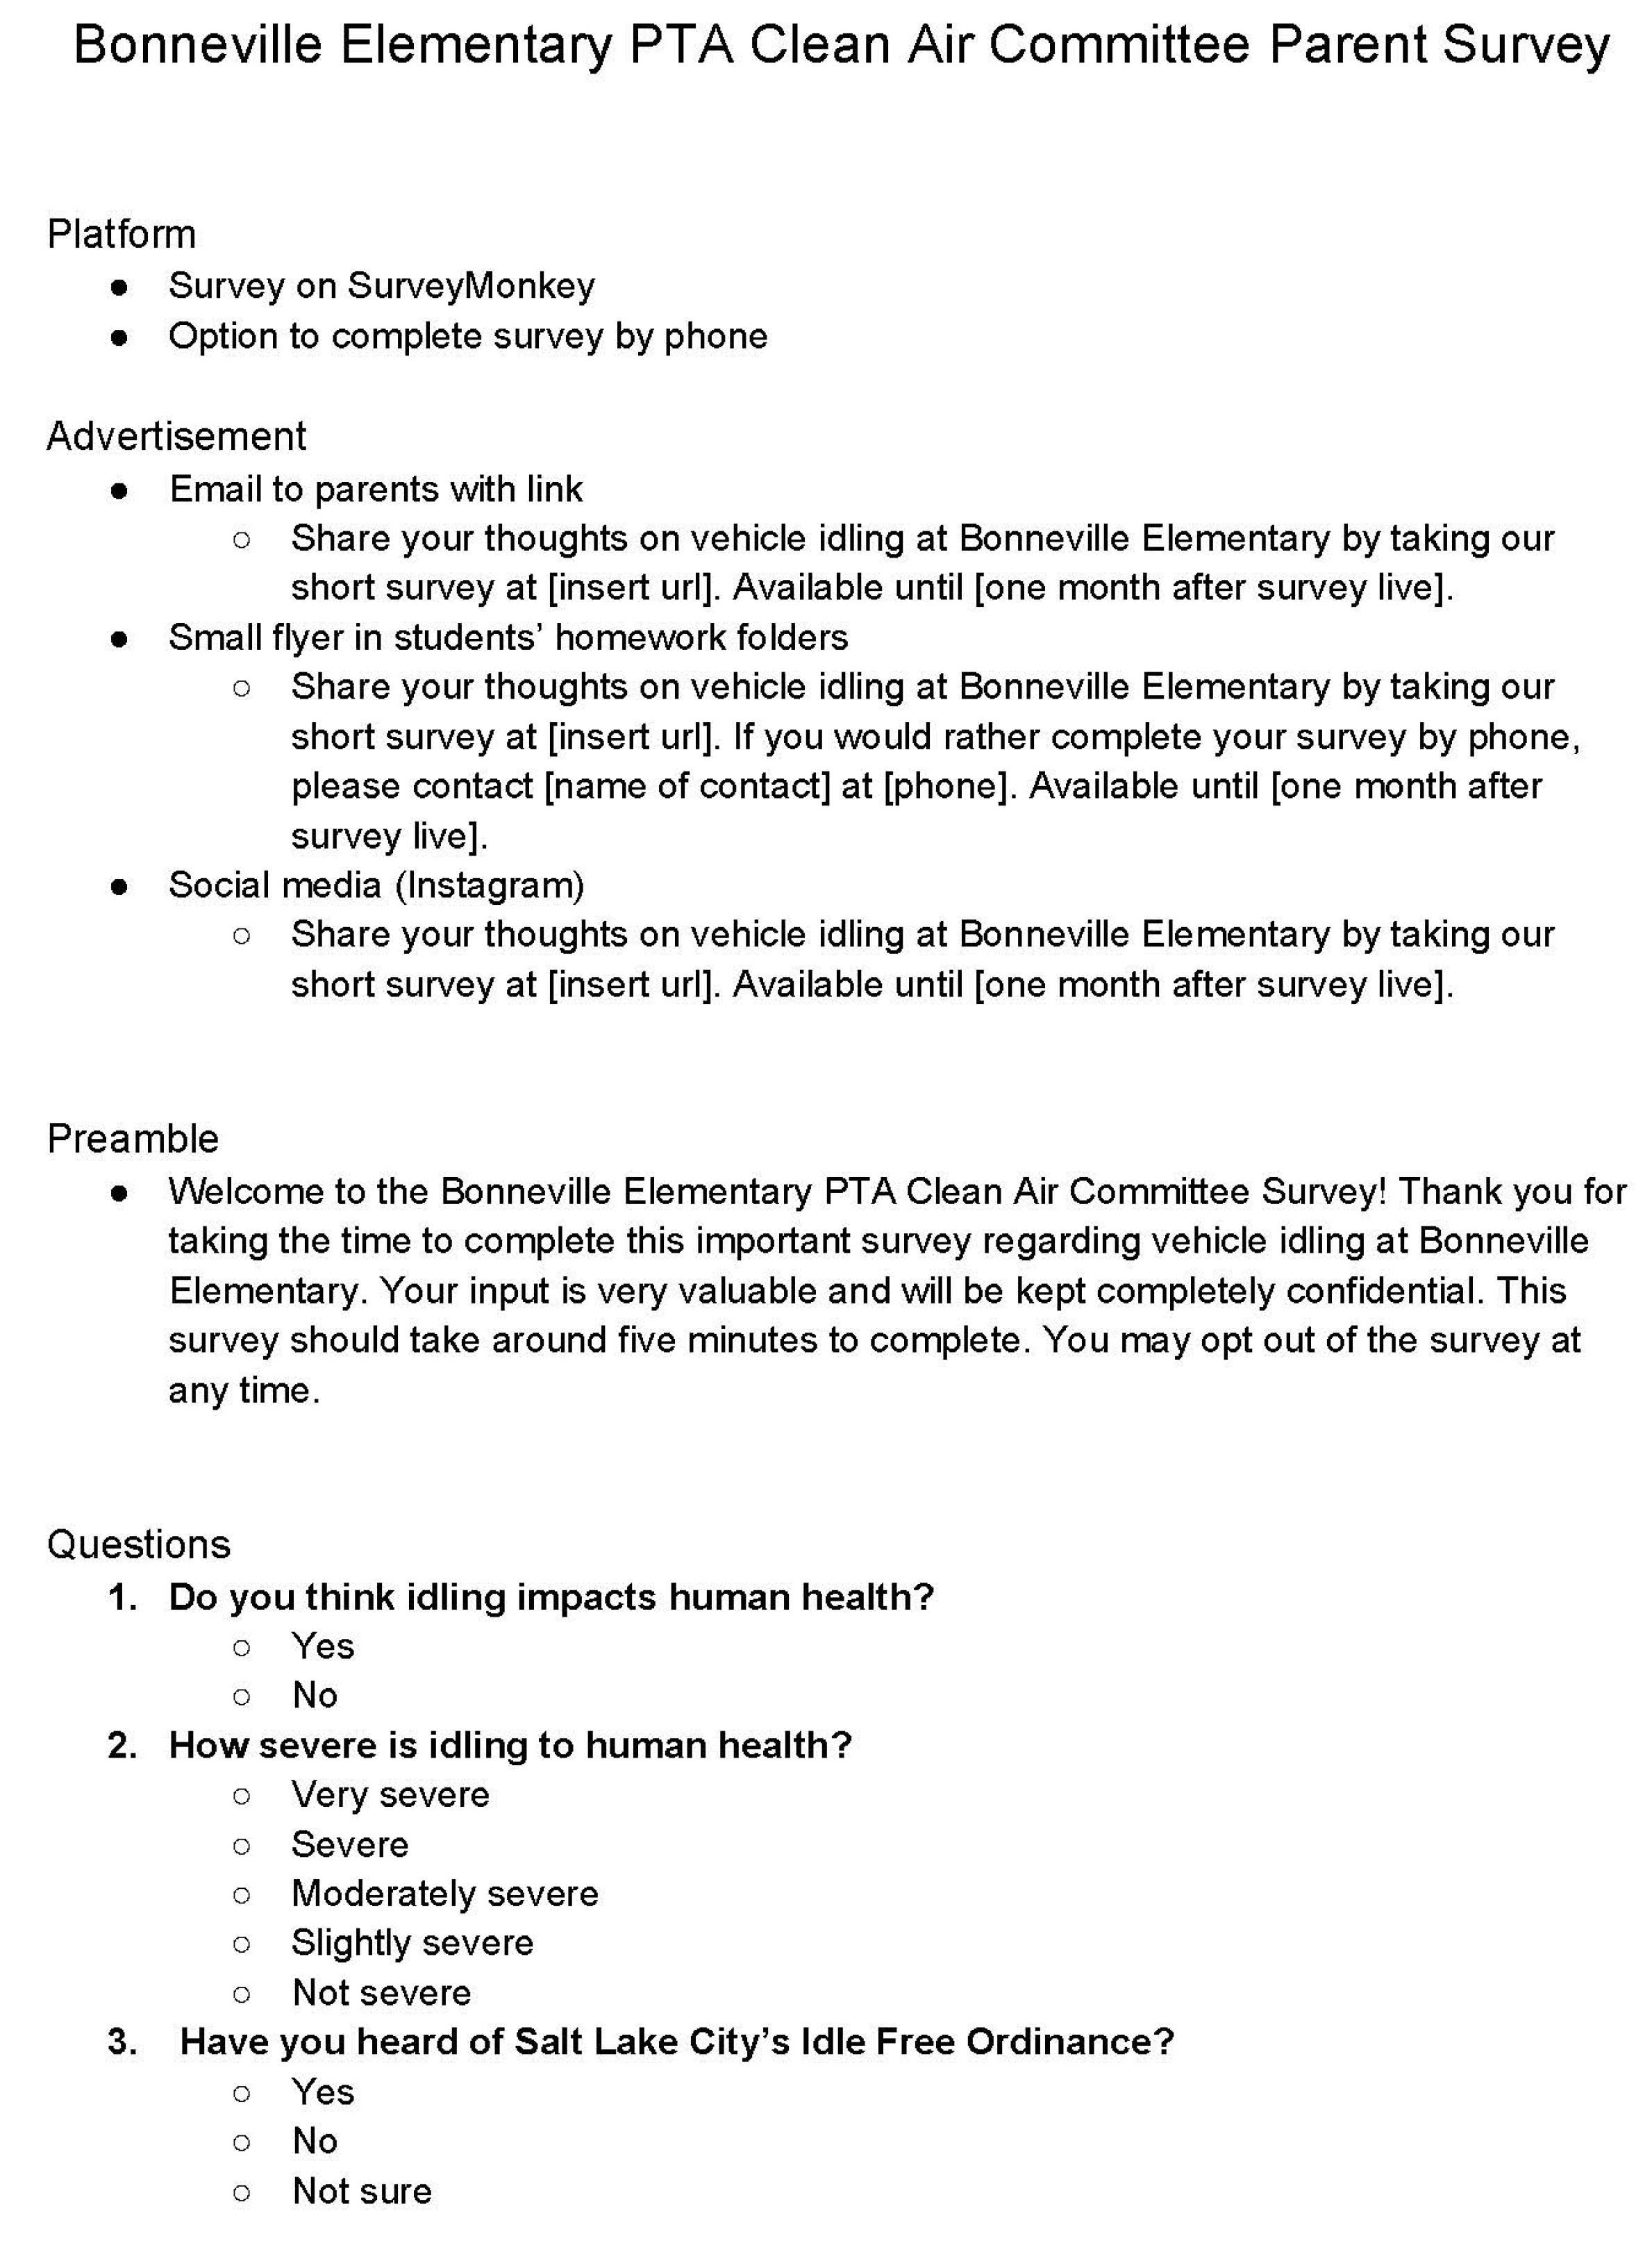
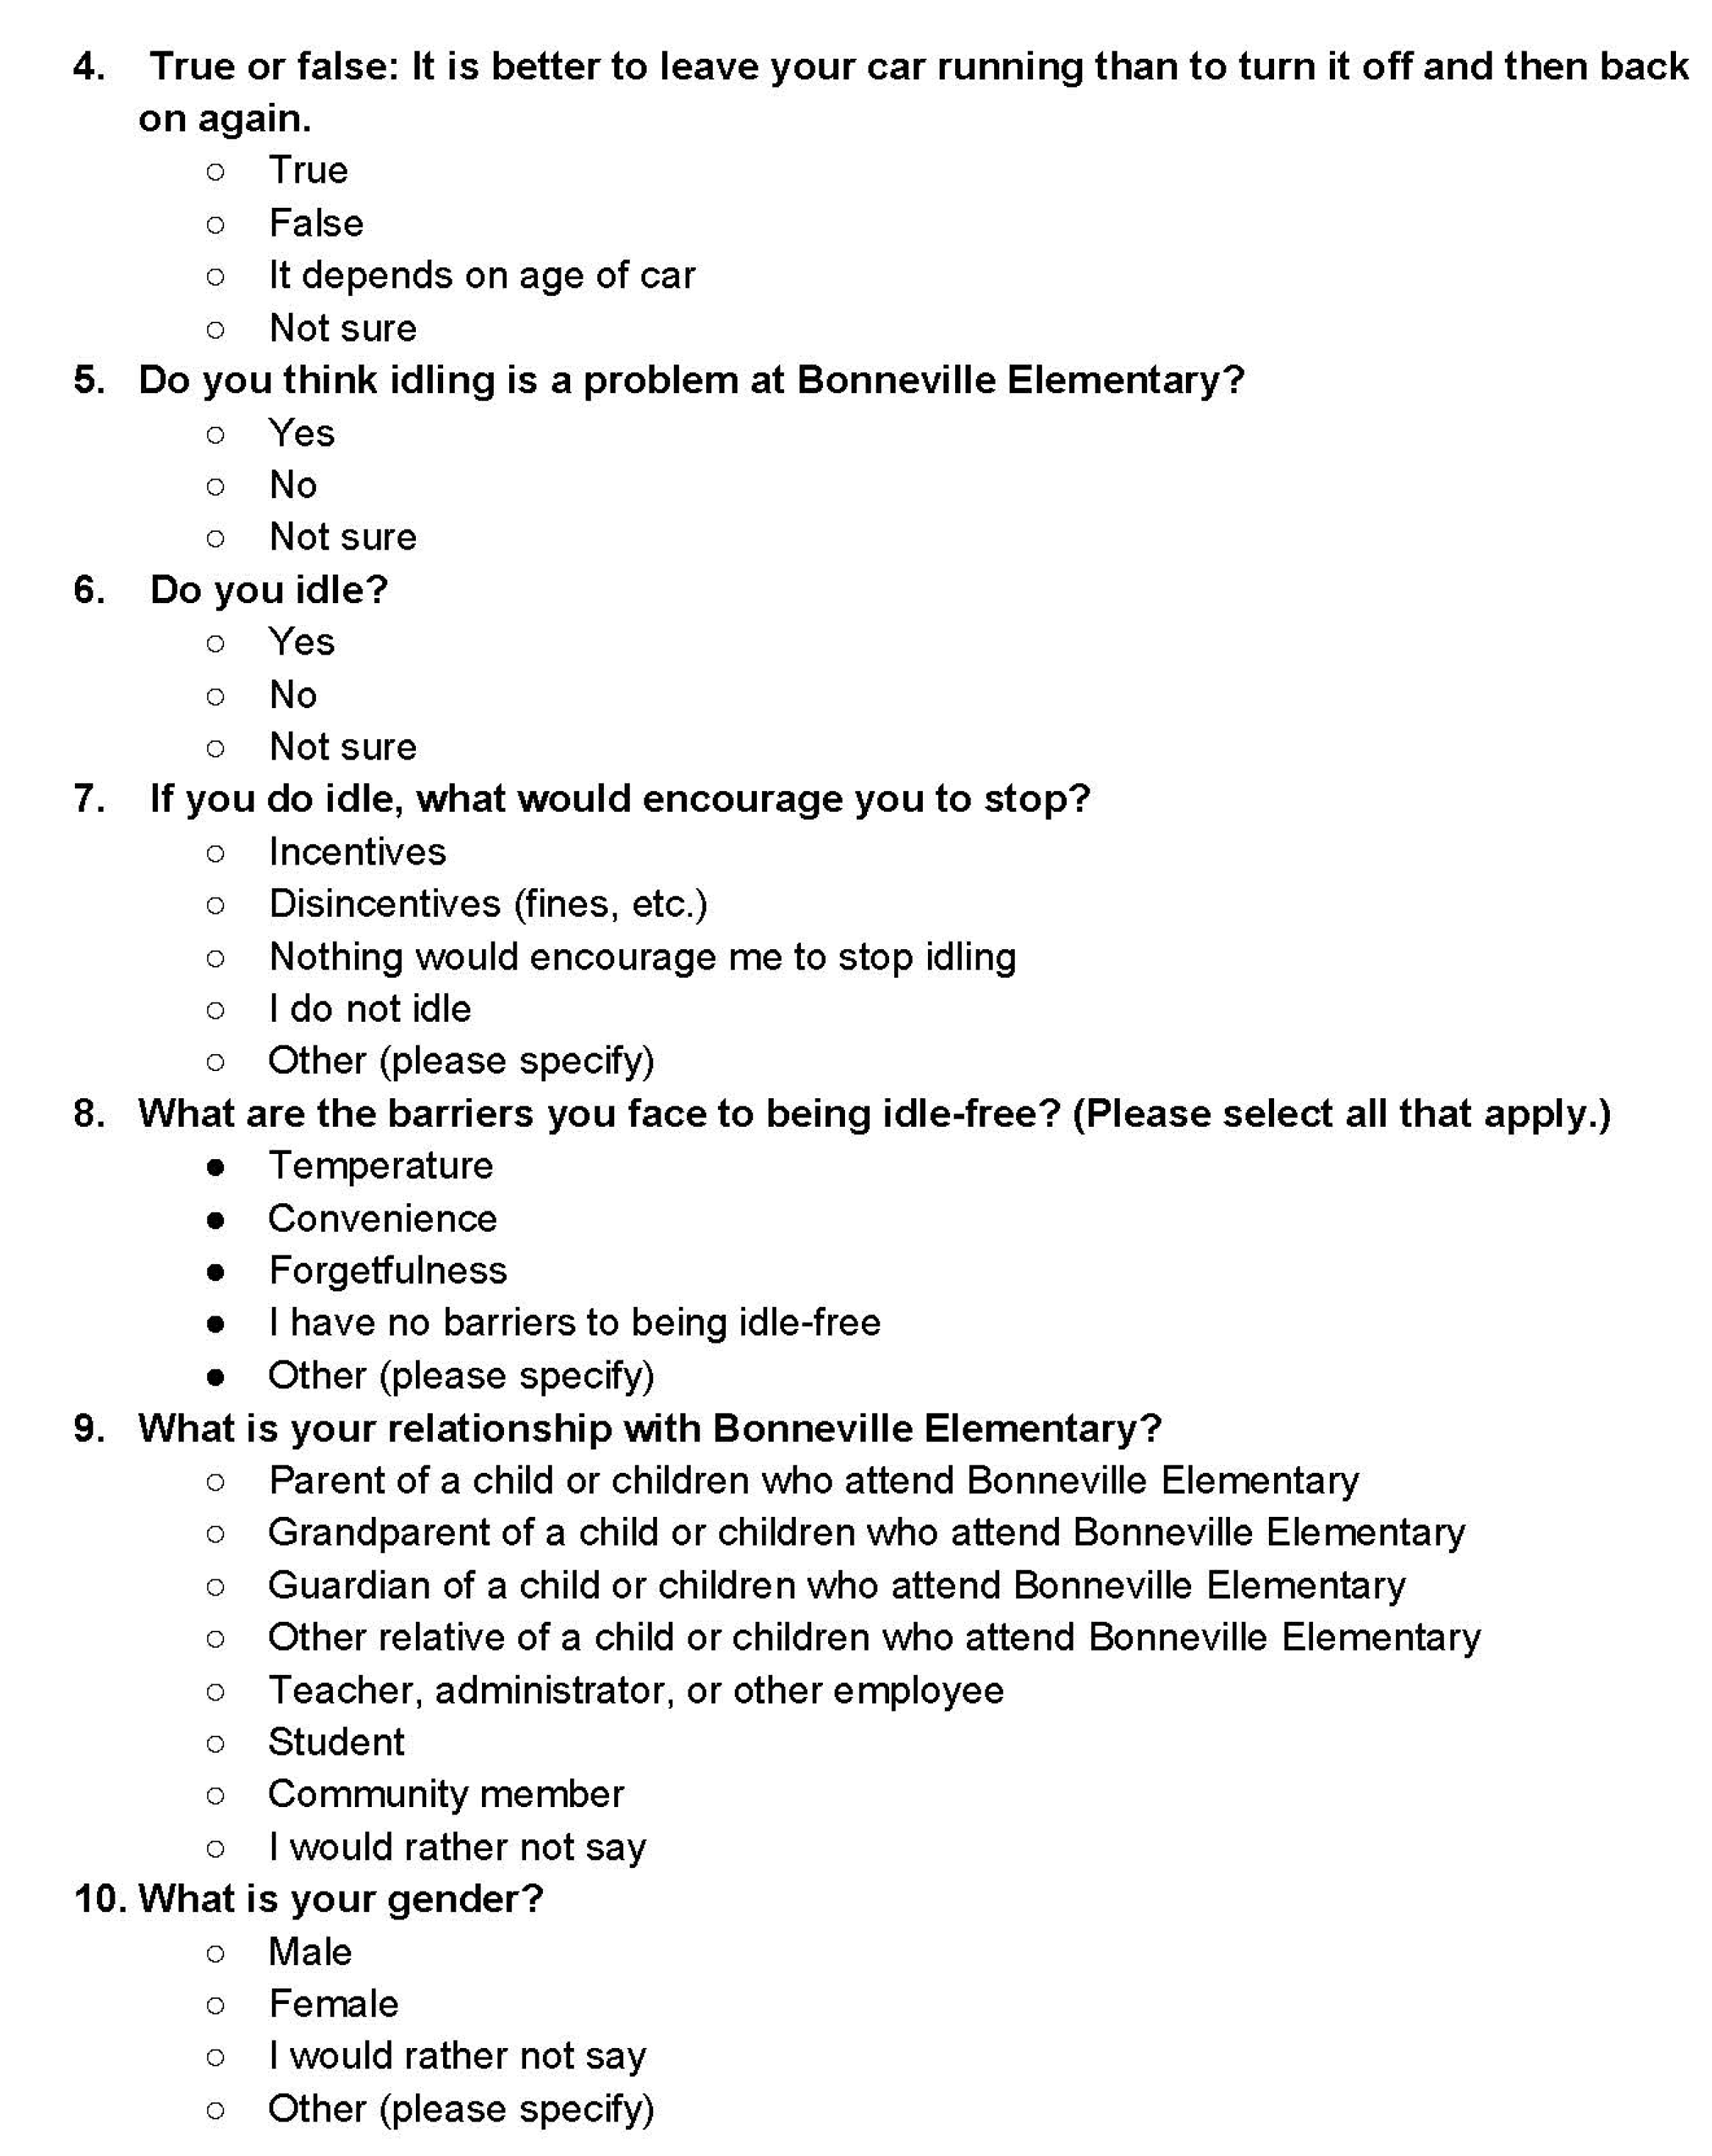
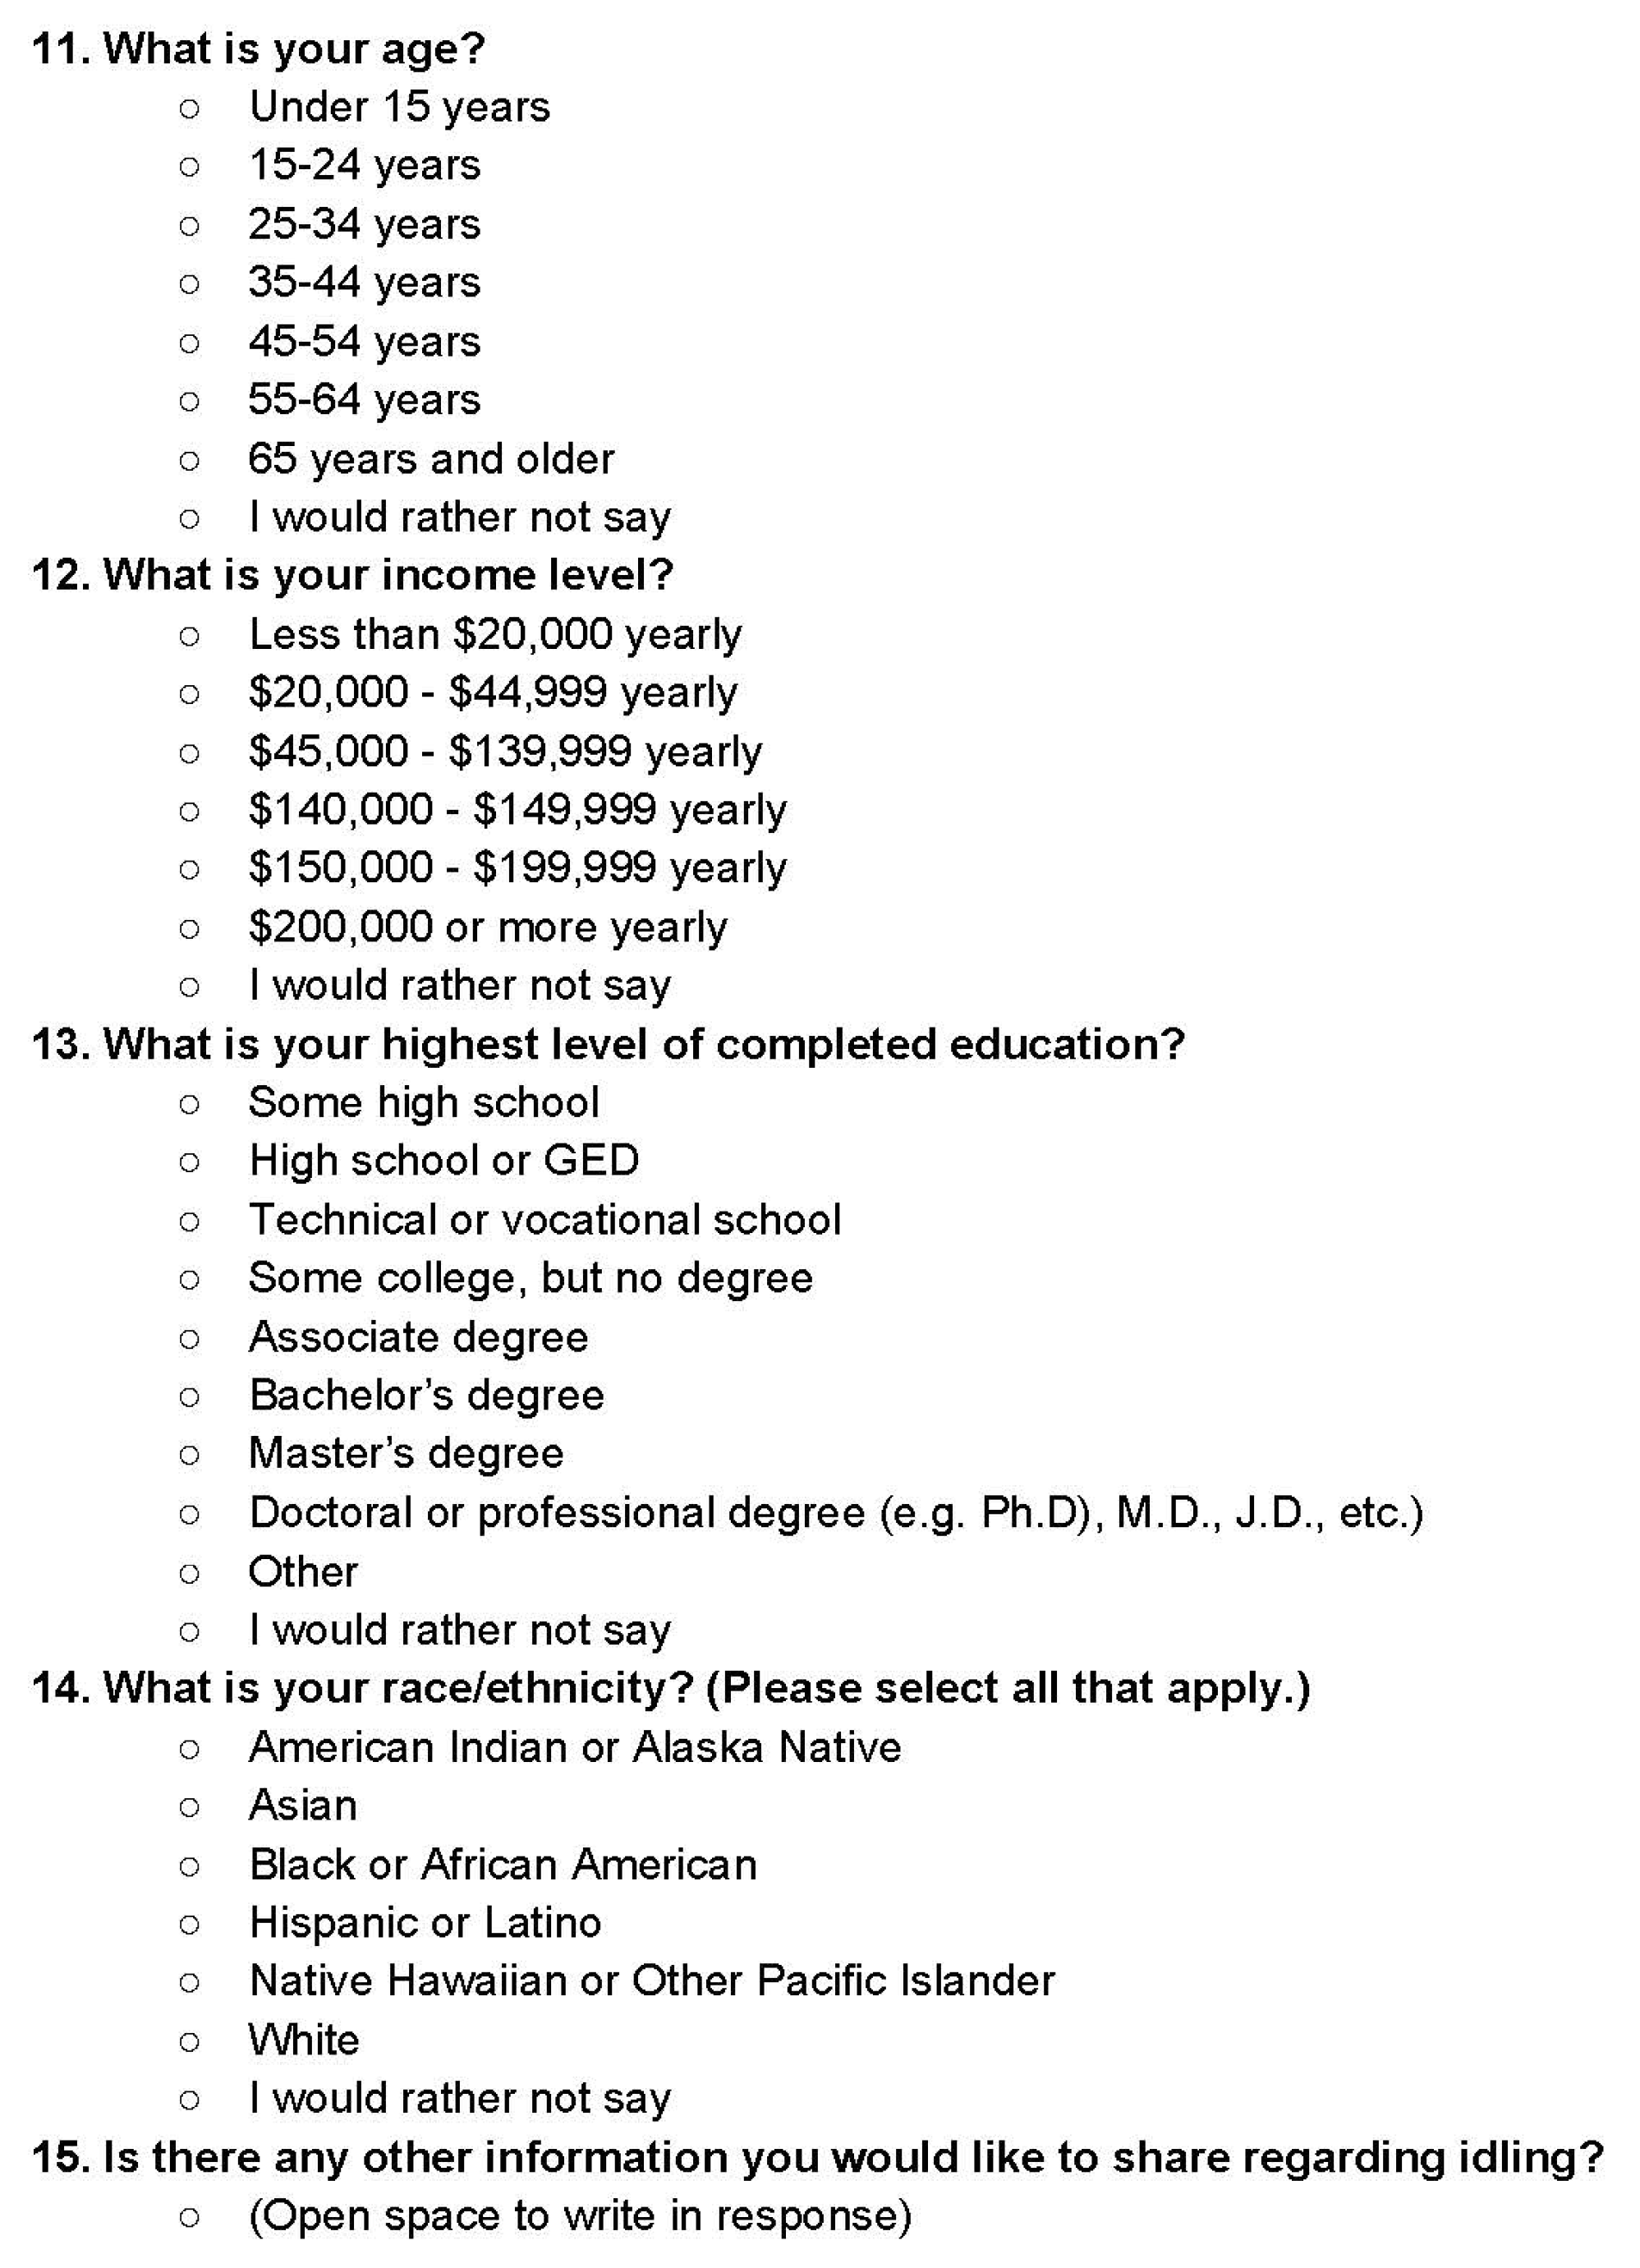
2.3. Community Survey

After the focus group, a community survey was developed incorporating the information obtained from the focus group participants and the pre-existing expertise of both the CAC and PTA. The community survey was conducted online using SurveyMonkey [53] (Appendix A, Figure A1, Figure A2 and Figure A3). The questions asked included basic demographic information and beliefs and behaviors on idling. Bonneville Elementary School community members were invited to participate via an email from the school principal, a flyer (Appendix A, Figure A4) sent home to parents, and through a social media post. A reminder email was also sent to parents. Informally, word of mouth was used to promote the survey. The survey results were analyzed using R statistical software [54]. The survey participant data was compiled in a way to protect the privacy of the participants and so that the results were not personally identifiable thus rendering it Institutional Review Board (IRB) exempt.

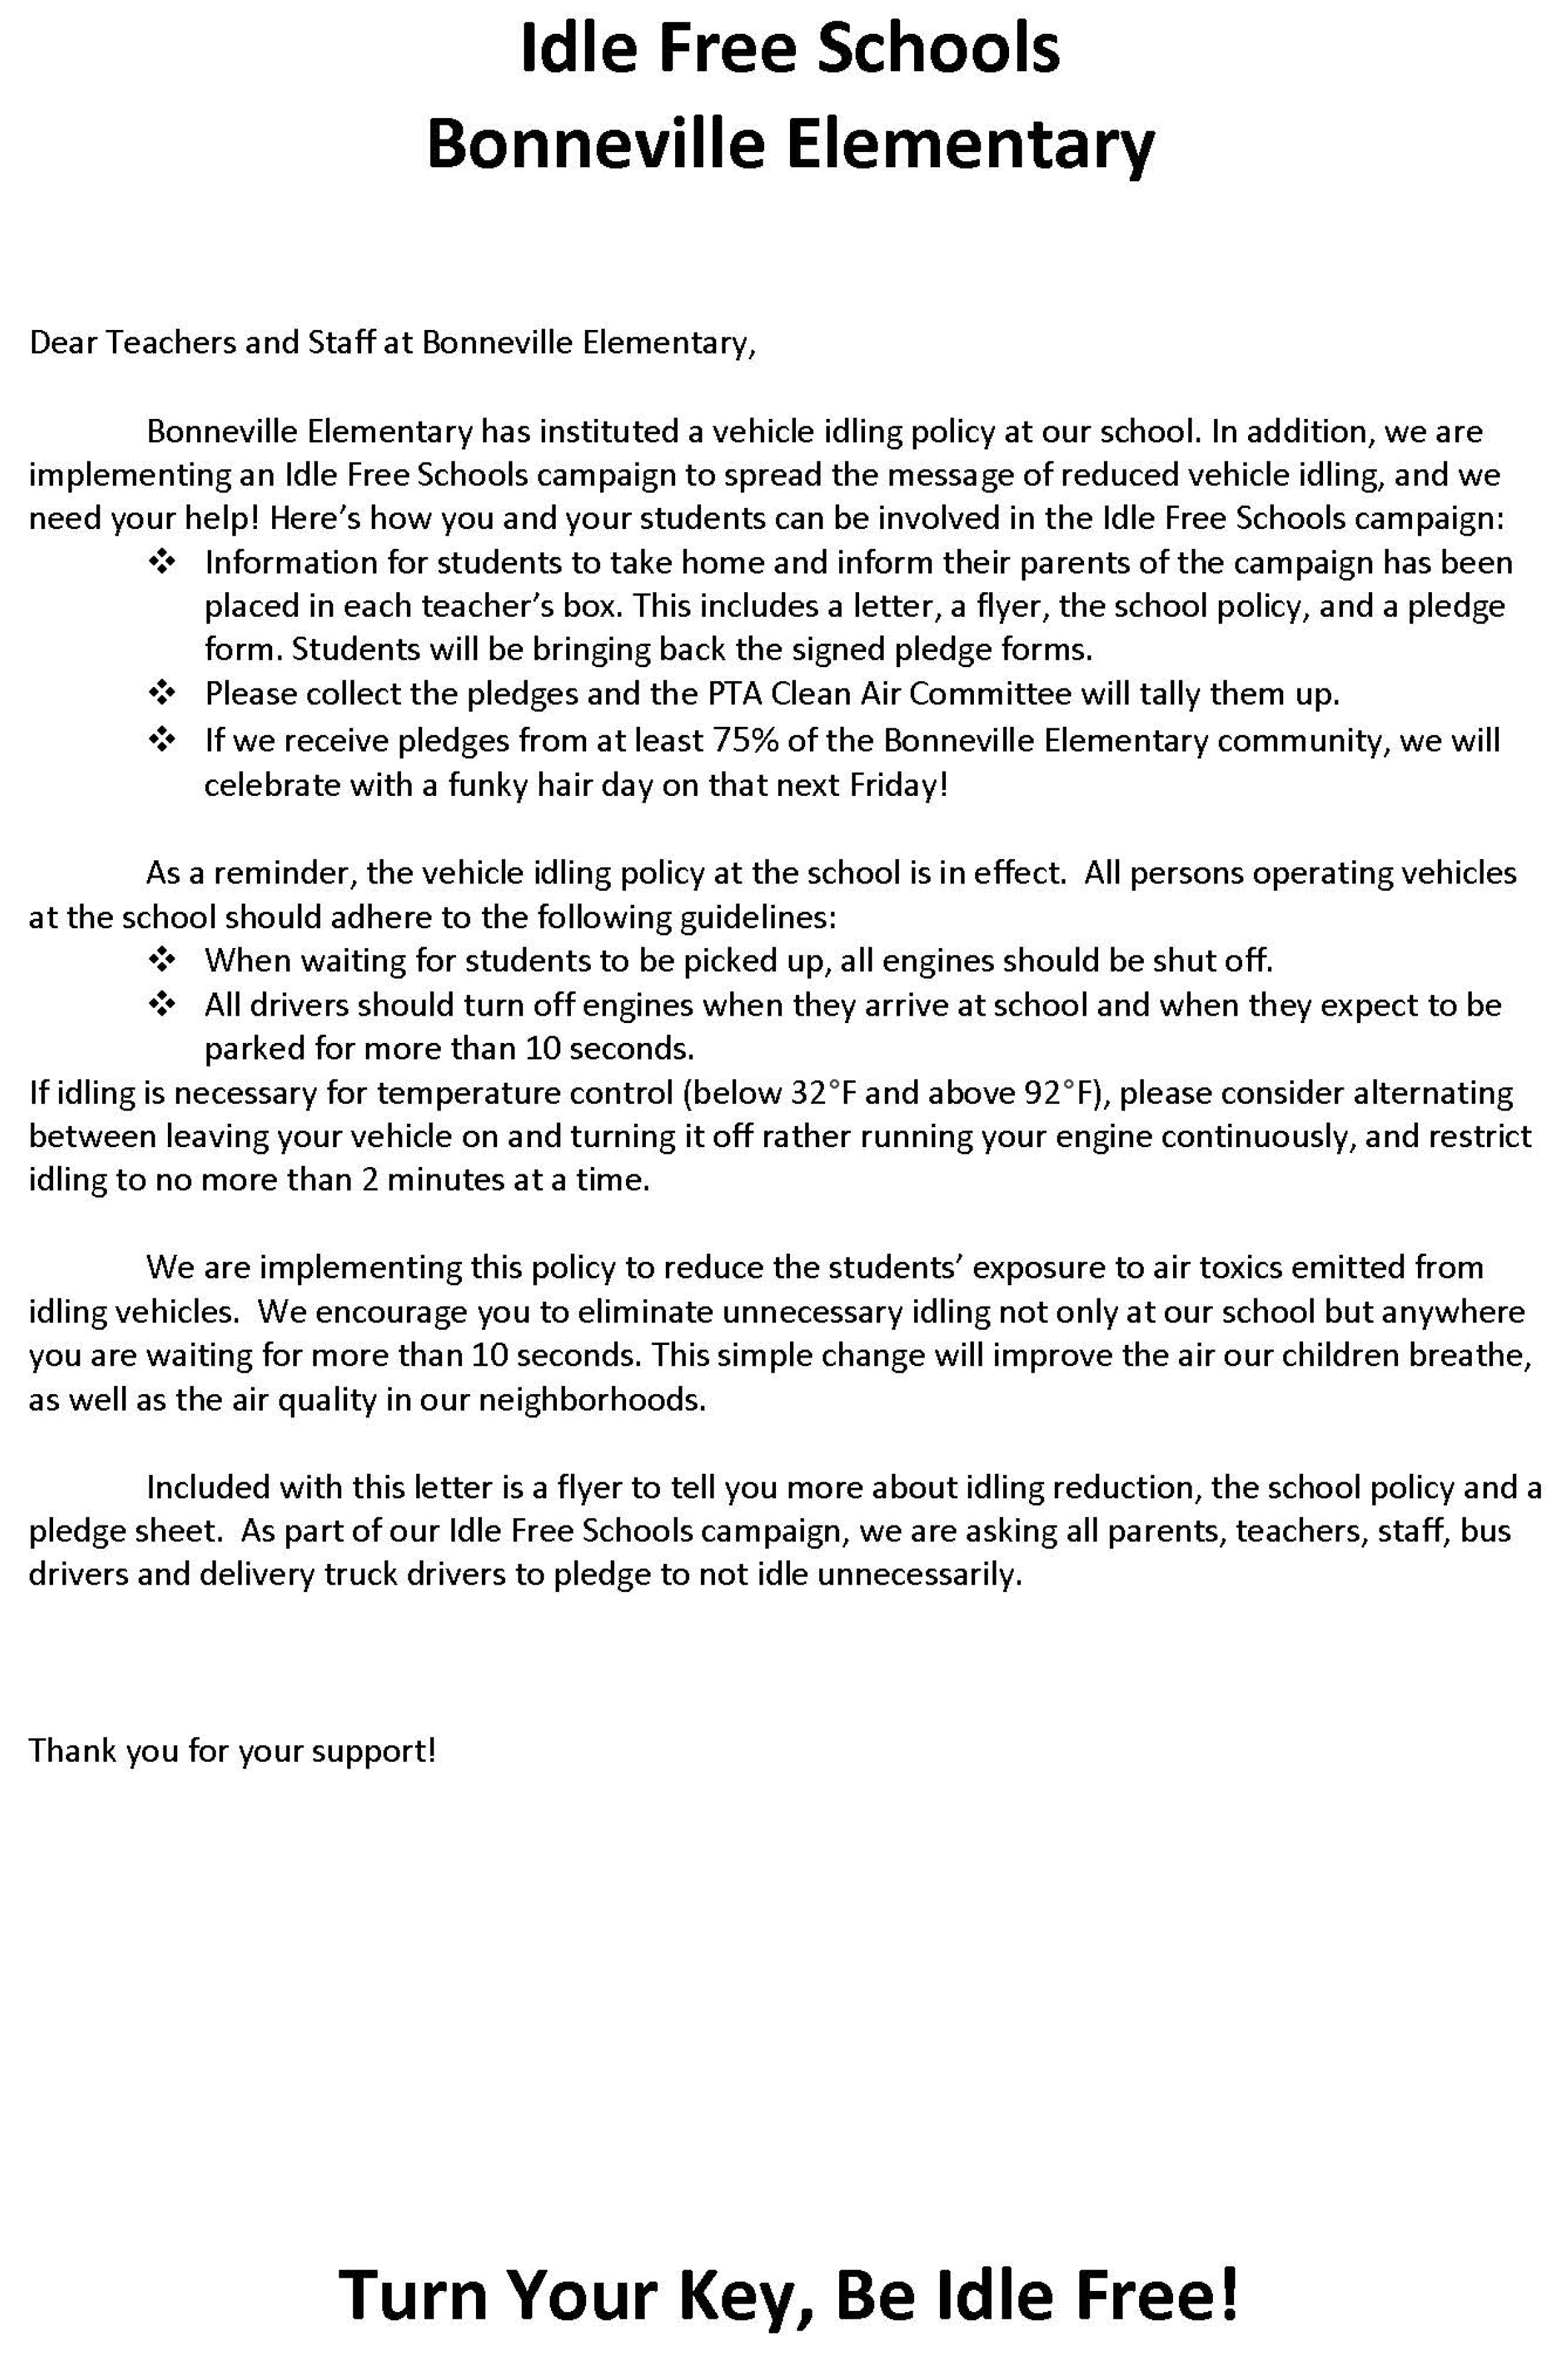
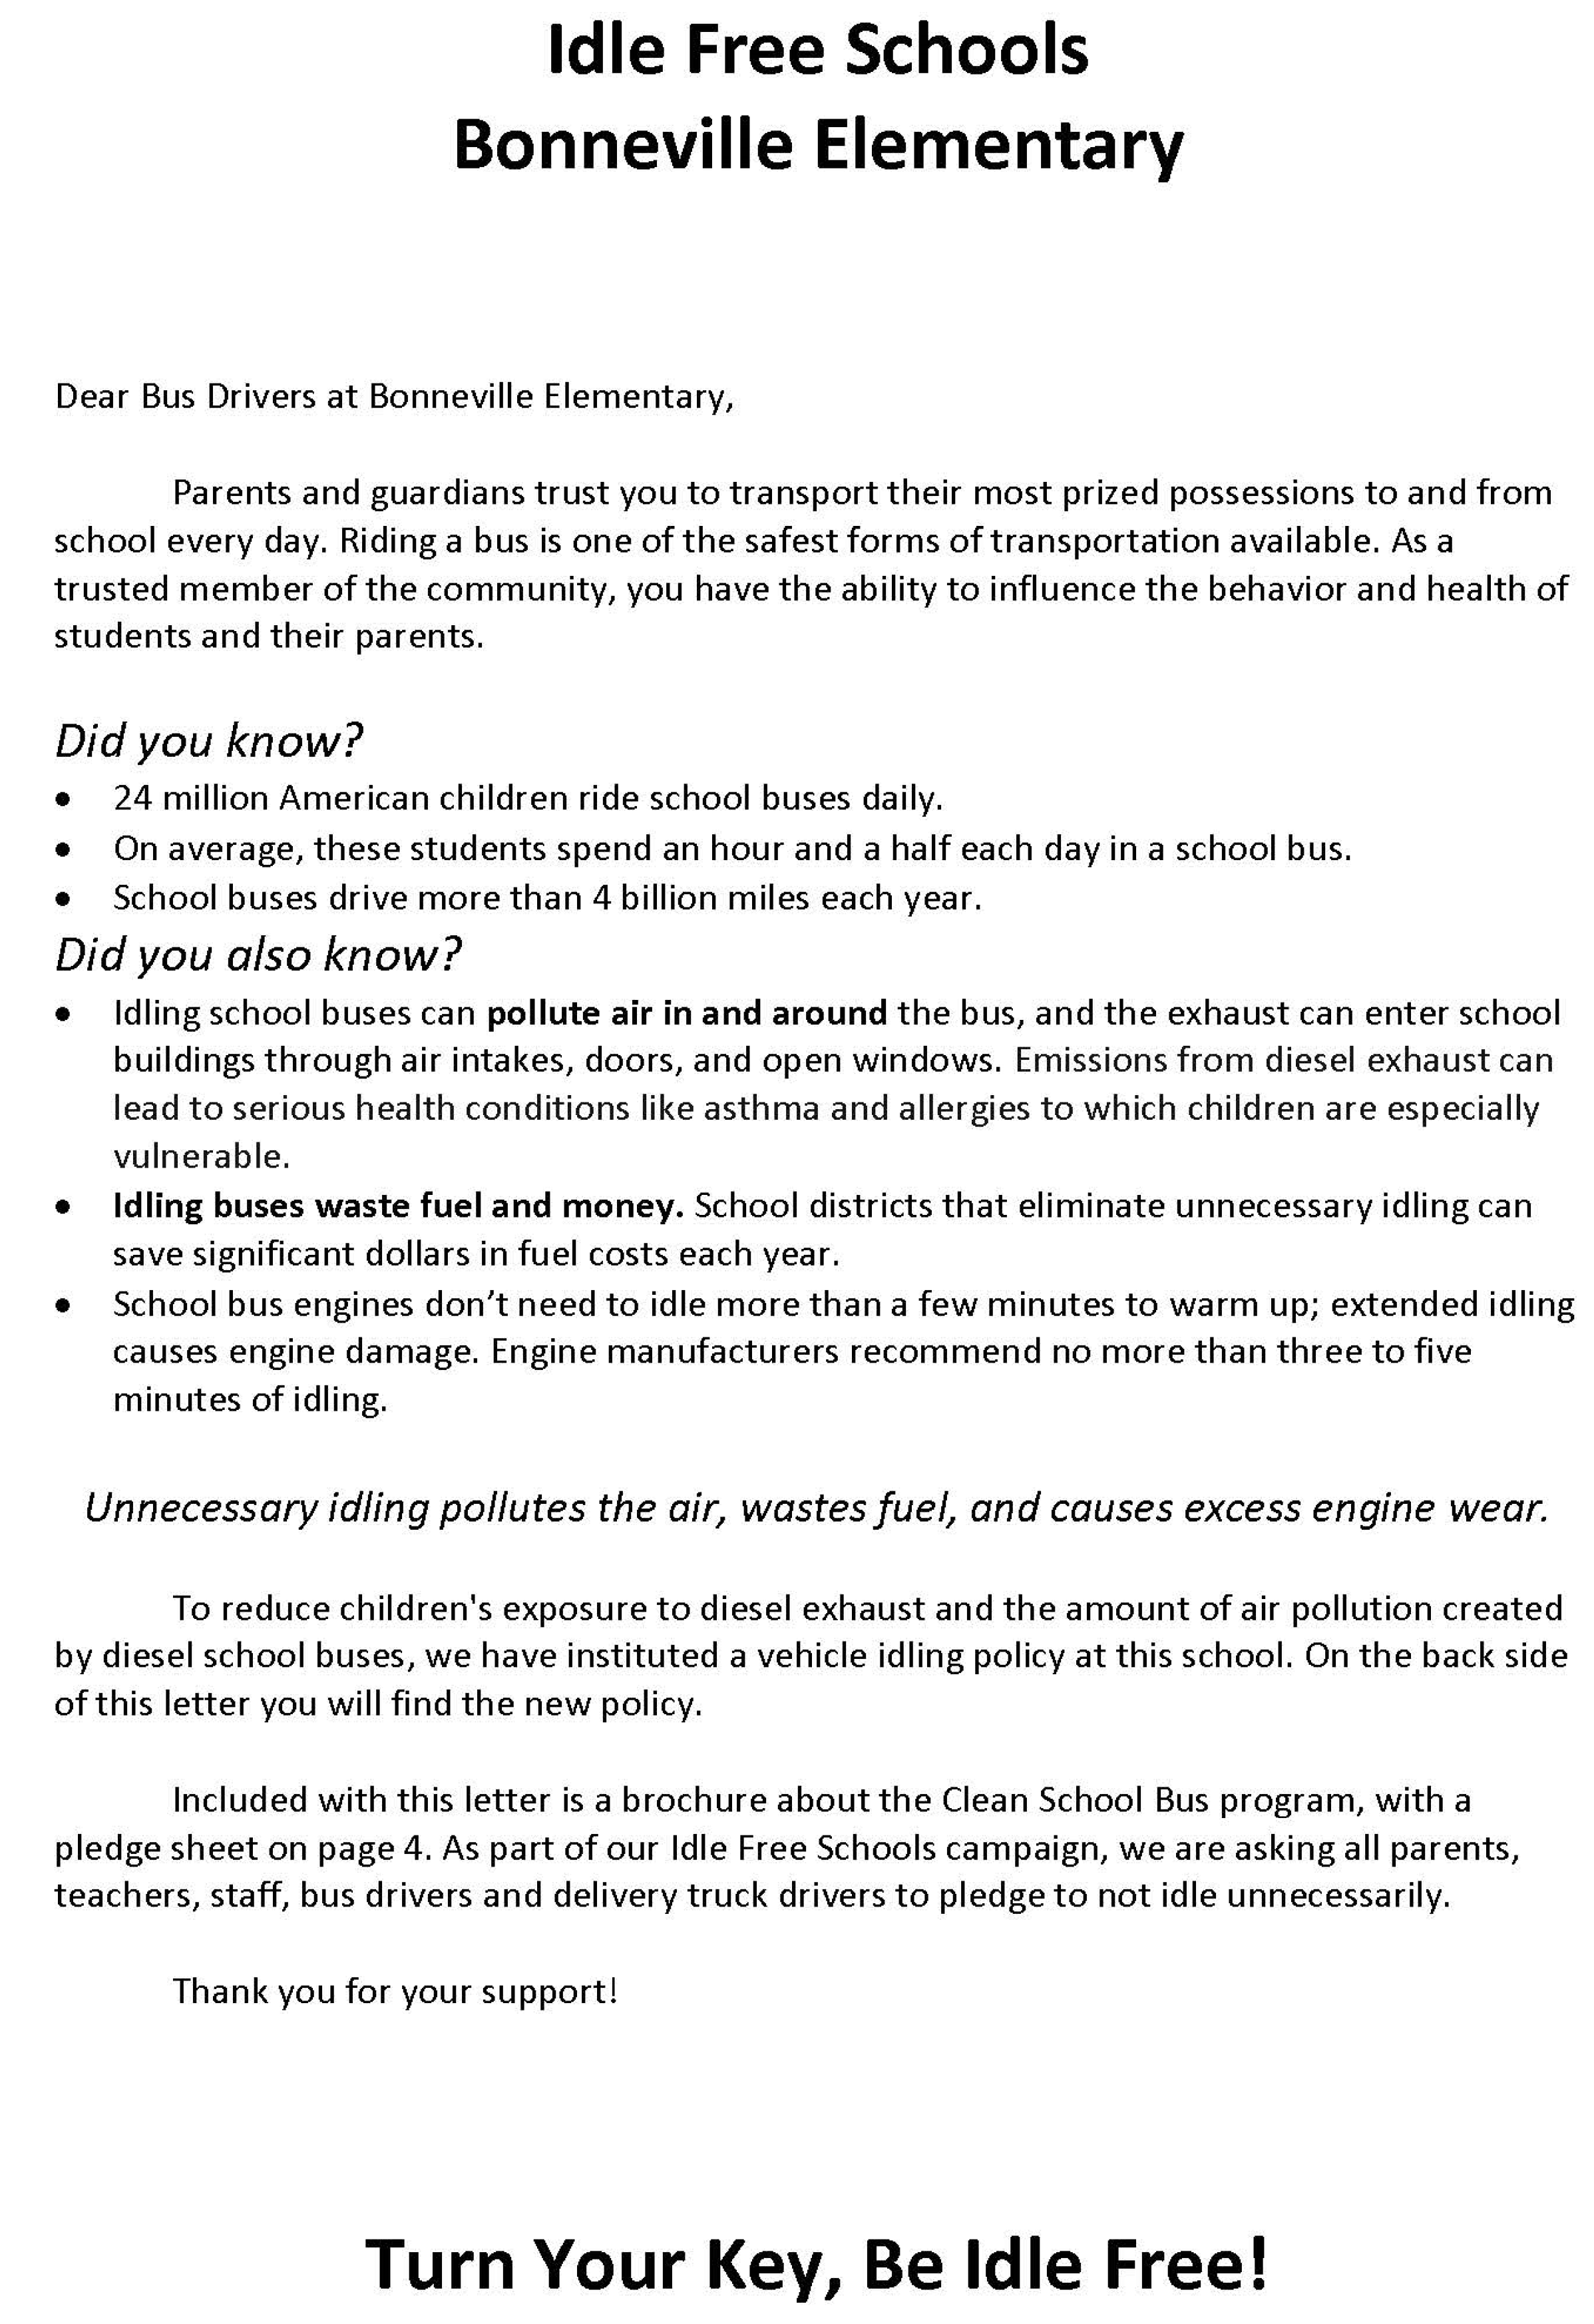
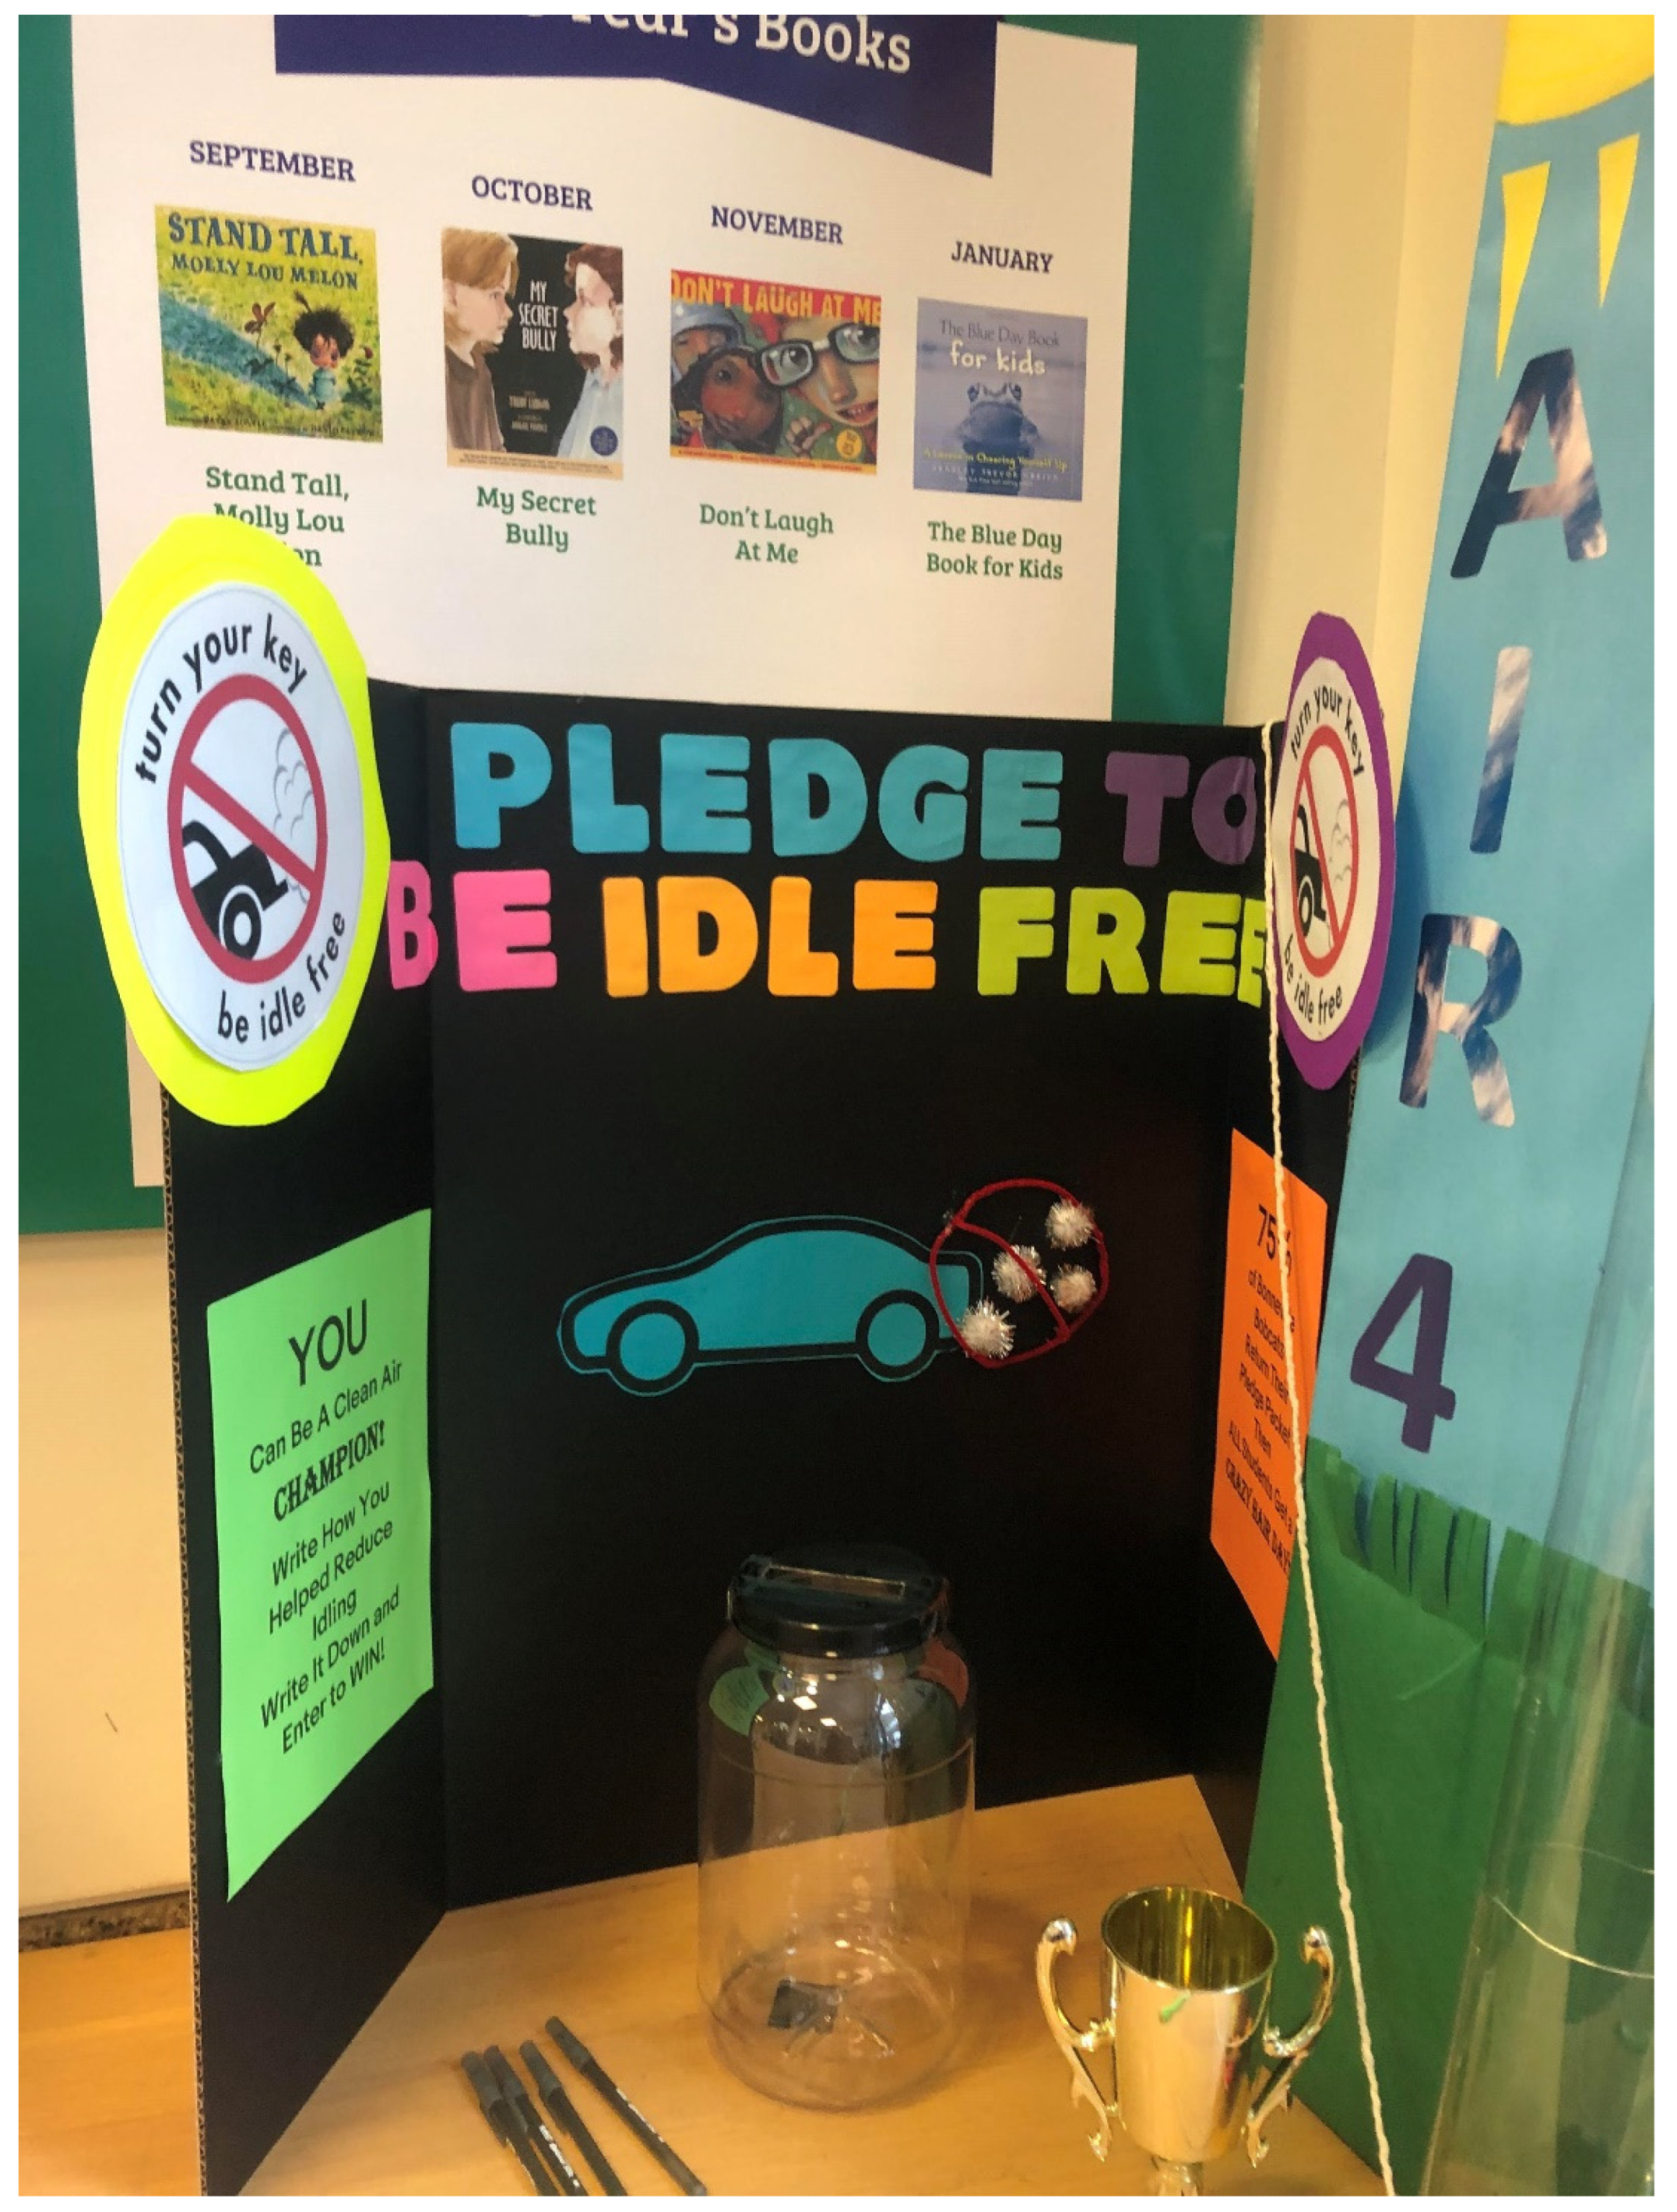
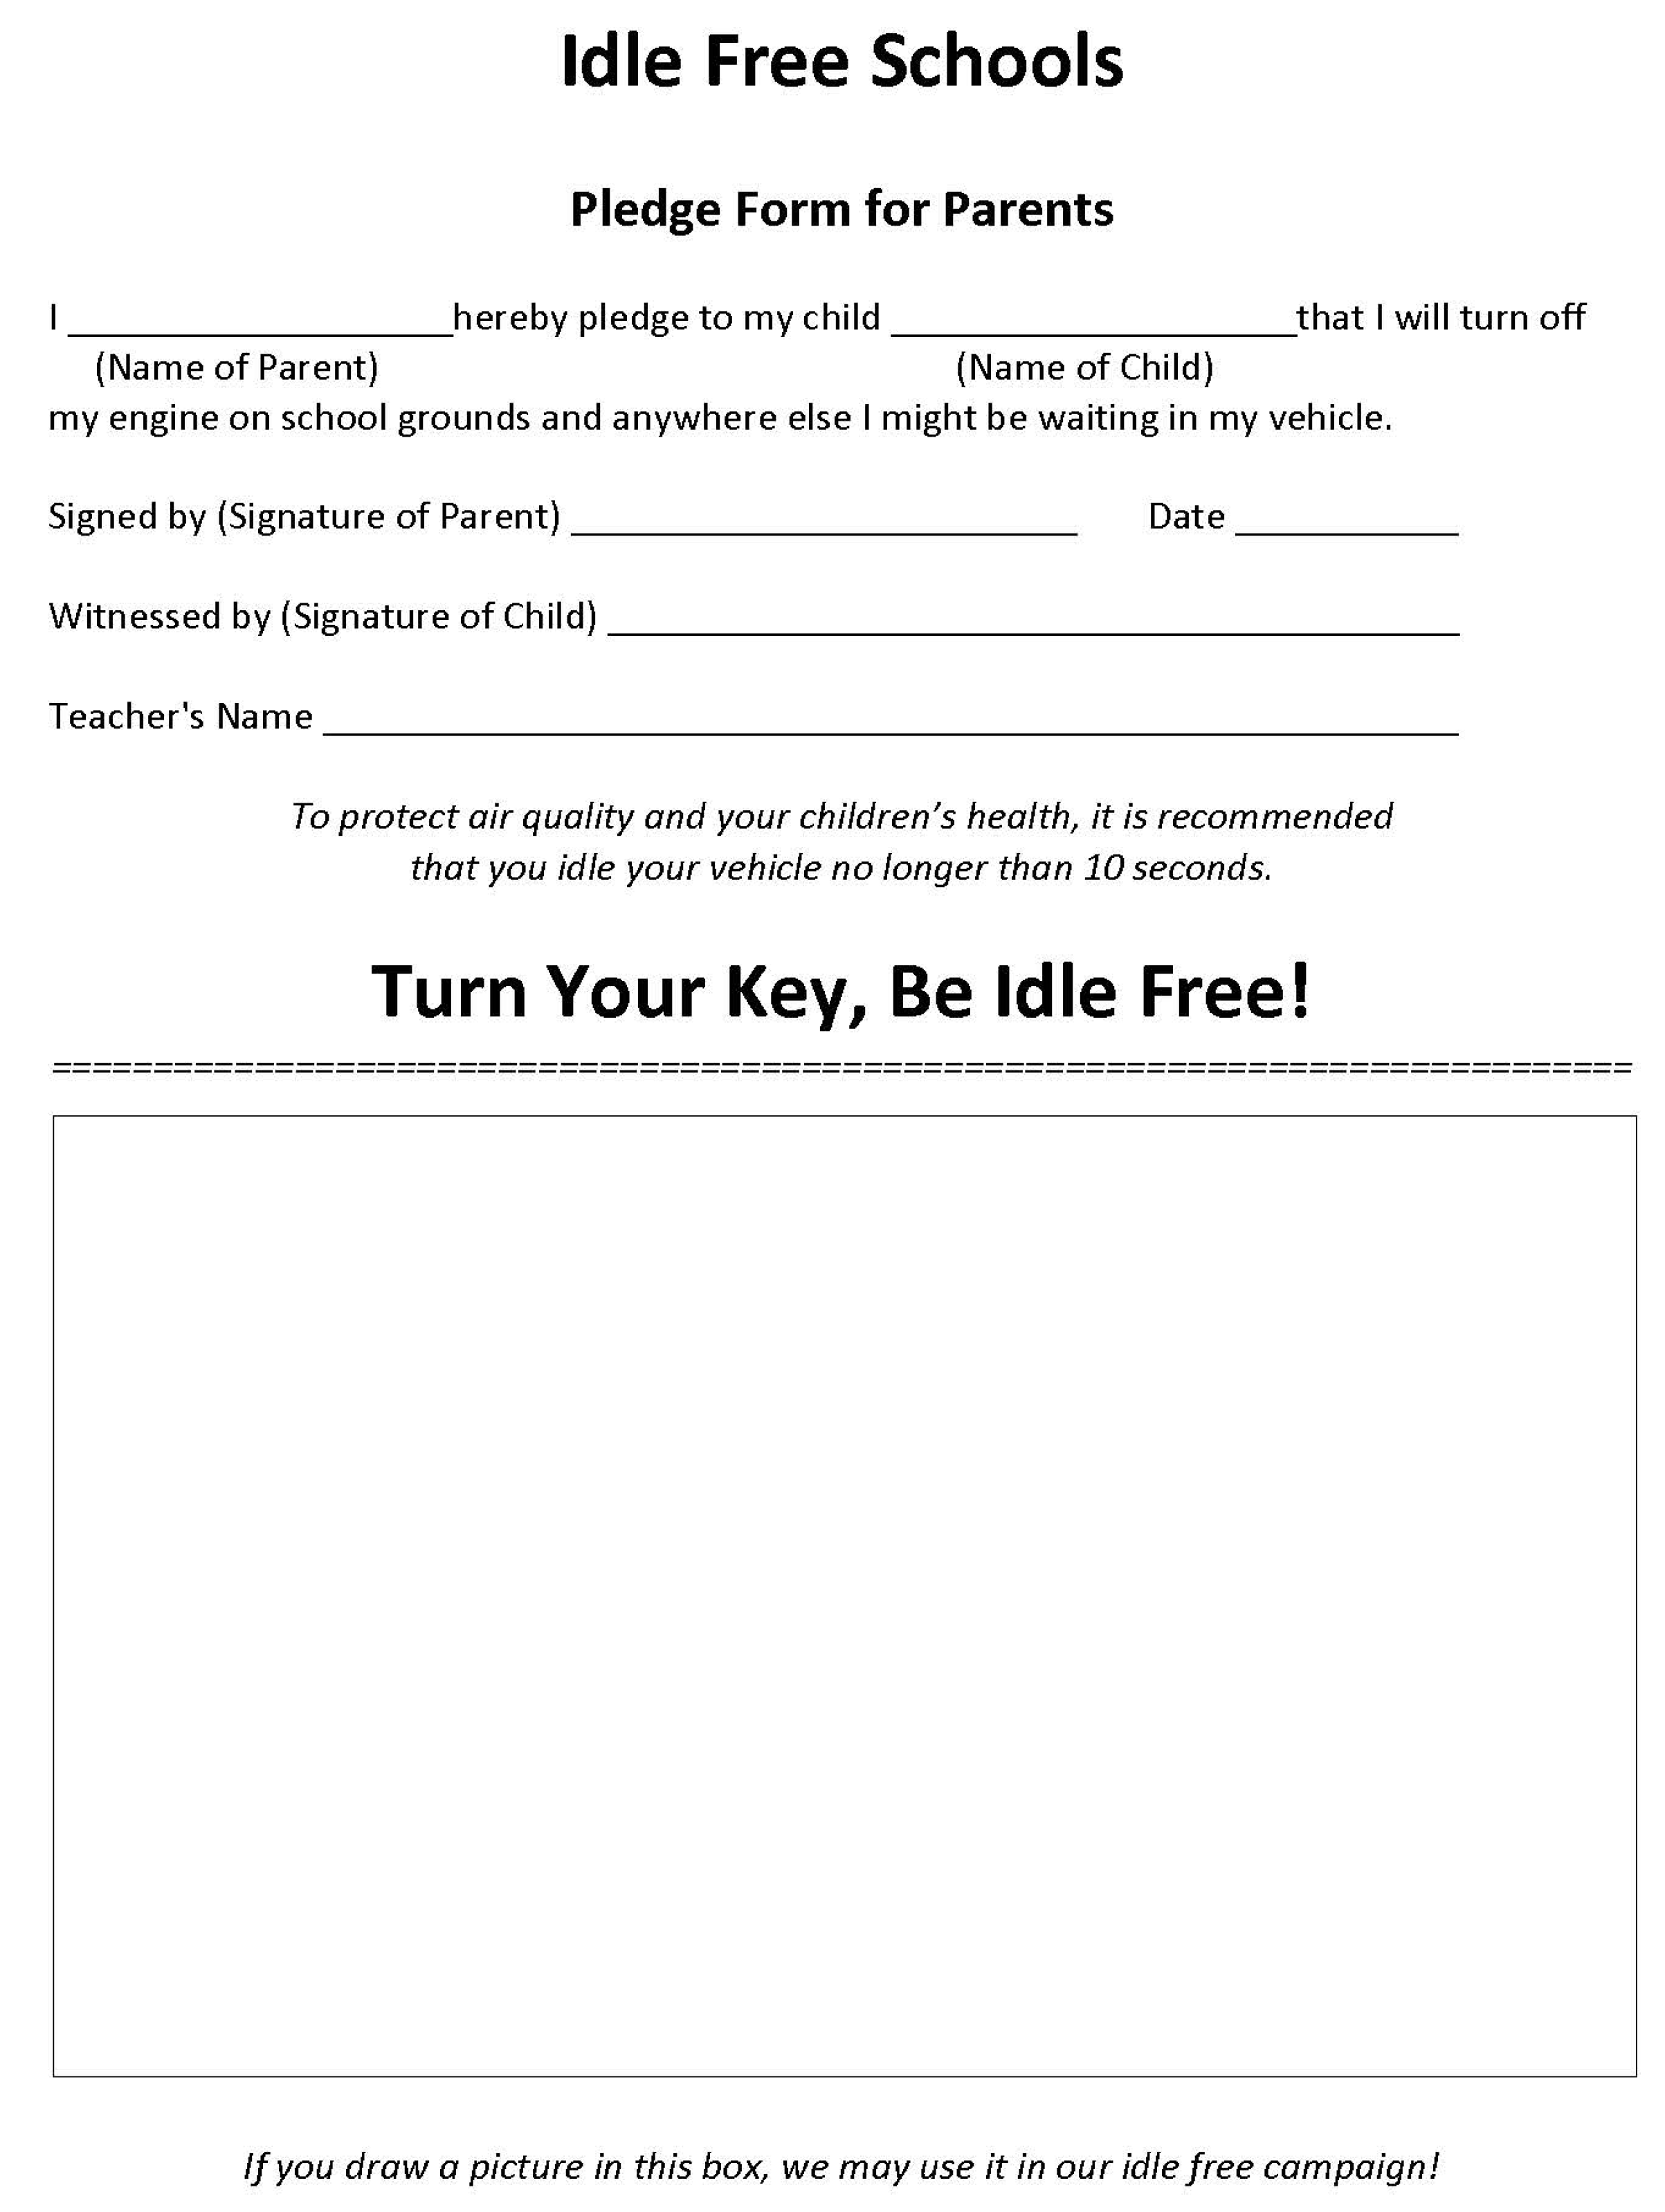
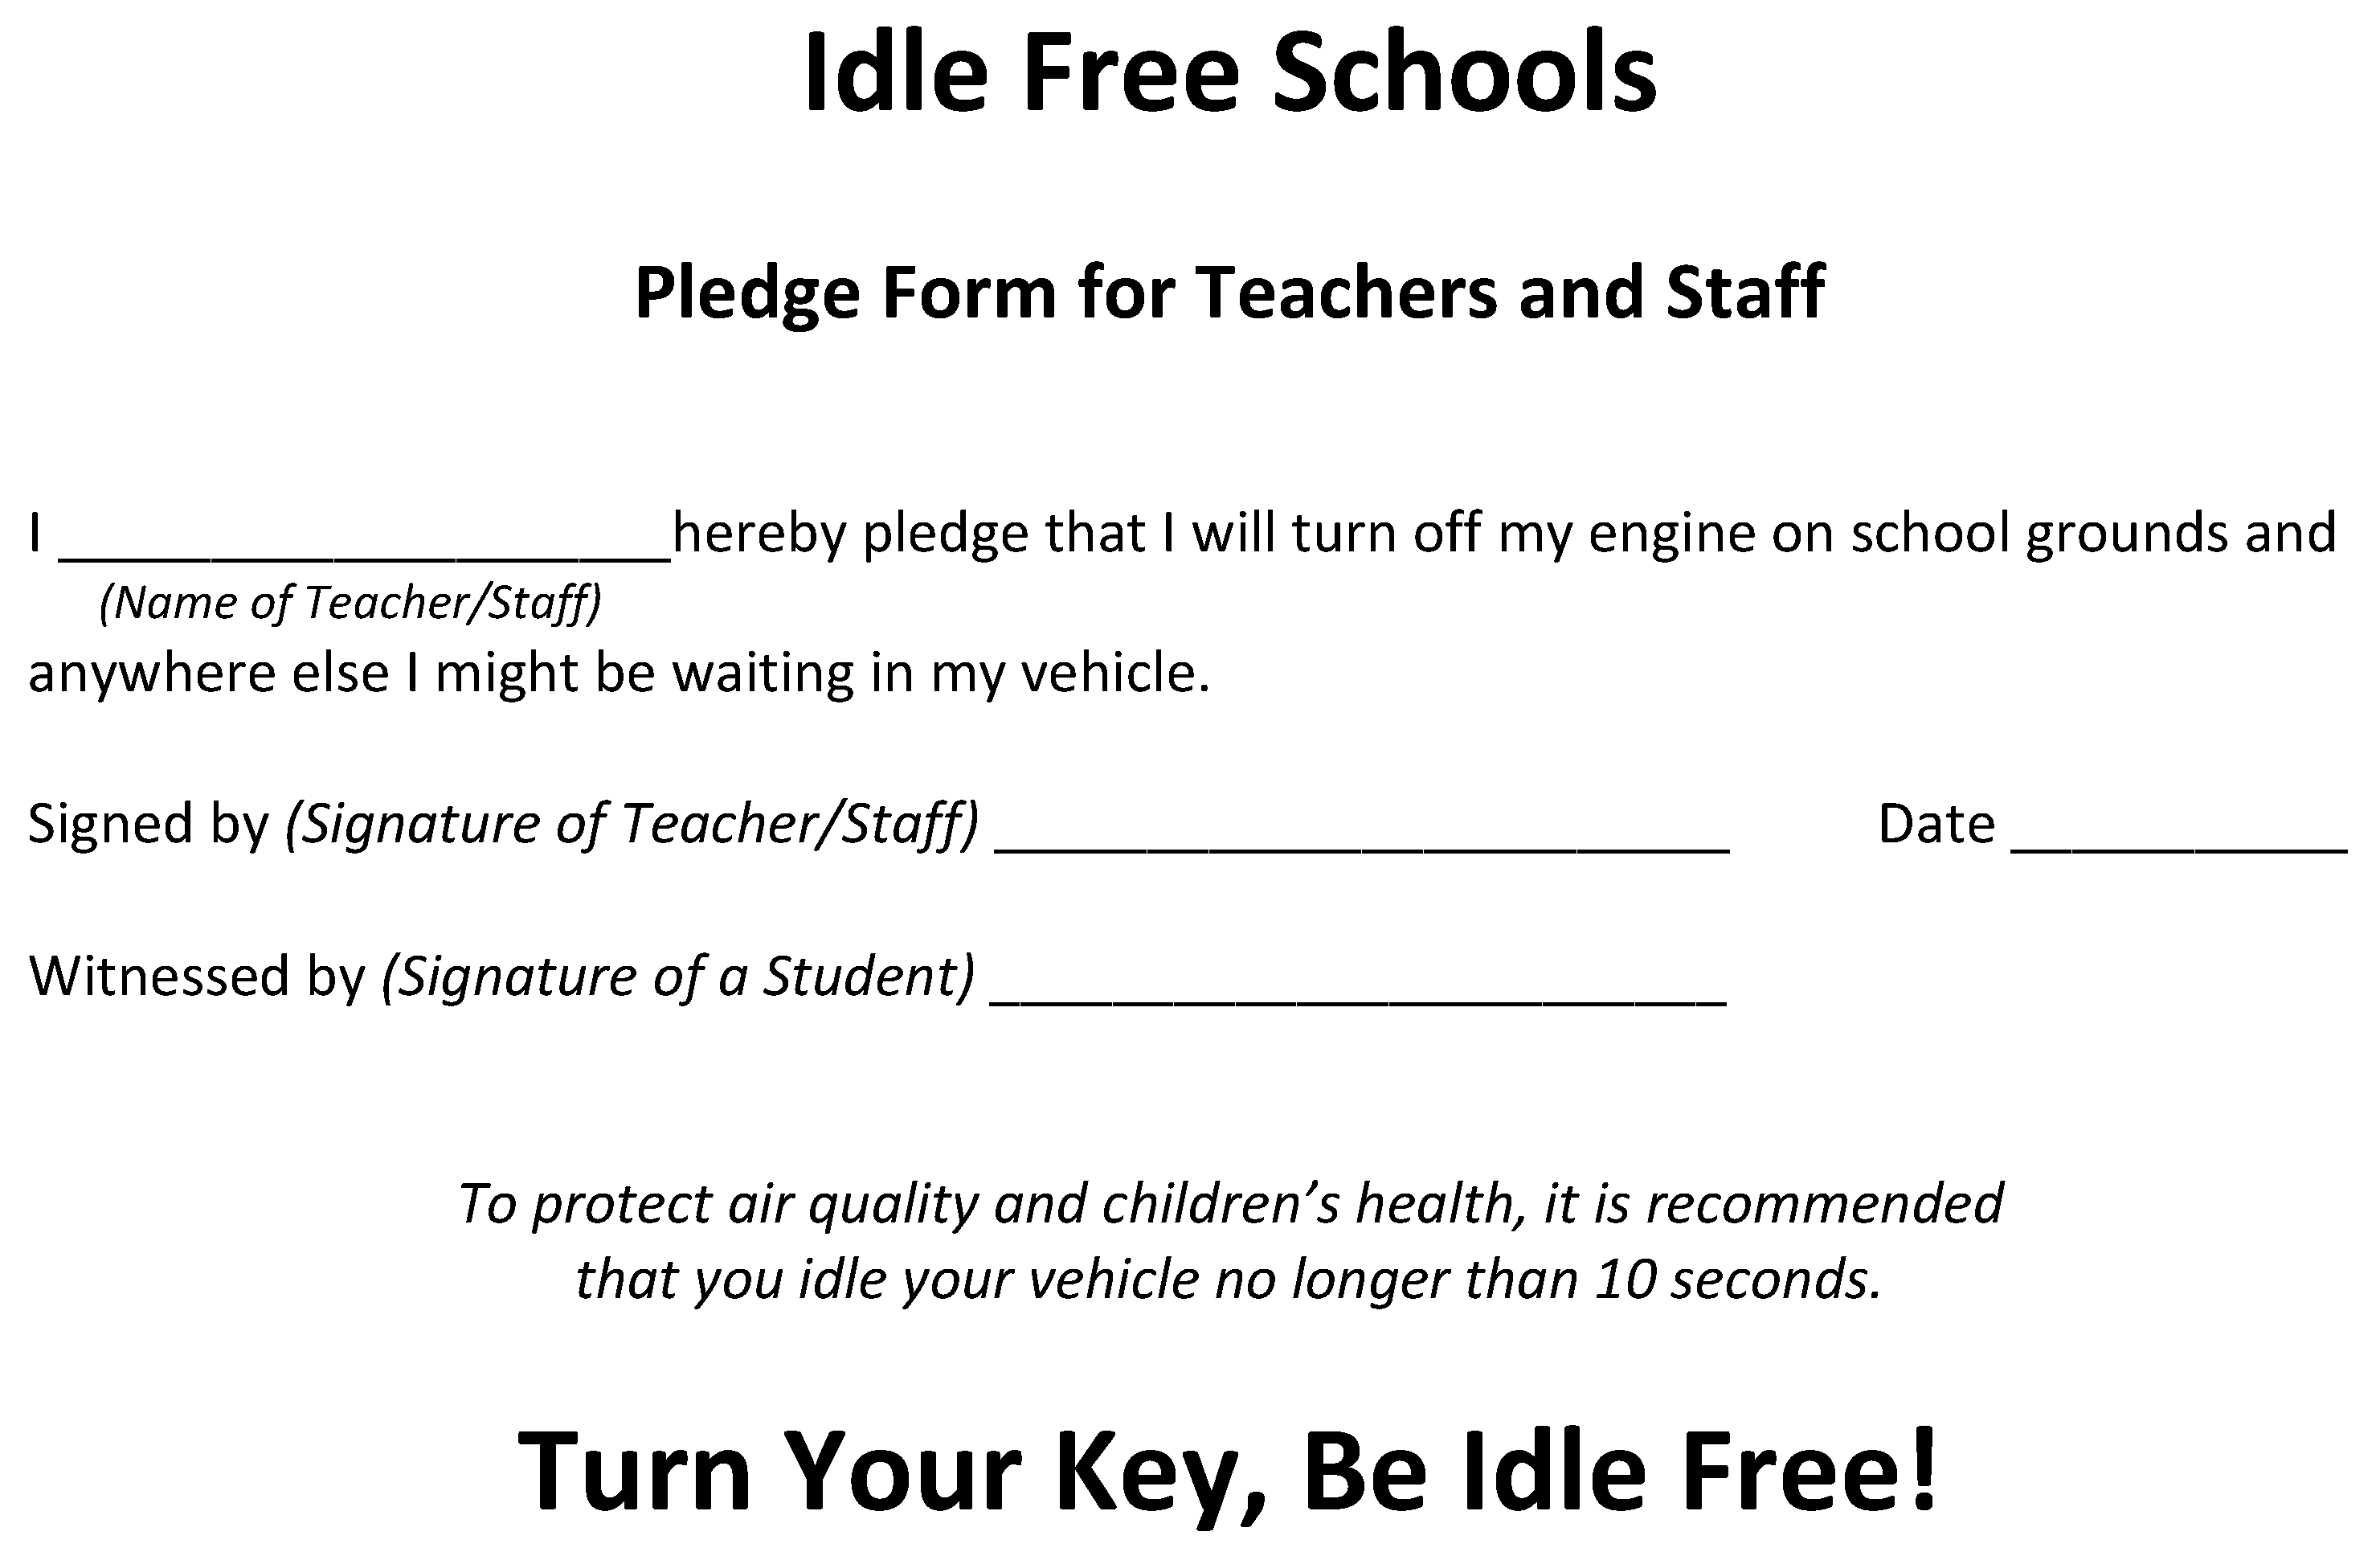
2.4. Idle-Free Campaign

Incorporating the information from the focus group, community survey, and feedback from the PTA and CAC, a personalized Idle-Free Campaign was developed. The Idle-Free Campaign was based on the EPA’s Idle-Free Schools Toolkit for a Healthy School Environment. The personalized campaign was parent-led and received approval from the Bonneville Elementary School principal and PTA. In November 2019, pledge packets (Appendix A, Figure A5, Figure A6, Figure A7, Figure A8, Figure A9, Figure A10, Figure A11, Figure A12 and Figure A13) were distributed to the Bonneville Elementary School community which included students, teachers, staff, bus drivers, and delivery truck drivers. The pledge packet included a personalized letter describing the school’s idle-free policy, an educational flyer on vehicle idling, and a pledge form with a section for students to submit artwork. Bus drivers received an additional 6-page brochure from the EPA’s Idle-Free Schools Toolkit for a Healthy School Environment [37]. Incentives to complete the pledge packets included “Turn your key be idle free” window decals and a school-wide celebration. Window decals were obtained from the CAC and the Utah Department of Health, Utah Asthma Program. There was a display created by a CAC member in the school foyer tracking progress of the returned pledges (Appendix A, Figure A14). To further encourage participation in the idle-free campaign, reciprocal determinism from the Social Cognitive theory was utilized by highlighting a “Clean Air Champion” [55] over the broadcast system at the school during afternoon announcements (Appendix A, Figure A15). Pledge packets printing costs (other than the bus brochure) and “Clean Air Champion” supplies were covered by the school and PTA budget, respectively.
In December 2019, the school principal started displaying AQI [7] flags obtained from the Utah Department of Health, Utah Asthma Program in front of the school and easily visible to drivers (Appendix A, Figure A16). These flags corresponded to the air quality for the day. For example, a green flag was displayed when the forecasted day’s AQI from the Utah Department of Environmental Quality (DEQ) Division of Air Quality (DAQ) was between 0 and 50. The Utah DEQ air quality projection for the day was used rather than real-time air quality measurements.
Moreover, during this month, the CAC held their first driver contact event. Eight CAC volunteers approached drivers who were not idling during morning drop-off and afternoon pick-up at the school, thanked them for not idling, and gifted them with a personalized keychain (Figure 2). The keychain had the “Turn your key be idle free” (from the EPA Idle-Free Schools Toolkit) logo on one side (Figure 2a) and the Bonneville Elementary School (Figure 2b) logo on the other side. Keychain costs were covered by the PTA budget. This event was modified from the original EPA Idle-Free Schools Toolkit for a Healthy School Environment to only reach out to drivers who were not idling upon the request of the PTA and CAC members. Therefore, drivers who were idling were not contacted to keep the campaign positive. Artwork submitted on students’ idle-free pledges was turned into yard signs and displayed (Appendix A, Figure A17). Yard sign materials were supplied by the school’s PTA president. Local media outlets were invited to attend the morning drop-off event to spread awareness to the larger community. A second driver contact event was scheduled for mid-April 2020 but was canceled due to the school transitioning to virtual learning in response to the COVID-19 pandemic.
In February 2020, the Cleo the Lioness mascot from the Utah Royals Football Club, and representatives from the Utah Clean Air Partnership (UCAIR) and Broadway Media Stations were invited to the school during afternoon pick-up. Cleo greeted students and other community members, rewarding drivers who were not idling with Utah Royals Football Club game tickets. The “Clean Air Champion” randomly selected that afternoon also received game tickets from Cleo the Lioness. Cleo’s visit was not originally part of the campaign and was a surprise invitation from a parent at the school.
One limitation of the Idle-Free Campaign was that some students were unclear on the difference between the idle-free pledges and the “Clean Air Champions”. This may have been mitigated by introducing the “Clean Air Champions” at a different time than the idle-free pledges or having clearer information on how to pledge to be idle free. A limitation of the AQI flags was that there was not an education piece for the parents; therefore, some community members may not have known what the flags were for.

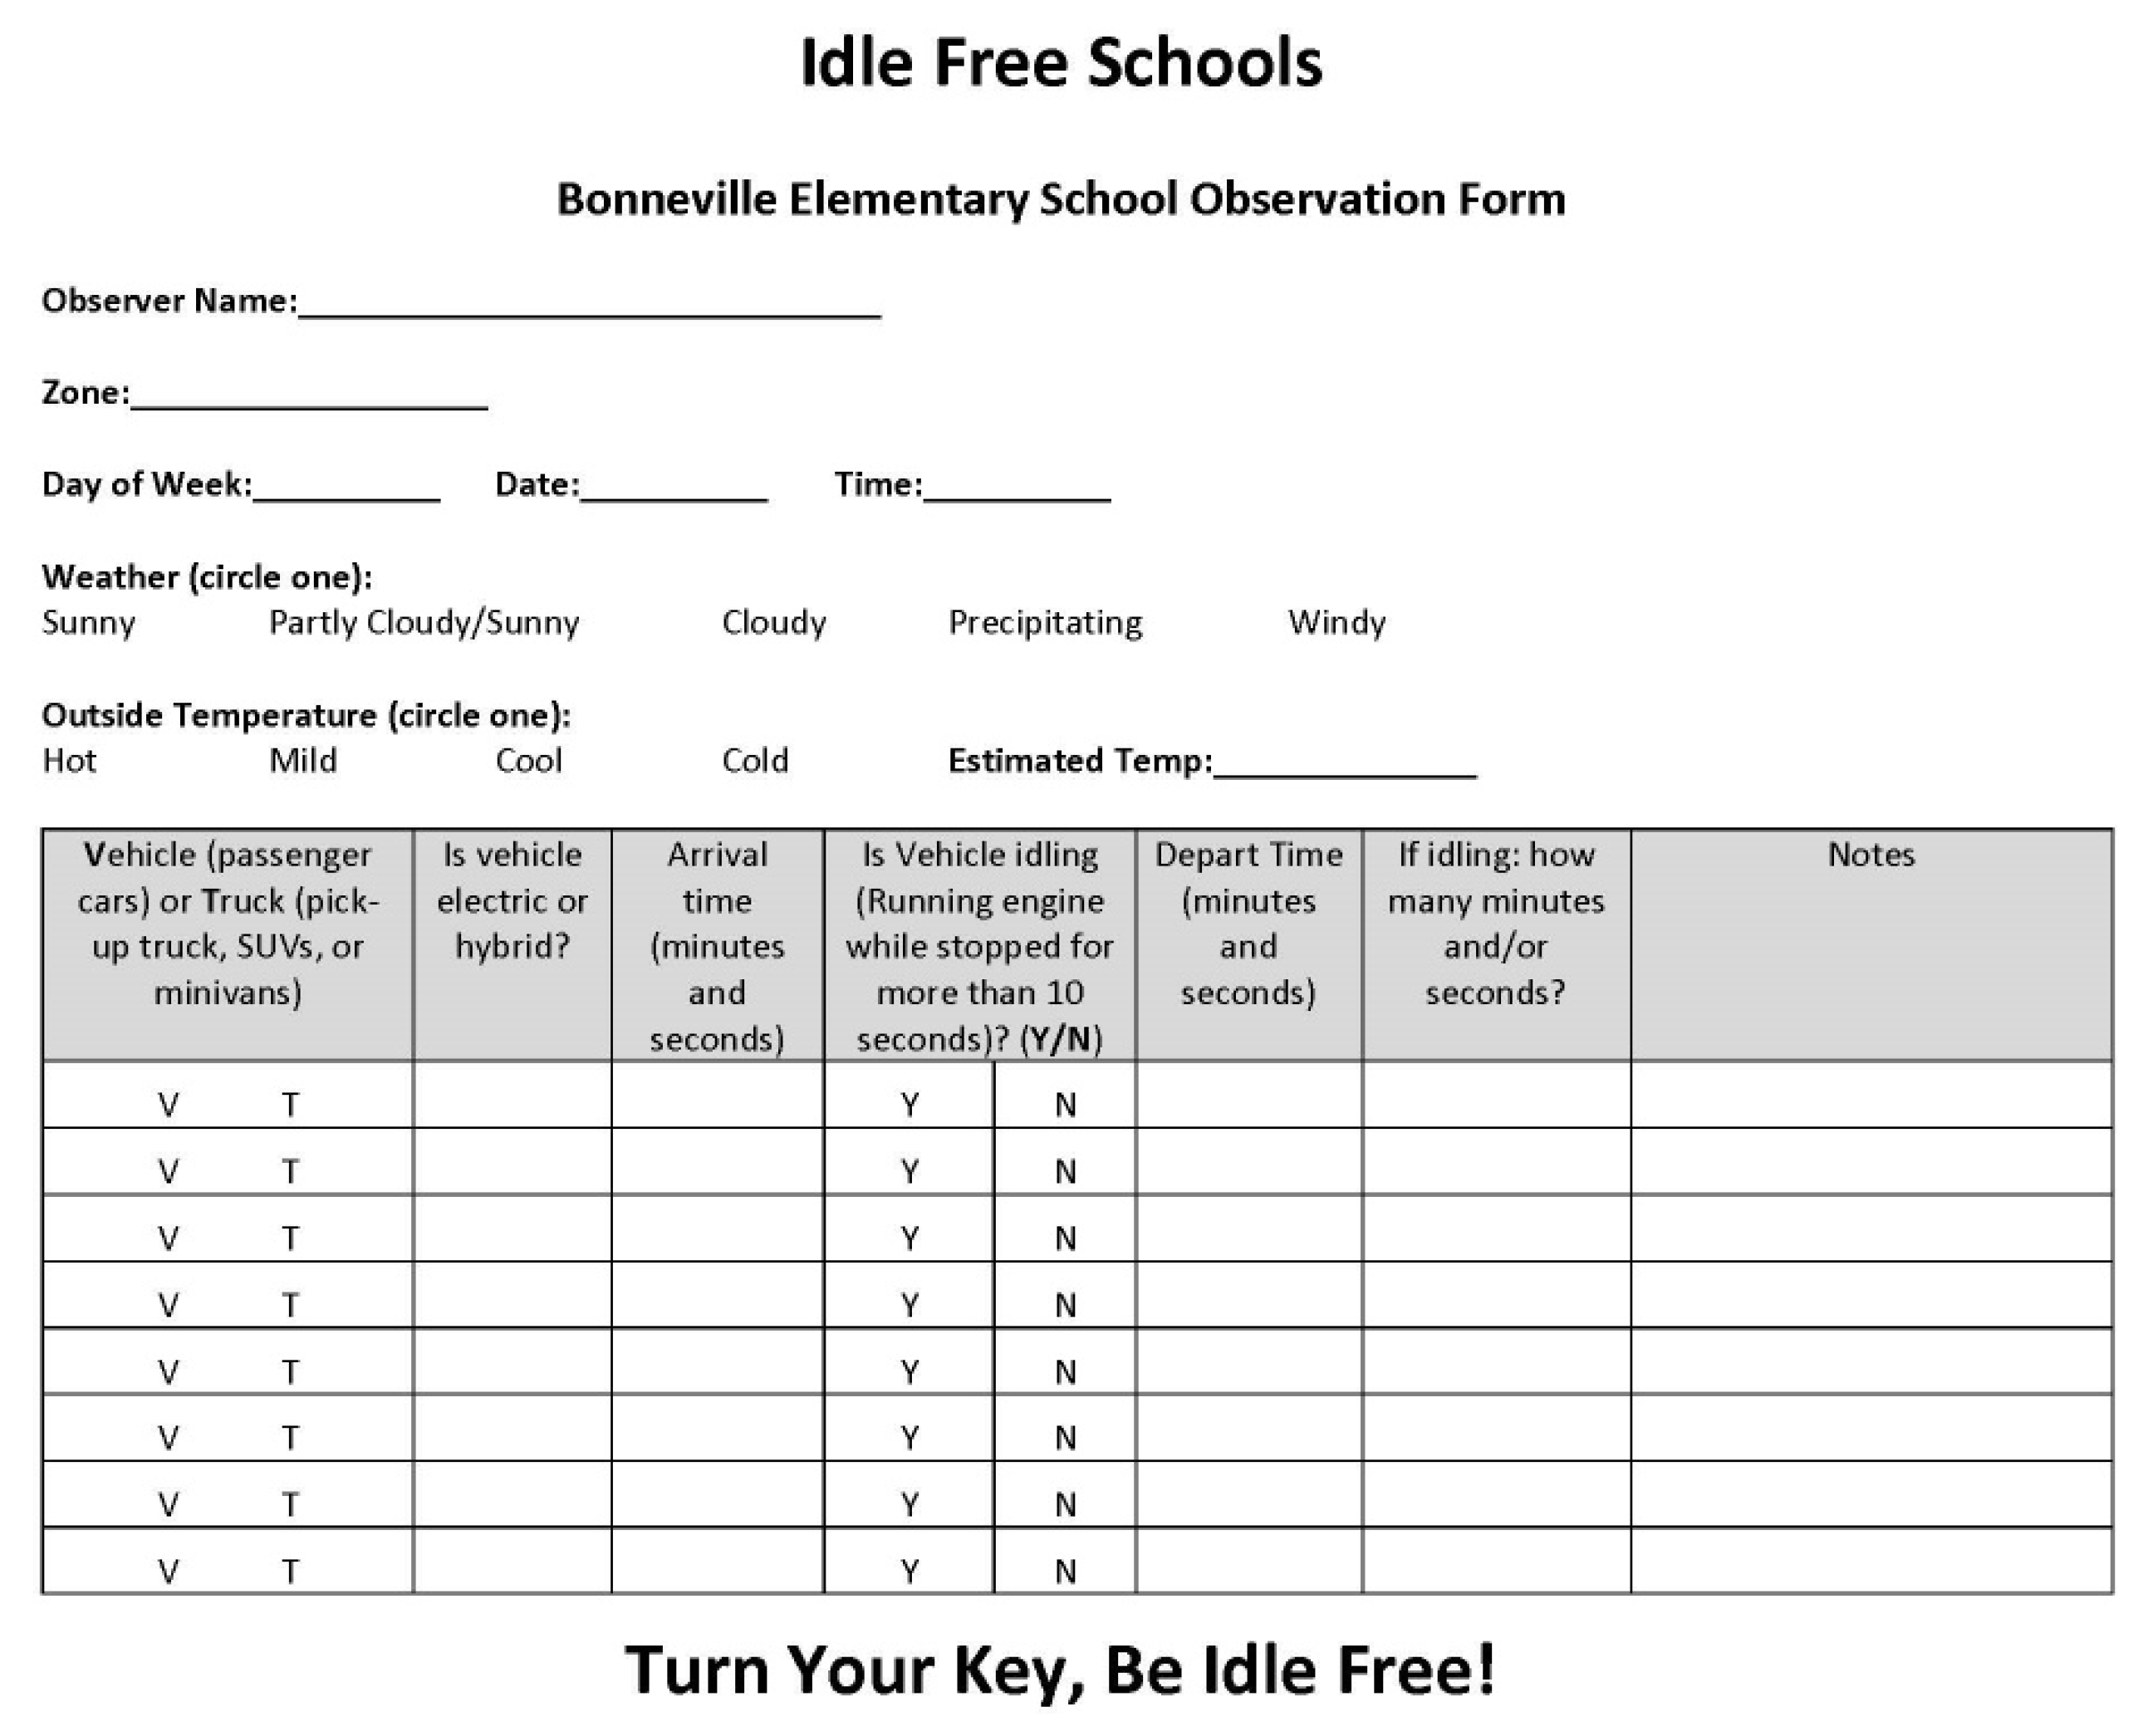
2.5. Vehicle Count Campaign

Prior to the start of the 2019–2020 Idle-Free Campaign, idling behaviors were recorded. Eleven parent volunteers were recruited through the CAC email listserv and word of mouth. Scheduling was done through a shared Google spreadsheet and volunteers were trained via educational emails. Follow-up training in person was available if requested by volunteers. Volunteers were instructed to record their observation zone, day of the week, date, time, weather conditions (sunny, partly cloudy/sunny, cloudy, precipitation, or windy), the outside temperature (hot, mild, cool, or cold), the estimated temperature (°F converted to °C), if the vehicle was a passenger car (“Vehicle”), or larger vehicle such as a Sport Utility Vehicle (SUV) or truck (“Truck”), if the vehicle was electric or hybrid, when the vehicle arrived in hours, minutes and seconds, if the vehicle was idling for more than 10 s, when the vehicle departed, and how many seconds the vehicle was idling for if applicable (Appendix A, Figure A18). School buses were not counted by the volunteers. A consistent online clock with seconds was used to keep track of the time and volunteers were instructed to change their mobile phone settings to prevent their phones from auto-locking. Volunteers were instructed to not record any identifiable information but could take notes on the color and make of vehicle to help keep track of idling behaviors. Volunteers were also instructed, with recommendation from the EPA Idle-Free Schools Toolkit for a Healthy School Environment, to tell curious parents that they were observing traffic to help school programs. Clipboards and pens were supplied by the PTA and costs to print observational forms were covered by the school.
An email was sent to the Bonneville Elementary School community letting them know that volunteers would be observing traffic during the week of 16 through 20 September 2019. This email read, “Next week, 16 September through 20 September, we will have volunteers observing traffic during drop-off and pick-up times at our school. The information from this observation will be used to help support activities promoting a safe and healthy environment at our school”.
Observations were conducted Monday, 16 September through Friday, 20 September 2019, at five locations (Figure 3) surrounding the school during morning drop-off (8:00 a.m.–8:45 a.m.), afternoon pick-up (2:45 p.m.–3:15 p.m.), and at one location during kindergarten half-day pick up (12:35 p.m.–1:05 p.m.). Only one location (1900 E) was observed during kindergarten half-day pick-up because of the limited number of vehicles picking up at this time. Observation materials and observation records were kept in a locked PTA room and collected daily. Data were then input into Microsoft Excel [52] and analyzed.
Post-campaign observations were conducted Tuesday, 18 February through Friday, 21 February 2020, at the same locations and times. This was originally scheduled as the mid-campaign observations with the post-campaign observations scheduled for mid-April; however, the school transitioned to virtual learning in mid-March in response to the COVID-19 pandemic. Observations were not conducted on Monday, 17 February 2020, as it was Presidents’ Day and school was not in session. Nine parent volunteers were recruited through the CAC email listserv, an email from the principal to the school community, and by word of mouth. Six of the nine post-campaign observation volunteers had volunteered during the pre-campaign observations. Volunteers were trained in the same way as the pre-campaign observations. Observation materials and observation records were kept in a locked PTA room and collected daily. Data were then input into Microsoft Excel [52] and analyzed.
A limitation of the observation campaign was that volunteers were often not able to identify a vehicle as electric or hybrid. This was a substantial data-gathering effort, especially during the busiest times; therefore, we have not included that data for the analysis. An additional challenge during the pre-campaign observations was that parents were concerned about volunteers recording identifiable information and parent curiosity. Furthermore, cold temperatures led to malfunctioning pens during the post-campaign observations, so pencils were used instead. Another challenge during the post-campaign observations was recruiting enough parent volunteers to observe at each designated location. Only locations that had both pre- and post-data were used which removed the use of Monday data.

2.6. EPA’s Idle-Free Schools Toolkit for a Healthy School Environment

Based on the results from the focus group and community survey, it was determined that nearly all of those who participated from the school community thought idling was an issue at Bonneville Elementary School and that any campaign to address this issue should target drivers while being as positive as possible. Because of this, it was decided to deviate from the EPA’s Idle-Free Schools Toolkit for a Healthy School Environment [37] in a few ways. Although the EPA recommended involving students in the campaign, the school did not approve student participation due to possible safety concerns around traffic. Instead, it was decided to involve students and their families in a positive way by creating the “Clean Air Champions” and adding the art box to the idle-free pledge. The incentive for pledges also differed from the EPA Toolkit in that it was decided to have a school-wide benchmark rather than competition between classes. It was also not possible to include specific educational content on air quality and pollution in the school curriculum due to time constraints. Information was regularly sent out to the school community regarding the idle-free campaign; however, the language used in this study differed from the sample school newsletter provided in the EPA Toolkit. One major deviation in this study from the EPA Toolkit was implemented during the driver contact event. The EPA Toolkit recommended that drivers who were idling be contacted and reminded of the school’s no-idling policy and offered a flyer. We decided against this action and the use of flyers during the driver contact event in this study with the aim of keeping the campaign as positive as possible. A second driver contact event was added to the campaign; however, it was canceled due to COVID-19-related school closures. Lastly, it was decided to analyze the data collected differently from the EPA toolkit to better answer the research questions. The EPA toolkit recommended students use the data collected to determine how much gasoline was used while idling during pick-up or drop-off and provided formulas to estimate this based on vehicle type and provided a formula for calculating the gasoline costs associated with the idling behavior.

3. Results

3.1. Focus Group and Community Survey Results

The main themes identified from the study focus group were negative feelings surrounding air pollution, parental guilt surrounding childhood exposure to air pollutants, personal physical and mental health problems due to air pollution, and identifying idling as a convenience and luxury. It was also found that parents from the focus group and PTA wanted to keep a future idle-free campaign positive with the responsibility placed on the parents rather than the children.
A total of 52 (13%) respondents (Table 1 and Table 2) completed the survey with a student body of around 400 students. All respondents identified as a parent when asked about their relationship with the school. Most parents were female (81%) (Table 1), white (88%) (Appendix A, Table A1), between the ages of 35 and 44 years (77%) (Appendix A, Table A2), and had high levels of education (31% with master’s degree and 21% with doctoral or professional degree) (Table 2). Almost all participants (98%) stated they thought idling impacted human health, 69% thought idling was a problem at Bonneville Elementary School, and 39% cited temperature as a barrier to being idle-free. Fisher’s Exact [56] tests used to analyze differences in gender (p-value = 0.278) and education (p-value = 0.332) against perceptions on idling found no statistical difference. One participant responded, “I would rather not say,” for gender, and for education level two participants responded, “I would rather not say,” and one, “other”; these responses were not included in the analysis.

3.2. Idling Behavior

Table 3, Table 4 and Table 5 list the total vehicle counts during the pre-intervention week, post-intervention week, and the difference between the two, respectively. For clarity purposes, the term “Vehicles”, which represented passenger cars (not trucks) in the survey was renamed “Cars”. Several patterns stand out in the results. First, trucks account for approximately 70% of the total vehicle counts dropping off children at the school. This is not surprising since Utah is a mountainous state in the American West with substantial outdoor recreation areas where SUVs and trucks are preferred. The EPA’s National Emission Inventory (NEI) has quantified the emissions contribution from these vehicle types in many instances [57]. Secondly, despite the seasonal differences and the Idle-Free Campaign, the number of total vehicles did not vary substantially. Lastly, there were marked differences between the observed vehicle counts throughout the week. This is mainly due to the limited and variable number of volunteers available to count vehicles at different drop-off and pick-up points during the study.
The values in the difference Tables 5, 8 and 11 were calculated using the formula described in Equation (1):
100 %   ( p o s t p r e ) p r e
where “post” is the post-intervention value and “pre” is the pre-intervention value. A negative value means there was a reduction, and a positive value shows an increase. Furthermore, an asterisk “∗” is used to denote when the value was zero during the pre-intervention week as it would have led to a division by zero error.
Table 6, Table 7 and Table 8 list the idling vehicle counts during the pre-intervention week, post-intervention week, and the difference between the two, respectively. A consistent pattern is that idling occurs more frequently during the morning drop-off times compared to the afternoon pick-up times. It is likely that cooler morning temperatures encourage drivers to idle to maintain a warm vehicle cabin. However, it is also possible that the morning drop-off process is less efficient than the afternoon pick-up time as there may be more parents dropping students off at the same time. There is also nearly no difference between the total vehicle fleet composition and the idling vehicle fleet composition–trucks compose approximately 70% of both. With few exceptions, there was a relatively uniform decrease in idling vehicles, with a combined 17–18% decrease. Morning drop-off and noon pick-up idling decreased nearly universally, and the only increases were found during afternoon pick-up.
Table 9, Table 10 and Table 11 list the vehicle idling time during the pre-intervention week, post-intervention week, and the difference between the two, respectively. In a similar manner as the idling vehicle counts, idling occurs more frequently during the morning drop-off times compared to the afternoon pick-up times. Cars reduced the overall idling time by 59% and trucks by 28%. Given the fleet composition, this resulted in an overall reduction of 37% in total idling time, with a larger reduction taking place in the morning drop-off time.

4. Discussion

4.1. Potential Emissions Reductions

The EPA’s MOtor Vehicle Emissions Simulator 3 (MOVES3) model [58] was used to estimate emission factors (g/hr) for five pollutants of interest commonly emitted from vehicles: carbon monoxide (CO), nitrogen oxides (NOx), ammonia (NH3), volatile organic compounds (VOC), and total exhaust fine particulate matter (PM2.5). MOVES3 calculates emission factors for different vehicle types (e.g., light-duty vehicles), activity types (e.g., idling), road types (e.g., arterial roads) under various meteorological conditions [58]. Emission factors were developed for both a winter month (February) and a summer month (July) using vehicle fuel consumption (gasoline [E10], diesel, and ethanol fuel blend [E85]) distribution consistent with the local fleet. These emission factors were multiplied by the observed idling reduction (Table 11) to calculate potential emissions reductions (Table 12 and Table 13). The seasonal variation of emission factors is clearly shown in Table 12 and Table 13; summer emission factors are consistently higher than winter emission factors. Due to the larger summer emission factors, there is a notable difference between the potential emissions avoided due to the observed idling reductions. The quantified avoided emissions are only part of the story. It must also be noted that travel emissions to the school as well as cold and warm starts are substantial contributors to air pollution at the school. Avoided emissions during the winter lessen accumulation and secondary pollutant formation during inversions, while lower NOx and VOC emissions are critical to reducing the formation of summertime ozone [59]. Furthermore, the impact of idling reduction on CO2 emissions is substantial.

4.2. Policy Implications

This study showed the substantial level of concern parents have towards their children’s air pollution exposure as shown by the survey results. While the participants in the survey could have represented a specific interested demographic, it demonstrated that parents are invested in their children’s health and are ready to mobilize when provided with information. Furthermore, teachers, staff, bus drivers, and delivery truck drivers worked together to reduce their impact on air pollution and embraced this campaign. These findings are in line with previous studies showing the impact of information on air pollution affecting behavior [60].
Bonneville Elementary School is one of nearly 40 schools in the SLCSD. SLC is one of Utah’s cities that has pledged and is planning to become carbon neutral by 2040. The school’s CAC has substantial traction, along with the PTA to enact change and this was demonstrated by the concerted efforts surrounding the Idle-Free Campaign. This effort can be replicated across the SLCSD and beyond as students return to in-person teaching.
While the estimated emissions reductions are modest, they only represent a small subset of potential air quality benefits at school sites. This study only examined drop-off and pick-up behavior by parents. Teacher, staff, bus drivers, delivery truck drivers, and other school activity vehicle emissions were not part of this study. Furthermore, this campaign focused on only one school and one week. If this effort leads to a permanent behavioral change and is expanded across SLC and beyond, the emissions reductions would be sizable. A recent incentive by the SLC Mayor’s office provides free transit passes to all SLCSD students, teachers, and staff [61] which may encourage overall driving reductions.

4.3. Limitations

The COVID-19 pandemic prevented a follow-up vehicle counting effort scheduled for April 2020. There were no further Idle-Free Campaign events scheduled between February and April 2020 to understand whether parents’ behavior would revert to idling or if the reductions would be long-lasting without further intervention. In-person school stopped in the middle of March 2020 so this critical step was not conducted and should be studied in further efforts.
The focus group was attended by only four parents which is a very small sample size and likely not representative of the full population. However, the survey was answered by 52 parents representing approximately 13% of the student body (~400). It is possible that the parents who invested the time in participating in both the focus group and survey may have biased the survey results as they would be generally considered to be more involved and could potentially be more interested in reducing vehicular pollution near schools than other parents who did not participate. A larger sample size would reduce some of these potential errors.
Due to a partial lack of volunteers, the vehicle counting efforts also have inherent biases. Although the main road access to the school (1900 E) was fully surveyed, the other four surrounding roads had less regular coverage. This could lead to both spatial and temporal biases, but as these are less trafficked roads for student drop-off and pick-up, the effect is expected to be minimal. However, a more comprehensive effort with more volunteers or an automated system using cameras and air pollution sensors that is not dependent on volunteer schedules is recommended for follow-up work.

5. Conclusions

This study was the first step in an effort to reduce idling in schools and highlighted an important concern that parents share regarding their children’s air pollution exposure. The Idle-Free Campaign initiated by the school’s CAC and PTA involved parents, teachers, staff, bus drivers, and delivery truck drivers. While the number of total vehicles stayed relatively constant, the number of idling vehicles dropped by 17%, and the idling time dropped by 37%. Based on these results, it is recommended that elementary schools consider implementing a personalized idle-free campaign. Future research involving multiple schools would be beneficial to better understand idle-free campaigns in diverse populations, reduce toxic air pollutants, and potentially improve the health of children in those communities. Additional projects should focus on promoting alternatives to driving as wintertime cold starts are responsible for most vehicle emissions and summertime reductions would also lead to improved air quality.

Author Contributions

Conceptualization, D.L.M., J.R.C., M.B. and R.T.F.; methodology, D.L.M., J.R.C., M.B., R.B. and R.T.F.; software, D.L.M.; validation, D.L.M. and R.T.F.; formal analysis, D.L.M.; investigation, D.L.M., M.B. and R.T.F.; resources, D.L.M. and R.T.F.; data curation, D.L.M. and R.B.; writing—original draft preparation, C.S.O., D.L.M., E.T.C., M.B. and R.T.F.; writing—review and editing, C.S.O., D.L.M., E.T.C., R.B. and R.T.F.; visualization, D.L.M. and M.B.; supervision, R.T.F.; project administration, R.T.F.; funding acquisition, R.T.F. All authors have read and agreed to the published version of the manuscript.

Funding

This research was funded by Westminster College Summer Undergraduate Research Program.

Institutional Review Board Statement

The study was determined to be IRB exempt.

Informed Consent Statement

Informed consent was obtained from all subjects involved in the study.

Data Availability Statement

Data available upon request.

Acknowledgments

Bonneville Elementary School Clean Air Committee; Gregory Lohrke–United States Environmental Protection Agency Region 8|Air and Radiation Division Air Toxics, Radiation and Modeling Branch; Utah Asthma Program-Utah Department of Health; Richard McKeague III and Greg Mortensen-Inventory Section, Utah Division of Air Quality.

Conflicts of Interest

The authors declare no conflict of interest. The funders had no role in the design of the study; in the collection, analyses, or interpretation of data; in the writing of the manuscript, or in the decision to publish the results.

Appendix A

Table A1. Race distribution of survey respondents.
RaceResponses%
American Indian or Alaska Native00
Asian11.92
Black or African American00
Hispanic or Latino00
Native Hawaiian or Other Pacific Islander00
White4688.46
I would rather not say59.62
Total respondents52100
Table A2. Age distribution of survey respondents.
AgeResponses%
Under 15 years00
15–24 years00
25–34 years23.85
35–44 years4076.92
45–54 years917.31
55–64 years00
65 years and older00
I would rather not say11.92
Total respondents52100
Figure A1. Clean air campaign community survey page 1 of 3.
Vehicles 04 00048 g0a1
Figure A2. Clean air campaign community survey page 2 of 3.
Vehicles 04 00048 g0a2
Figure A3. Clean air campaign community survey page 3 of 3.
Vehicles 04 00048 g0a3
Figure A4. Clean air survey invitation flyer.
Vehicles 04 00048 g0a4
Figure A5. Idle-free schools flyer.
Vehicles 04 00048 g0a5
Figure A6. Idle-free schools pledge form for parents.
Vehicles 04 00048 g0a6
Figure A7. Idle-free schools policy for parents and delivery truck drivers.
Vehicles 04 00048 g0a7
Figure A8. Idle-free schools letter to teachers and staff.
Vehicles 04 00048 g0a8
Figure A9. Idle-free schools pledge form for teachers and staff.
Vehicles 04 00048 g0a9
Figure A10. Idle-free schools letter to delivery truck drivers.
Vehicles 04 00048 g0a10
Figure A11. Idle-free schools pledge form for delivery truck drivers.
Vehicles 04 00048 g0a11
Figure A12. Idle-free schools letter to bus drivers.
Vehicles 04 00048 g0a12
Figure A13. Idle-free schools policy for bus drivers.
Vehicles 04 00048 g0a13
Figure A14. Display at school foyer tracking progress of returned pledge forms.
Vehicles 04 00048 g0a14
Figure A15. Clean air champion (CAC) display at school foyer.
Vehicles 04 00048 g0a15
Figure A16. Air quality index (AQI) flag display in front of Bonneville Elementary School.
Vehicles 04 00048 g0a16
Figure A17. Student art display at school foyer.
Vehicles 04 00048 g0a17
Figure A18. Bonneville Elementary School observation form.
Vehicles 04 00048 g0a18

References

  1. Jacobson, M.Z. Air Pollution and Global Warming: History, Science, and Solutions; Cambridge University Press: Cambridge, UK, 2012. [Google Scholar]
  2. United States Environmental Protection Agency. Air Pollution Emissions Overview. Available online: https://www3.epa.gov/airquality/emissns.html (accessed on 3 August 2022).
  3. United States Environmental Protection Agency. Criteria Air Pollutants. Available online: https://www.epa.gov/criteria-air-pollutants (accessed on 13 July 2022).
  4. World Health Organization. Air Pollution Levels Rising in Many of the World’s Poorest Cities; WHO: Geneva, Switzerland, 2016. [Google Scholar]
  5. World Health Organization. Ambient (Outdoor) Air Pollution. Available online: https://www.who.int/news-room/fact-sheets/detail/ambient-(outdoor)-air-quality-and-health (accessed on 13 July 2022).
  6. United States Environmental Protection Agency. Our Nation’s Air Trends through 2021. Available online: https://gispub.epa.gov/air/trendsreport/2022/ (accessed on 13 July 2022).
  7. United States Environmental Protection Agency. Air Quality Index (AQI) Basics. Available online: https://www.airnow.gov/aqi/aqi-basics/ (accessed on 1 August 2022).
  8. World Health Organization. Air Pollution. Available online: https://www.who.int/health-topics/air-pollution/ (accessed on 4 August 2022).
  9. United States Environmental Protection Agency. Smog, Soot, and Other Air Pollution from Transportation. Available online: https://www.epa.gov/transportation-air-pollution-and-climate-change/smog-soot-and-local-air-pollution (accessed on 13 July 2022).
  10. United States Environmental Protection Agency. Basic Information about Carbon Monoxide (CO) Outdoor Air Pollution. Available online: https://www.epa.gov/co-pollution/basic-information-about-carbon-monoxide-co-outdoor-air-pollution (accessed on 13 July 2022).
  11. United States Environmental Protection Agency. Basic Information about Lead Air Pollution. Available online: https://www.epa.gov/lead-air-pollution/basic-information-about-lead-air-pollution (accessed on 13 July 2022).
  12. United States Environmental Protection Agency. Basic Information about NO2. Available online: https://www.epa.gov/no2-pollution/basic-information-about-no2 (accessed on 13 July 2022).
  13. United States Environmental Protection Agency. Ground-level Ozone Basics. Available online: https://www.epa.gov/ground-level-ozone-pollution/ground-level-ozone-basics (accessed on 13 July 2022).
  14. United States Environmental Protection Agency. Particulate Matter (PM) Basics. Available online: https://www.epa.gov/pm-pollution/particulate-matter-pm-basics (accessed on 13 July 2022).
  15. United States Environmental Protection Agency. Sulfur Dioxide Basics. Available online: https://www.epa.gov/so2-pollution/sulfur-dioxide-basics (accessed on 13 July 2022).
  16. Hime, N.J.; Marks, G.B.; Cowie, C.T. A comparison of the health effects of ambient particulate matter air pollution from five emission sources. Int. J. Environ. Res. Public Health 2018, 15, 1206. [Google Scholar] [CrossRef]
  17. Turner, M.C.; Andersen, Z.J.; Baccarelli, A.; Diver, W.R.; Gapstur, S.M.; Pope, C.A., III; Prada, D.; Samet, J.; Thurston, G.; Cohen, A. Outdoor air pollution and cancer: An overview of the current evidence and public health recommendations. CA A Cancer J. Clin. 2020, 70, 460–479. [Google Scholar] [CrossRef]
  18. Ohlwein, S.; Kappeler, R.; Kutlar Joss, M.; Künzli, N.; Hoffmann, B. Health effects of ultrafine particles: A systematic literature review update of epidemiological evidence. Int. J. Public Health 2019, 64, 547–559. [Google Scholar] [CrossRef] [PubMed]
  19. Tran, V.V.; Park, D.; Lee, Y.-C. Indoor air pollution, related human diseases, and recent trends in the control and improvement of indoor air quality. Int. J. Environ. Res. Public Health 2020, 17, 2927. [Google Scholar] [CrossRef] [PubMed]
  20. Kumar, P.; Omidvarborna, H.; Pilla, F.; Lewin, N. A primary school driven initiative to influence commuting style for dropping-off and picking-up of pupils. Sci. Total Environ. 2020, 727, 138360. [Google Scholar] [CrossRef] [PubMed]
  21. Gasana, J.; Dillikar, D.; Mendy, A.; Forno, E.; Vieira, E.R. Motor vehicle air pollution and asthma in children: A meta-analysis. Environ. Res. 2012, 117, 36–45. [Google Scholar] [CrossRef] [PubMed]
  22. Perera, F.; Nadeau, K. Climate change, fossil-fuel pollution, and children’s health. N. Engl. J. Med. 2022, 386, 2303–2314. [Google Scholar] [CrossRef]
  23. Jerrett, M.; McConnell, R.; Chang, C.R.; Wolch, J.; Reynolds, K.; Lurmann, F.; Gilliland, F.; Berhane, K. Automobile traffic around the home and attained body mass index: A longitudinal cohort study of children aged 10–18 years. Prev. Med. 2010, 50, S50–S58. [Google Scholar] [CrossRef]
  24. Jerrett, M.; McConnell, R.; Wolch, J.; Chang, R.; Lam, C.; Dunton, G.; Gilliland, F.; Lurmann, F.; Islam, T.; Berhane, K. Traffic-related air pollution and obesity formation in children: A longitudinal, multilevel analysis. Environ. Health 2014, 13, 49. [Google Scholar] [CrossRef]
  25. Horne, B.D.; Joy, E.A.; Hofmann, M.G.; Gesteland, P.H.; Cannon, J.B.; Lefler, J.S.; Blagev, D.P.; Korgenski, E.K.; Torosyan, N.; Hansen, G.I. Short-term elevation of fine particulate matter air pollution and acute lower respiratory infection. Am. J. Respir. Crit. Care Med. 2018, 198, 759–766. [Google Scholar] [CrossRef]
  26. Lee, S.-Y.; Jang, M.-j.; Oh, S.H.; Lee, J.H.; Suh, M.-W.; Park, M.K. Associations between particulate matter and otitis media in children: A meta-analysis. Int. J. Environ. Res. Public Health 2020, 17, 4604. [Google Scholar] [CrossRef] [PubMed]
  27. Wang, H.; Zhang, H.; Li, J.; Liao, J.; Liu, J.; Hu, C.; Sun, X.; Zheng, T.; Xia, W.; Xu, S. Prenatal and early postnatal exposure to ambient particulate matter and early childhood neurodevelopment: A birth cohort study. Environ. Res. 2022, 210, 112946. [Google Scholar] [CrossRef] [PubMed]
  28. Filippini, T.; Hatch, E.E.; Rothman, K.J.; Heck, J.E.; Park, A.S.; Crippa, A.; Orsini, N.; Vinceti, M. Association between outdoor air pollution and childhood leukemia: A systematic review and dose–response meta-analysis. Environ. Health Perspect. 2019, 127, 046002. [Google Scholar] [CrossRef] [PubMed]
  29. Ge, J.C.; Wu, G.; Yoo, B.-O.; Choi, N.J. Effect of injection timing on combustion, emission and particle morphology of an old diesel engine fueled with ternary blends at low idling operations. Energy 2022, 253, 124150. [Google Scholar] [CrossRef]
  30. Ge, J.C.; Yoon, S.K.; Song, J.H. Combustion and Emission Characteristics of a Diesel Engine Fueled with Crude Palm Oil Blends at Various Idling Speeds. Appl. Sci. 2022, 12, 6294. [Google Scholar] [CrossRef]
  31. United States Environmental Protection Agency. School Bus Idle Reduction. Available online: https://www.epa.gov/dera/school-bus-idle-reduction (accessed on 13 July 2022).
  32. Salt Lake City. Salt Lake City’s Idle Free Ordinance. Available online: https://www.slc.gov/sustainability/air-quality/idle-free-ordinance/idle-free-ordinance/ (accessed on 13 July 2022).
  33. H.B. 148 Vehicle Idling Revisions. 2019. Available online: https://le.utah.gov/~2019/bills/static/HB0148.html (accessed on 1 August 2022).
  34. Eghbalnia, C.; Sharkey, K.; Garland-Porter, D.; Alam, M.; Crumpton, M.; Jones, C.; Ryan, P.H. A community-based participatory research partnership to reduce vehicle idling near public schools. J. Environ. Health 2013, 75, 14–19. [Google Scholar]
  35. Rumchev, K.; Lee, A.; Maycock, B.; Jancey, J. Reducing car idling at primary schools: An intervention study of parent behaviour change in Perth, Western Australia. Health Promot. J. Aust. 2021, 32, 383–390. [Google Scholar] [CrossRef]
  36. Simcoe Muskoka District Health Unit. “Turn it Off” Anti-Idling Campaign Report; Simcoe Muskoka District Health Unit: Barrie, ON, Canada, 2009. [Google Scholar]
  37. United States Environmental Protection Agency. Idle-Free Schools Toolkit for a Healthy School Environment. Available online: https://www.epa.gov/schools/idle-free-schools-toolkit-healthy-school-environment (accessed on 13 July 2022).
  38. Mendoza, D.L.; Benney, T.M.; Bares, R.; Fasoli, B.; Anderson, C.; Gonzales, S.A.; Crosman, E.T.; Bayles, M.; Forrest, R.T.; Contreras, J.R.; et al. Air Quality and Behavioral Impacts of Anti-Idling Campaigns in School Drop-Off Zones. Atmosphere 2022, 13, 706. [Google Scholar] [CrossRef]
  39. American Lung Association. State of the Air 2021; American Lung Association: Chicago, IL, USA, 2021. [Google Scholar]
  40. Google Maps. Available online: https://www.google.com/maps (accessed on 1 August 2022).
  41. USGS TNM Elevation Tool. Available online: https://apps.nationalmap.gov/elevation/ (accessed on 1 August 2022).
  42. INRIX Research. INRIX Global Traffic Score Card. 2020. Available online: https://inrix.com/scorecard-city/?city=Salt%20Lake%20City%2C%20UT&index=814 (accessed on 1 August 2022).
  43. Wasatch Front Regional Council. Utah Statewide Annual Average Daily Traffic (AADT)-Historic & Forecast. Available online: https://wfrc.org/traffic-volume-map/ (accessed on 13 August 2022).
  44. Carling, G.T.; Fernandez, D.P.; Rey, K.A.; Hale, C.A.; Goodman, M.M.; Nelson, S.T. Using strontium isotopes to trace dust from a drying Great Salt Lake to adjacent urban areas and mountain snowpack. Environ. Res. Lett. 2020, 15, 114035. [Google Scholar] [CrossRef]
  45. Bares, R.; Lin, J.C.; Hoch, S.W.; Baasandorj, M.; Mendoza, D.L.; Fasoli, B.; Mitchell, L.; Catharine, D.; Stephens, B.B. The Wintertime Covariation of CO2 and Criteria Pollutants in an Urban Valley of the Western United States. J. Geophys. Res. Atmos. 2018, 123, 2684–2703. [Google Scholar] [CrossRef]
  46. Crosman, E.T.; Horel, J.D. Winter lake breezes near the Great Salt Lake. Bound.-Layer Meteorol. 2016, 159, 439–464. [Google Scholar] [CrossRef]
  47. Hallar, A.G.; Brown, S.S.; Crosman, E.; Barsanti, K.C.; Cappa, C.D.; Faloona, I.; Fast, J.; Holmes, H.A.; Horel, J.; Lin, J.; et al. Coupled Air Quality and Boundary-Layer Meteorology in Western US Basins during Winter: Design and Rationale for a Comprehensive Study. Bull. Am. Meteorol. Soc. 2021, 102, E2012––E2033. [Google Scholar] [CrossRef] [PubMed]
  48. Horel, J.; Crosman, E.T.; Jacques, A.; Blaylock, B.; Arens, S.; Long, A.; Sohl, J.; Martin, R. Summer ozone concentrations in the vicinity of the Great Salt Lake. Atmos. Sci. Lett. 2016, 17, 480–486. [Google Scholar] [CrossRef]
  49. Whiteman, C.D.; Hoch, S.W.; Horel, J.D.; Charland, A. Relationship between particulate air pollution and meteorological variables in Utah’s Salt Lake Valley. Atmos. Environ. 2014, 94, 742–753. [Google Scholar] [CrossRef]
  50. Baasandorj, M.; Hoch, S.W.; Bares, R.; Lin, J.C.; Brown, S.S.; Millet, D.B.; Martin, R.; Kelly, K.; Zarzana, K.J.; Whiteman, C.D.; et al. Coupling between Chemical and Meteorological Processes under Persistent Cold-Air Pool Conditions: Evolution of Wintertime PM2.5 Pollution Events and N2O5 Observations in Utah’s Salt Lake. Valley. Environ. Sci. Technol. 2017, 51, 5941–5950. [Google Scholar] [CrossRef]
  51. Mendoza, D.L.; Benney, T.M.; Boll, S. Long-term analysis of the relationships between indoor and outdoor fine particulate pollution: A case study using research grade sensors. Sci. Total Environ. 2021, 776, 145778. [Google Scholar] [CrossRef]
  52. Microsoft Corporation. Microsoft Excel, Microsoft Corporation: Redmond, WA, USA, 2019.
  53. Momentive Inc. SurveyMonkey; Momentive Inc.: San Mateo, CA, USA.
  54. R Core Team. A Language and Environment for Statistical Computing. Vienna, Austria: R Foundation for Statistical Computing. 2021. Available online: https://www.R-project.org (accessed on 1 August 2022).
  55. Rimer, B.K.; Glanz, K. Theory at a Glance: A Guide for Health Promotion Practice; NIH Publication: Bethesda, MD, USA, 2005. [Google Scholar]
  56. Bower, K.M. When to use Fisher’s exact test. In American Society for Quality, Six Sigma Forum Magazine; American Society for Quality: Milwaukee, WI, USA, 2003; pp. 35–37. [Google Scholar]
  57. United States Environmental Protection Agency. National Emissions Inventory (NEI). 2016. Available online: https://www.epa.gov/air-emissions-inventories/national-emissions-inventory-nei (accessed on 1 August 2022).
  58. United States Environmental Protection Agency. MOVES3 Technical Guidance: Using MOVES to Prepare Emission Inventories for State Implementation Plans and Transportation Conformity; United States Environmental Protection Agency: Washington, DC, USA, 2020. [Google Scholar]
  59. Simon, H.; Reff, A.; Wells, B.; Xing, J.; Frank, N. Ozone trends across the United States over a period of decreasing NOx and VOC emissions. Environ. Sci. Technol. 2015, 49, 186–195. [Google Scholar] [CrossRef]
  60. Mendoza, D.L.; Buchert, M.P.; Benney, T.M.; Lin, J.C. The Association of Media and Environmental Variables with Transit Ridership. Vehicles 2020, 2, 507–522. [Google Scholar] [CrossRef]
  61. Williams, C. 25K transit passes going to Salt Lake students, teachers in ‘historic commitment’. Available online: https://www.ksl.com/article/50456527/25k-transit-passes-going-to-salt-lake-students-teachers-in-historic-commitment (accessed on 10 August 2022).
Figure 1. Salt Lake City and Salt Lake County within Utah and the United States (left inset) with the study school and interstate highways (I-15, I-80, I-215) noted.
Vehicles 04 00048 g001
Figure 2. Both sides of keychains gifted to drivers not idling during morning drop-off and afternoon pick-up at Bonneville Elementary School: (a) “Turn your key be idle free” logo from Utah Clean Cities Coalition (https://utahcleancities.org/ [accessed on 1 December 2019]), courtesy of EPA Idle-Free Schools Toolkit for a Healthy School Environment; (b) Bonneville Elementary School logo.
Vehicles 04 00048 g002
Figure 3. Bonneville Elementary School Vehicle Counting Site locations. Volunteers counted the total number of vehicles, number of idling vehicles, and total time idling for each vehicle at the following highlighted streets: 1900 E (yellow), 2000 E (green), Harvard Avenue (purple), Yale Avenue (blue), Princeton Avenue (red). Image courtesy of Google Maps.
Vehicles 04 00048 g003
Table 1. Gender distribution of survey respondents and their perceptions on idling.
GenderSevere, Very SevereNot Severe, Slightly Severe, Moderately SevereTotals
Male639
Female311142
Total371451
Table 2. Education level achieved by survey respondents and their perceptions on idling.
Education LevelSevere, Very SevereNot Severe, Slightly Severe, Moderately SevereTotals
Bachelor’s degree or less18422
Graduate or professional degree18927
Totals361349
Table 3. Total vehicle counts during the pre-intervention week: 17–20 September 2019.
Site TuesdayWednesdayThursdayFridayTotal
AMNoonPMAMNoonPMAMNoonPMAMNoonPM
Temperature (°C)1316181321241318249910
Weather
Conditions
SunnySunnySunnySunnySunnySunny WindySunnySunnySunnyLight RainLight RainLight Rain
Cars143251411132311078
1900ETrucks33418227162651340814206
Total47720278203761663924284
Cars9 21 20 317
2000ETrucks11 718 1517 1381
Total20 919 1717 1698
Cars 5 0 1116
HarvardTrucks 11 1 1426
Total 16 1 2542
Cars 0 1 12
YaleTrucks 6 7 013
Total 6 8 115
Cars 0 5 27
PrincetonTrucks 4 2 612
Total 4 7 819
Cars23341117111823127120
TotalTrucks44435517384351640847338
Total67739628455462463974458
Table 4. Total vehicle counts during the post-intervention week: 18–21 February 2020.
Site TuesdayWednesdayThursdayFridayTotal
AMNoonPMAMNoonPMAMNoonPMAMNoonPM
Temperature (°C)−412−4−12−504−4−34
Weather
Conditions
SunnySunnySunnySunnySunnySunny WindySunnySunnySunnySunnySunnySunny
Cars152127310104211985
1900ETrucks24515204141881734720186
Total39727277241982155829271
Cars3 54 53 222
2000ETrucks14 817 109 1068
Total17 1321 1512 1290
Cars 8 6 115
HarvardTrucks 12 6 321
Total 20 12 436
Cars 0 0 11
YaleTrucks 13 4 1027
Total 13 4 1128
Cars 5 3 816
PrincetonTrucks 7 2 09
Total 12 5 825
Cars1822219315401321121139
TotalTrucks38543494282782534743311
Total56765687433183855864450
Table 5. Total vehicle counts difference (percent difference) between post-intervention week: 18–21 February 2020 and pre-intervention week: 17–20 September 2019. * denotes that there were no vehicles in the pre-intervention period and would have resulted in division by 0.
Site TuesdayWednesdayThursdayFridayTotal
AMNoonPMAMNoonPMAMNoonPMAMNoonPM
Cars1 (7)−1 (−33)10 (500)2 (40)2 (200)6 (150)−10 (−91)−1 (−100)1 (33)−2 (−9)0 (0)−1 (−10)7 (9)
1900ETrucks−9 (−27)1 (25)−3 (−17)−2 (−9)−3 (−43)−2 (−13)−8 (−31)3 (60)4 (31)−6 (−15)−1 (−13)6 (43)−20 (−10)
Total−8 (−17)0 (0)7 (35)0 (0)−1 (−13)4 (20)−18 (−49)2 (33)5 (31)−8 (−13)−1 (−11)5 (21)−13 (−5)
Cars−6 (−67) 3 (150)3 (300) 3 (150)3 (*) −1 (−33)5 (29)
2000ETrucks3 (27) 1 (14)−1 (−6) −5 (−33)−8 (−47) −3 (−23)−13 (−16)
Total−3 (−15) 4 (44)2 (11) −2 (−12)−5 (−29) −4 (−25)−8 (−8)
Cars 3 (60) 6 (*) −10 (−91)−1 (−6)
HarvardTrucks 1 (9) 5 (500) −11 (−79)−5 (−19)
Total 4 (25) 11 (1100) −21 (−84)−6 (−14)
Cars 0 (0) −1 (−100) 0 (0)−1 (−50)
YaleTrucks 7 (117) −3 (−43) 10 (*)14 (108)
Total 7 (117) −4 (−50) 10 (1000)13 (87)
Cars 5 (*) −2 (−40) 6 (300)9 (129)
PrincetonTrucks 3 (75) 0 (0) −6 (−100)−3 (−25)
Total 8 (200) −2 (−29) 0 (0)6 (32)
Cars−5 (−22)−1 (−33)18 (450)8 (73)2 (200)8 (114)−7 (−64)−1 (−100)5 (63)−2 (−9)0 (0)−6 (−22)19 (16)
TotalTrucks−6 (−14)1 (25)8 (23)−2 (−4)−3 (−43)−10 (−26)−16 (−37)3 (60)9 (56)−6 (−15)−1 (−13)−4 (−9)−27 (−8)
Total−11 (−16)0 (0)26 (67)6 (10)−1 (−13)−2 (−4)−23 (−43)2 (33)14 (58)−8 (−13)−1 (−11)−10 (−14)−8 (−2)
Table 6. Idling vehicle counts during the pre-intervention week: 17–20 September 2019.
Site TuesdayWednesdayThursdayFridayTotal
AMNoonPMAMNoonPMAMNoonPMAMNoonPM
Temperature (°C)1316181321241318249910
Weather
Conditions
SunnySunnySunnySunnySunnySunny WindySunnySunnySunnyLight RainLight RainLight Rain
Cars1230211801140143
1900ETrucks2816123119262421105
Total4046144227273822148
Cars5 00 00 05
2000ETrucks6 39 512 742
Total11 39 512 747
Cars 1 0 34
HarvardTrucks 4 1 510
Total 5 1 814
Cars 0 1 12
YaleTrucks 3 3 06
Total 3 4 18
Cars 0 2 02
PrincetonTrucks 3 2 16
Total 3 4 18
Cars1730312803140556
TotalTrucks341152539312924214169
Total51415284113921238219225
Table 7. Idling vehicle counts during the post-intervention week: 18–21 February 2020.
Site TuesdayWednesdayThursdayFridayTotal
AMNoonPMAMNoonPMAMNoonPMAMNoonPM
Temperature (°C)−412−4−12−504−4−34
Weather
Conditions
SunnySunnySunnySunnySunnySunny WindySunnySunnySunnySunnySunnySunny
Cars815514001110036
1900ETrucks17081125918151683
Total2511316399192616119
Cars0 21 11 05
2000ETrucks13 111 24 334
Total13 512 35 341
Cars 2 1 03
HarvardTrucks 6 2 08
Total 8 3 011
Cars 0 0 00
YaleTrucks 6 2 311
Total 6 2 311
Cars 0 0 22
PrincetonTrucks 1 2 03
Total 1 2 25
Cars817815102110246
TotalTrucks3001628291311215112139
Total38125363141411426114187
Table 8. Idling vehicle counts difference (percent difference) between post-intervention week: 18–21 February 2020 and pre-intervention week: 17–20 September 2019. * denotes that there were no idling vehicles in the pre-intervention period and would have resulted in division by 0.
Site TuesdayWednesdayThursdayFridayTotal
AMNoonPMAMNoonPMAMNoonPMAMNoonPM
Cars−4 (−33)−2 (−67)5 (*)3 (150)0 (0)3 (300)−8 (−100)0 (0)0 (0)−3 (−21)0 (0)−1 (−100)−7 (−16)
1900ETrucks−11 (−39)−1 (−100)2 (33)−1 (−8)−1 (−33)4 (400)−10 (−53)−1 (−50)2 (33)−9 (−38)−1 (−50)5 (500)−22 (−21)
Total−15 (−38)−3 (−75)7 (117)2 (14)−1 (−25)7 (350)−18 (−67)−1 (−50)2 (29)−12 (−32)−1 (−50)4 (200)−29 (−20)
Cars−5 (−100) 2 (*)1 (*) 1 (*)1 (*) 0 (0)0 (0)
2000ETrucks7 (117) −2 (−67)2 (22) −3 (−60)−8 (−67) −4 (−57)−8 (−19)
Total2 (18) 2 (67)3 (33) −2 (−40)−7 (−58) −4 (−57)−6 (−13)
Cars 1 (100) 1 (*) −3 (−100)−1 (−25)
HarvardTrucks 2 (50) 1 (100) −5 (−100)−2 (−20)
Total 3 (60) 2 (200) −8 (−100)−3 (−21)
Cars 0 (0) −1 (−100) −1 (−100)−2 (−100)
YaleTrucks 3 (100) −1 (−33) 3 (*)5 (83)
Total 3 (100) −2 (−50) 2 (200)3 (38)
Cars 0 (0) −2 (−100) 2 (*)0 (0)
PrincetonTrucks −2 (−67) 0 (0) −1 (−100)−3 (−50)
Total −2 (−67) −2 (−50) 1 (100)−3 (−38)
Cars−9 (−53)−2 (−67)7 (*)5 (167)0 (0)3 (150)−7 (−88)0 (0)−1 (−33)−3 (−21)0 (0)−3 (−60)−10 (−18)
TotalTrucks−4 (−12)−1 (−100)1 (7)3 (12)−1 (−33)0 (0)−18 (−58)−1 (−50)3 (33)−9 (−38)−1 (−50)−2 (−14)−30 (−18)
Total−13 (−25)−3 (−75)10 (67)8 (29)−1 (−25)3 (27)−25 (−64)−1 (−50)2 (17)−12 (−32)−1 (−50)−5 (−26)−38 (−17)
Table 9. Idling time (seconds) during the pre-intervention week: 17–20 September 2019.
Site TuesdayWednesdayThursdayFridayTotal
AMNoonPMAMNoonPMAMNoonPMAMNoonPM
Temperature (°C)1316181321241318249910
Weather
Conditions
SunnySunnySunnySunnySunnySunny WindySunnySunnySunnyLight RainLight RainLight Rain
Cars938559010471006455200251133011226089
1900ETrucks1733816682090564219159745867130050309244
Total26716406683137664864211745892243350115215,333
Cars182 00 00 0182
2000ETrucks262 926409 3441853 10204814
Total444 92640903441853000010204996
Cars 133 0 267400
HarvardTrucks 95 166 12101471
Total00022800001660014771871
Cars 0 38 183221
YaleTrucks 253 163 0416
Total002530020100000183637
Cars 0 229 0229
PrincetonTrucks 225 843 301098
Total0022500000107200301327
Cars11205590118010068352002541133015727121
TotalTrucks199581207225945647263450451876130050229017,043
Total31156402072377466414093970452130243350386224,164
Table 10. Idling time (seconds) during the post-intervention week: 18–21 February 2020.
Site TuesdayWednesdayThursdayFridayTotal
AMNoonPMAMNoonPMAMNoonPMAMNoonPM
Temperature (°C)−412−4−12−504−4−34
Weather
Conditions
SunnySunnySunnySunnySunnySunny WindySunnySunnySunnySunnySunnySunny
Cars5043012037836980022457001645
1900ETrucks10840536546665092683644379829714806369
Total15883065692410260726836445914399714808014
Cars0 28431 1557 0387
2000ETrucks607 92431 1860194 1393323
Total607 3764620187525100001393710
Cars 80 272 0352
HarvardTrucks 170 225 0395
Total0002500000497000747
Cars 0 0 00
YaleTrucks 1085 545 641694
Total0010850054500000641694
Cars 0 0 540540
PrincetonTrucks 49 441 0490
Total004900000441005401030
Cars504304044893611357029445705402924
TotalTrucks1691017621147662914462364110398297168312,271
Total2195302166163610230275193641397143997222315,195
Table 11. Idling time difference in seconds (percent difference) between post-intervention week: 18–21 February 2020 and pre-intervention week: 17–20 September 2019. * denotes that there was no idling in the pre-intervention period and would have resulted in division by 0.
Site TuesdayWednesdayThursdayFridayTotal
AMNoonPMAMNoonPMAMNoonPMAMNoonPM
Cars−434
(−46)
−529
(−95)
120
(*)
−669
(−64)
−64
(−64)
−547
(−85)
−520
(−100)
0
(0)
−3
(−12)
−676
(−60)
0
(0)
−1122
(−100)
−4444
(−73)
1900ETrucks−649
(−37)
−81
(−100)
−132
(−20)
−1544
(−74)
−498
(−88)
290
(132)
−1329
(−83)
319
(709)
−430
(−50)
−318
(−24)
47
(94)
1450
(4833)
−2875
(−31)
Total−1083
(−41)
−610
(−95)
−12
(−2)
−2213
(−71)
−562
(−85)
−257
(−30)
−1849
(−87)
319
(709)
−433
(−49)
−994
(−41)
47
(94)
328
(28)
−7319
(−48)
Cars−182
(−100)
284
(*)
31
(*)
15
(*)
57
(*)
0
(0)
205
(113)
2000ETrucks345
(132)
−834
(−90)
22
(5)
1516
(441)
−1659
(−90)
−881
(−86)
−1491
(−31)
Total163
(37)
−550
(−59)
53
(13)
1531
(445)
−1602
(−86)
−881
(−86)
−1286
(−26)
Cars −53
(−40)
272
(*)
−267
(−100)
−48
(−12)
HarvardTrucks 75
(79)
59
(36)
−1210
(−100)
−1076
(−73)
Total 22
(10)
331
(199)
−1477
(−100)
−1124
(−60)
Cars 0
(0)
−38
(−100)
−183
(−100)
−221
(−100)
YaleTrucks 832
(329)
382
(234)
64
(*)
1278
(307)
Total 832
(329)
344
(171)
−119
(−65)
1057
(166)
Cars 0
(0)
−229
(−100)
540
(*)
311
(166)
PrincetonTrucks −176
(−78)
−402
(−48)
−30
(−100)
−608
(−55)
Total −176
(−78)
−631
(−59)
510
(1700)
−297
(−22)
Cars−616
(−55)
−529
(−95)
404
(*)
−691
(−59)
−64
(−64)
−570
(−83)
−463
(−89)
0
(0)
40
(16)
−676
(−60)
0
(0)
−1032
(−66)
−4197
(−59)
TotalTrucks−304
(−15)
−81
(−100)
−310
(−15)
−1447
(−56)
−498
(−88)
2188
(301)
−2988
(−87)
319
(709)
−773
(−41)
−318
(−24)
47
(94)
−607
(−27)
−4772
(−28)
Total−920
(−30)
−610
(−95)
94
(5)
−2138
(−57)
−562
(−85)
1618
(115)
−3451
(−87)
319
(709)
−733
(−34)
−994
(−41)
47
(94)
−1639
(−42)
−8969
(−37)
Table 12. Winter emission factors (EF) and potentially avoided emissions due to observed idling reductions.
PollutantWinter Car EF (g/hr)Winter Car
Emissions (g)
Winter Truck EF (g/hr)Winter Truck Emissions (g)Total Emissions (g)
CO1.8642.1742.6023.4485.622
NOx0.2180.2550.4860.6440.899
NH30.2670.3110.1870.2470.558
VOC0.9601.1190.6360.8431.962
PM2.50.0200.0240.0250.0330.057
Table 13. Summer emission factors (EF) and potentially avoided emissions due to observed idling reductions.
PollutantSummer Car EF (g/hr)Summer Car Emissions (g)Summer Truck EF (g/hr)Summer Truck Emissions (g)Total Emissions (g)
CO2.0262.3632.7533.6496.012
NOx0.7220.8421.6842.2323.074
NH30.2670.3110.1870.2470.558
VOC1.0701.2470.7070.9372.185
PM2.50.0210.0240.0250.0340.058
Publisher’s Note: MDPI stays neutral with regard to jurisdictional claims in published maps and institutional affiliations.

