1. Introduction
Electric vehicles are a growing market in Germany, with vehicle sales growing rapidly, and especially from 2020 onwards. The business models, such as those of charge point operators (CPOs), e-mobility service providers (EMPs), aggregators utilizing car batteries for vehicle-to-grid or grid-friendly charging, or vehicle manufacturers, all require an accurate estimate of the current vehicle market. Only by knowing how many vehicles with which battery energy are located where in Germany can these actors determine suitable business strategies, as well as grid- and market-stabilization strategies. Researchers and public administrators may use the provided data to create models and estimate the future trajectory of the vehicle and vehicle-battery market.
In this paper, we provide such an overview by merging public car-registry data with a vehicle catalogue, updating and extending our basic analyses in [
1]. By determining the battery energy, charging power, connector type, etc., for every car model individually, the analysis method is highly accurate. This separates this study from other works that used a more model-based approach [
2,
3], often with the aim of not only describing the current state of the electric vehicle (EV) deployment, but also predicting future developments. Our paper does not follow this approach because our goal is to describe the current market situation as accurately as possible, and it is not to make long-term predictions. We distinguish between battery electric vehicles (BEVs) (no combustion engine) and plug-in hybrid electric vehicles (PHEVs) throughout the analysis.
In the field of market reports, which are very similar in nature to what we show in this paper, several notable actors have brought forward their insights. EV Market Reports, for instance, collect material from other sources and curate a selection of works [
4]. In [
1], we also show a number of third-party studies that examine the German (stationary) battery market, which may serve as a suitable reference for the mobile-battery-storage market shown in this paper. However, the vast majority of actors create their own material [
2,
3,
5]. The description of the current status is often combined with a projection of future trends [
2,
3]. The emphases of the reports change with the most discussed topics at the time of publication and could include factors such as supply-chain risks, environmental aspects, raw-material requirements, etc. Given the scale of the challenges discussed, most of these publications have an international scope. Complementary to these market reports, national agencies frequently publish material on the state of the development in the country for which they are responsible [
6,
7,
8,
9,
10]. A third type of publications are scientific publications. Oftentimes, the focus of such papers is significantly narrower, and specific problems within the ecosystem of electromobility are solved. Bharathidasan et al. [
11] have provided a good overview of the current state of the literature in open-access format and pointing to different fields of research. For the sake of conciseness, and because the sources are linked in [
11], we do not list examples in this literature review. For an overview of other types of analyses that focus on usage instead of market developments, the reader is referred to [
12].
This Paper in the Context of the Literature
This paper combines aspects of the various types of studies listed. Similar to market reports, we aim to provide a bird-eye view of the current market—covering the location, quantity, and selected technical properties of EVs. Similar to reports from national agencies, however, we limit our analysis to one country, Germany, as this allows for a much more detailed analysis. This further allows us to outline how the results are obtained because source datasets are limited and unified. Lastly, given that this work is a research paper, we have ensured that the results and datasets are accessible and usable by others in the field. This is achieved through the publication of our results on the website
www.mobility-charts.de (accessed on 29 August 2022) [
13]. There, all the results, as well as more in-depth data, can be downloaded free of charge. The main contributions of the paper can consequently be summarized, as it is an in-depth analysis with high data transparency and with small uncertainty errors due to it being close to the published data.
2. Material and Methods
2.1. Data
This paper is based on two fundamental datasets: the public car registries of the Federal Motor Transport Authority [
14], and a database of technical car data. This section starts by first introducing both datasets. In the second section, we show how the data were merged to obtain the final datasets. Note that the methodology applied in this paper is of a relatively brief and simple nature. This was chosen to retain a high level of accuracy and representativeness by not performing excessive amounts of manual operations.
2.1.1. Registry of the Federal Office for Motor Vehicles of Germany
The Federal Motor Transport Authority (KBA) provides administrative data publicly and free of charge [
14]. The stock and new registrations of vehicles are presented through several data views (FZ). These data views differ in term of which data are given, how precise the breakdown is, and which parts of Germany are represented.
The KBA only publishes the manufacturer identification number (HSN) and first three digits of the vehicle identification number (TSN) in the statistics.
Table 1 presents an overview of the FZ used and their properties used for analysis. On the one hand, FZ1 and FZ28 are excellent for scaling because of the exact number of drive types. FZ2, FZ10, and especially FZ6, on the other hand, are suited for analysis due to the more precise breakdown. Although FZ2 has a wider range of regional data than FZ6, FZ6 is preferable for nationwide results because of the more precise breakdown by HSN and TSN.
2.1.2. Vehicle Data
A dataset was created containing the technical properties of vehicles, such as the battery energy, charging power, and connector type. This dataset was researched from sources such as the ADAC car catalogue [
15]. As outlined in the previous section, the KBA provides only the first three digits of the TSN, while the car catalogue is more detailed. This causes an uncertainty, as it is not possible to map an entry in the KBA 1:1 to an entry in the vehicle catalogue. For this reason, we show error margins in this paper where relevant.
2.2. Data Matching and Aggregation
To provide aggregated data, the following steps had to be taken:
Two mappings for manufacturer names and HSNs, as well as for car-model names and TSNs, were created. There is typically no 1:1 relationship between the two as manufacturers sometimes sell vehicles using a sub-brand, and some manufacturers further had more than one HSN. Similarly, a model can encompass several TSNs if the technical features of the different model versions are different enough to warrant a new TSN;
Data joining: Once a link between all the relevant identifiers was made, each of the KBA datasets (FZ 1, 2, 6, 10, 27, 28) was augmented with the corresponding car data. The accuracy of that matching was limited by the types of identifiers available in the KBA dataset. Where uncertainty in the matching procedure remained (for instance, because a car model was sold with different battery capacities), an error margin in the form of an upper or lower boundary was given;
Scaling: We did not collect technical data for very exotic car models that were sold rarely. For models in the PHEV category, there were further difficulties because some of the models are sold as PHEVs and internal-combustion-only vehicles. Both effects create a mismatch between the number of vehicles that we can detect and the number of vehicles we expect to find. The number of found vehicles was scaled to the number of expected vehicles for BEVs and PHEVs separately. The error estimates were scaled in a similar fashion. Note that this step means that it is theoretically possible that the real value lies below or above the given error margin. If, for instance, only vehicles with very high battery energy were not detected, and all models that we did detect were of the highest available battery energy, the actual value might be slightly above the given corridor. We consider this highly unlikely given the high share of vehicles found.
The combined dataset is unmatched in detail among the publicly available datasets for Germany. Other actors, such as the national bodies, possess data that are slightly more accurate and have produced pieces of analysis, but these have not been made public in the same way as outlined in this paper. Where the two pieces of analysis coincide, namely, the battery energy of the BEVs in the fleet, the results are very similar [
10]. The methodology used was quite similar to the authors of [
10].
3. Results
In this section, we show the results obtained by the data aggregation outlined before. All the results are a direct result of data aggregation, with only minimal scaling to account for nonidentifiable vehicles.
3.1. Number of Vehicles
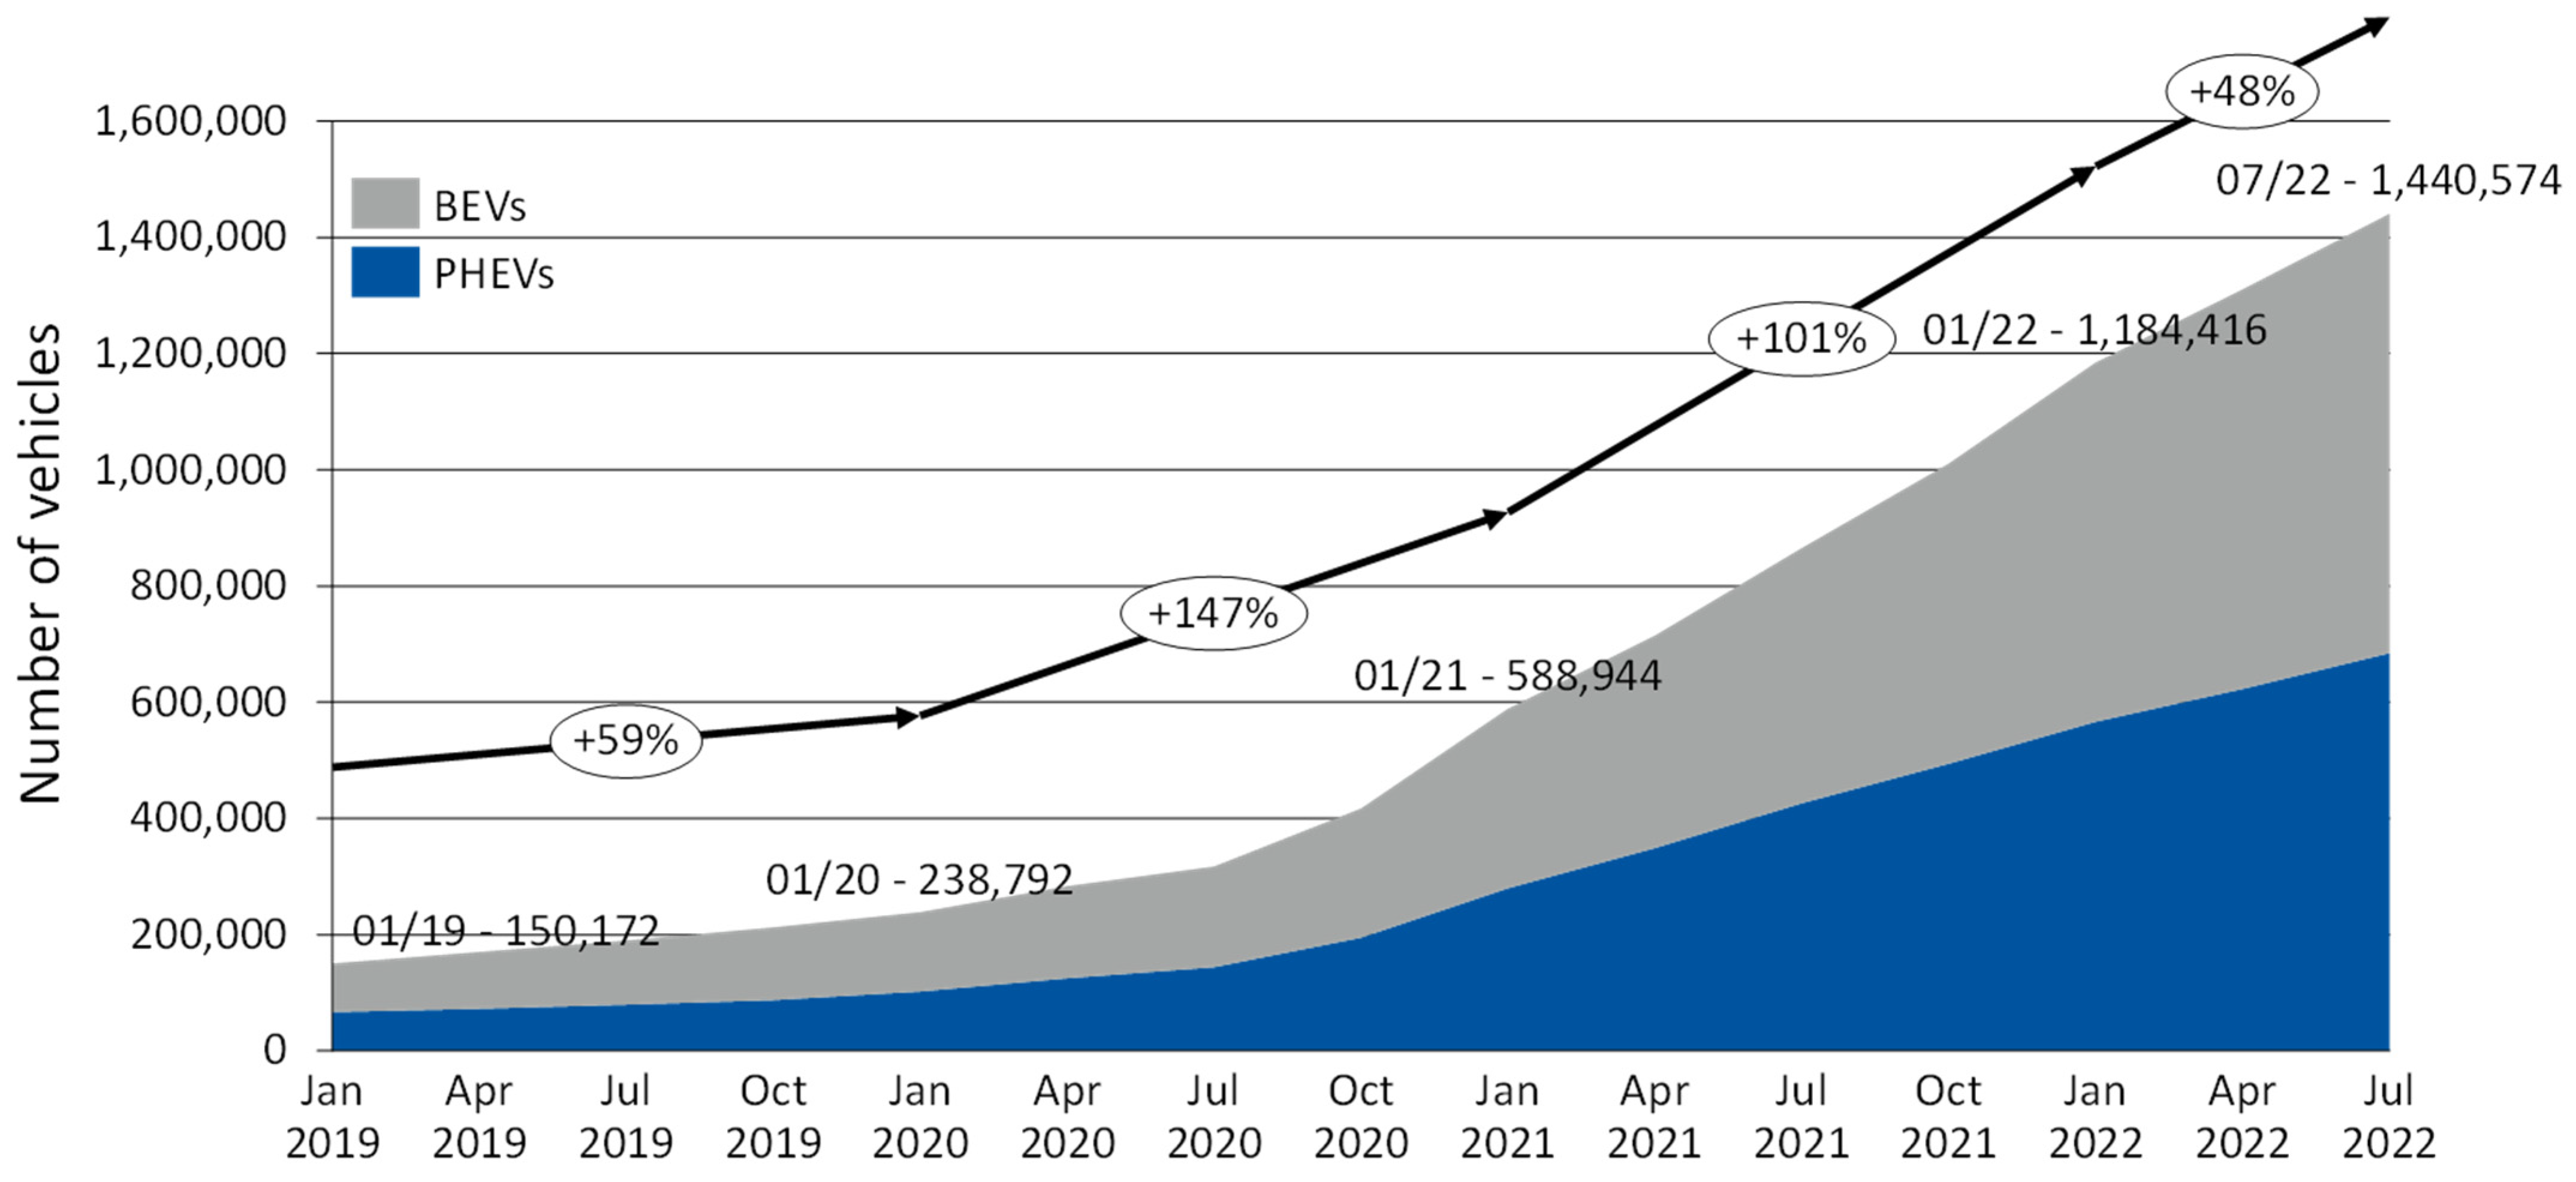
The number of EVs sold over time in Germany and split by area can be found in
Figure 1 and
Table 2 The distribution by state is further visualized in the
Appendix A. Some key observations are:
The growth in the EV fleet has been particularly strong since mid-2020. Since then, the fleet has grown in a linear fashion, with the EV-fleet size approximately doubling in 2020 and 2021. The fleet growth was likely limited by the supply side as the delivery times of vehicles have constantly risen and can reach up to 18 months [
16]. This doubling of the fleet size every year, however, also means that production has to keep pace, which appears challenging given the global chip crisis:
If the government’s goal of 15 million BEVs by 2030 [
17] is to be reached, then the yearly electric vehicle sales will have to continue to increase quickly given that appr. 3 million new vehicles are sold in the country per year [
14]. The current doubling of the sales per annum is desirable to ensure that the goal is reached as quickly as possible, but a slowing down of the growth rate would be acceptable. If no vehicles are deregistered, then a 48% growth rate in the fleet would suffice to reach 15 million BEVs by 01.01.2030, if no more than 3 million vehicles are sold annually. According to this logic, only BEVs could be sold from 2027 onwards. The necessary shift from the current approximately equal share of PHEVs and BEVs to full BEVs will free up the production resources of PHEV production, which will reduce the challenge somewhat;
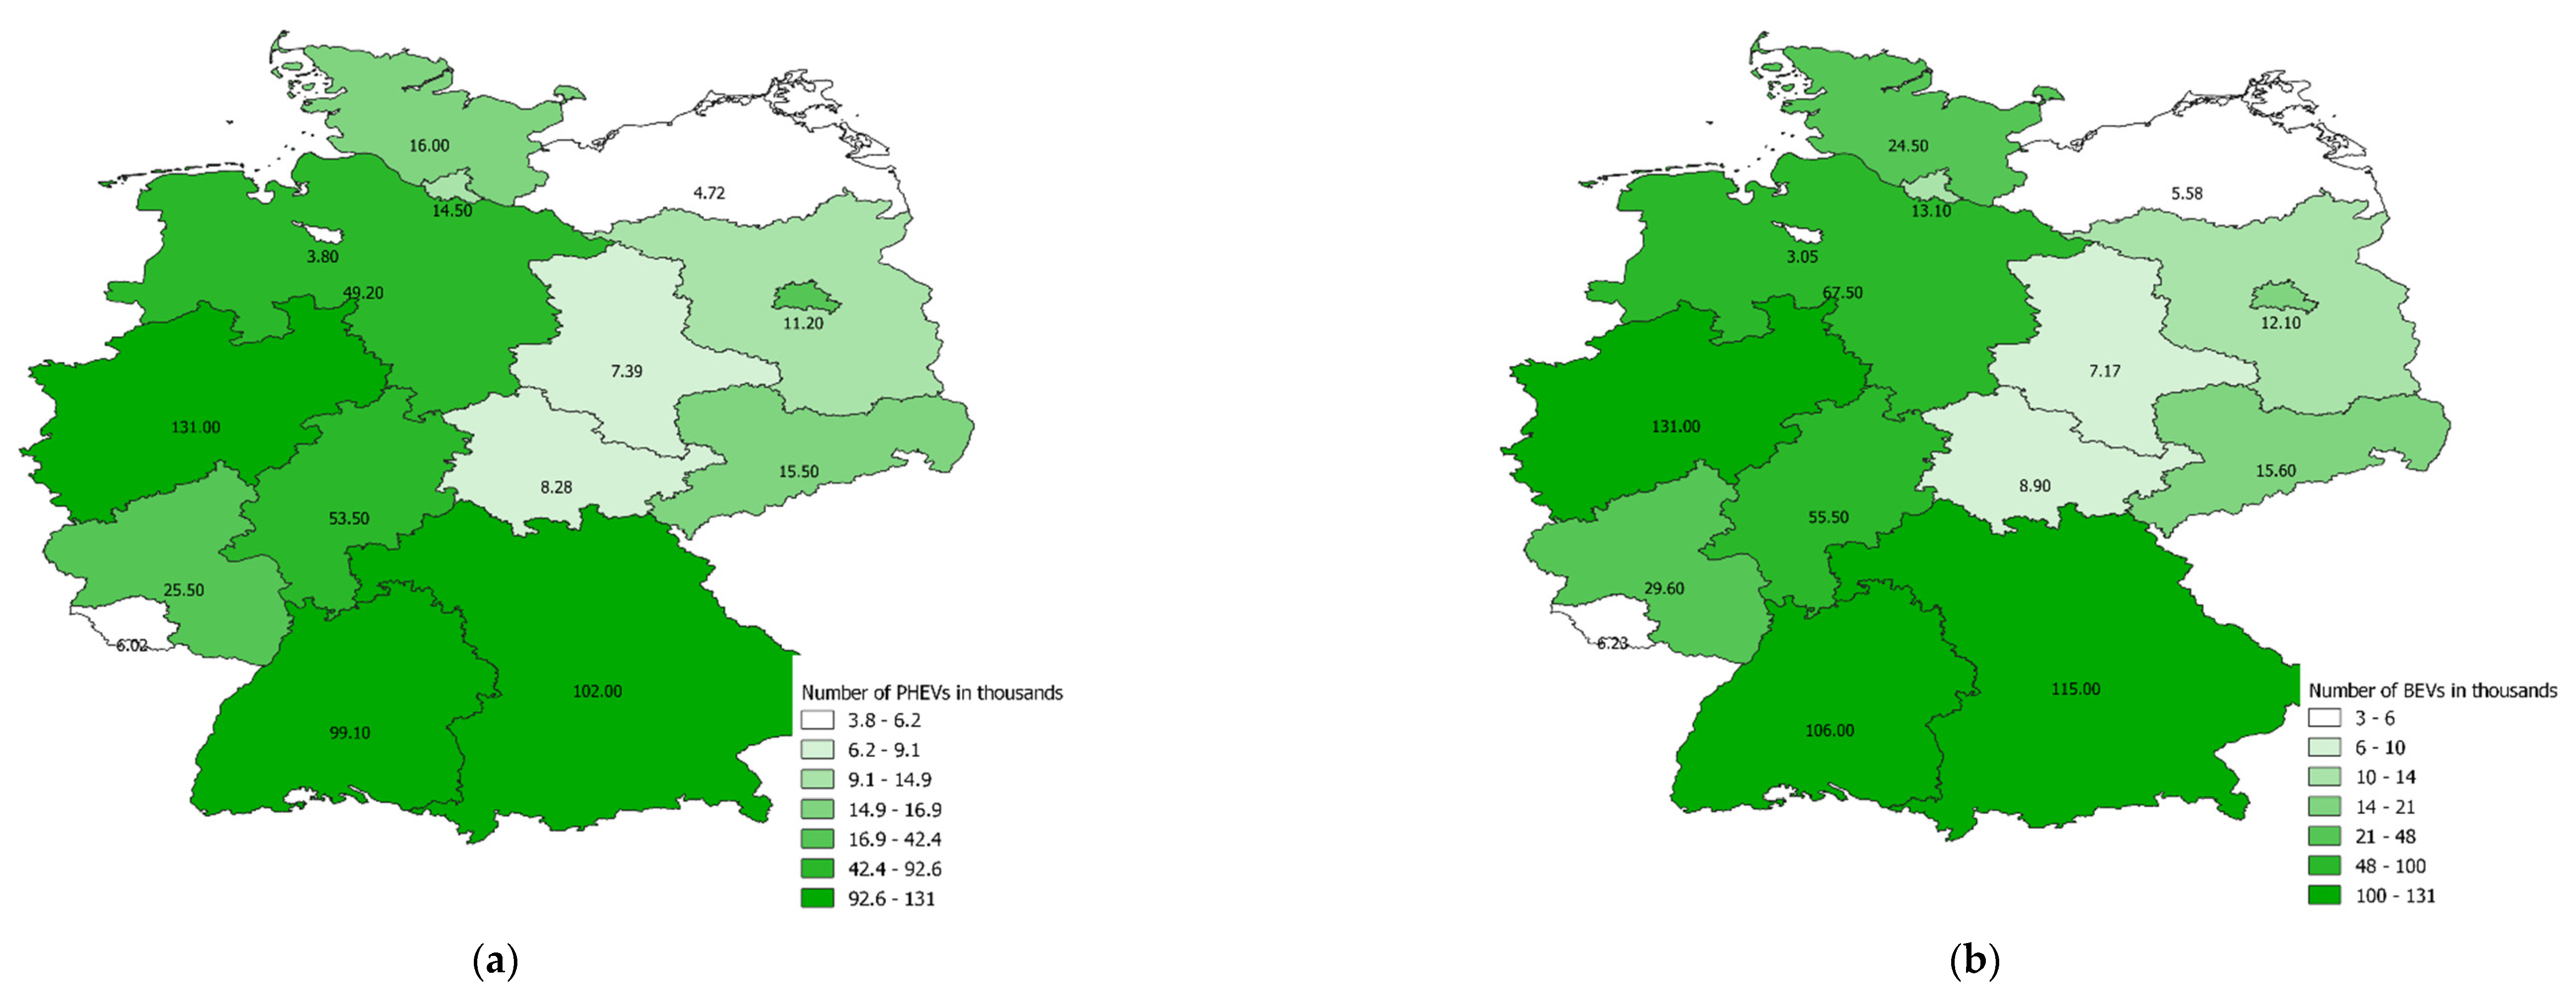
Electric vehicles are registered predominantly in the south and in the densely populated states. The northeast of the country is lagging behind even if the significantly lower population density is accounted for;
When the monthly number of registrations of BEVs is analyzed (not shown), a clear spike in December can be seen, and particularly for the years 2020 and 2021, in which 3.19 and 1.73 times as many vehicles were registered, respectively, compared with the averages of the other months of that year. Given the highly dynamic market, this can partially be explained by the exponential rise in sales. When compared with the averages of the subsequent months (11 for 2020, 7 for 2021), the factor is reduced to 1.56 and 1.73, respectively, but is still significant. The reason for this is likely that vehicle manufacturers register vehicles to ensure that they meet the fleet emission targets for the OEMs set by the European Union.
3.2. Battery Energy
Figure 2 shows the estimated battery energies of BEVs and PHEVs in Germany over time. The fact that the error margin rises over the course of a year results from the fact that the reporting is more detailed on an annual basis as compared with the monthly basis. The intrayear values are further likely slightly overestimated because vehicle deregistrations are only reported on an annual basis. The figure clearly shows that BEVs are the main driver in the EV battery market and should be the focus when innovative business models, such as vehicle-to-grid or vehicle-to-home models, are developed.
In July 2022, BEVs already had a larger cumulative battery energy than Germany’s pumped hydro storage plants (39 GWh) [
1]. If the goal of 15 million BEVs by 2030 of the German government is met, then the cumulative battery energy is likely to reach between 600 GWh (assuming 40 kWh/vehicles) and 1200 GWh (assuming 80 kWh/vehicles). Taking into account a net power consumption in Germany in 2021 of 515 TWh, this accounts for from 43% to 85% of the average daily electrical power consumption. Assuming an average energy consumption of 18 kWh and an average milage of 37 km/day per car, 15 million electric vehicles will consume about 7% of today’s electrical power consumption. The main source of uncertainty in this domain is the market share of PHEVs compared with BEVs. Over the period studied in this paper, the share of PHEVs in the EV segment fluctuated between 41% and 49%, but subsidies for the purchases of PHEVs will end by the end of 2022 [
20]. This could start a shift away from PHEVs to BEVs in the overall vehicle fleet. The average battery energy of new EVs could consequently rise, leading to higher fleet values.
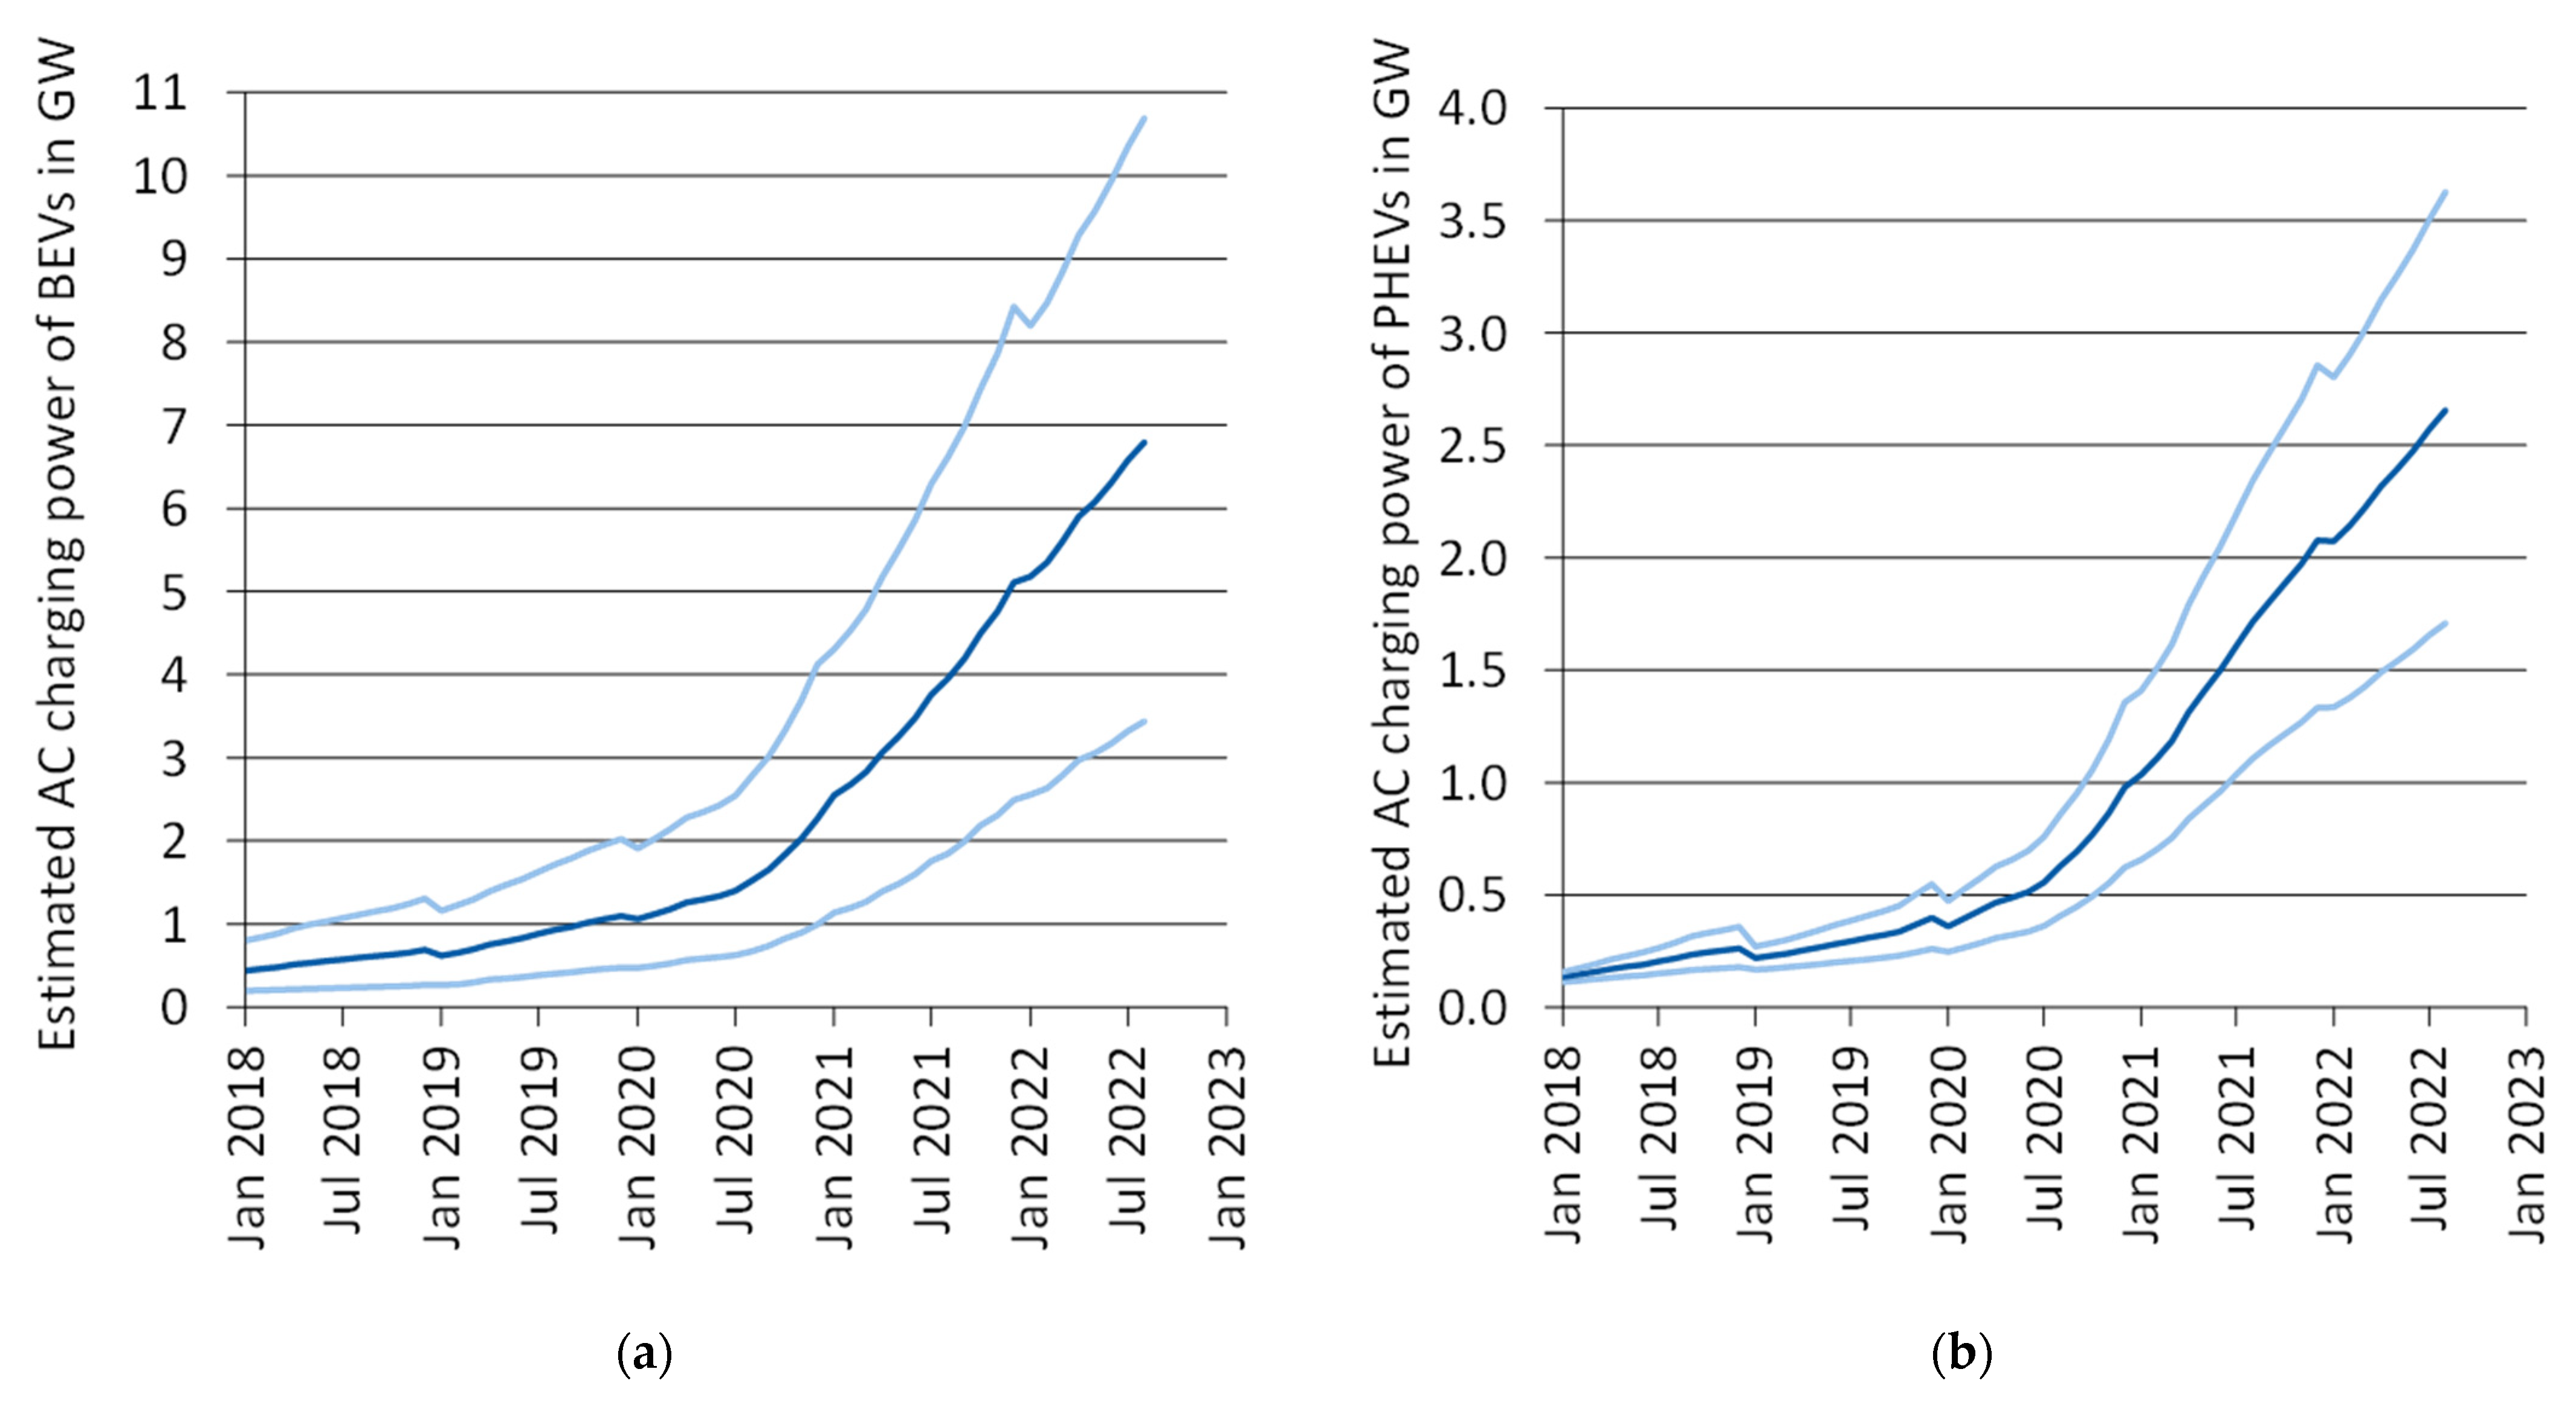
3.3. Charging Power
Figure 3 shows the estimated AC charging power of EVs in Germany. The difference between PHEVs and BEVs is small compared with most of the other properties shown in this paper. The reason for this is the fact that the average AC charging power of BEVs on 1 July 2022 was 8.7 kW, while it was 3.8 kW for PHEVs. For PHEVs, this is a result of most vehicles being equipped with a single-phase charger with a power rating of 3.7 kW. BEVs typically use a Type 2 charger, which could theoretically provide 22 kW. Close to all BEVs, however, are equipped with an 11 kW onboard charger. Small and older BEVs sometimes also use single-phase or two-phase charging, which explains the average being below 11 W. From these results, we can deduct that as long as little energy is required for a grid service, PHEVs would be suitable candidates. An example of such services could be a rapid grid reserve that replaces the effect of the rotating mass in the grid. Such a service would only need to provide energy until the frequency control reserve starts acting.
It has to be noted here that the charging powers shown are the rated power values of the vehicles. Because not all vehicles charge simultaneously, the grid will only be loaded by a fraction of the shown values. The same holds true for the DC values shown in
Figure 4.
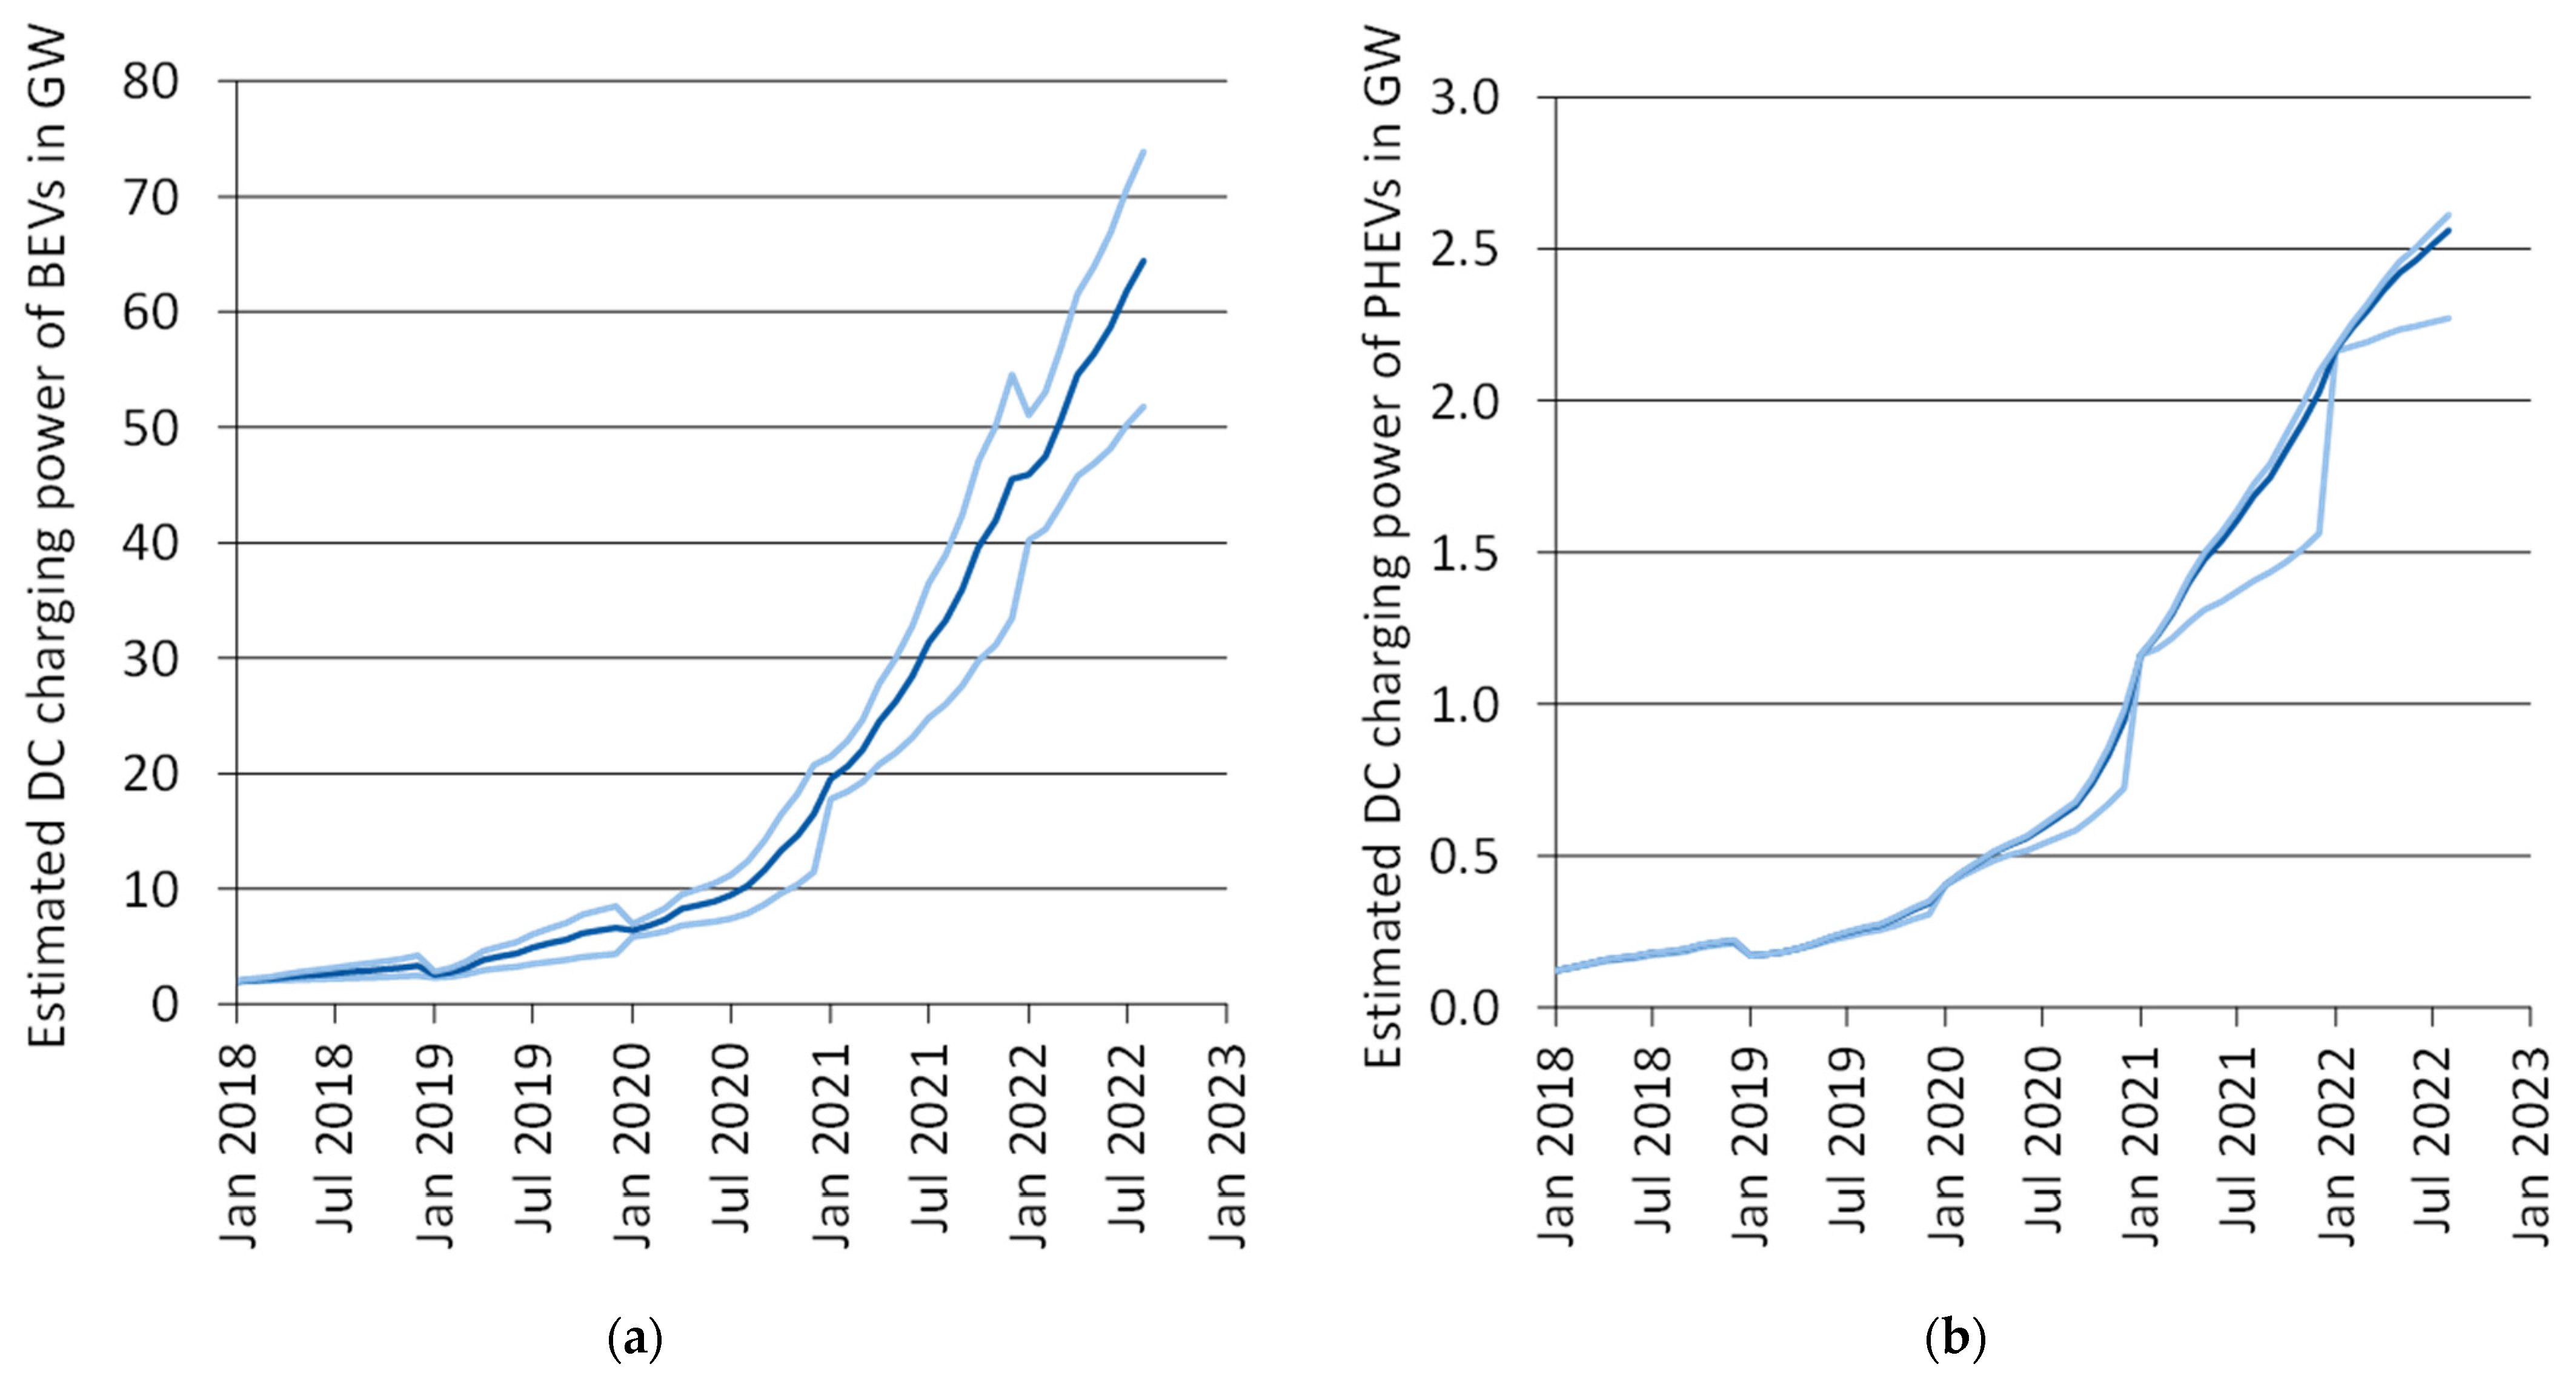
The EV fleet’s cumulative DC charging power is shown in
Figure 4. For BEVs, the growth rate in the DC charging power has been faster than the growth rate of the number of vehicles. This is a result of the fact that, previously, comparatively few vehicles were equipped with a fast-charging option. Over the years, fast-charging connectors have become more common for vehicles, and if a connector is present, then the charging power further rises over time. PHEVs, not surprisingly, do not show a high DC charging power. The ones that do have a fast charger installed are likely range-extenders, where the internal combustion engine is activated in case the battery runs out of energy. Such a vehicle could make use of the fast-charging abilities, while the typical small batteries of PHEVs are unable to handle the high-power flows connected to DC fast charging.
While the installed DC charging power is much larger than the AC charging power, the vehicles require a DC charging station to realize such powers. There are currently 10,000 public DC charging stations, compared with 55,000 public AC charging stations, and many more private AC chargers [
21]. Vehicles are typically also only able to realize their DC charging power within a narrow SOC band [
22].
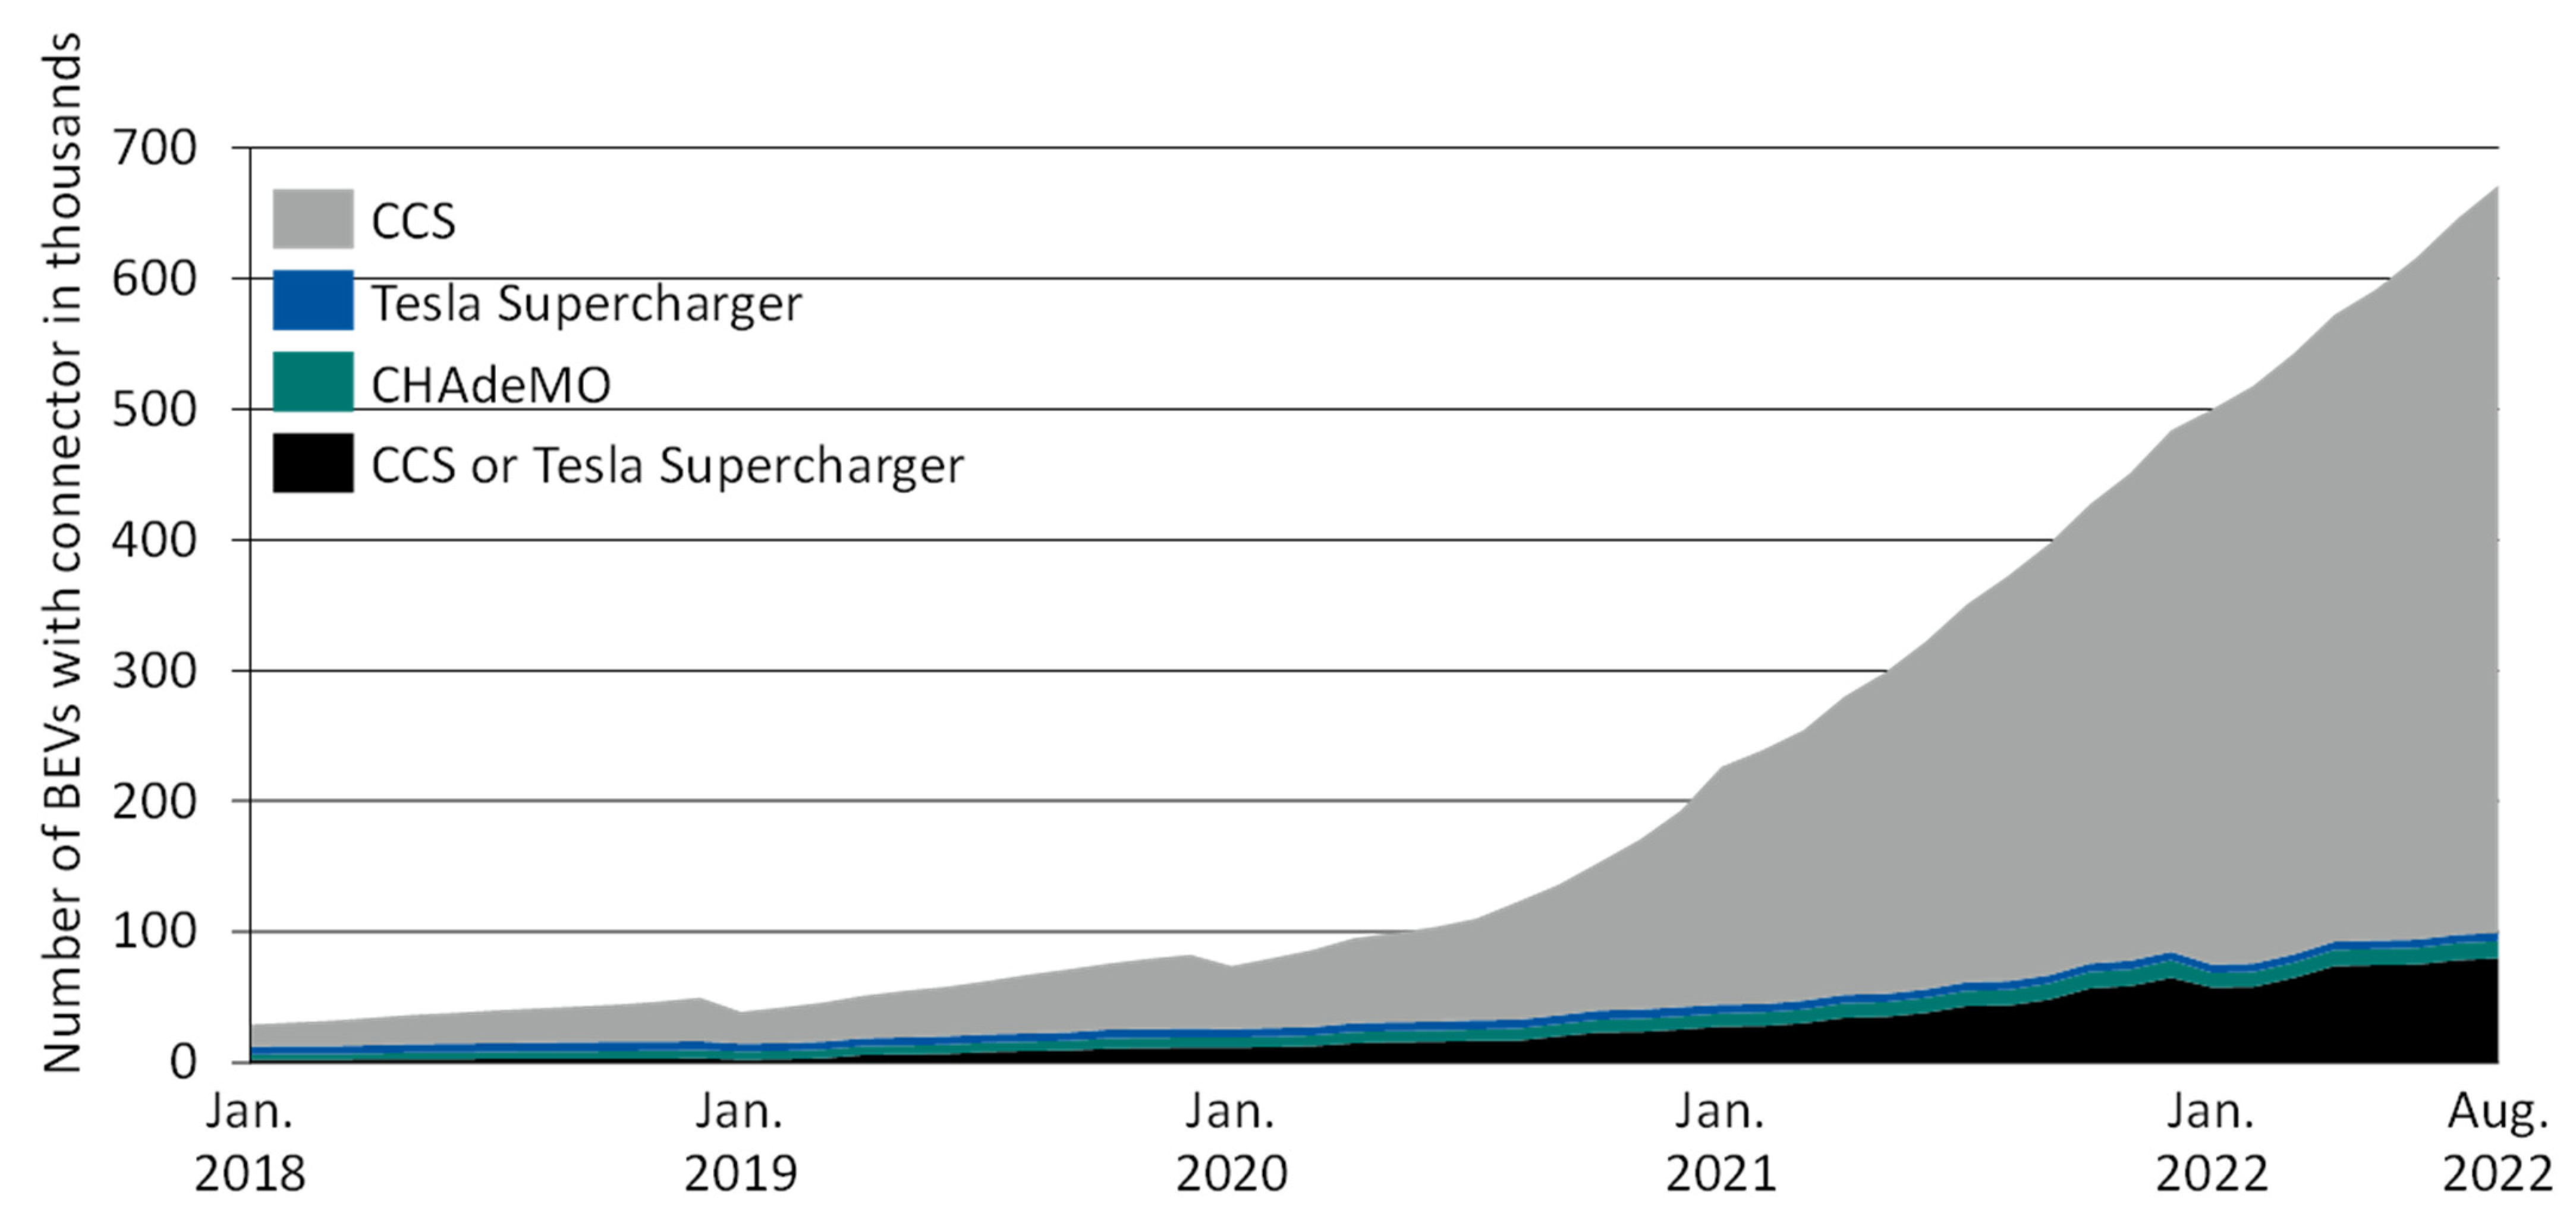
3.4. Connectors
Figure 5 shows the number of BEVs by the type of DC fast charger equipped. The combined charging system (CCS) is the predominant connector type for vehicles registered in Germany. This is in line with the EU’s decision to make the CCS plug the default plug, and to enforce a law requiring that every fast charger be equipped with the CCS and only optionally other formats [
23].
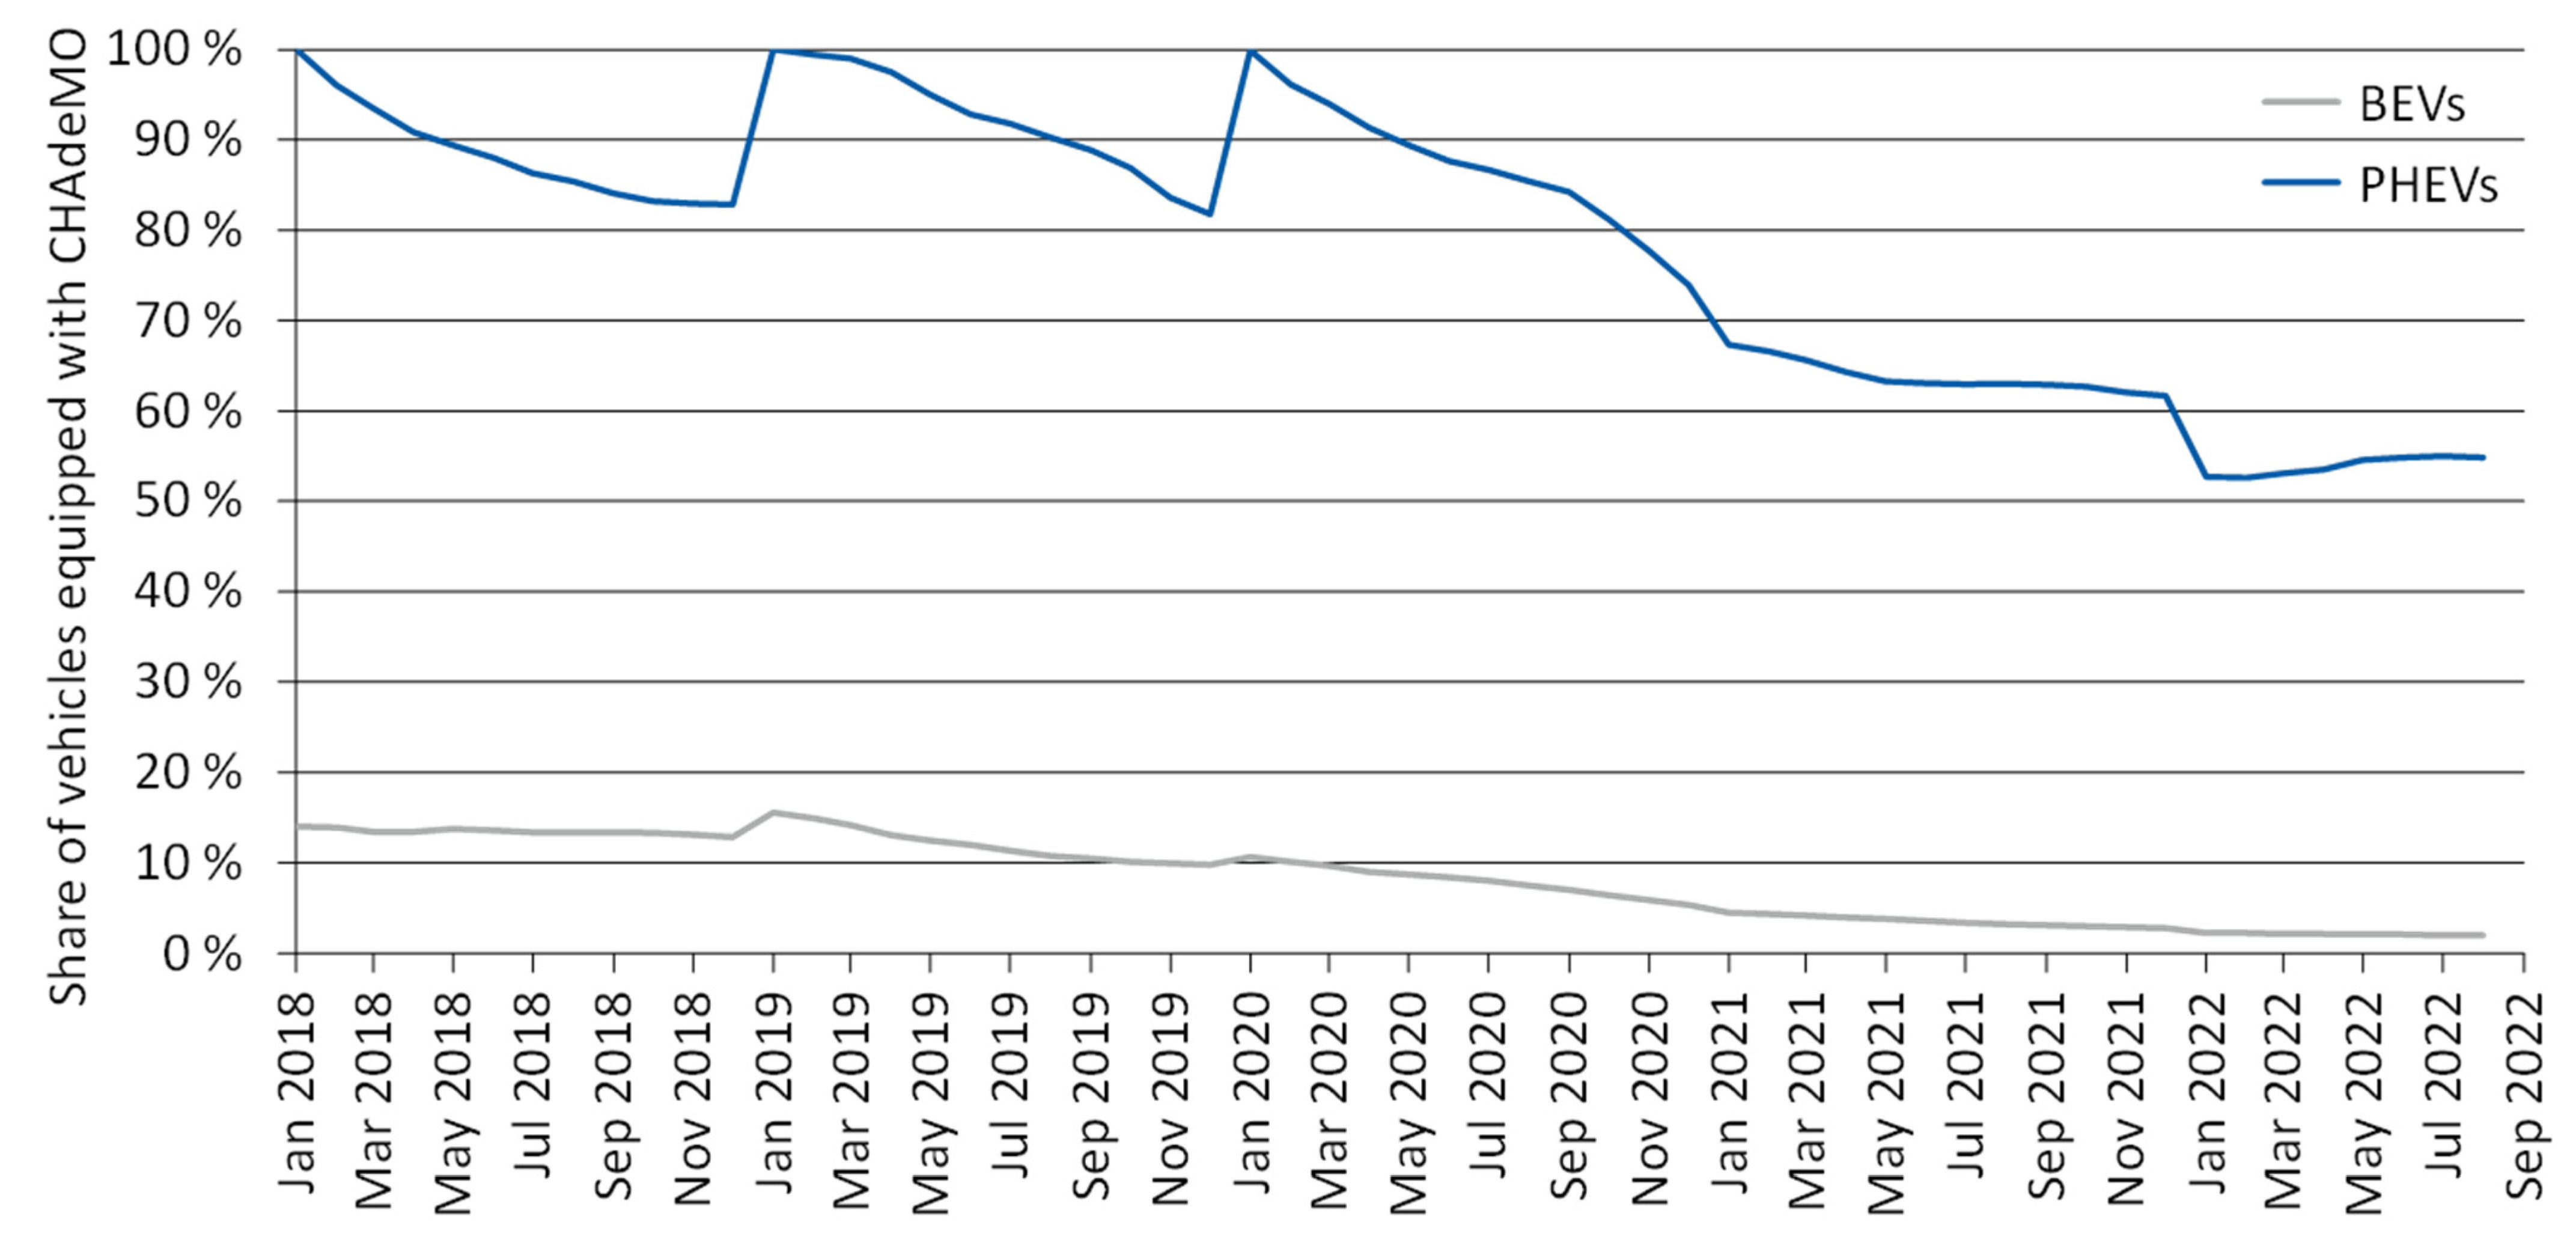
This finding is extended in
Figure 6, in which the share of vehicles in the fleet that were equipped with a CHAdeMO (“CHArge de Move”) connector is shown. We decided to show the share of the CCS’ largest competitor, the CHAdeMO, instead of the CCS itself because there is a larger uncertainty for the CCS. The reason for this is that Tesla switched from the proprietary standard to the CCS. Our dataset unfortunately does not allow us to differentiate between the two types of Teslas. The core statement, however, remains correct, as all new Teslas are sold with a CCS plug. Although the CCS was the most popular fast-charging standard in the observed data period, the ratio changed over time. In 2018, the CHAdeMO still had a significant foothold in the market, with 14% of the fast chargers in BEVs being of the CHAdeMO type. This value plummeted to 2% in August 2022. For PHEVs, the CHAdeMO is still a relatively frequent choice, but the overall low number of fast-charging-enabled PHEVs dilutes the picture somewhat: In 2018, our database recorded 4000 PHEVs with a CHAdeMO connector, and until August 2022, this number had only risen to 41,000.
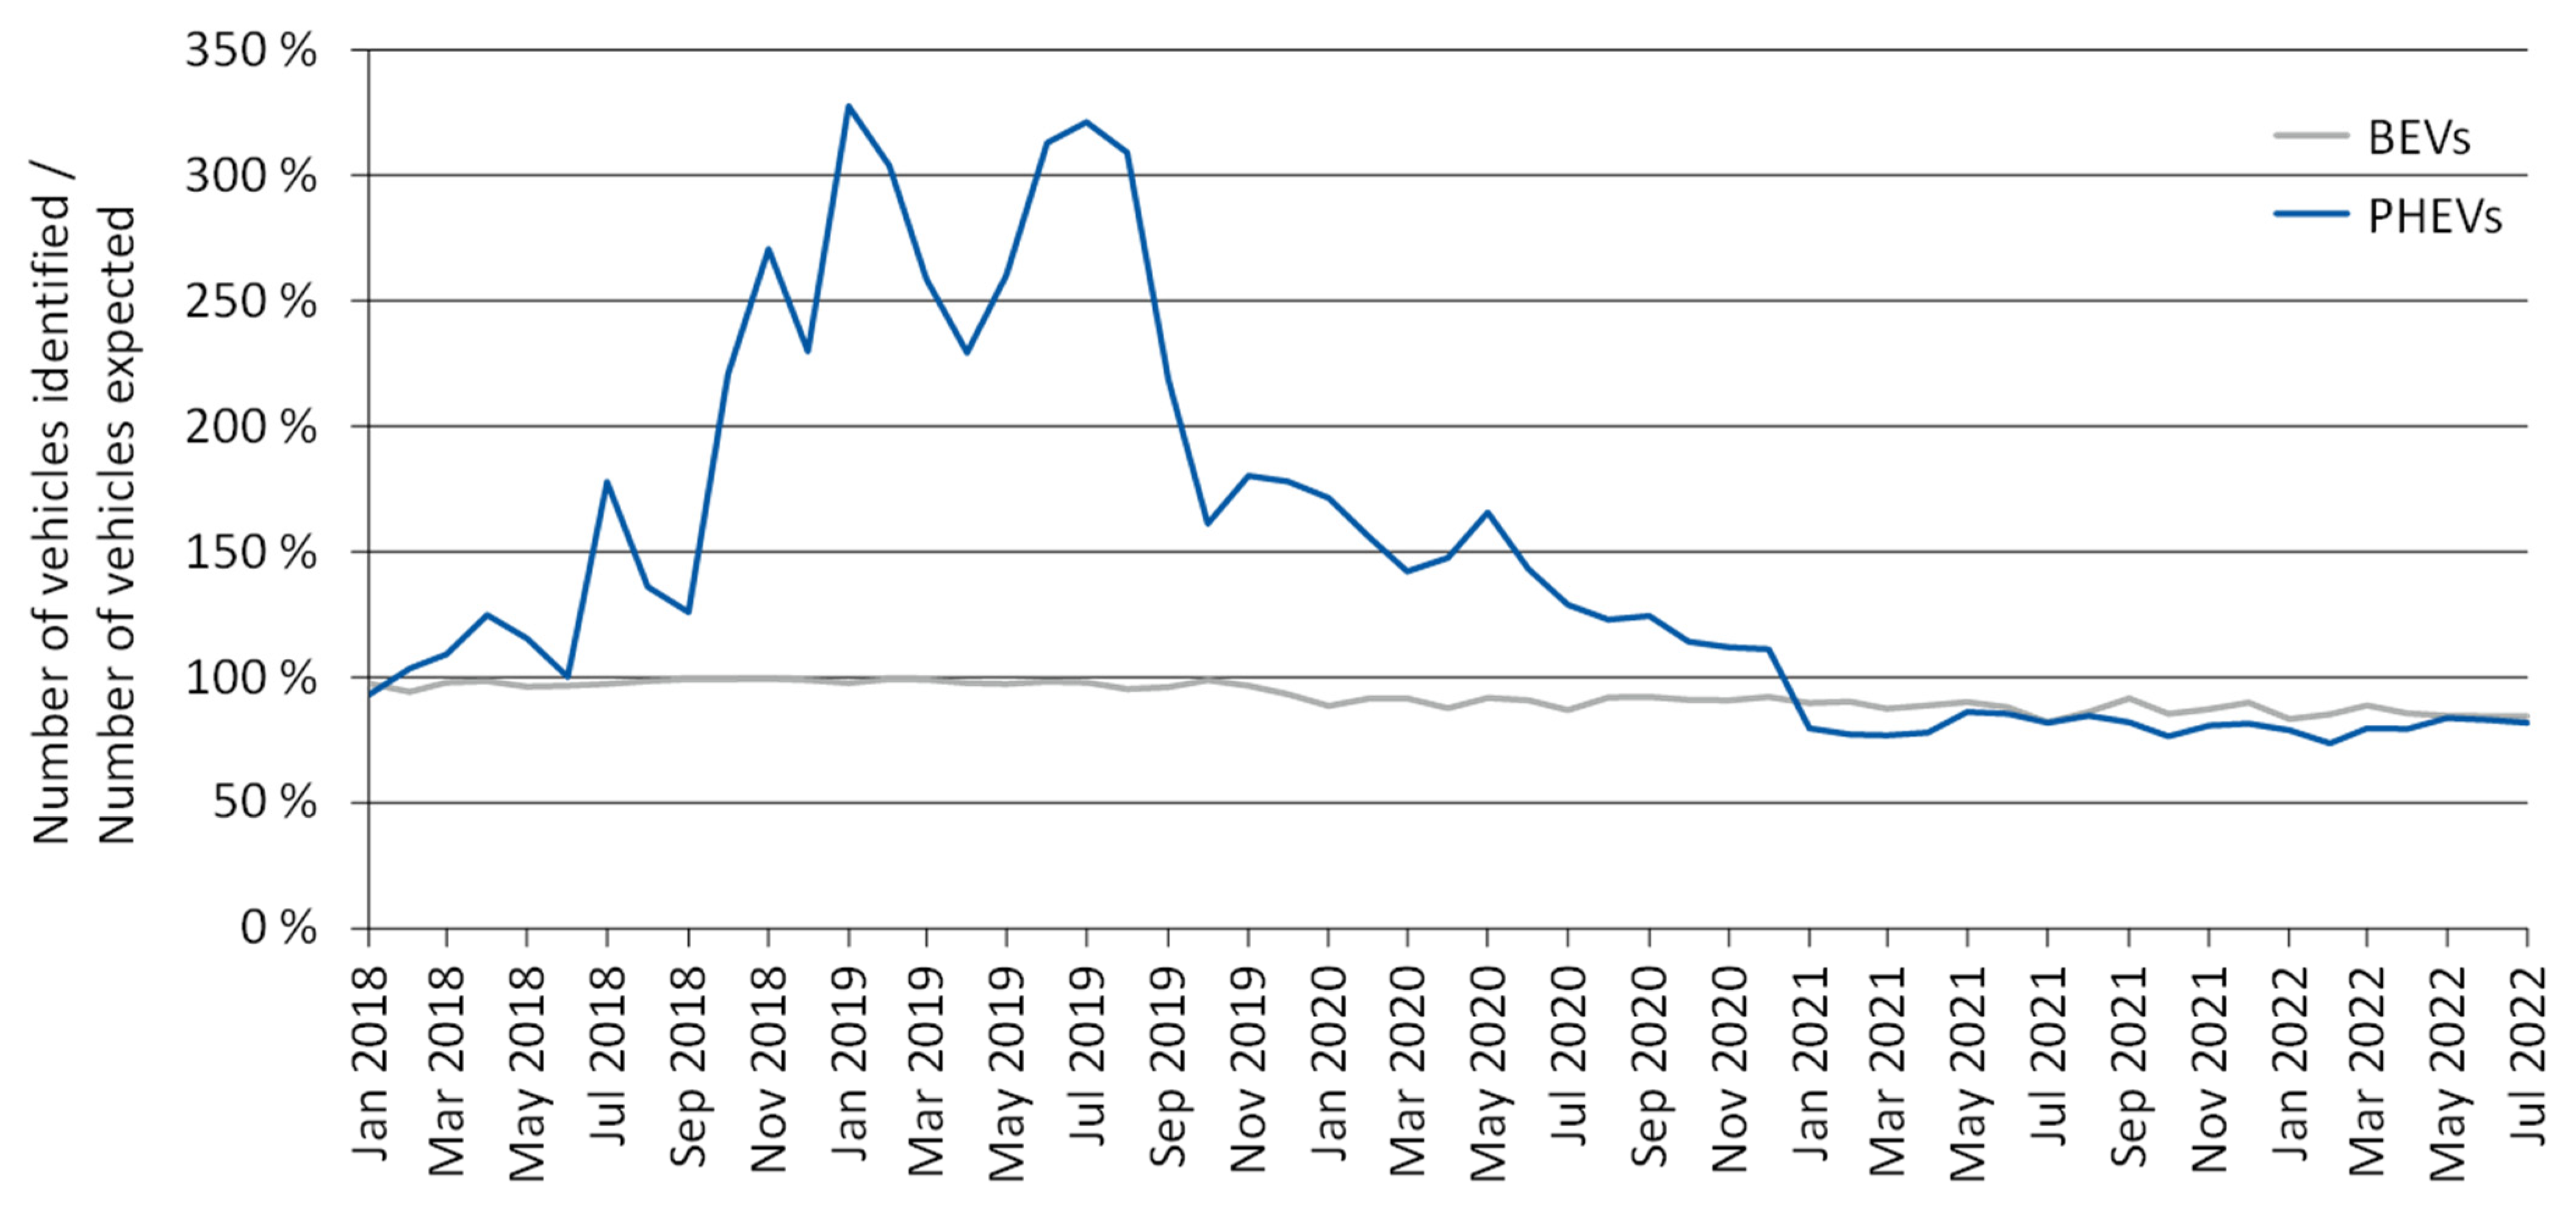
3.5. Number of Vehicles Found
To verify that the chosen data-merging approach is valid, it was important to compare the number of vehicles for which we could assign a TSN and HSN with the number of vehicles that we expected to find according to FZ 1. This check was performed and is presented in
Figure 7. As can be seen, the detection rate was from 80% to 100% for BEVs, and from 71% to 171% for PHEVs. The excessively high detection rate of PHEVs can be explained by the fact that some models are sold as PHEVs and internal-combustion-engine vehicles. The results for the PHEVs are therefore subject to uncertainty. As the battery energy and charging power of PHEVs are significantly lower than those of BEVs, the overall market view is likely undisturbed by the somewhat higher inaccuracy for the PHEVs.
3.6. Other Results and Data
The visualizations and graphs shown in this paper are only the most insightful of a larger set. Further data, details, and visualizations can be found on the webpage:
www.mobility-charts.de (accessed on 29 August 2022) [
13]. The available graphs are:
Number of vehicles classified by BEV, PHEV, and fuel-cell electric vehicles on quarter-annual basis;
Number of vehicles, battery energy, charging power, and connector types per state on an annual basis;
Number of vehicles, battery energy, charging power, and connector types of newly registered vehicles on the national level and on a monthly basis;
Number of vehicles, battery energy, charging power, and connector types on the national level on an annual basis, augmented with monthly registration data.
4. Discussion and Conclusions
The material shown in this paper provides a broad overview of the German electric vehicle market. Special focus is put on the electrical properties, such as the battery energy and charging power. Most values shown show a reasonable error margin and can be used with a high degree of confidence.
All the shown data are the direct result of the matching of publicly available data sources. We intentionally did not perform any in-depth analysis, as the chosen approach can be reperformed and published automatically on a monthly basis. When projecting the shown trends into the future, we advise a consideration of the general market trends, which include downsides, such as the global chip crisis, and supply-chain disruptions as a consequence of the Russian invasion of Ukraine and the global coronavirus pandemic. The upsides are the possible decreasing battery prices, both with the conventional nickel–manganese–cobalt chemistry, as well as different chemistries based on iron phosphate or sodium.
The material shown in this paper provides fundamental market data and technical quantities. By calculating the technical properties of each car model, the accuracy of the estimations made is substantial, and much better than estimates that lump all the BEVs or PHEVs together and assume a unified battery energy or charging power for all vehicles.
Decisionmakers in the public and private sector, researchers, and other stakeholders may use this data to verify their models and assumptions. By building the freely accessible and monthly updated data platform
www.mobility-charts.de (accessed on 29 August 2022), we ensure that readers can verify whether the trends encountered in this paper are still valid in the future. The platform further allows readers to perform a deep dive into the available data.
Author Contributions
Conceptualization, C.H. and J.F.; methodology, C.H., K.G.S. and J.F.; software, C.H. and K.G.S.; validation, C.H., J.F. and D.U.S.; formal analysis, C.H.; investigation, C.H. and K.G.S.; resources, C.H., J.F. and D.U.S.; data curation, C.H. and K.G.S.; writing—original draft preparation, C.H.; writing—review and editing, C.H., J.F. and D.U.S.; visualization, C.H. and K.G.S.; supervision, J.F. and D.U.S.; project administration, J.F. and D.U.S.; funding acquisition, C.H., J.F. and D.U.S. All authors have read and agreed to the published version of the manuscript.
Funding
This research was funded by the Federal Ministry of Economic Affairs and Climate Actions, grant number 01MV20001A. The project name was “BeNutz LaSA”.
Institutional Review Board Statement
Not applicable.
Informed Consent Statement
Not applicable.
Data Availability Statement
All data shown in this paper can be downloaded from the website
www.mobility-charts.de [
13] and the dashboard linked there.
Conflicts of Interest
The authors declare no conflict of interest.
Appendix A
The data shown in
Table 2 are visualized on the map of
Figure A1. The color gradient solely considers the number of vehicles per state and does not include information about the population or area of a state. Fellow researchers who wish to relate the number of vehicles are referred to
Table 2 and [
24].
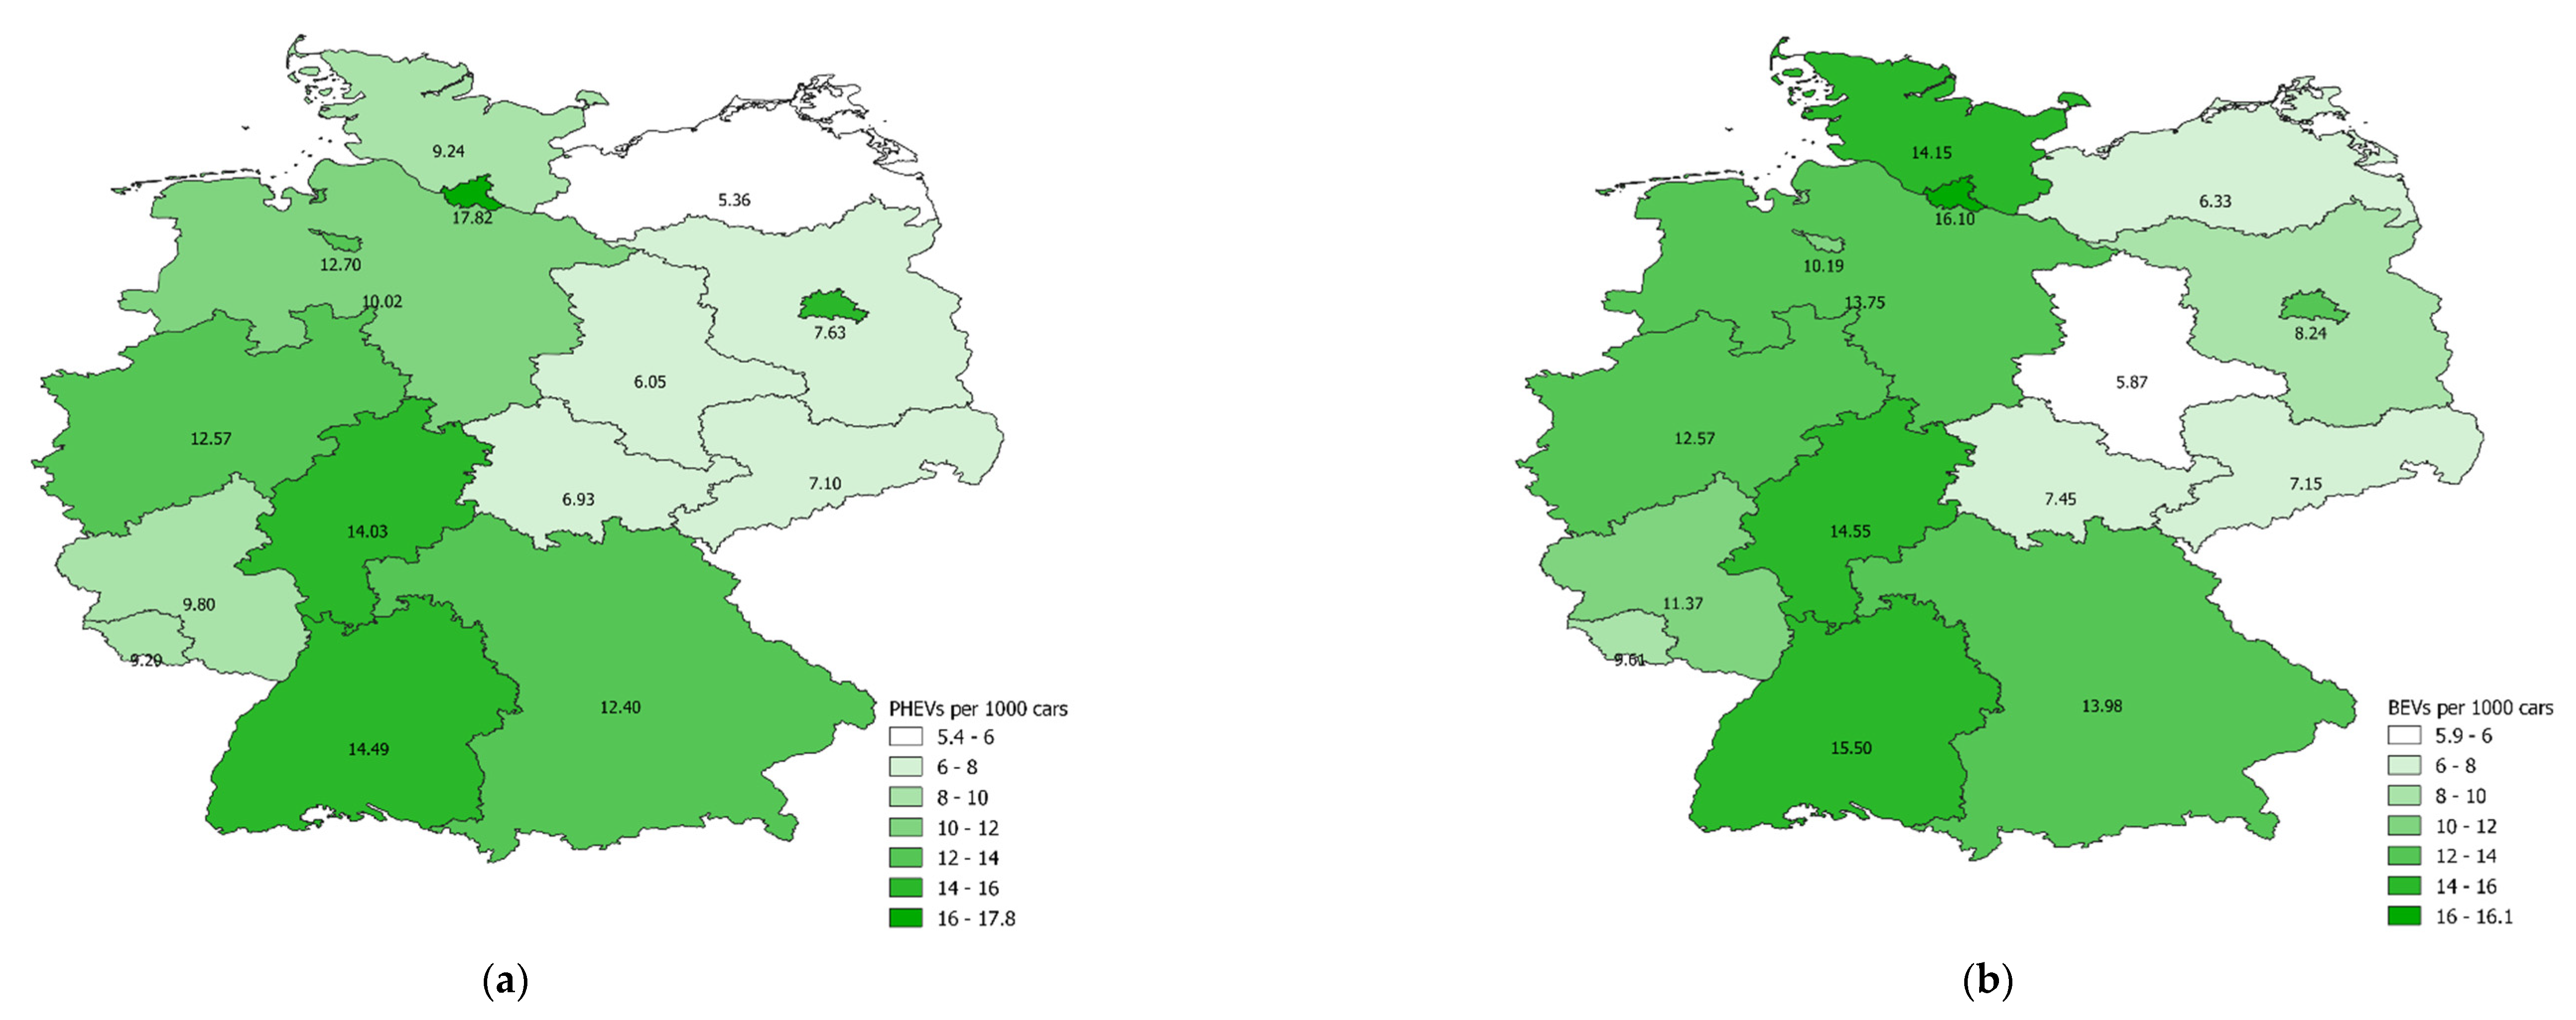
Figure A2 augments this picture by showing the number of BEVs or PHEVs per 1000 cars in each state thereby providing a view of the market share. A clear distinction between Eastern Germany, except for Berlin, and the rest of the country is visible, with the EV density being significantly higher in the south and west.
Figure A1.
Visualization of where and how many vehicles by state on 1 January 2022 for (a) PHEVs and (b) BEVs. Values for Berlin are not shown for visual clarity (17.5 in (a) and 16.7 in (b)). Note that there is no compensation for the fact that larger and more populous states are naturally likely to host more electric vehicles.
Figure A2.
Number of (a) PHEVs and (b) BEVs per 1000 cars registered by state. Values for Berlin are not shown (14.09 in (a) and 13.45 in (b)) for visual clarity.
Figure A2.
Number of (a) PHEVs and (b) BEVs per 1000 cars registered by state. Values for Berlin are not shown (14.09 in (a) and 13.45 in (b)) for visual clarity.
References
- Figgener, J.; Hecht, C.; Haberschusz, D.; Bors, J.; Spreuer, K.G.; Kairies, K.P.; Stenzel, P.; Sauer, D.U. The Development of Battery Storage Systems in Germany: A Market Review (Status 2022). Available online: http://arxiv.org/pdf/2203.06762v2 (accessed on 20 March 2022).
- IEA. Global EV Outlook 2022. International Energy Agency, Paris, May 2022. Available online: https://www.iea.org/reports/global-ev-outlook-2022 (accessed on 29 August 2022).
- McKerracher, C.; O’Donovan, A.; Soulopoulos, N.; Grant, A.; Mi, S.; Doherty, D.; Fisher, R.; Cantor, C.; Lyu, J.; Ampofo, K.; et al. Electric Vehicle Outlook 2022. Bloomberg Inc., online, 2022. Available online: https://about.bnef.com/electric-vehicle-outlook/ (accessed on 29 August 2022).
- EVBoosters. EV Markets Insights Platform | EVMarketsreports.com. Available online: https://evmarketsreports.com/ (accessed on 29 August 2022).
- Gersdorf, T.; Hertzke, P.; Schaufuss, P.; Schenk, S. McKinsey Electric Vehicle Index: Europe Cushions a Global Plunge in EV Sales. Available online: https://www.mckinsey.com/industries/automotive-and-assembly/our-insights/mckinsey-electric-vehicle-index-europe-cushions-a-global-plunge-in-ev-sales (accessed on 29 August 2022).
- Bundesministerium für Digitales und Verkehr, NOW GmbH, and Nationale Leitstelle Ladeinfrastruktur, Deutschlandnetz. Available online: https://www.standorttool.de/strom/deutschlandnetz/ (accessed on 26 June 2022).
- Faltenbacher, M.; Bopp, J.; Kupferschmid, S.; Sphera. Projektübersicht 2020/2021 Zero Emission Busse in Deutschland: Im Rahmen der Programmbegleitforschung Innovative Antriebe im straßengebundenen ÖPNV,” Bundesministerium für Verkehr und Digitale Infrastruktur (BMVI), Berllin, September 2021. Available online: https://www.now-gmbh.de/wp-content/uploads/2021/09/210922_Projektuebersicht-Zero-Emission-Busse-in-Deutschland.pdf (accessed on 29 August 2022).
- Krug, S.; Krey, O.; Ohm, B.; Braune, O.; Weider, M. Elektromobilität vor Ort: Ergebnisbericht des Zentralen Datenmonitorings des Förderprogramms Elektromobilität vor Ort des Bundesministeriums für Verkehr und digitale Infrastruktur. Ingenieurgruppe IVV, Berlin, 2020. Available online: https://www.now-gmbh.de/wp-content/uploads/2020/09/zdm-ivv-ergebnisbericht_final.pdf (accessed on 29 August 2022).
- Elaadnl, Publications. Available online: https://elaad.nl/en/publications/ (accessed on 29 August 2022).
- Wanitschke, A.; Hartlaub, N.; Borger, C. Electric Vehicle Uptake in Germany—Showcases from a Decade of Data; European Association for Electromobility: Oslo, Norway, 2022. [Google Scholar]
- Bharathidasan, M.; Indragandhi, V.; Suresh, V.; Jasiński, M.; Leonowicz, Z. A review on electric vehicle: Technologies, energy trading, and cyber security. Energy Rep. 2022, 8, 9662–9685. [Google Scholar] [CrossRef]
- Hecht, C.; Figgener, J.; Sauer, D.U. Analysis of Electric Vehicle Charging Station Usage and Profitability in Germany based on Empirical Data. arXiv 2022, arXiv:2206.09582. [Google Scholar]
- Hecht, C.; Figgener, J.; Sauer, D.U. Mobility Charts: Deutschlands Elektromobilität im Überblick. Available online: https://www.mobility-charts.de/ (accessed on 29 August 2022).
- KBA. Statistik. Available online: https://www.kba.de/DE/Statistik/statistik_node.html;jsessionid=99A38C9DC665F9B8C1F9BCEC006122D3.live11313 (accessed on 29 August 2022).
- ADAC. Automarken & Modelle. Available online: https://www.adac.de/rund-ums-fahrzeug/autokatalog/marken-modelle/ (accessed on 6 April 2020).
- Werner, T. Lieferzeiten für Elektroautos. Available online: https://www.carwow.de/ratgeber/elektroauto/lieferzeiten-elektroautos (accessed on 29 August 2022).
- SPD, Green Party, and FDP. Mehr Fortschritt Wagen. SPD, Green Party; FDP, Berlin, 2021. Available online: https://www.spd.de/fileadmin/Dokumente/Koalitionsvertrag/Koalitionsvertrag_2021-2025.pdf (accessed on 29 August 2022).
- Destatis. Bevölkerung nach Nationalität und Bundesländern. Available online: https://www.destatis.de/DE/Themen/Gesellschaft-Umwelt/Bevoelkerung/Bevoelkerungsstand/Tabellen/bevoelkerung-nichtdeutsch-laender.html (accessed on 30 August 2022).
- Kraftfahrt-Bundesamt. Der Fahrzeugbestand am 1. Januar 2022: Pressemitteilung Nr. 10/2022. Kraftfahrt-Bundesamt, Flensburg, Mar. 2022. Available online: https://www.kba.de/SharedDocs/Downloads/DE/Pressemitteilungen/DE/2022/pm_10_2022_bestand_01_22.pdf?__blob=publicationFile&v=9 (accessed on 30 August 2022).
- Delhaes, D.; Greive, M.; Olk, J. Ampel senkt Kaufprämie für Elektroautos—Plug-in-Hybride Bekommen keine Förderung mehr. Available online: https://www.handelsblatt.com/politik/deutschland/e-autos-ampel-senkt-kaufpraemie-fuer-elektroautos-plug-in-hybride-bekommen-keine-foerderung-mehr/28549342.html (accessed on 29 August 2022).
- Bundesnetzagentur. Ladesäulenkarte. Available online: https://www.bundesnetzagentur.de/DE/Sachgebiete/ElektrizitaetundGas/Unternehmen_Institutionen/HandelundVertrieb/Ladesaeulenkarte/Ladesaeulenkarte_node.html (accessed on 27 January 2022).
- Hecht, C.; Victor, K.; Zurmühlen, S.; Sauer, D.U. Electric vehicle route planning using real-world charging infrastructure in Germany. eTransportation 2021, 10, 100143. [Google Scholar] [CrossRef]
- European Parliament and Council of the European Union. Alternative Fuels Directive; European Union: Brussels, Belgium, 2014; available online: https://eur-lex.europa.eu/legal-content/EN/TXT/PDF/?uri=CELEX:32014L0094&from=en (accessed on 29 August 2022).
- Statistisches Bundesamt Deutschland. Deutschland: Fläche, Postleitzahlen, Einwohner, Bundesländer. Available online: https://www.destatis.de/DE/Themen/Laender-Regionen/Regionales/_inhalt.html (accessed on 29 August 2022).
| Publisher’s Note: MDPI stays neutral with regard to jurisdictional claims in published maps and institutional affiliations. |
© 2022 by the authors. Licensee MDPI, Basel, Switzerland. This article is an open access article distributed under the terms and conditions of the Creative Commons Attribution (CC BY) license (https://creativecommons.org/licenses/by/4.0/).


