Abstract
This study explores the long-term energy use implications of electrification, automation and sharing of road vehicles in British Columbia, Canada. Energy use is first analyzed for the years 1990–2016 for forward forecasting, and hypothetical scenarios ranging from conservative to disruptive, incorporating various effects of road vehicle electrification, sharing and automation, as well as influences of other technology disruptions, such as online shopping and e-learning are presented and used to project the road transportation energy use in B.C. to 2060. Transportation energy use projections are compared to those of the Canadian Energy Regulator (CER). When considering only the effect of vehicle electrification, the scenarios show higher energy savings compared to CER’s scenarios. The combined impact of vehicle electrification and automation leads to decreased energy use to 2060 for all scenarios considered. The energy savings for all scenarios, except for the conservative one, are higher than CER’s projections. When the effects of vehicle electrification, automation and sharing are merged, all scenarios yield energy savings beyond the CER projections. Inclusion of other technology disruptions and the effects of pandemics like COVID-19 reduce transportation demand and provide further energy savings. The BAU scenario given in this study shows energy use decreases compared to 2016 of 26.3%, 49%, 62.24%, 72.1% for the years 2030, 2040, 2050, and 2060 respectively.
1. Introduction
A host of auto, AI, and internet companies are pursuing the development and demonstration of autonomous vehicles (AV’s) with the anticipations that they and the supporting infrastructure will become sufficiently reliable and affordable and eventually displace most manually driven cars. Automated vehicles (AV’s) perform driving tasks without the control of a human operator, depending on their autonomy level. The Society of Automotive Engineers (SAE) defines 6 levels of vehicle automation from “0 = no automation” to “5 = full autonomy” to categorize automated vehicles [1]. Connected vehicles (CV’s) can communicate with other vehicles in traffic (V2V, vehicle to vehicle communication), with surrounding infrastructure (V2I, vehicle to infrastructure communication) and with clouds and computer server systems (V2C). This information sharing (IoV, Internet of Vehicles) has the aim of providing important benefits in terms of finding optimal driving conditions, patterns, and routes. Shared vehicles (SV’s) enable new transportation modes, aiming to reduce vehicle ownership rates and cost of vehicle kms travelled. Electrified powertrains of battery electric vehicles (BEV), plug-in hybrid electric vehicles (P-HEV’s), and (plug-in) fuel-cell electric vehicles (P-FCEV’s) make it possible to use renewable energy and thus reduce greenhouse gas (GHG) emissions.
Shared automated vehicles (SAV’s) are expected to have positive impacts in various areas. The most evident ones include: improved road safety (less collisions); less congestion (tighter-packed vehicle operation); better economy (mainly due to less collisions); increased productivity (the ability to work in vehicles and less time spent in traffic); greater accessibility to mobility (for younger people, seniors and people with special needs) [2]; equitable land use (optimal traffic management, automated highway systems [AHS], platooning, less parking spaces); lower cost of mobility; fewer barriers for public transit use (especially first and last mile barriers), and better fuel economy (finding optimal strategies for driving and powertrain operation, and route planning) [3,4,5,6].
The deployment of road vehicle automation also poses a number of challenges including: complexities in implementing supporting policy (e.g., testing on public roads, policy for insurance and liability and updating of traffic laws); uncertainties around public acceptance and adoption of these vehicles (in relation to demography and geography); alterations in the job market (mainly for professional drivers); likely decrease in governmental revenue (fees, taxes, traffic fines); increase in governmental expenses (infrastructure and services); data privacy and security of users; increased risks of cyber-attacks; enormous data storage requirements and social inequity based on allocation of resources (special parking lots, lanes or areas for (S)AV’s) [3,4,5,6].
Some factors are expected to contribute to lower energy use and GHG emissions, e.g., reduced congestion, reduced collisions, optimal traffic management, platooning, optimal driving strategies, and route planning. The environmental benefits of AV’s may be leveraged further with sharing (SAV’s) and with electrification (SAEV’s) if the electricity is obtained through low-carbon sources. Road vehicle GHG emissions are expected to decrease, mainly due to the replacement of owned (conventional) vehicles, with a smaller number of automated, shared, and electrified vehicles.
However, other factors arising from this mobility transition may lead to an increase in GHG emissions. Higher vehicle km’s travelled (a result of easier and more accessible mobility), higher average speeds (a result of optimized traffic flow), and wider use of mobility in general (a result of lower costs per km) would yield higher GHG emissions. Energy use and GHG emissions may also increase because of the unoccupied SAV’s returning home or to parking locations, driving to refueling/recharging locations, looking for parking places, or on the way to pick up new passengers.
AV’s or SAV’s will also impact urban sprawl (because of easier commuting), urban densification (because of no/less garages and no/fewer parking lots needed), highway engineering (because of significant physical infrastructure modifications like narrower lanes), off-road vehicle applications such as agricultural vehicles, mining vehicles or construction machines, and mobility on public or private land by using automated shuttles and campus commuters [7]. This study assumes that sprawl and densification will balance each other to 2060.
In May 2018, the province British Columbia (B.C.) of Canada updated emissions reduction targets and set goals with respect to 2007. The province is now committed to reductions of 40% by 2030, 60% by 2040, and 80% by 2050 [8]. Total GHG emissions in B.C. were 63.6 Mt CO2e in 2007 and 62.3 Mt CO2e in 2016 [9]. In 2016, transportation constituted 40% of the overall GHG emissions at 24.89 Mt CO2e. Road transportation emissions were 17.3 Mt CO2e, including all light-duty, medium-duty, and heavy-duty vehicles, motorcycles, propane, and natural gas vehicles. This amount corresponds to 27.8% of B.C.’s CO2e emissions.
This study conducts an analysis of the impacts of road vehicle automation, sharing and electrification on energy use, with a focus on B.C. Canada. Hypothetical scenarios regarding the transformation of B.C.’s road vehicle-based mobility for the years 2020 to 2060 are investigated. The paper starts with a literature review and continues with an analysis of B.C.’s road transportation statistics for 1990–2016. As in most other jurisdictions, road vehicle transportation in B.C. was almost completely dominated by internal combustion engine (ICE) vehicles in this period. The section on B.C.’s road vehicle energy use and GHG emission statistics is followed by the hypothetical scenarios assessing the energy-use impacts of vehicle sharing, automation, and electrification for the coming decades. Insights into SAEV’s energy use, as well as their implications for B.C. are presented in the discussion and conclusion.
In terms of energy use and GHG emissions, Miller et al. [10] note that although an overall increase in GHG emissions arising from all transportation operations is not unlikely, individual GHG emissions of functional SAVs can be reduced for passenger-km’s. In [11], the authors indicate that each SAV can replace 11 conventional vehicles, which adds up to 10% more travel distance than comparable non-SAV trips, so an overall beneficial emission impact is to be expected. According to Stephens et al. [12], the effects of SAV’s may lead to significant variation in expected energy use, ranging from a 60% reduction to an increase of up to 300% depending on various assumptions for the replacement of nearly all light duty passenger vehicles in the United States. Wadud et al. [4] also give results in both directions for energy use in the US depending on how real-world adoption evolves; a decrease by a factor of 0.5 or an increase by a factor of 2.0 is found. Delucchi et al. [13] analyze battery-electric, hybrid-electric, and fuel-cell vehicles in terms of technology, infrastructure requirements, GHG emissions, petroleum use, material use, lifetime cost, consumer acceptance, and policy initiatives. The authors conclude that the new electric vehicle era will reduce GHG emissions for most of the cases studied. The electrification of transportation accelerates the integration of renewable energy sources onto the electrical grid. In this study, we focus on travel-based energy use implications of vehicle automation and sharing as in [4], since lifecycle impacts of vehicle automation and sharing are expected to be smaller in magnitude.
B.C. announced a Zero Emission Vehicles Act (ZEVA) in 2019 [14] mandating all new light-duty cars and light-duty trucks sold in the province to be ZEV by 2040. A phased-in approach will be taken to reach this target: 10% of new light-duty vehicle sales by 2025, 30% by 2030, and 100% by 2040.
Numerous papers and reports have investigated the VMT (vehicle miles or km’s travelled) per individual vehicle or in total. Vehicle automation is expected to increase VMT, especially in connection with underserved populations; seniors, people with medical restrictions, and younger people with no driver’s license [2]. A comprehensive survey is presented in [15] showing a clear tendency for an increase of VMT for longer distance travels, but the AV energy use implications for driving for the purposes of commuting, recreation, and errands are unclear. Miller et al. [10] also report that long distance overnight travels by car instead of trains or planes can increase the passenger-mile emissions in the coming SAV-Era.
Bosch et al. [16] analyze the costs for autonomous mobility services and show that shared automated mobility will not be the only solution for mobility needs. They state that privately owned automated cars should also be highlighted, considering their flexibility as mobility robots. Bauer et al. [17] state that the cost per mile of a SAEV taxi fleet in Manhattan, New York is lower than a conventional taxi fleet, with savings on energy use and GHG emissions.
Concerning driving strategy optimization and widely adopted platooning, Wadud et al. [4] estimated an energy intensity reduction between 3% and 25% for light duty vehicles. The authors [4] calculated a reduction of 10–25% in energy intensity for freight trucks and concluded that a wide application of eco-driving practices, e.g., road networks with automated vehicles, might deliver little system-wide benefit. Similarly, Garci-Castro et al. [18] noted that if smoother accelerations/decelerations and longer headways are practiced on high traffic demand areas using SAV’s, emissions will rise, because of increased congestion and lower capacity. In terms of emissions, the effects of eco-driving are positive in low or medium demand areas with increasing number of eco-drivers. On the other hand, Stern et al. [19] performed a field test with automated vehicles and concluded that even less than a 5% share of automated vehicles in a traffic flow can dampen and support the flow of traffic. This finding may help transport authorities in managing traffic in critical passages before most vehicles in traffic are automated.
Another important factor is the occupancy rate of vehicles. The average occupancy of light-duty vehicles in the U.S. was 1.67 in 2017 [20]. If the era of SAV’s can bring about the optimum occupancy rates in trips, there is a high potential for saving energy, depending on vehicle size and mass. Wadud et al. [4] presented some hypothetical scenarios with optimized occupancy traffic for the U.S. The assumptions quantify fuel consumption savings of up to 45% in an optimistic scenario, especially when supported with car sharing [4].
Automated vehicles are accommodated in 33 states of the U.S. on public roads [21]. Research and development in the field of automated vehicles is being undertaken mainly in the US, UK, Canada, Sweden, Germany, France, China, South Korea, and Netherlands. New Zealand has legislation stating that it is not required for vehicles to have drivers [21].
Conventional mobility is evolving towards a concept that provides mobility as a service (MaaS). The vehicles used within this new framework will gradually have higher levels of automation and electrification. Walker et al. [22] state that global auto makers are ready for their first AV products on a timeline between 2017–2021 (Tesla in 2017; Toyota, Honda, Renault/Nissan, Hyundai and Daimler in 2020; Ford, Volvo, Fiat/Chrysler and BMW in 2021). An IEEE study [23] proposes that 75% of all heavy-duty vehicles in UK will be fully automated by 2040. Greenblatt et al. [24] predict that automated vehicles will be an emerging phenomenon in 2020, an accepted technology in 2030, and the dominant personal transportation medium by 2050. The adoption scheme of SAEV’s can be one of the primary factors in determining whether the energy use and GHG emissions related with road vehicle transportation in total will rise or fall [10,25].
According to the BP Energy Outlook [26], 3% of motor vehicles in traffic will be shared and human-driven by 2040, 20% shared and automated, and 7% privately owned and automated. Early adopters for SAV’s are expected to be fleets (taxi, bus, and delivery vehicle fleets) and heavy-duty-trucks capable of platooning on the highways. Automation of on-road vehicles can accelerate the adoption of shared mobility services since the need to go to central locations to pick up shared vehicles will diminish. If the vehicles can travel to places where the demand is, this might boost the popularity of on-demand services.
Modeling the realistic energy use and GHG emissions impacts of electric, automated, and shared road vehicle fleets requires methods which must consider the interactions among the users of these disruptive technologies [27]. One such method is agent-based modeling that supports the use of real trip data and road network information [17].
Chen et al. [28] presented a data rich analytical framework for quantifying AV’s fuel consumption impacts for the US. The authors used a dynamic vehicle stock and turnover model, a historical VMT activity database and considered the development of vehicle specific fuel consumption in the investigated time period. They concluded a reduction of 45% and an increase of 30% in the optimistic and pessimistic scenarios, respectively.
Erhardt et al. [29] state that transportation network companies increase traffic congestion and travel times in San Francisco, California. The authors found that in the years 2010 to 2016, vehicle hours of delay (VHD) have increased by 63%. VHD is defined based on the time difference of free traffic flow and congested flow.
There is limited research on the potential of energy use savings in EVs with the help of vehicle connectivity. Qi et al. [30] evaluated a so-called eco-driving system first as a driver assistance system and then as partial automation. They report that there are energy saving potentials of up to 12% and 22% for systems they have implemented, respectively. Vehicle connectivity can leverage the positive effects of vehicle automation and electrification.
There are a few studies in the literature with a focus on B.C.’s energy use in transportation and GHG emissions. Herrera et al. [31] considered a scenario for 2020 simulating projected amounts of BEV’s and FCEVs in the vehicle stock. The electric energy use of these EVs was calculated and the effect on GHG emissions was estimated. Kamiya et al. [32] compared the GHG intensities of the Canadian provinces Alberta, British Columbia, and Ontario forward to the period 2015–2050. The originality of this study is that there are no previous integrated studies on the impacts of SAEV’s on energy use for the unique case of B.C., Canada, given its fleet makeup and energy generation mix and large transportation contribution to overall provincial emissions.
2. Materials and Methods
2.1. Current Road Vehicle Energy Use and GHG Emissions in British Columbia
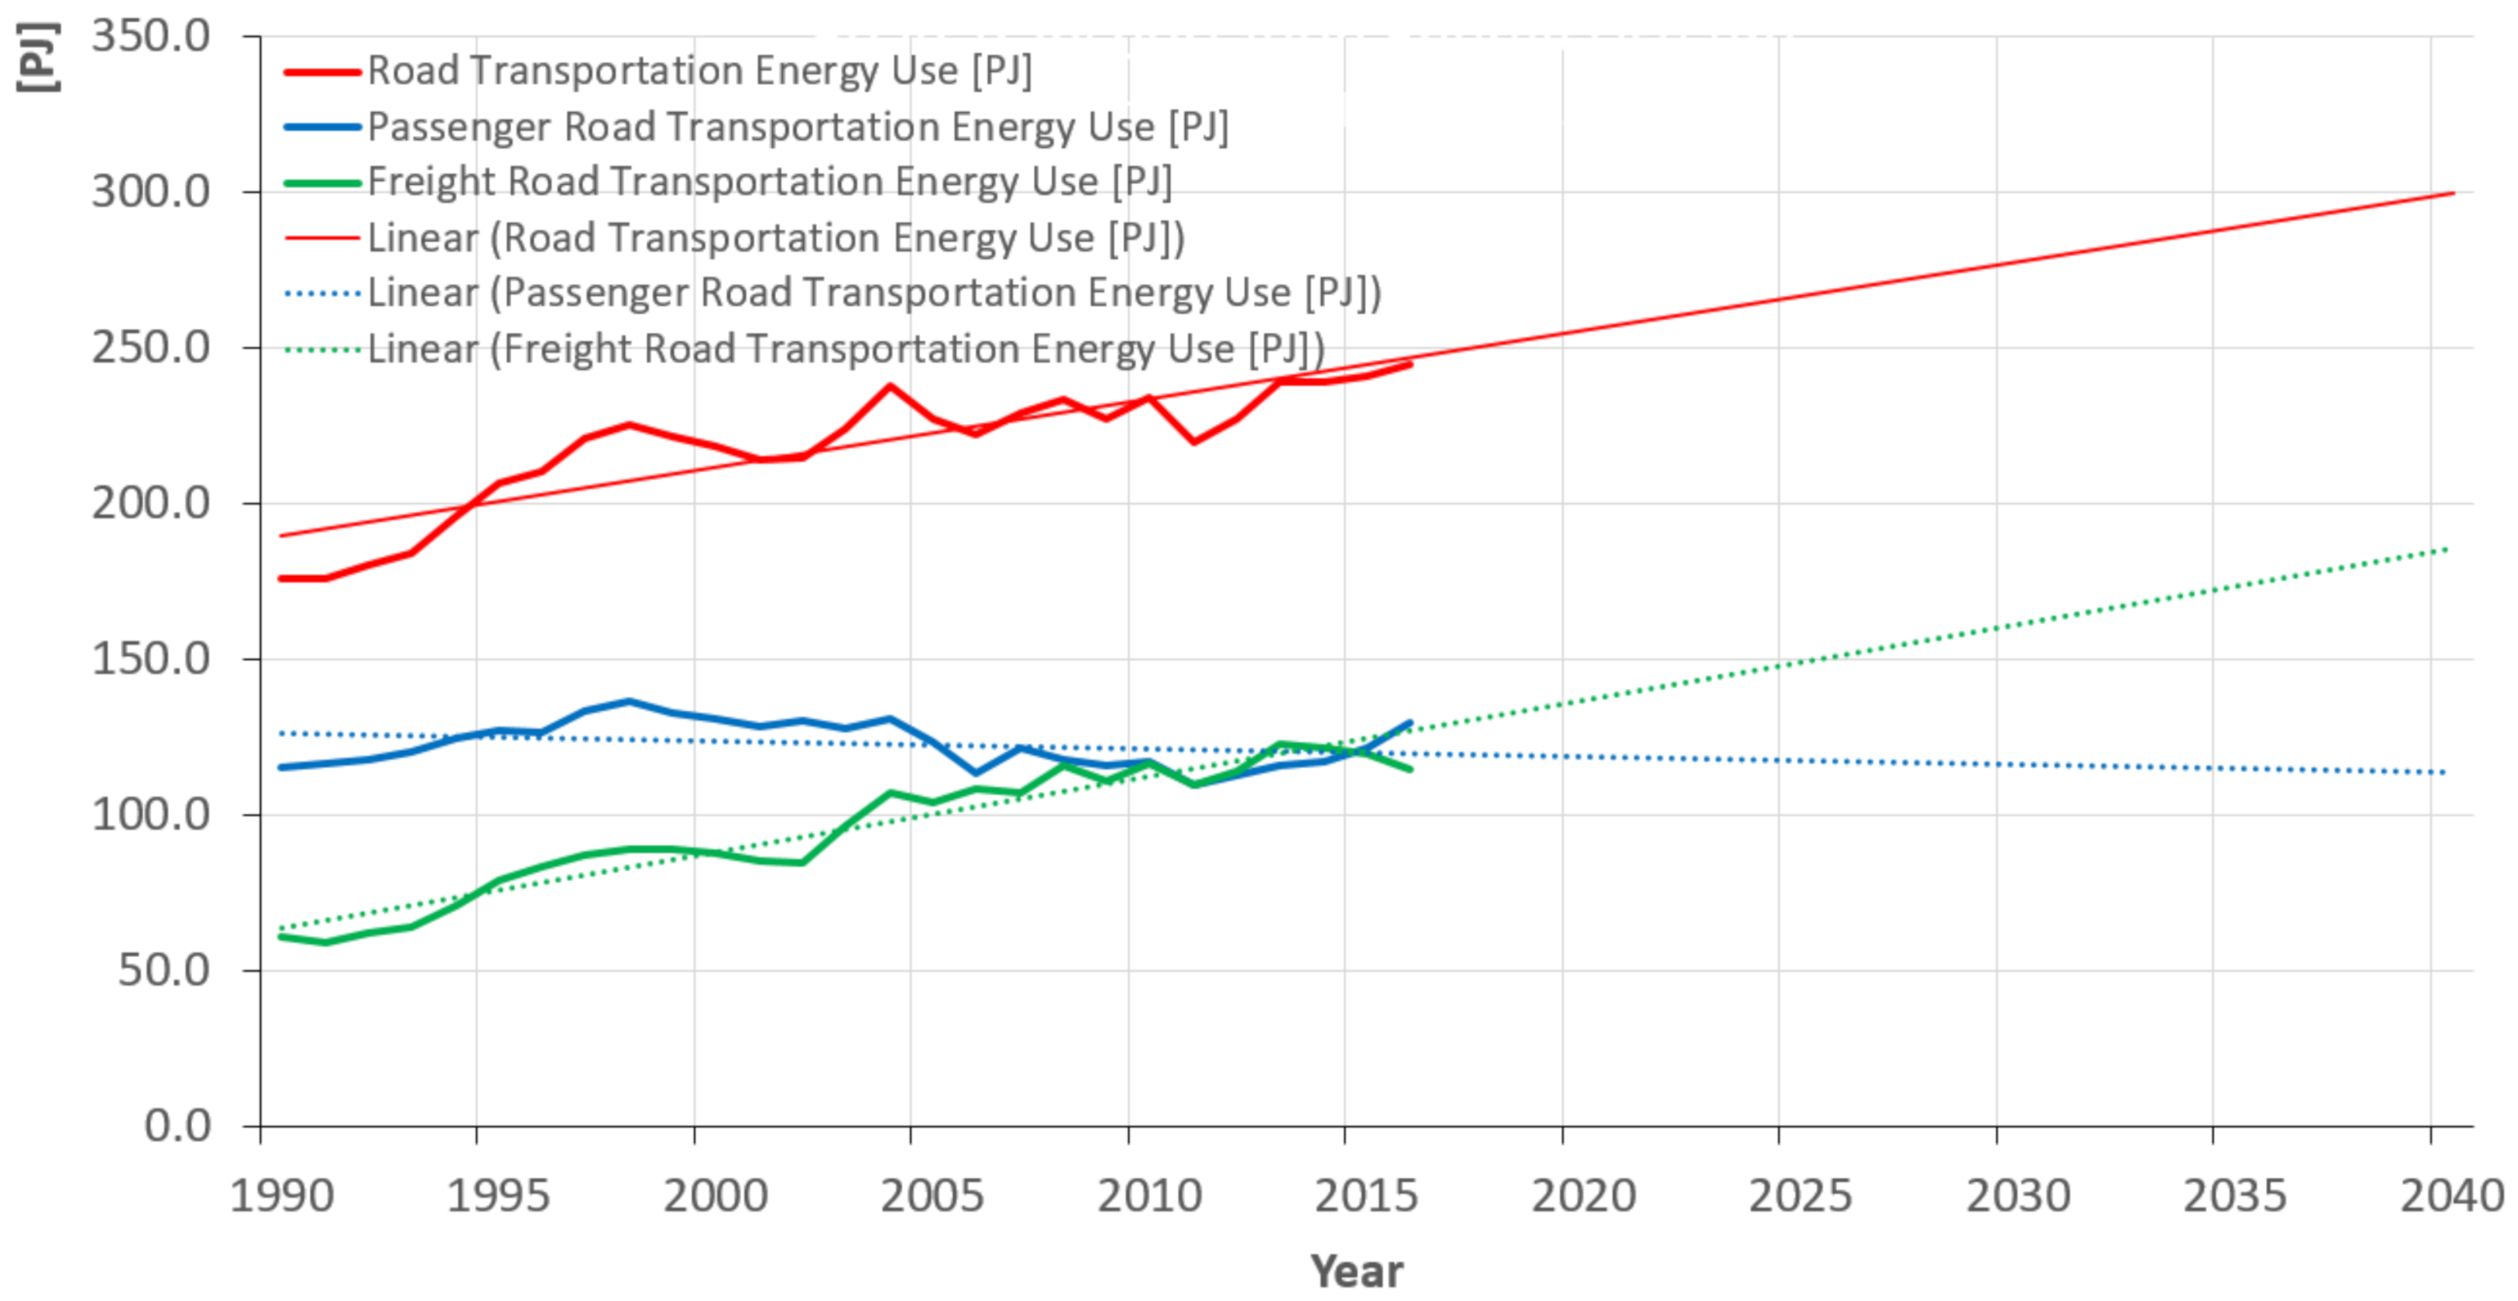
Figure 1 provides a historical look at road transportation energy use in B.C., Canada, and illustrates the increasing trend in energy use for road transportation, mainly due to freight transportation. Passenger transportation by means of road vehicles shows a slight decrease over time. Data used in this figure has been obtained from Natural Resources Canada (NRC) [33].
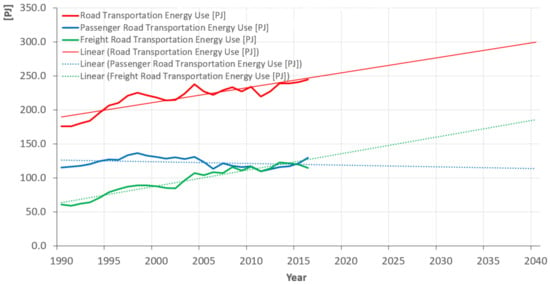
Figure 1.
B.C. Road transportation energy use, data from [33].
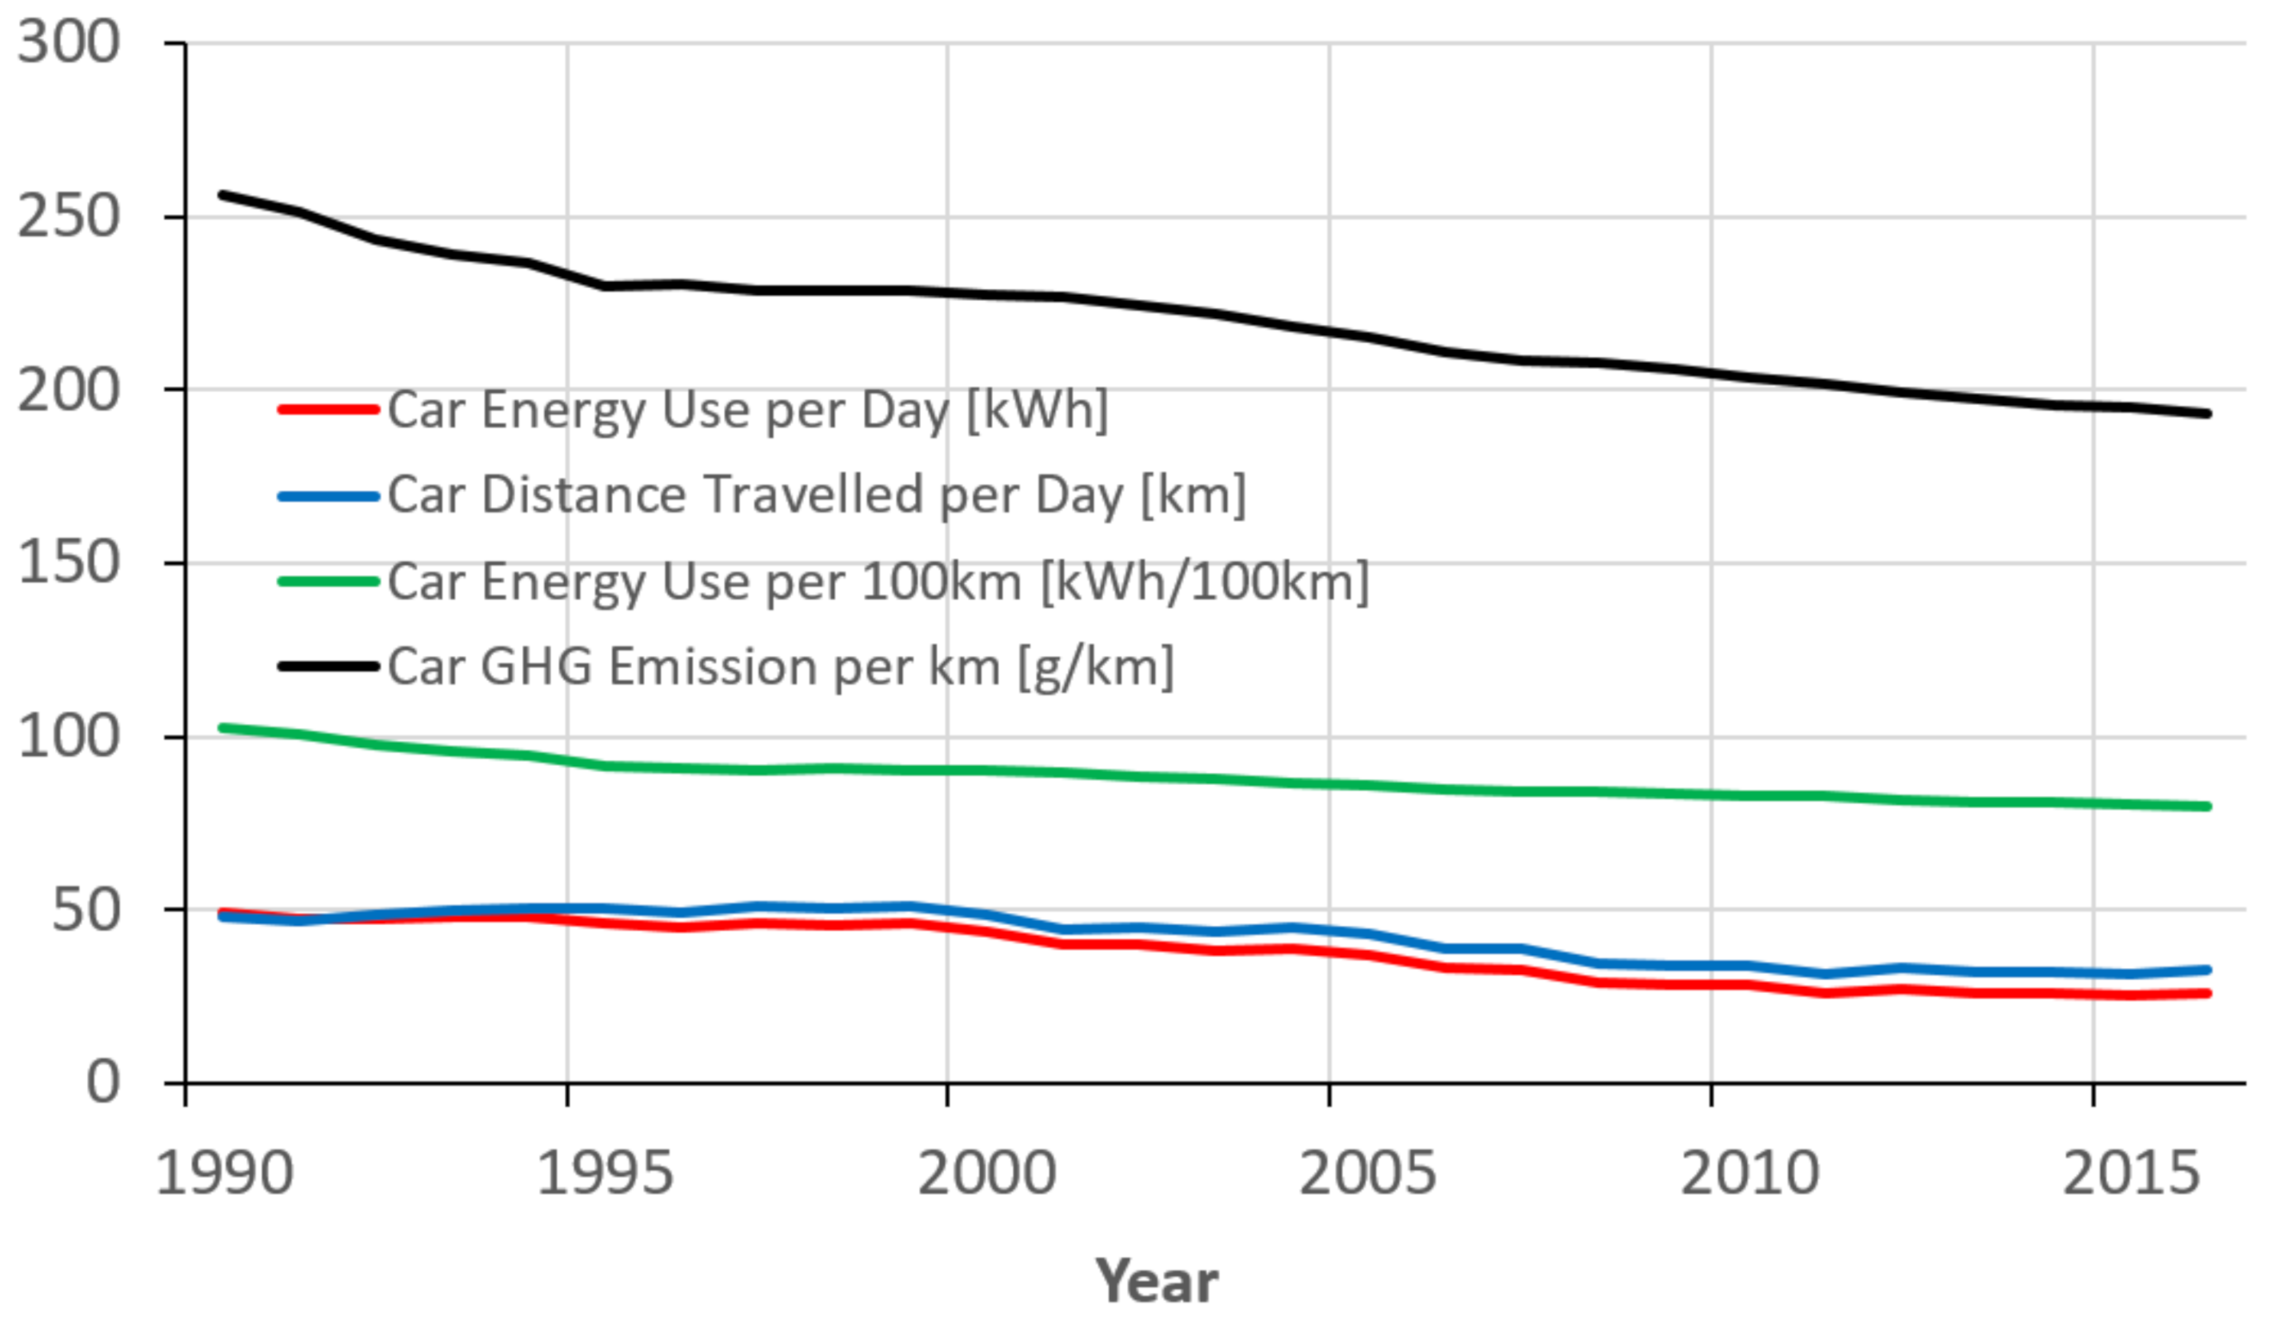
Figure 2 depicts the energy use and GHG emissions of cars in B.C., based on NRC data [33]. The data shows an average energy use of 88 kWh per 100 km for cars between 1990–2016. The average energy use (fuel consumption) of cars is seen to be decreasing, similar to [34]. This tendency can be leveraged to a great extent with the adoption of battery electric cars which present common energy consumption values around or below 20 kWh/100 km [35]. The average GHG emissions of cars in B.C. in this time frame is 220 g/km and show a trend to go below 200 g/km in the coming years. The use of renewable electricity in the B.C. grid is highly promising with its low carbon intensity of 10 to 30 tonnes of CO2e per GWh [36]. A simple calculation for 20 kWh/100 km and 30 tonnes of CO2e per GWh yields a GHG emission level of 6 g/km if cars are operated with pure electric powertrains. Figure 2 illustrates also the average daily distance travelled and energy used of B.C. cars.
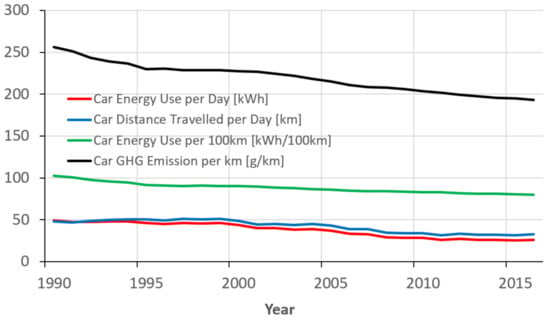
Figure 2.
Distance Traveled, Energy Use & GHG Emissions of B.C. Cars (1990–2016), data from [33].
NRC data is evaluated for cars, buses (school, urban transit, and inter-city buses), and trucks (passenger light trucks, freight light trucks, medium trucks, and heavy trucks) and summarized in Table 1.

Table 1.
Energy use and GHG emissions of road vehicles in B.C. (Average for 1990–2016, except motorcycles) [33].
Vehicles with electrified powertrains have well-known examples in the market, both in terms of cars and urban transit vehicles. Electric school buses are making their first market introductions, and the first battery-electric passenger light trucks and freight light trucks have been presented to the market in recent months. There are nevertheless still relatively few electric cars on B.C. roads and electric trucks do not exist as commercial products in B.C., other than some small demos. As a result, most electric vehicles classes were almost absent from B.C. transportation statistics until 2016 [33]. The most recently available report on EVs in BC for 2020 saw 9.4% of new light-duty vehicles sales be ZEVs (plug-in, pure battery electric, and hydrogen), with 40,013 BEVs registered in BC out of approximately 3.1 M total registered vehicles [37]. Statistical data on urban transit buses, mainly due to trolley buses in the Vancouver area, is the only data available that shows the share of electric energy use for road transportation.
Vehicle and ride sharing has been introduced to the market with passenger cars. Examples of automated vehicles are also generally passenger cars. BC in particular did not permit ride sharing/hailing until 2019. Vehicle sharing and automation are relatively new technological disruptions for road transportation, and adoption rates are quite small in B.C., hence no data is yet available from the relevant B.C. Government sources for the past years [33].
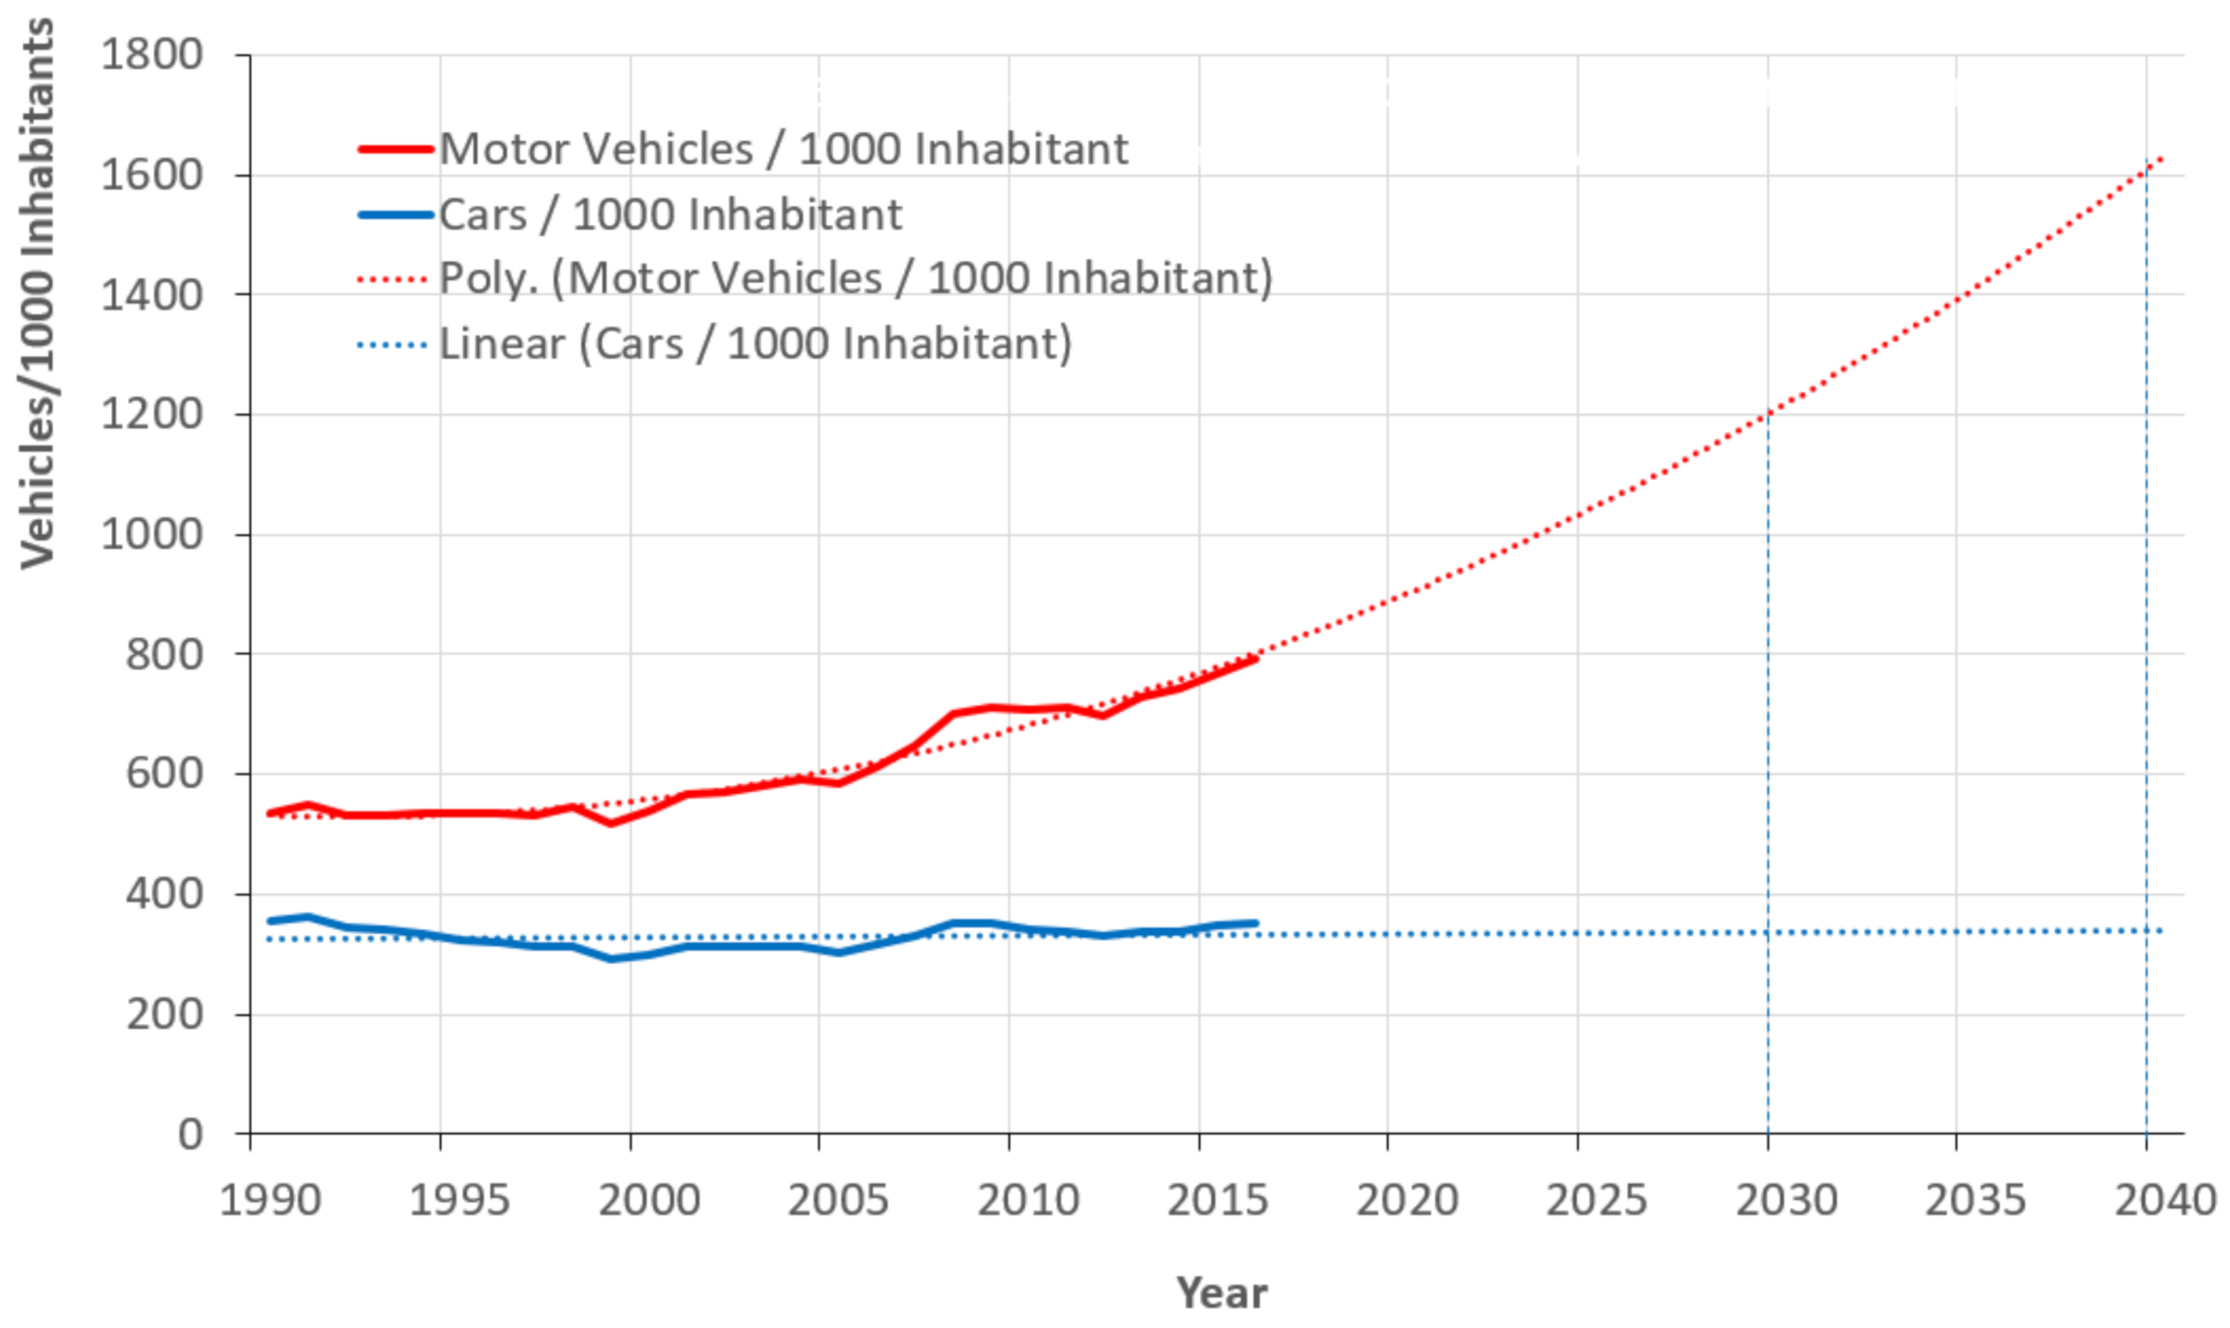
Figure 3 shows the B.C. motor vehicle stock and car stock per 1000 inhabitants since 1990. The car density has remained nearly constant in the last decades, while the motor vehicle density has increased. B.C.’s population has increased over this period [38] so absolute stocks have grown. Vehicle stocks in 2030, 2040, and beyond are highly uncertain, because of the disruptive effects of vehicle electrification, vehicle sharing, and vehicle automation.
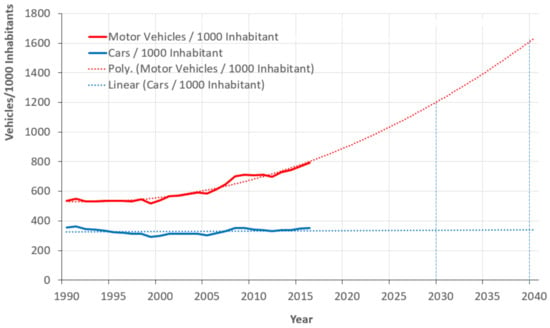
Figure 3.
B.C. Motor vehicle stock and car stock per 1000 B.C. inhabitants, data from [33,38].
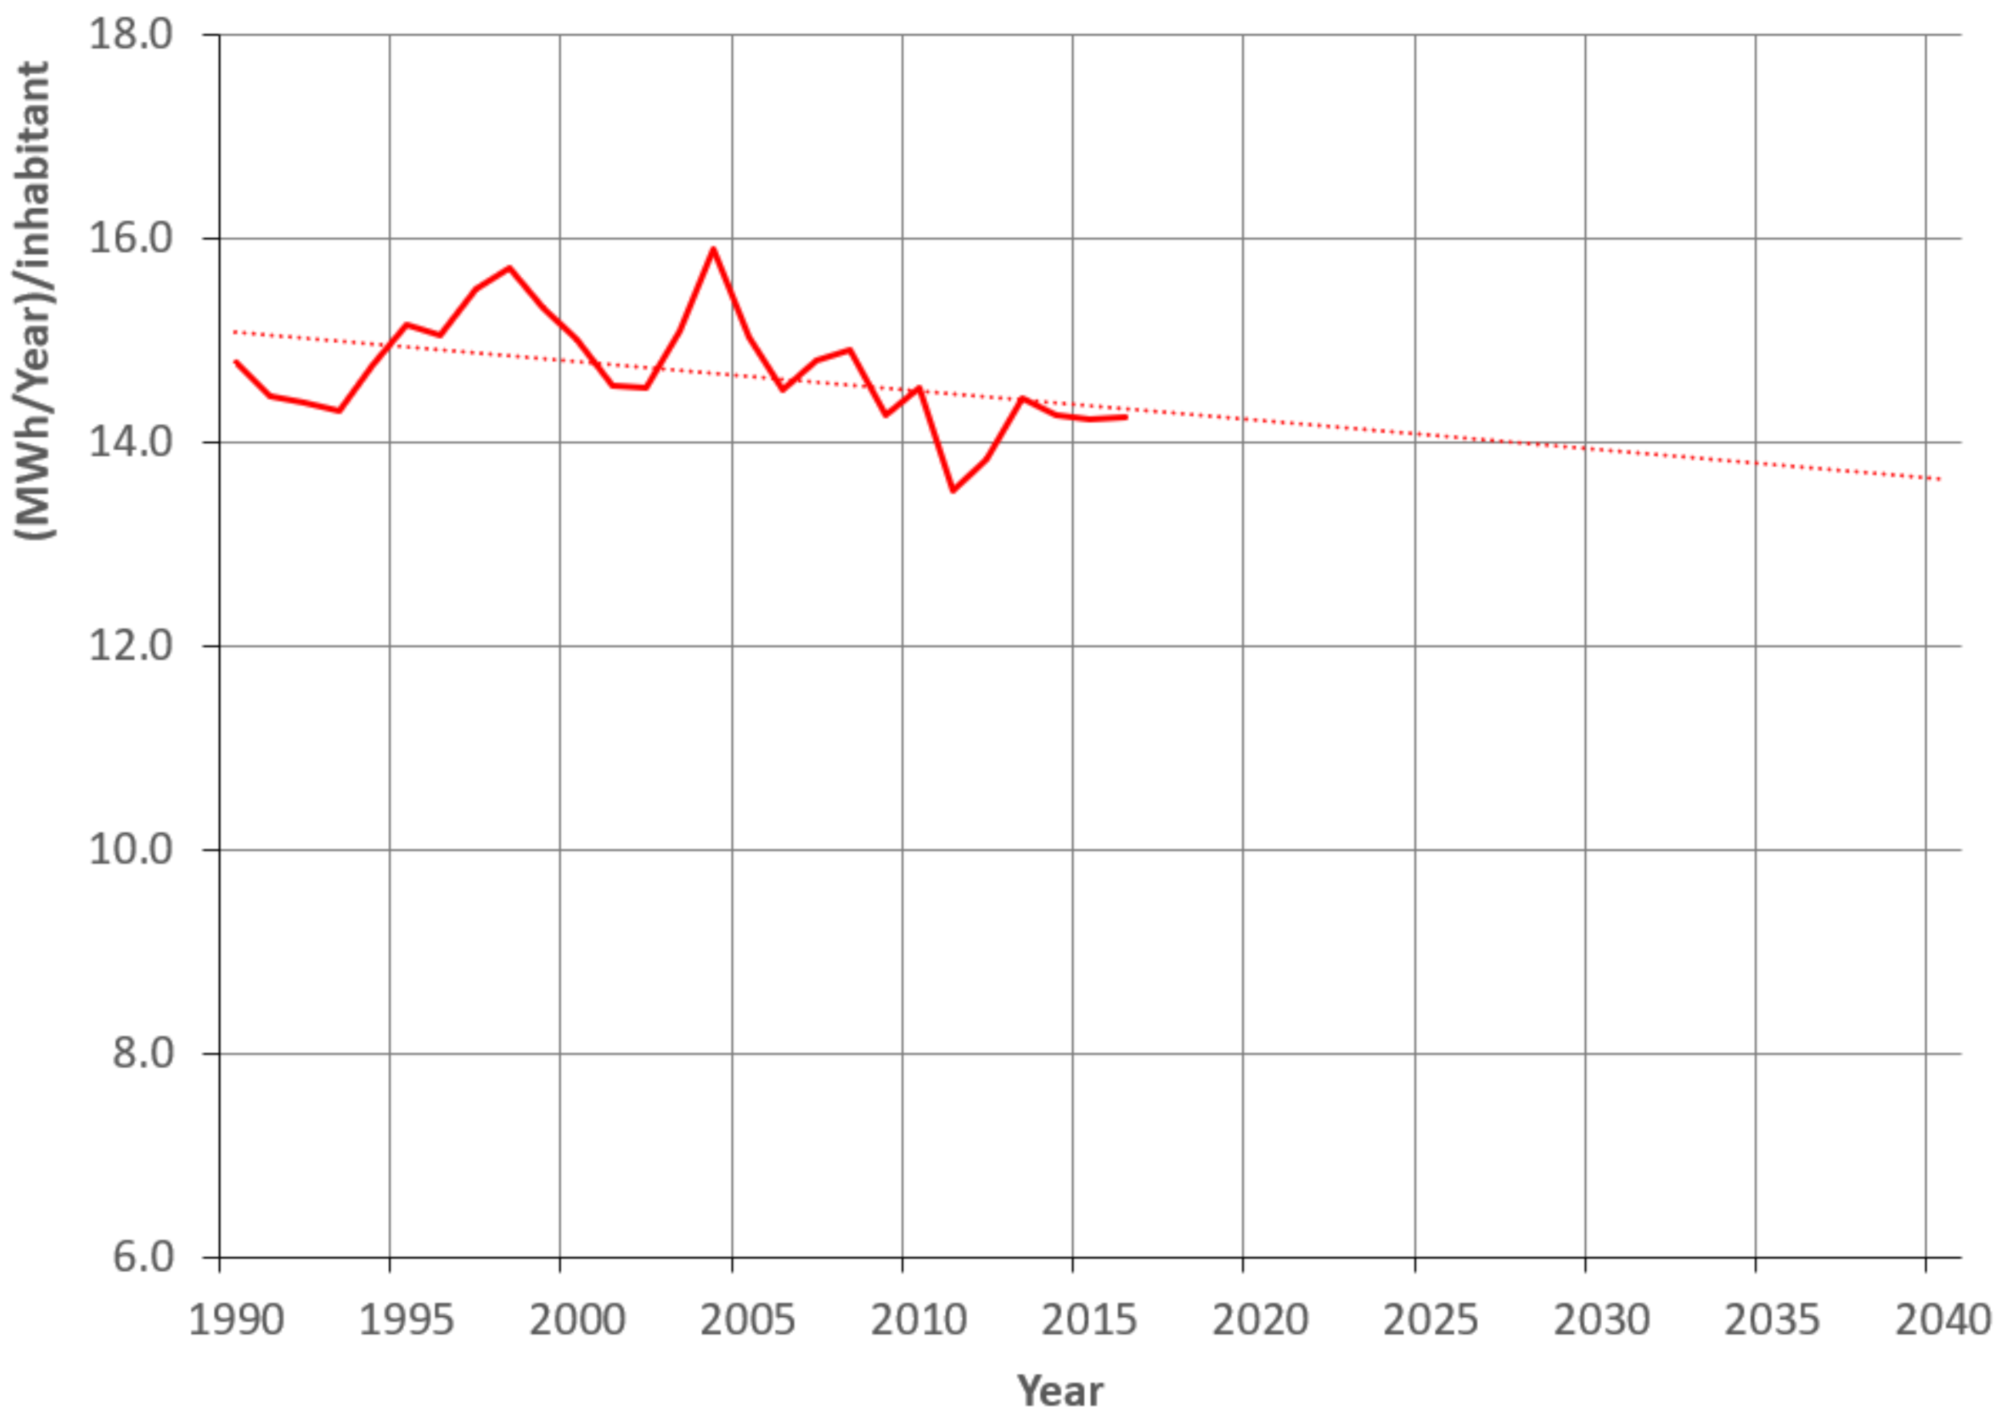
Figure 4 provides an overview of energy use in the last decades and illustrates a tendency towards less road vehicle energy use per inhabitant. This effect in Figure 4 will be considered in this study in terms of Canada Energy Regulator’s (CER) projections for transportation. CER uses assumptions within the published scenarios. The projections of CER use Canadian energy and climate policies, expected crude oil, and natural gas prices, Solar power, onshore wind power, and EV battery price assumptions to make projections up to 2050.
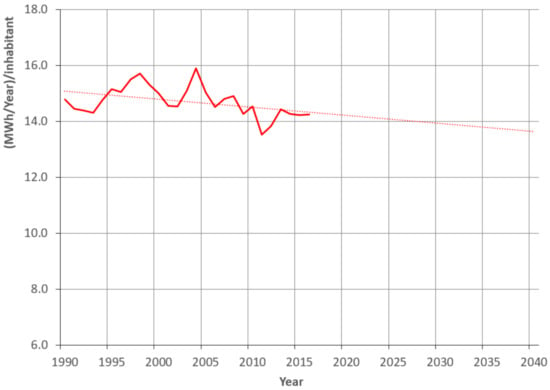
Figure 4.
B.C. Road transportation energy use per year per inhabitant, data from [33,38].
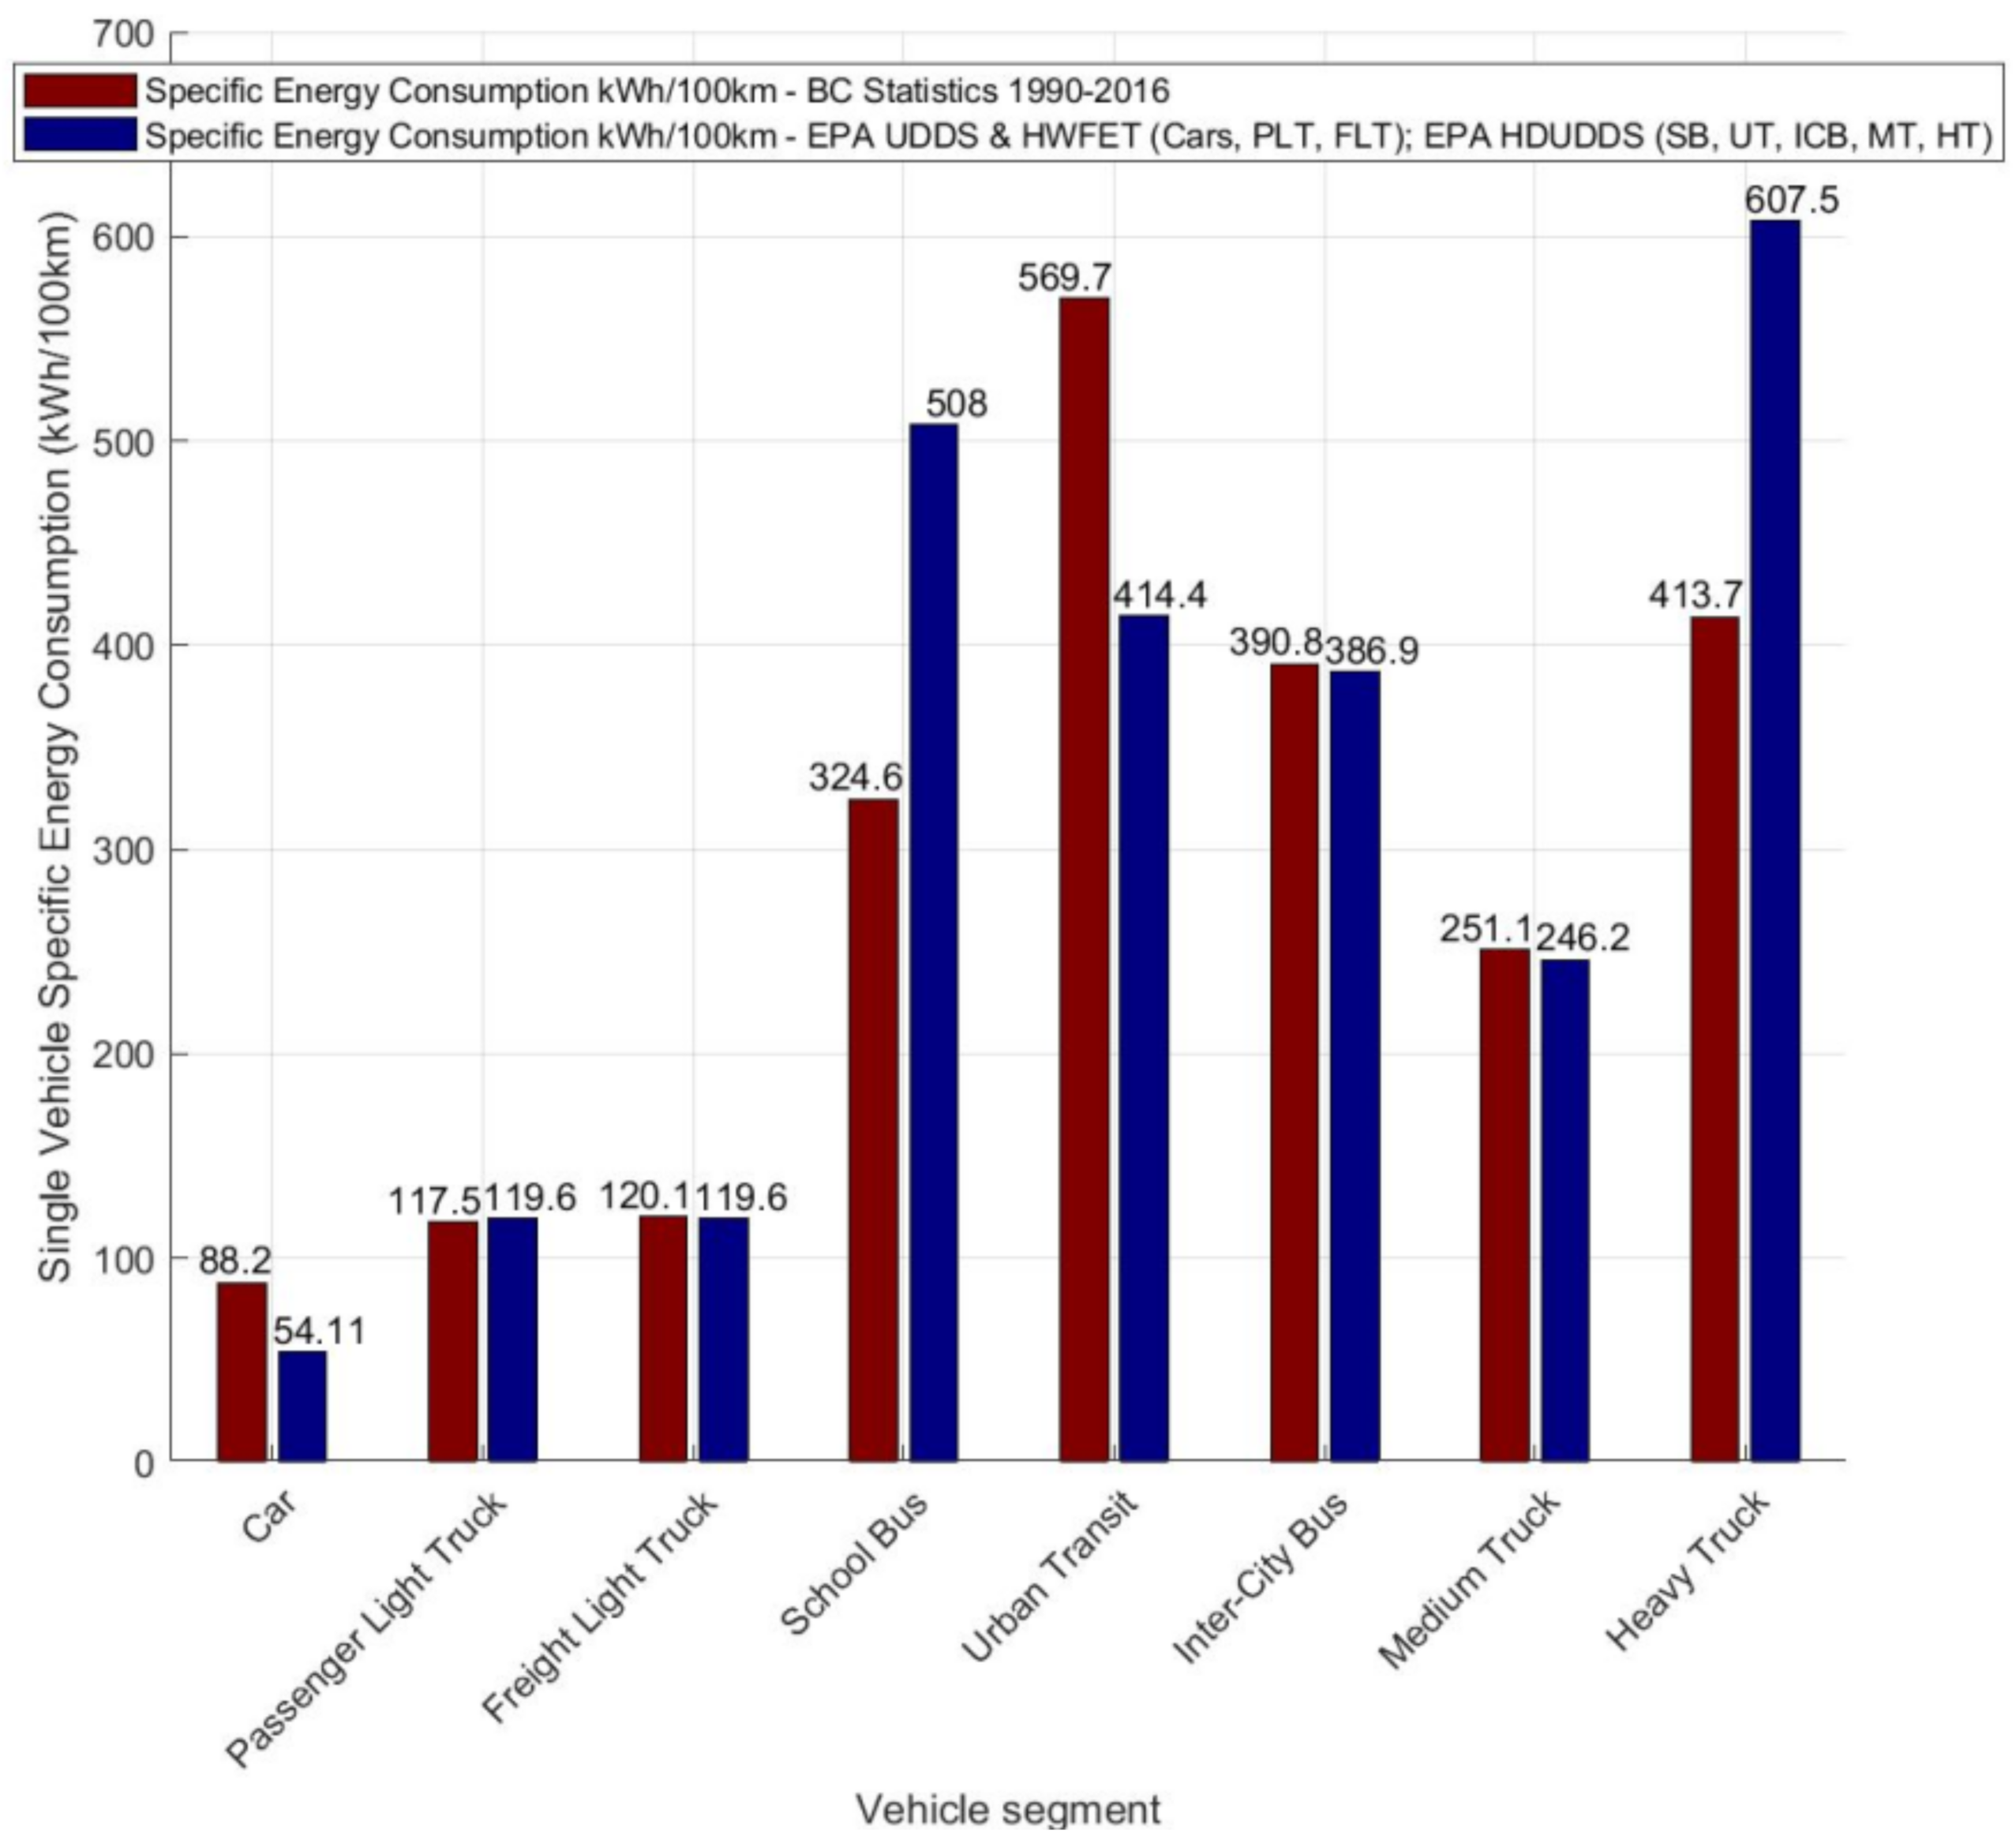
Figure 5 presents a comparison of statistical B.C. road vehicle energy use data with a driving schedule simulation using different vehicle classes. The simulation uses representative vehicle specifications corresponding to vehicle classes in terms of vehicle mass, aerodynamic properties, and tire rolling resistance. The results are presented as specific energy consumption in (kWh/100 km). For cars, passenger light trucks (PLT) and freight light trucks (FLT), EPA UDDS and HWFET driving schedules were used; for school buses (SB), urban transit vehicles (UT), inter-city buses (ICB), medium trucks (MT), and heavy trucks (HT), EPA HDUDDS driving schedule was used for calculations. B.C. statistical energy use data shows good agreement with the driving schedule simulation, especially for certain vehicle classes like PLT, FLT, ICB, and MT. The vehicle data used is given in the appendix (Appendix A).
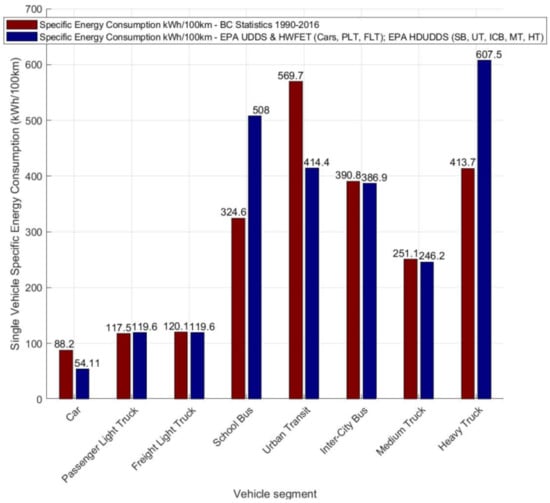
Figure 5.
B.C. Road transportation energy use, statistical data vs. driving schedule simulation, B.C. statistical data from [33].
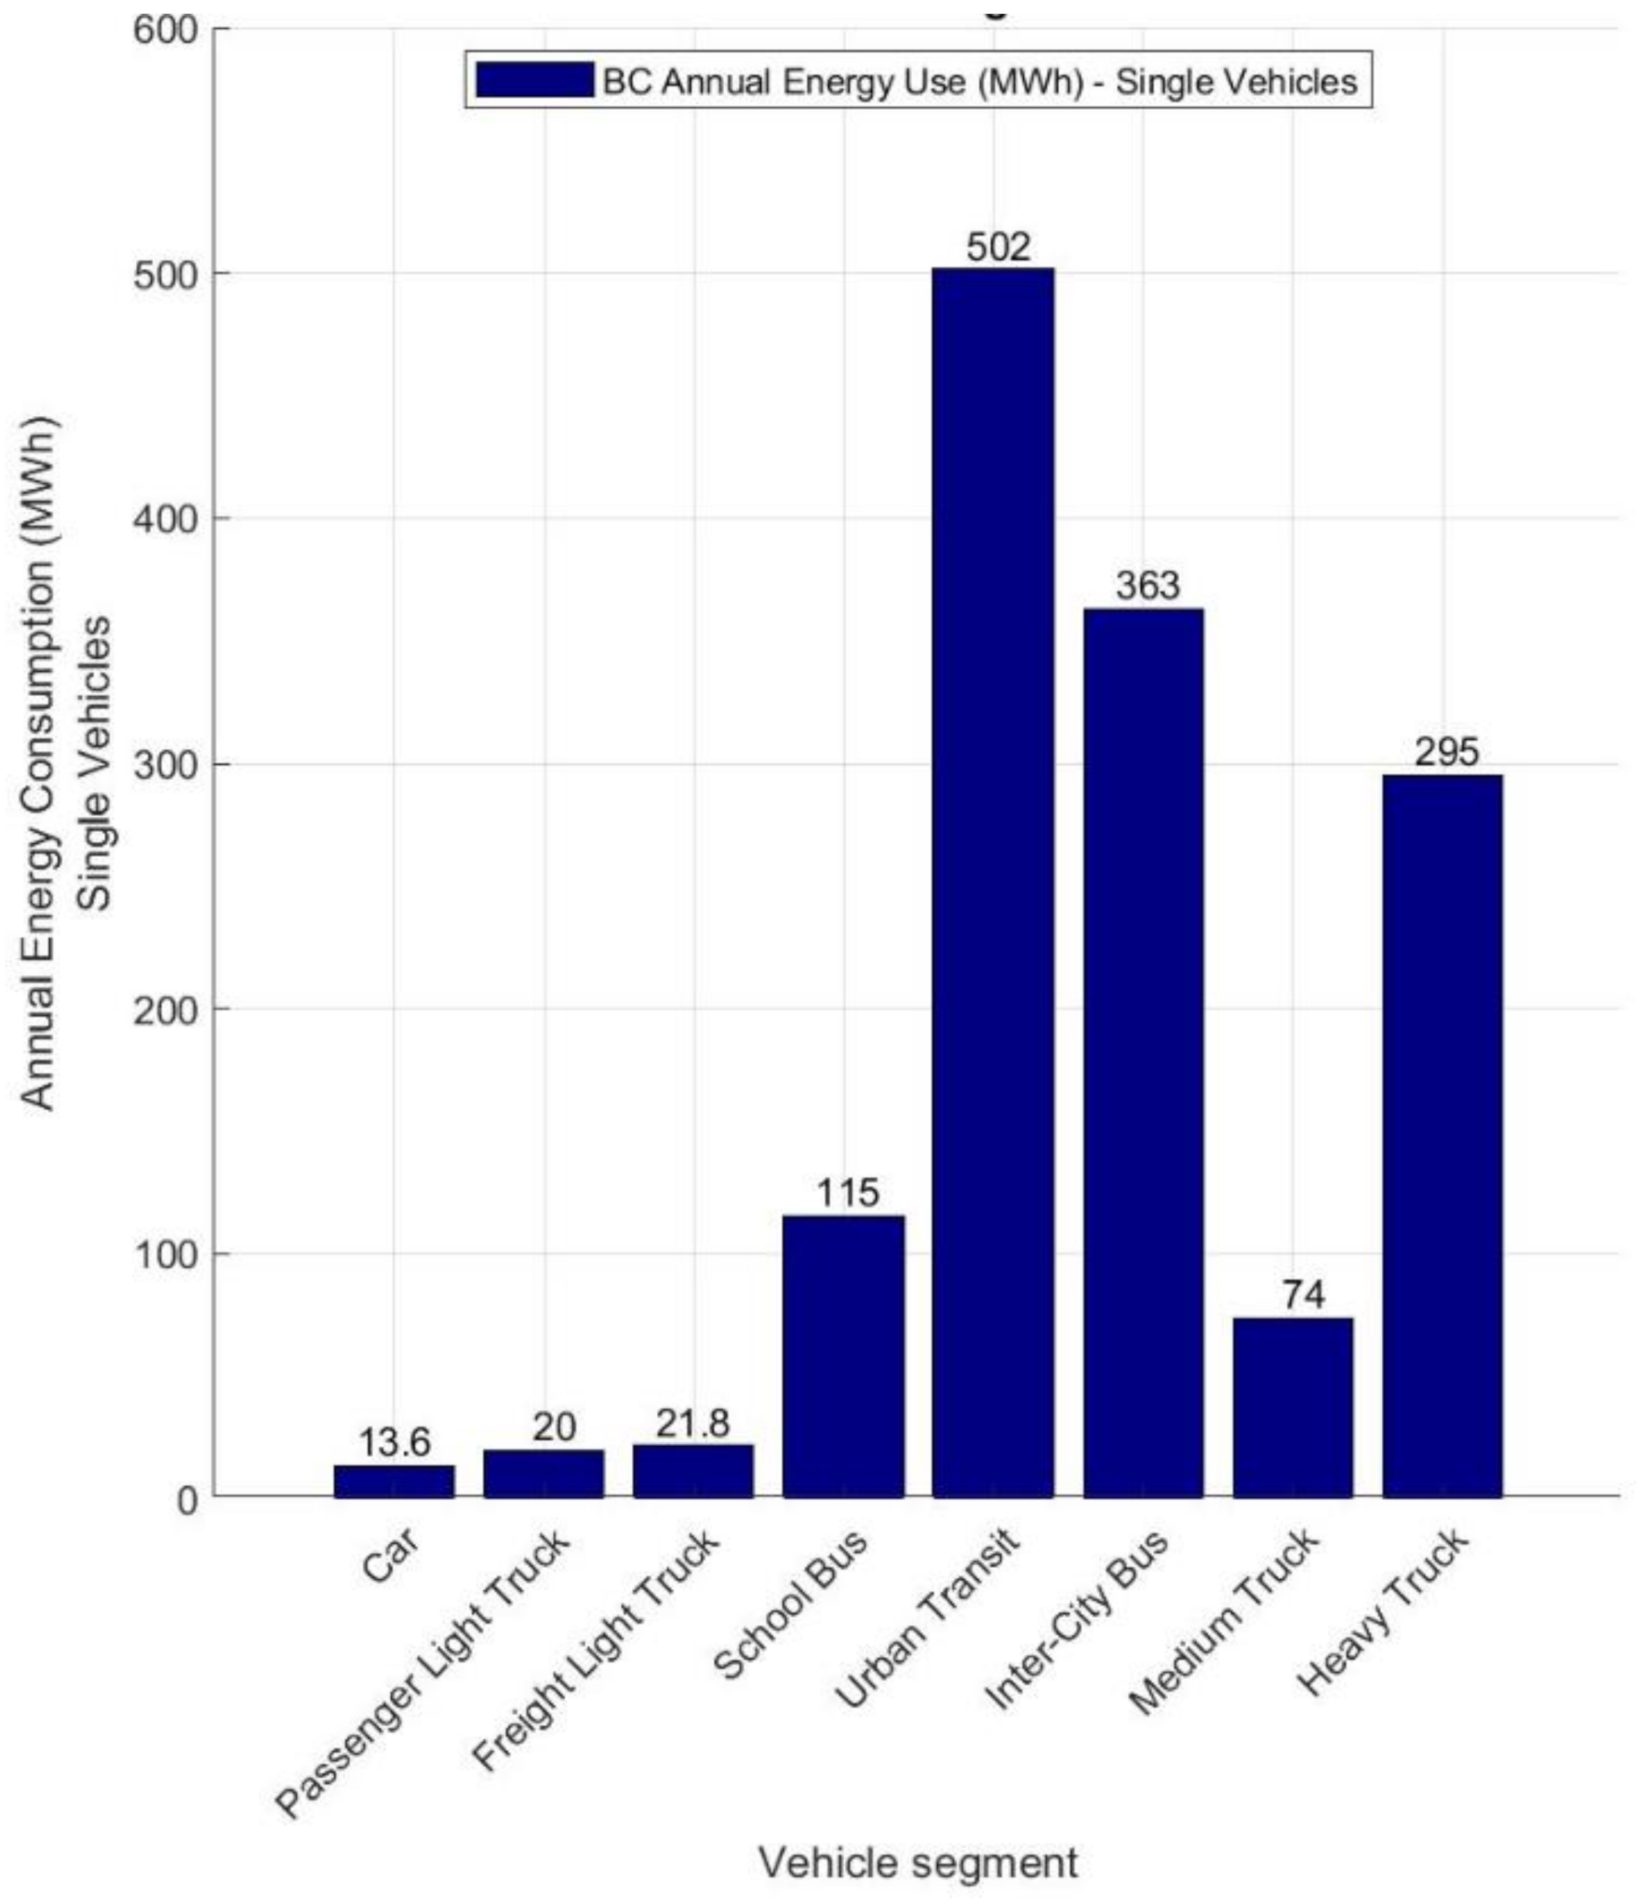
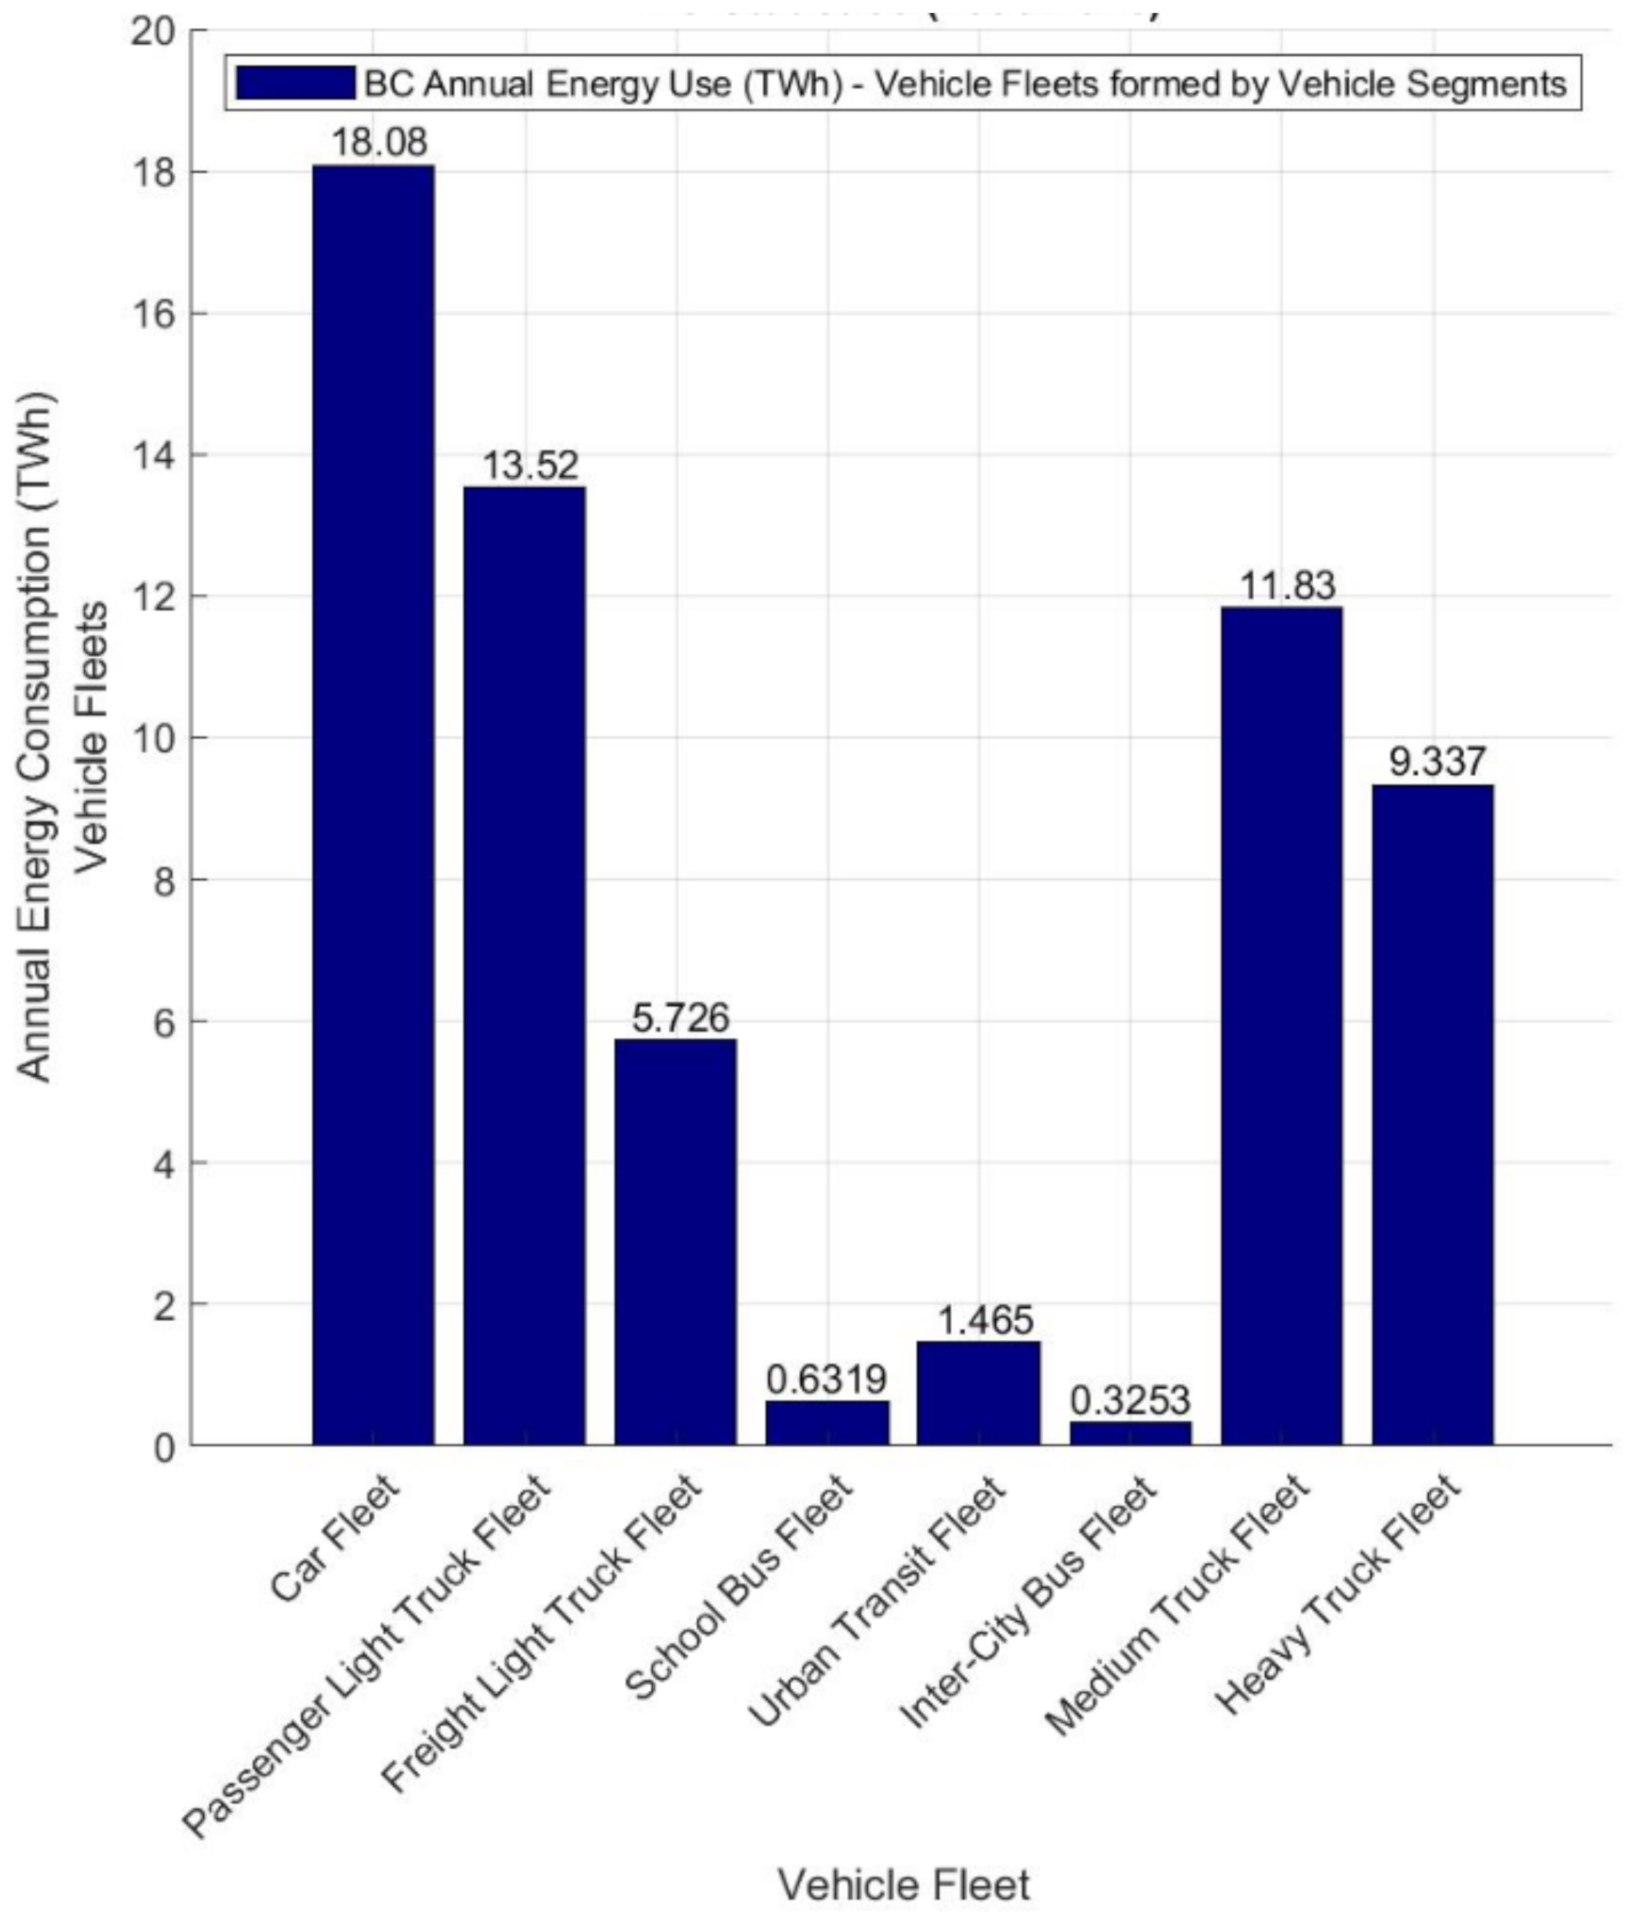
Figure 6 and Figure 7 illustrate single vehicle annual energy use (MWh) and vehicle fleet annual energy use (TWh) according to B.C. statistics [33]. In the single vehicle energy use approach, the UT, ICB, and HT are the vehicles which consume the maximum amount of energy per year. From the viewpoint of vehicle fleets however, cars, PLT, and MT are heavily represented in the annual energy use budget.
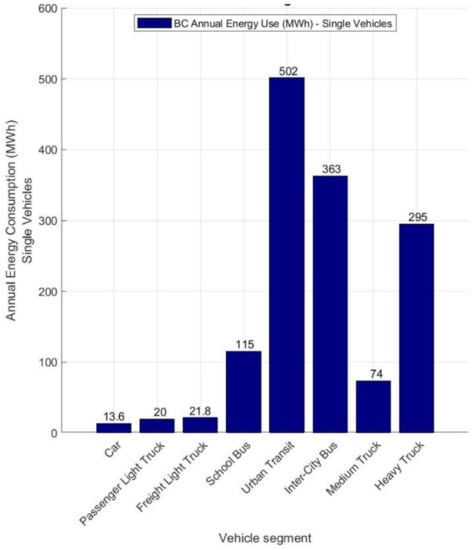
Figure 6.
B.C. road transportation annual energy use for single vehicles in (MWh), B.C. statistical data from [33].
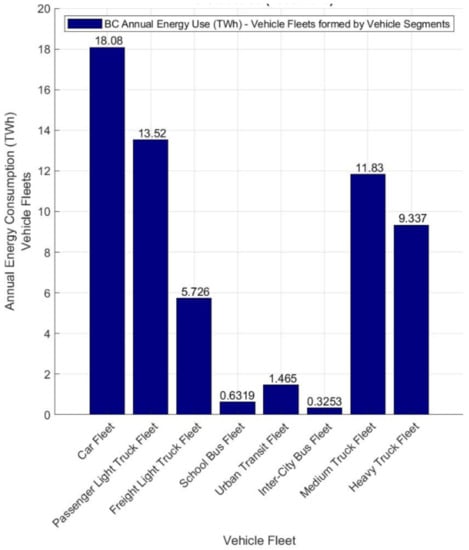
Figure 7.
B.C. road transportation annual energy use for vehicle fleets in (TWh), B.C. statistical data from [33].
Wide adoption of SAEV’s will doubtlessly change the energy use and GHG emissions of transportation. The existing literature shows both decreasing and increasing tendencies, frequently even within the same publication because of the uncertainties involved. The cumulative impact of the scenarios applied in this study show decreasing tendencies for energy use, if vehicle automation and sharing is adopted in parallel to vehicle powertrain electrification using renewable energy sources. About 90% of B.C. grid electricity is generated from renewable sources which is a strong motivator for powertrain electrification [39]. The tables below show our modelled assumed future year % changes across the four scenarios considered in 10-year increments in the later part of this paper.
2.1.1. Factors Decreasing Road Transportation Energy Use
Table 2, Table 3, Table 4, Table 5 and Table 6 summarize the impacts of vehicle electrification, sharing, and automation, on road transportation energy use. To study these impacts, four hypothetical scenarios for B.C.’s road vehicles, except motorcycles, to the year 2060 are created. The road transportation energy use scenarios represented as percentage changes are given in the tables for four scenarios: conservative scenario (CS), business-as-usual scenario (BAU), leveraging scenario (LS), and disruptive scenario (DS). These estimations, given in brackets, correspond to changes in energy use in the [CS, BAU, LS, and DS] scenarios, and are calculated with respect to the reference year 2016. New technologies, services, and other disruptive events [40] which may reduce or eliminate the need for transportation are summarized in Table 7. The effects incorporated in Table 7 are: flexible working schedules (e.g., off days, work from home days), less attendance to on-site events (e.g., live stream of events like meetings, webinars, conferences, concerts), online shopping, local-manufacturing of goods using 3D printing, and disruptive events like the epidemics implying total or partial lockdowns of communities (e.g., COVID-19).

Table 2.
Impacts of vehicle powertrain electrification on road transportation energy use.

Table 3.
Effects of SAEV on different user groups.

Table 4.
Impacts of vehicle parking, fueling, and charging on road transportation energy-use.

Table 5.
Impacts of vehicle automation on road transportation energy-use.

Table 6.
Impacts of vehicle sharing on road transportation energy-use.

Table 7.
New technologies affecting road transportation needs [40].
The factors expected to decrease transportation energy use are reflected using negative signs for the influencing factors in the last column.
2.1.2. Factors Increasing Road Transportation Energy Use
Effects of SAEV on different vehicle user groups are summarized in Table 3. The factors included in this table are expected to boost energy use, so the numbers have a positive sign.
2.1.3. Mixed Effects and Other Uncertainties in Energy Use
There is a large space of domain interactions among these new technologies where most of the studies indicate contradicting results. These are the effects arising from vehicle parking, fueling, and charging, urban sprawl and densification. Table 4 summarizes the effects of vehicle parking, fueling, charging, and deadheading. Urban sprawl and densification are thought to be in balance within this study, leading to a net zero effect on energy-use.
2.1.4. Parameters with No Expected Effects on Energy Use
There are some parameters which are not expected to impact the energy use scenarios in the next decades. Table 8 summarizes these parameters and gives a brief description of their influence on road transportation.

Table 8.
Parameters which will not change drastically in the next decades.
The transition to shared, electric, and automated vehicles will realistically occur on the scale of decades. This study assumes that there will be no obvious and immediate changes in average travel speeds, maximum speeds, vehicle powertrain power levels, vehicle sizes, and weight of passive safety equipment. Vehicle compatibility must be maintained in vehicle traffic, so even if some of these factors change, they will only change gradually over years. Special conditions like lower passive safety standards or drastic powertrain downsizing will be applicable to vehicle design and operation only after achieving very high market penetration of SAEV’s (near 100%). Vehicles with special design and operation conditions can also be encountered today, mostly in special areas that are closed to traffic or in the form of low-speed commuters on pre-set routes.
If automated vehicles are used for long distance travel instead of rail or airplanes, they need to have more room and offer a higher level of comfort and luxury, leading to increased vehicle size, weight, and energy consumption. These changes will be taken into consideration in a future study and are out of the scope of this study.
2.2. Study Scenarios to 2060
This study considers four hypothetical scenarios for B.C.’s road transportation vehicles, except motorcycles, to the year 2060 and predicts the effects of vehicle sharing, automation, and electrification on road transportation energy use. The energy use scenarios represented as percentage changes in brackets are given in the Table 2, Table 3, Table 4, Table 5, Table 6 and Table 7 for four scenarios: conservative scenario (CS), business-as-usual scenario (BAU), leveraging scenario (LS), and disruptive scenario (DS). These estimations correspond to changes in energy use in the [CS, BAU, LS and DS] scenarios, and are calculated with respect to the reference year 2016.
The estimates found in literature are also given in each table. Predictions for the conservative scenario (CS) and the business-as-usual scenario (BAU) are generally within the numeric limits found in literature. The leveraging scenario (LS) and disruptive scenario (DS) foresee more dynamic technology adopting schemes inspired by recent technology disruptions, like digital cameras, mobile phones, and internet use and services. Forward-predictions are made using these percentage changes to baseline projections to explore the range of future scenario possibilities. Each of the assumptions in Table 2, Table 3, Table 4, Table 5, Table 6 and Table 7 are incrementally applied to isolate the impacts of various considerations in SAEV adoption.
The percentual changes of road transportation energy use are calculated in decadal time steps using MATLAB, using an equation incorporating all implications of technology adoptions (Table 2, Table 3, Table 4, Table 5 and Table 6) and transportation need changes (Table 7). This equation is like Kaya Identity [45] and is named here as EIF (Energy Implications Factor). EIF is calculated as follows:
EIF = 1 − [(Implications)Vehicle_Electrification × (Implications)Vehicle_Automation × (Implications)Vehicle_Sharing × (Implications)Other_Disruptive_Technologies]
EIF is a factor between 0 and 1. The terms within [1] are the percentual numbers in the Table 2, Table 3, Table 4, Table 5, Table 6 and Table 7, considering both positive and negative implications of affecting factors. EIF values which are closer to 1 indicate higher savings in transportation energy use.
The direct impact of BC’s population growth projections for the next decades on per inhabitant transportation demand or energy (Figure 4) was left out of the calculations in this study due to the uncertainty in range of factors (e.g., efficiency of EV powertrains; improved traffic flow through automated driving; vehicle sharing; online learning; work from home; e-commerce and online shopping). It is currently unclear how the new generations will use the different transportation options and make use of different technologies (Table 7) which will alter the transportation demand and energy use in the province.
3. Results
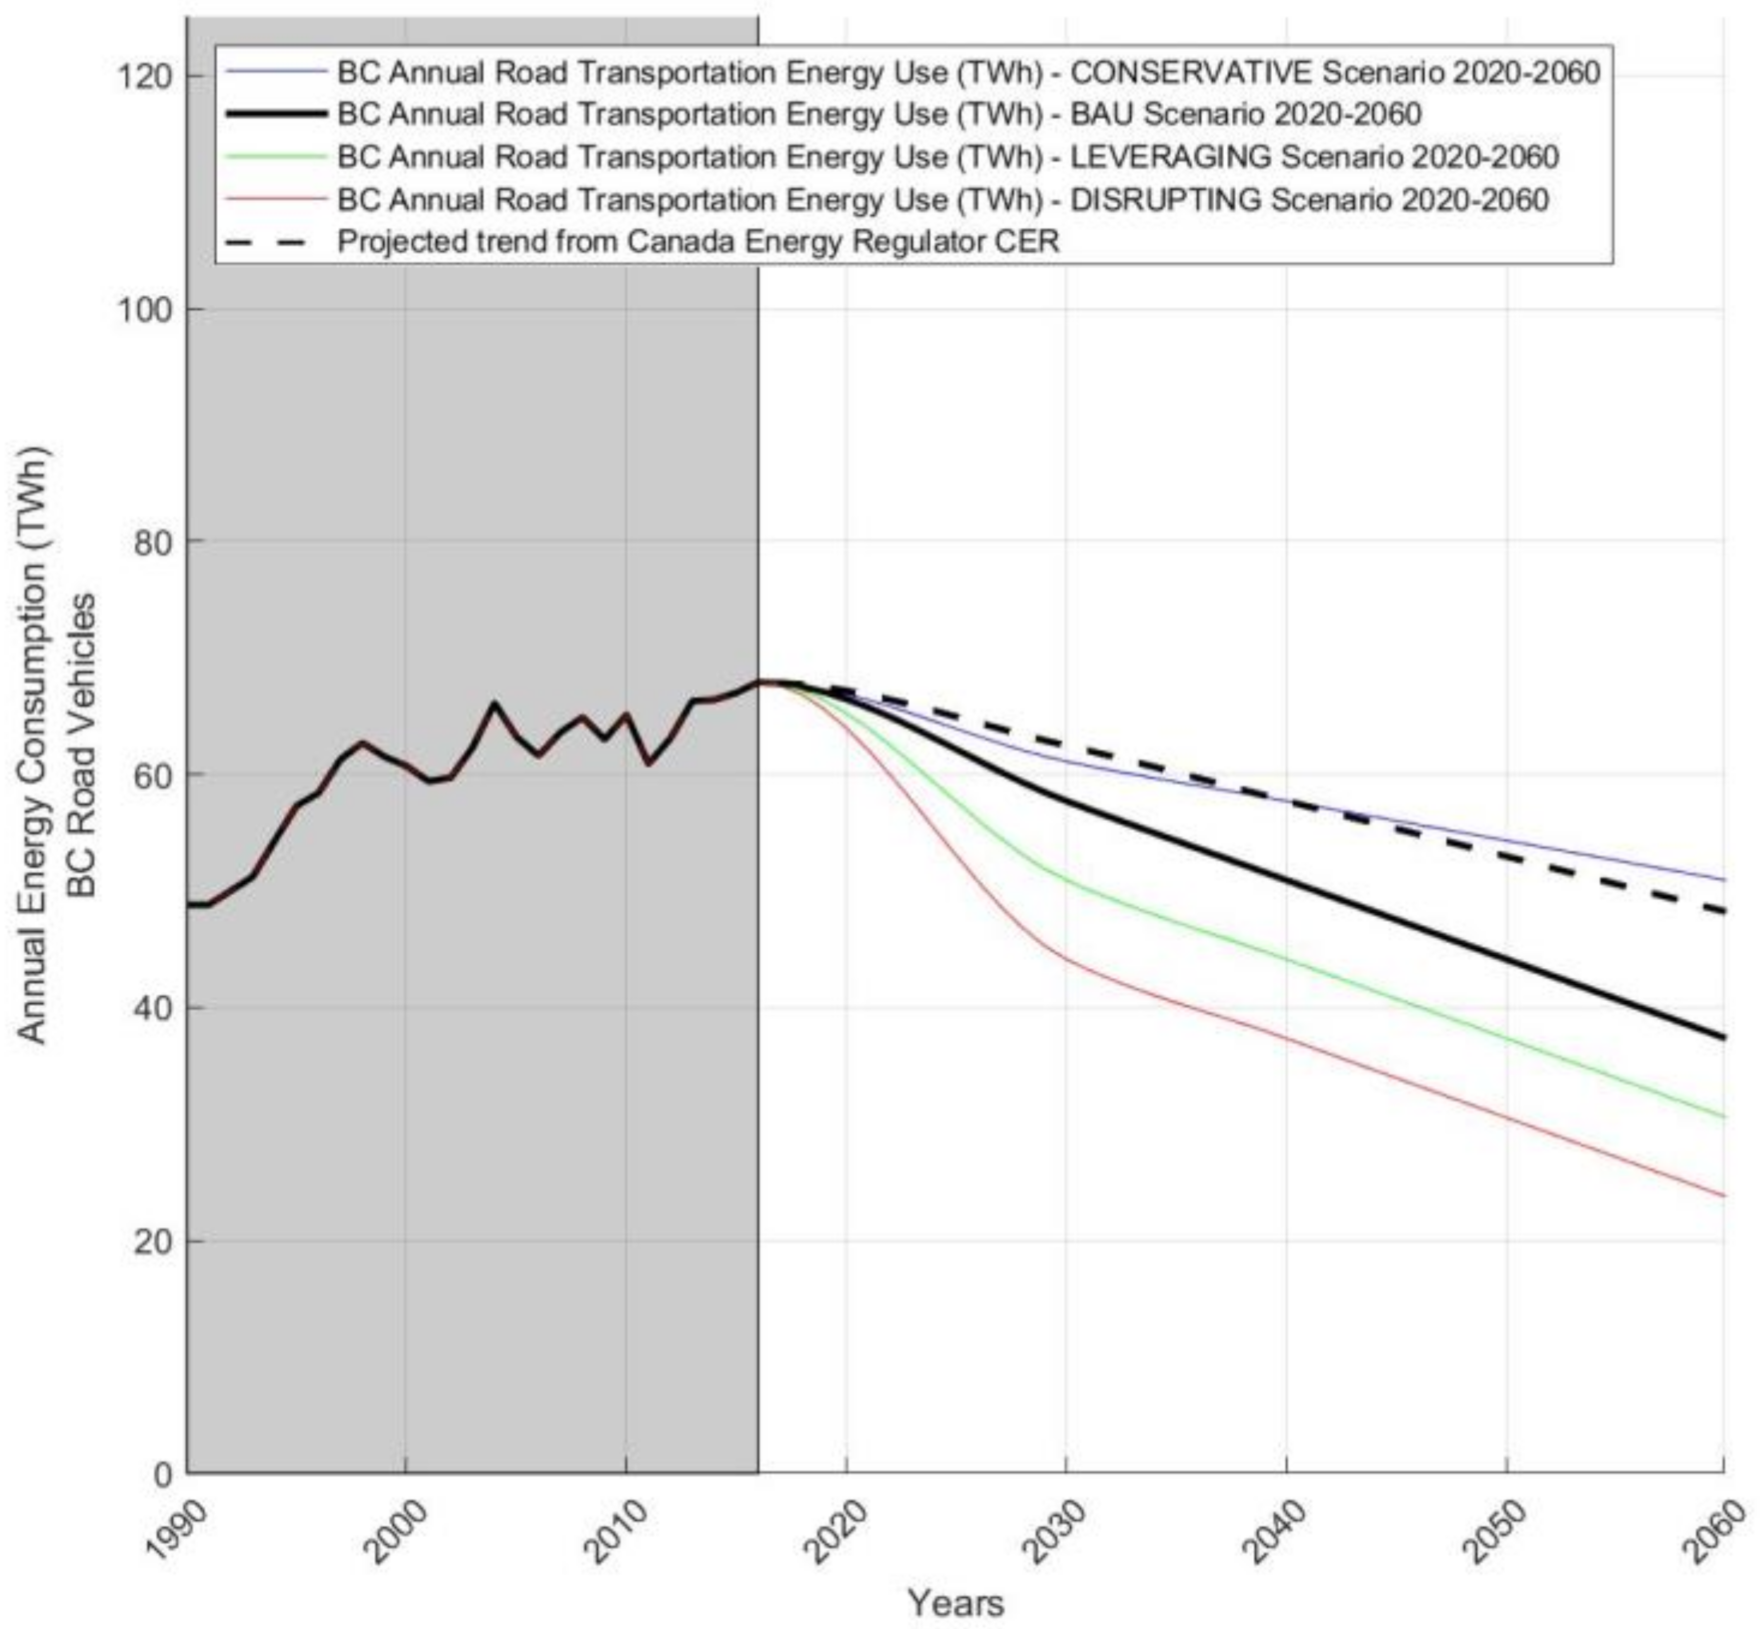
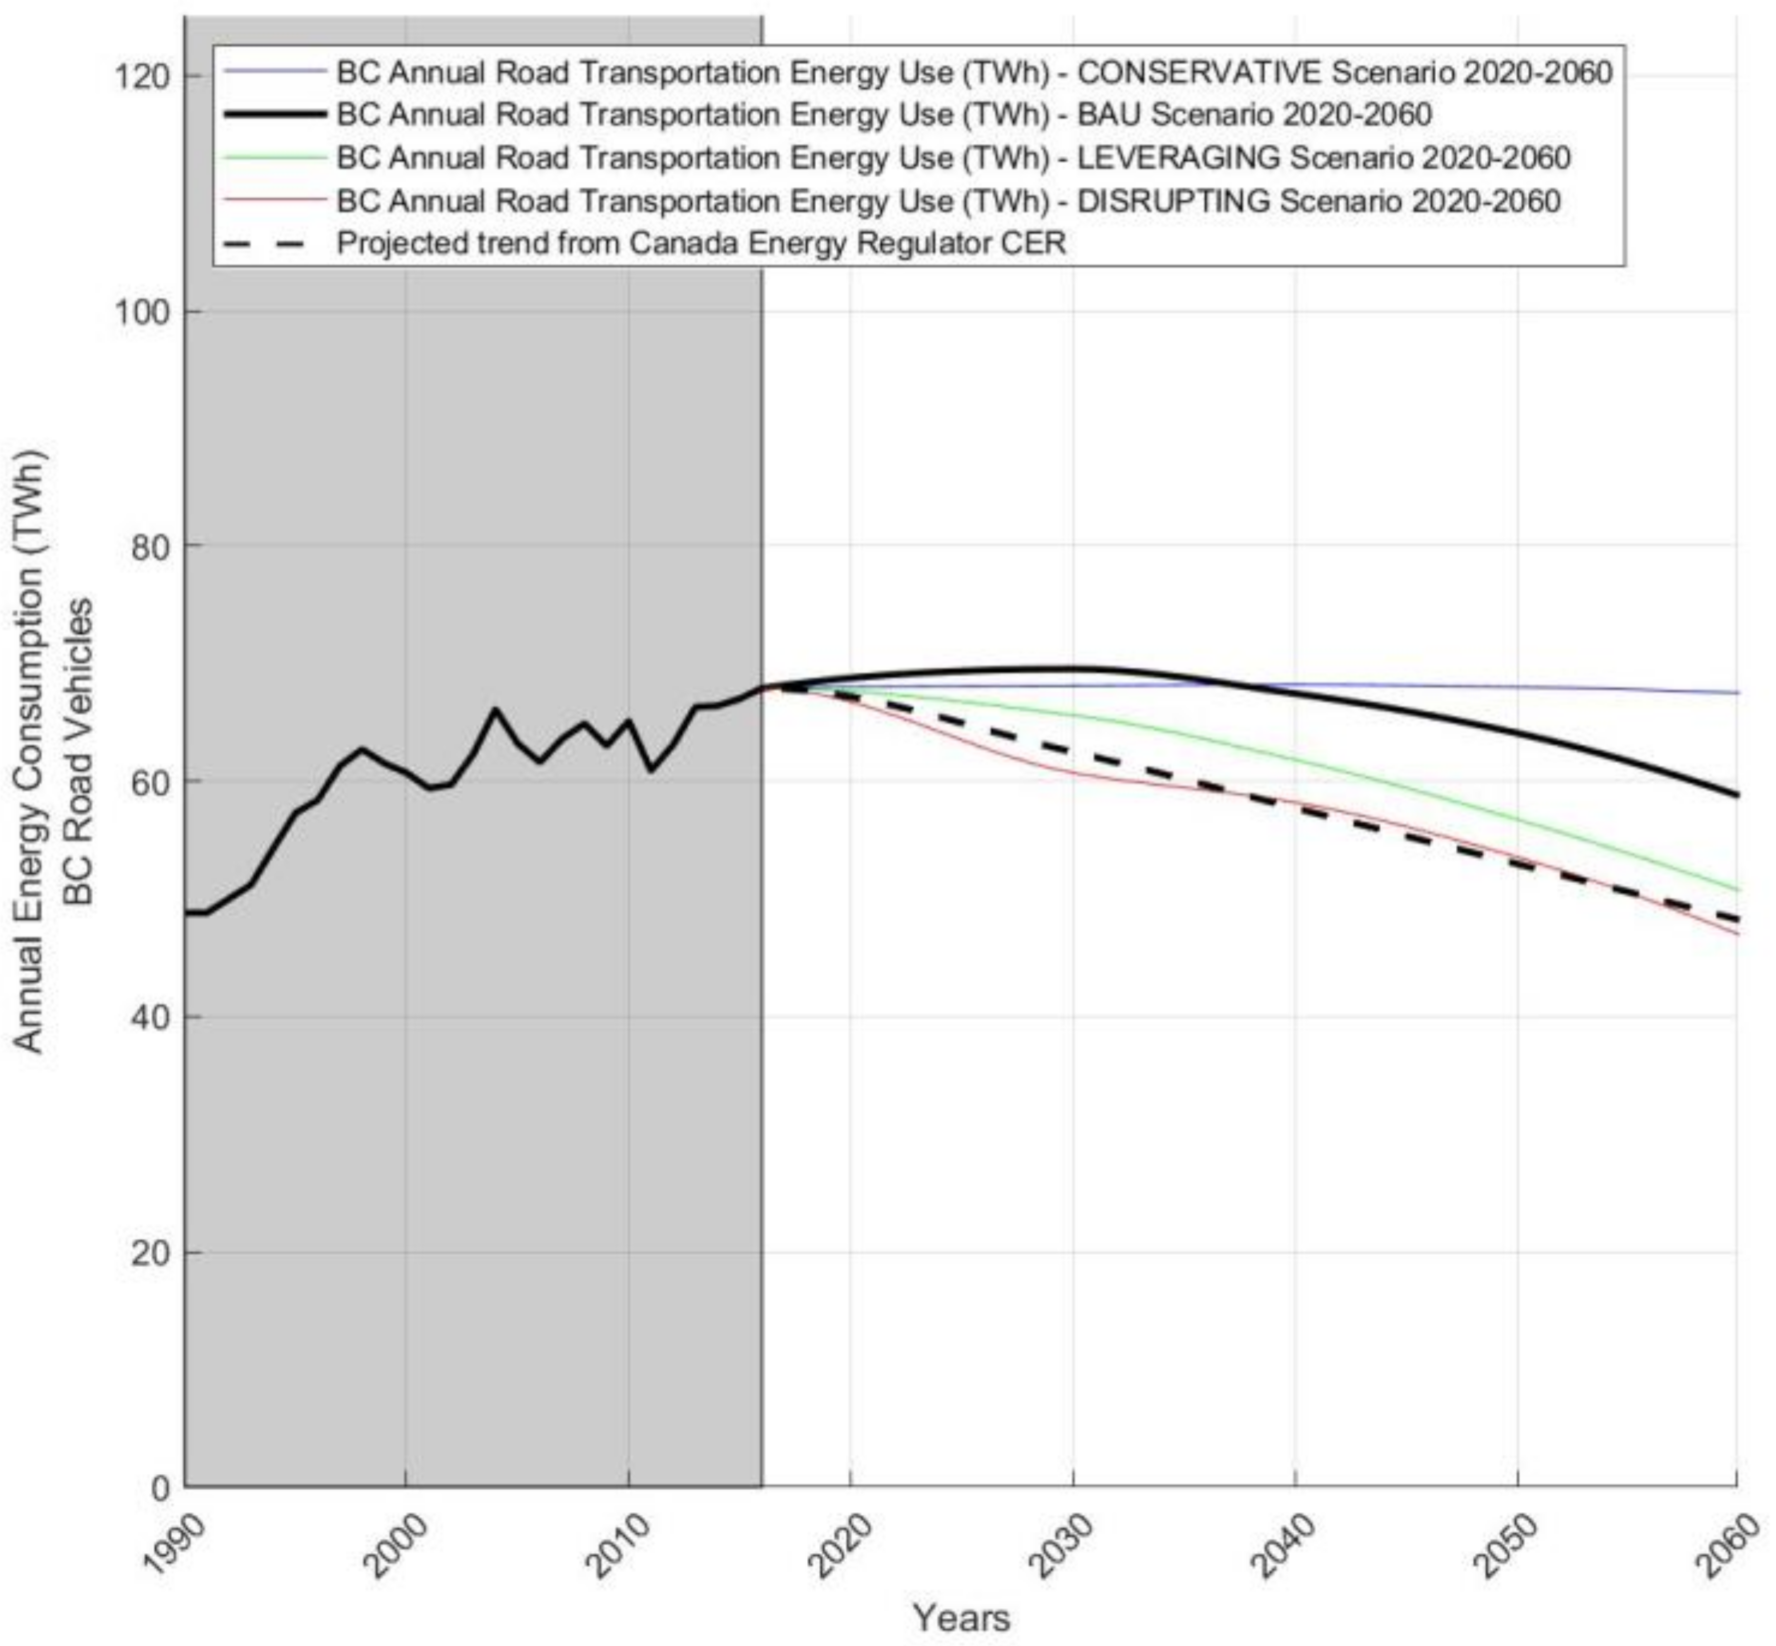
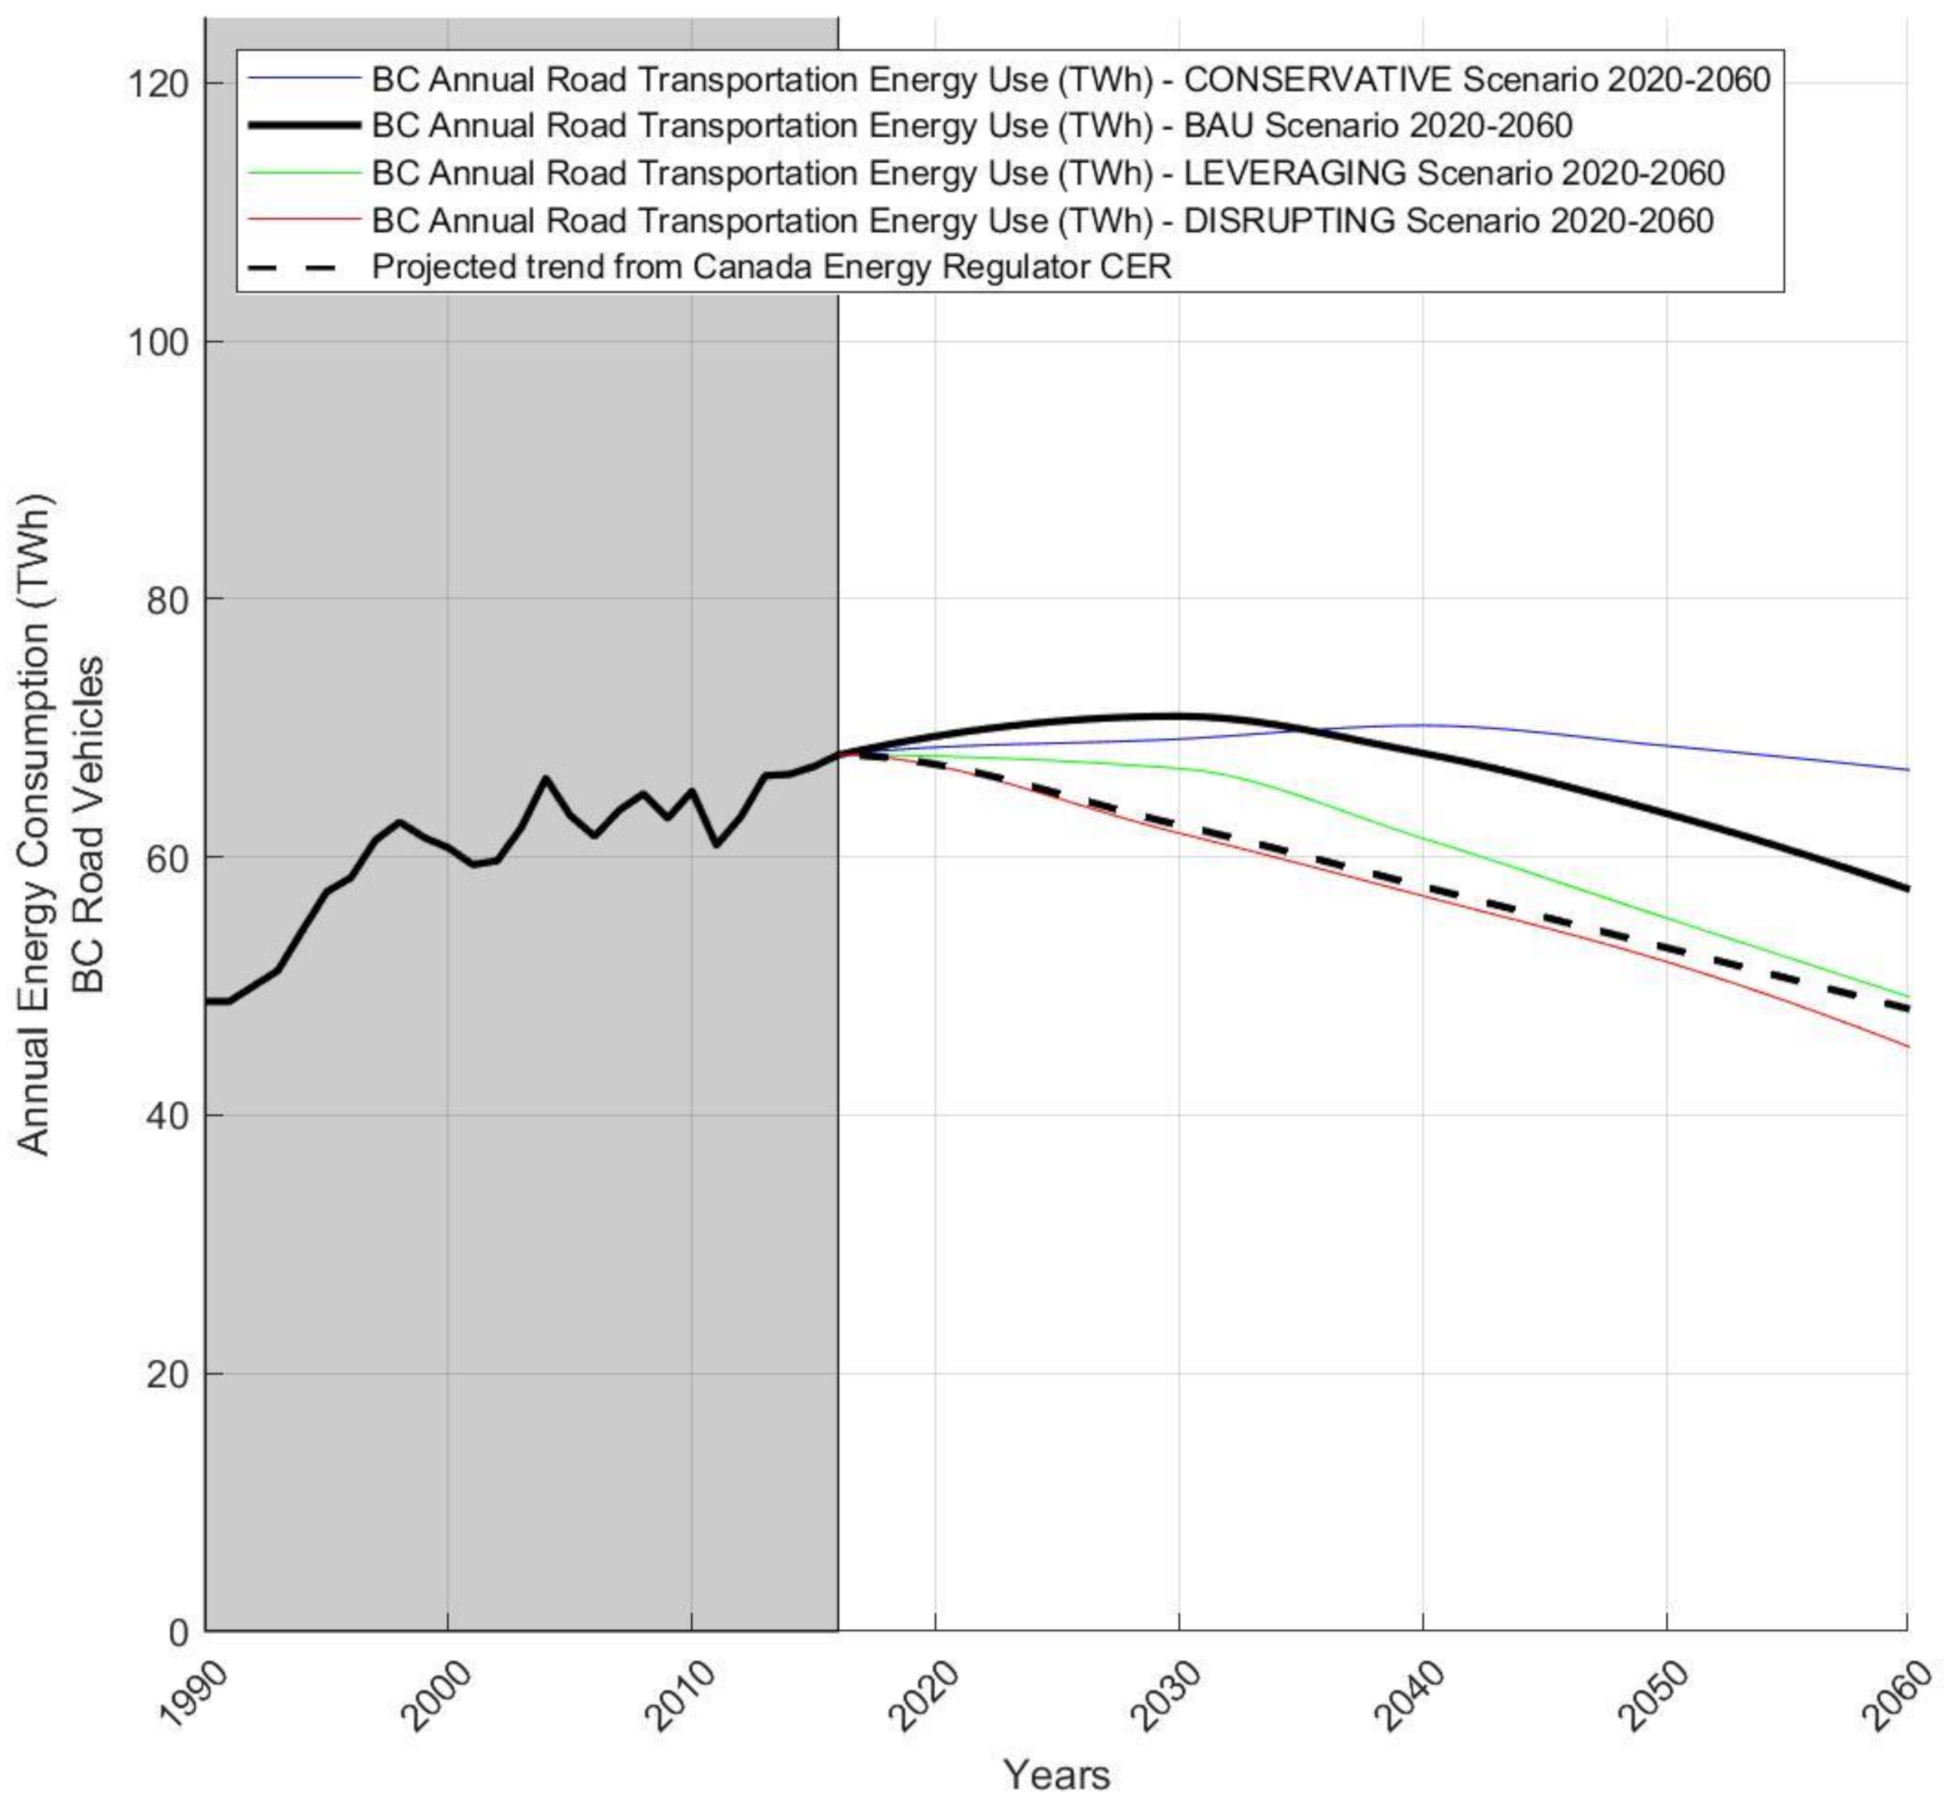
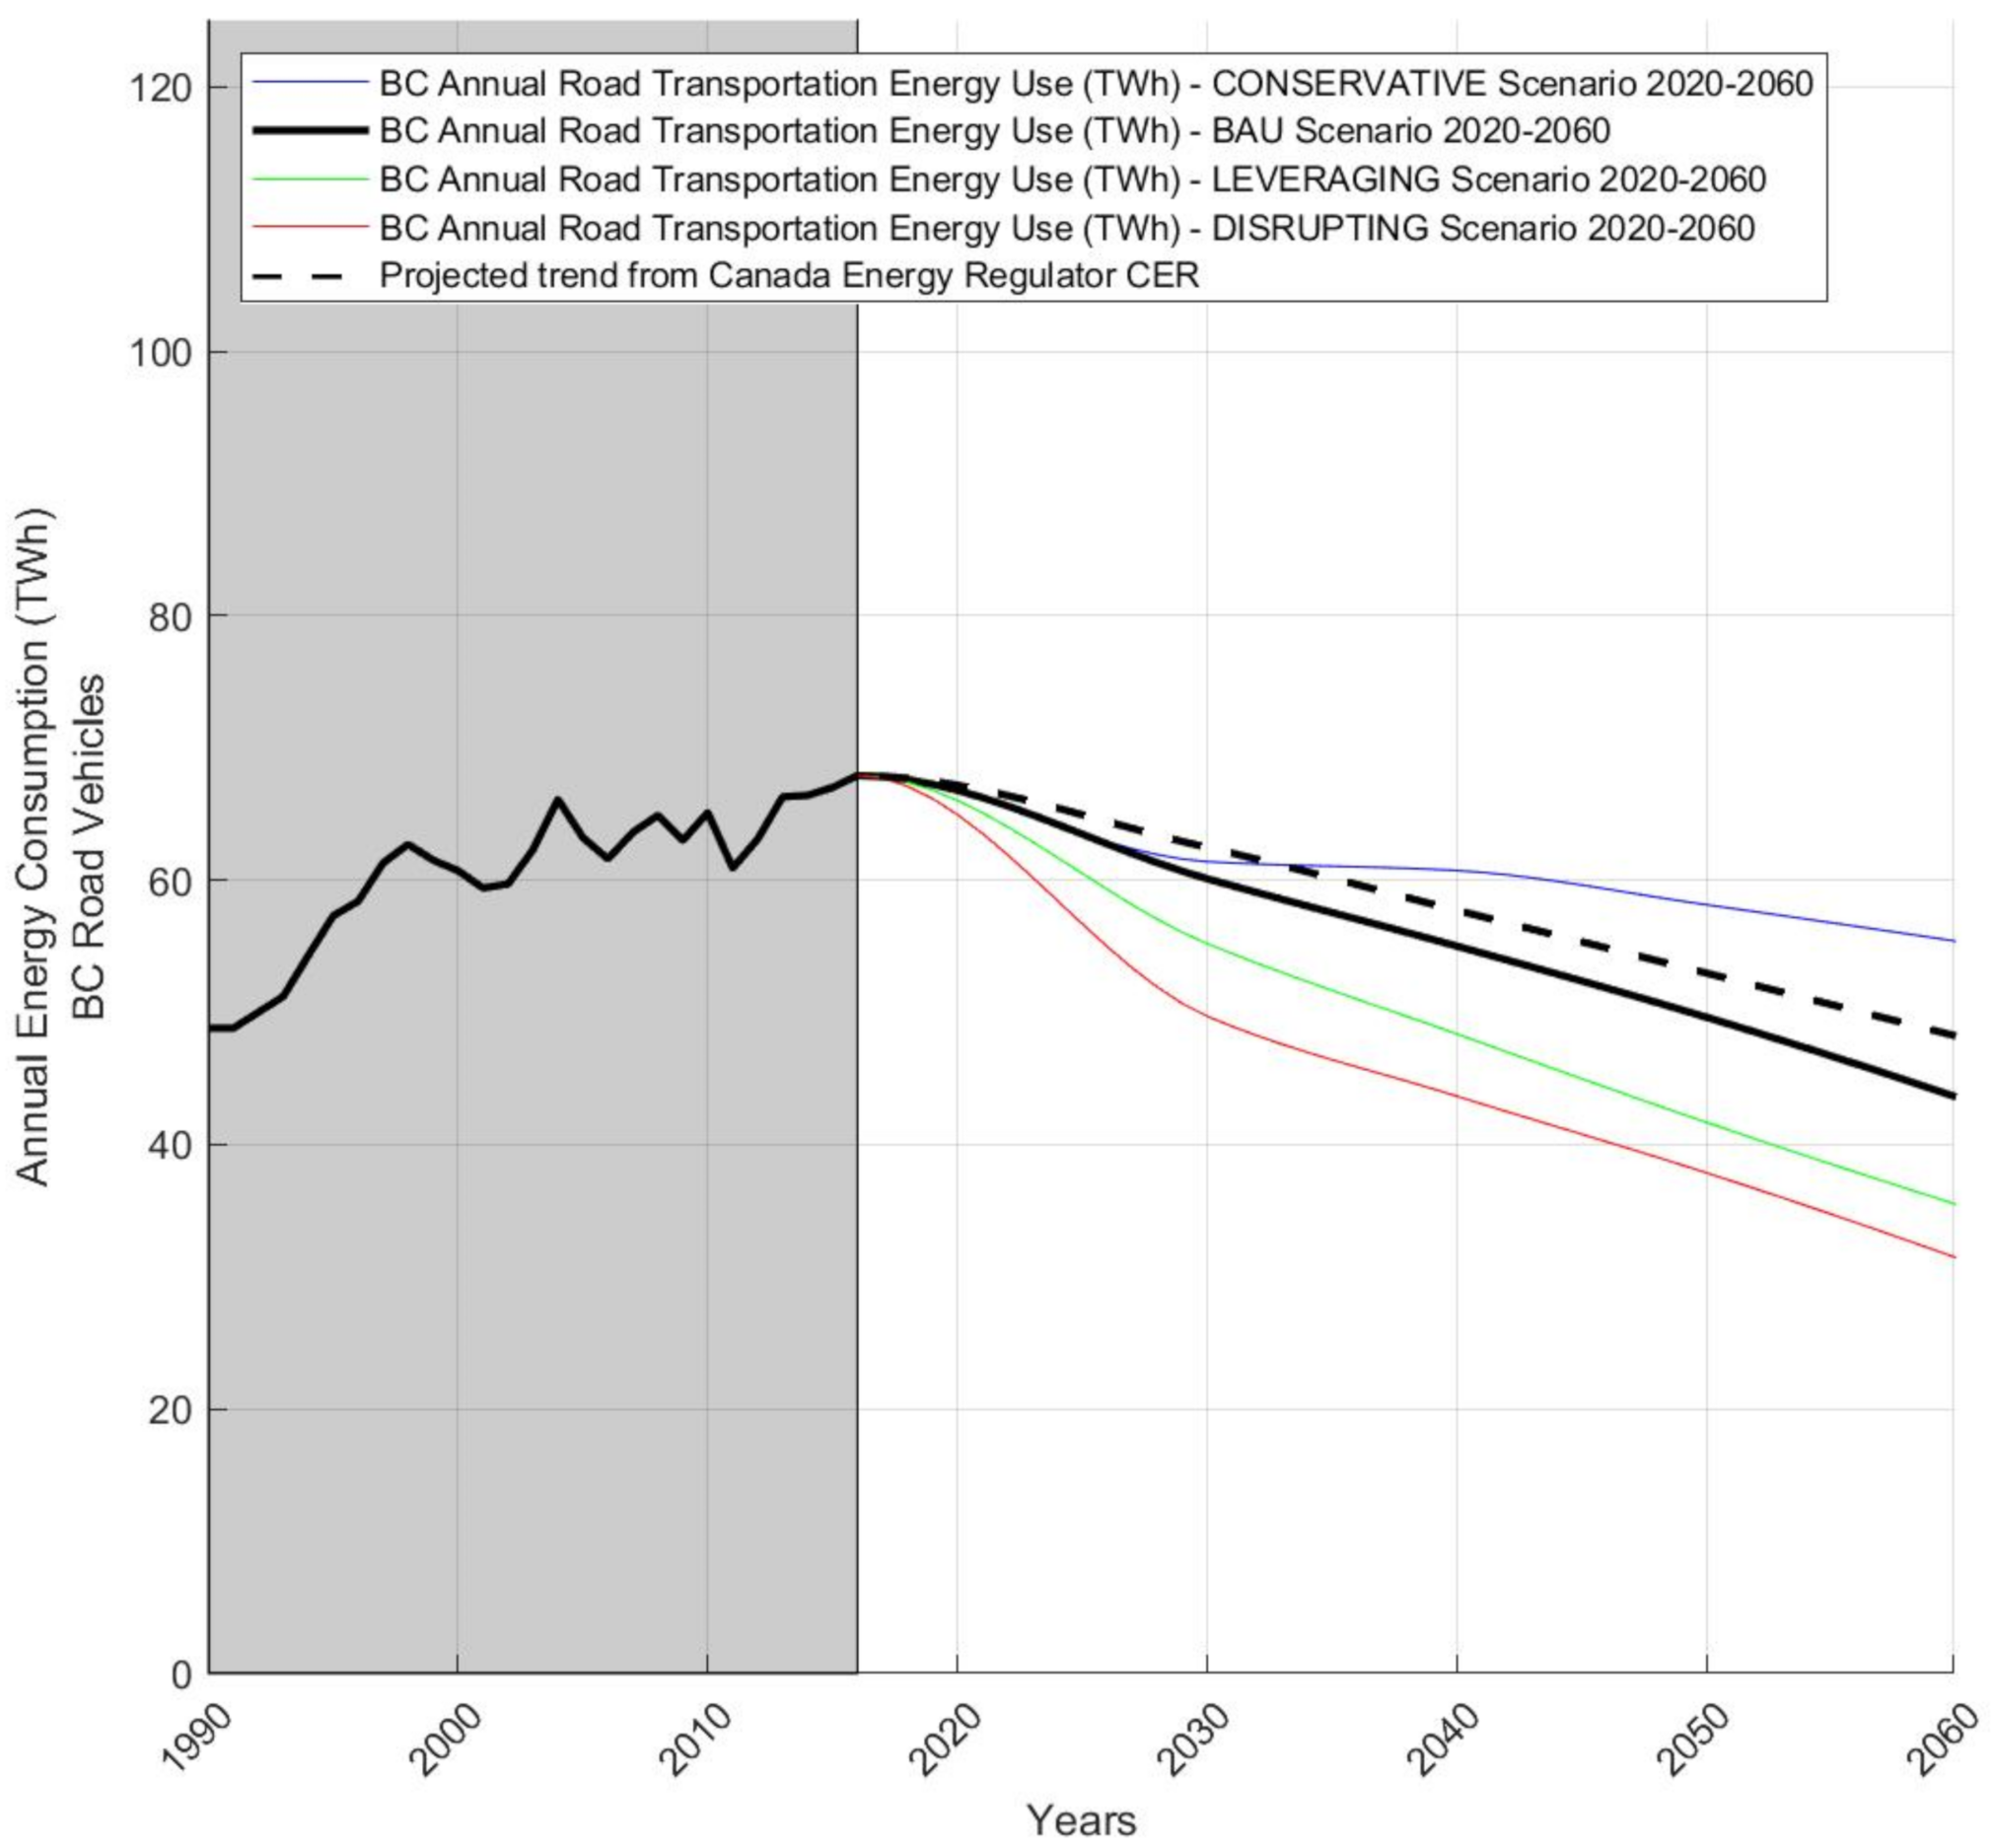
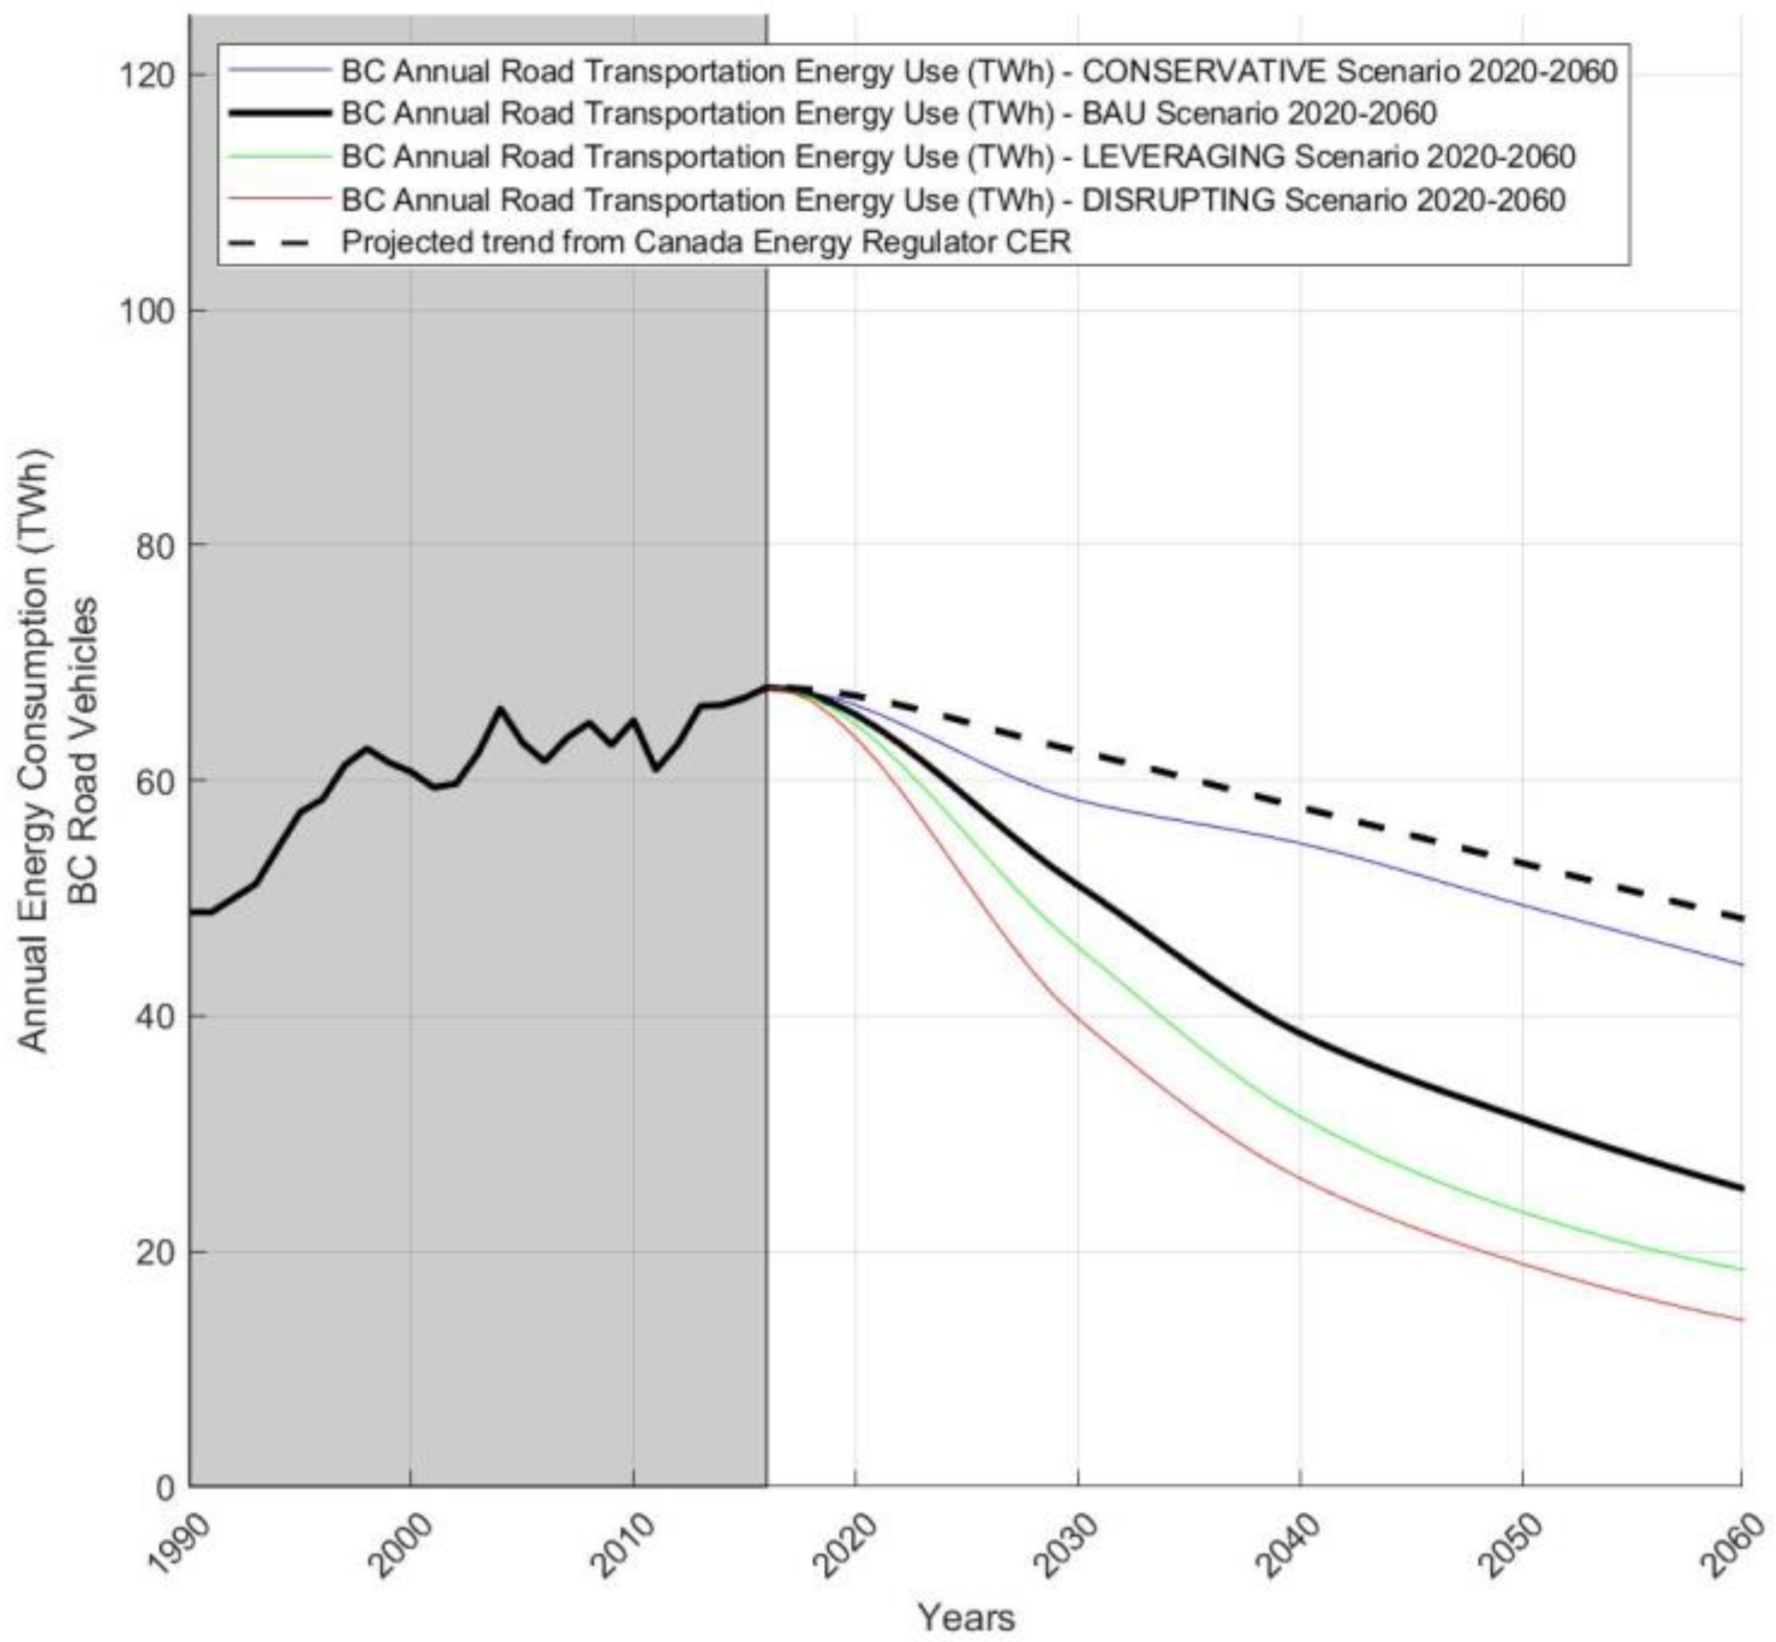
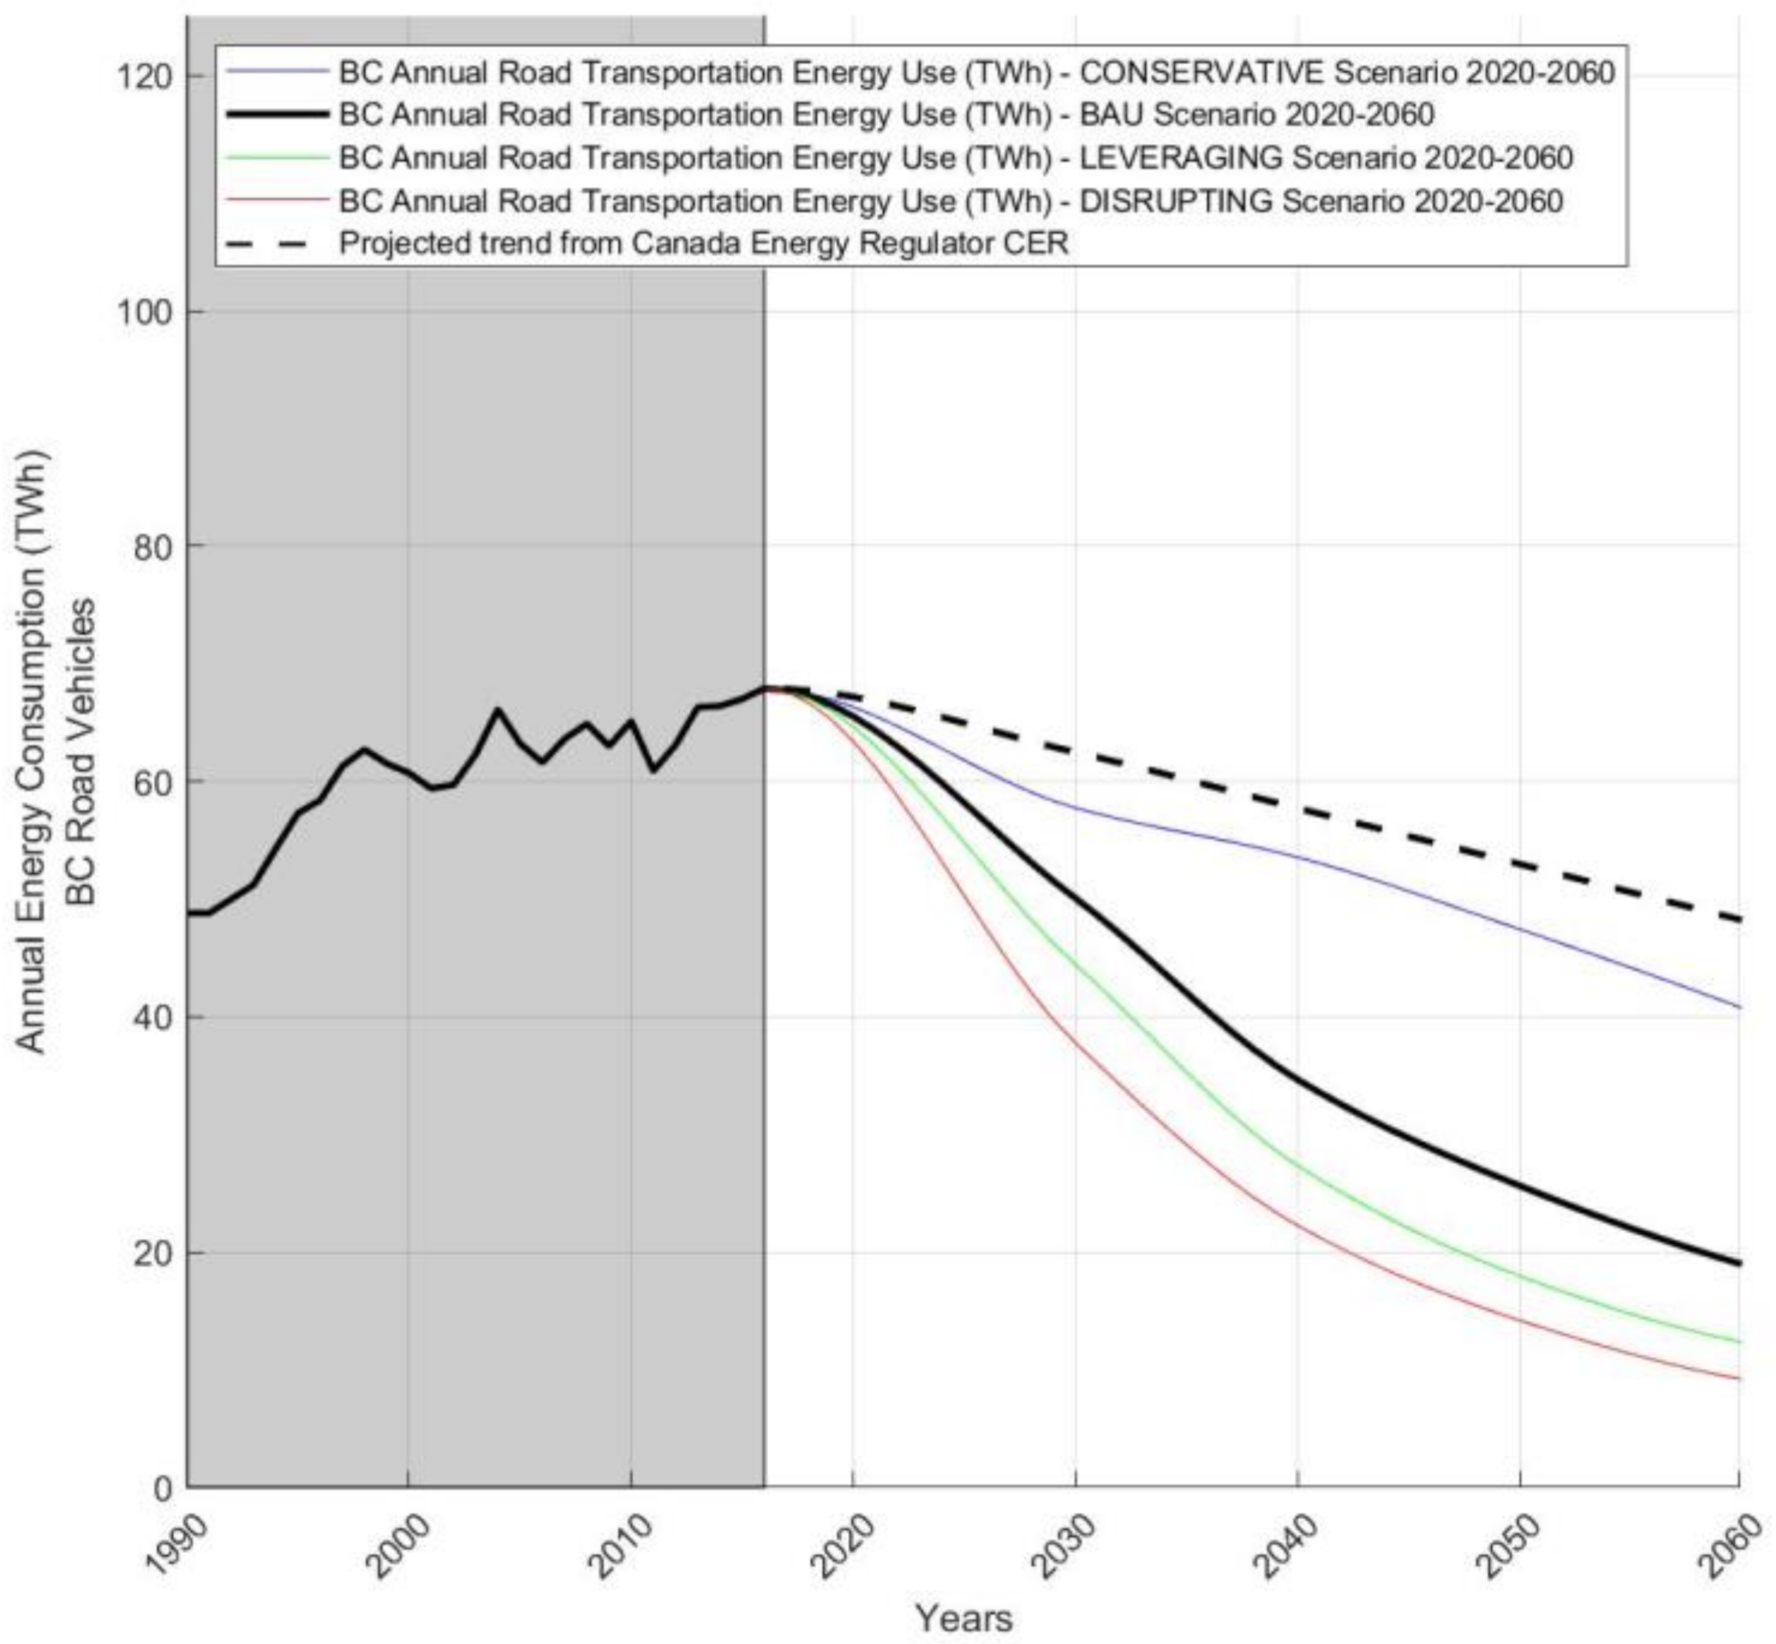
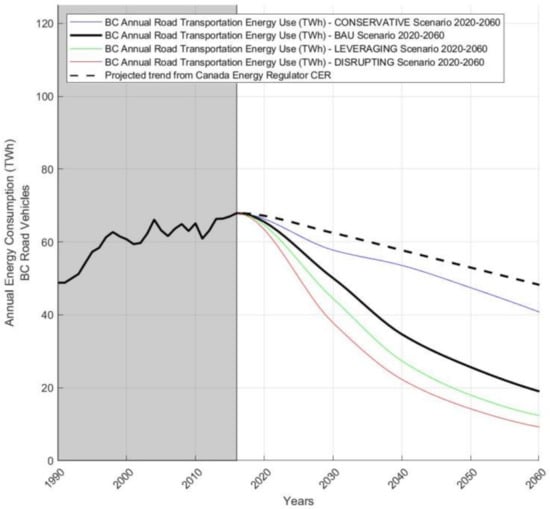
Figure 8, Figure 9, Figure 10, Figure 11, Figure 12 and Figure 13 illustrate a mix of various effects to generate a picture of road transportation energy use (excluding the small B.C. motorcycle segment). In the following results plots, the solid curves after 2016 correspond to hypothetical scenarios using the calculated EIF. The annual energy consumption of B.C.’s road vehicles in 2016 was 67.9 TWh. The black dashed lines in Figure 8, Figure 9, Figure 10, Figure 11, Figure 12 and Figure 13 illustrates the energy demand projection performed by CER (Canada Energy Regulator). This line foresees an annual decrease of 0.6% in the transportation sector energy use, including road, rail, marine, and air transportation [46]. The data for 1990–2016 (shaded area) is imported from data sources of the B.C. Government [33].
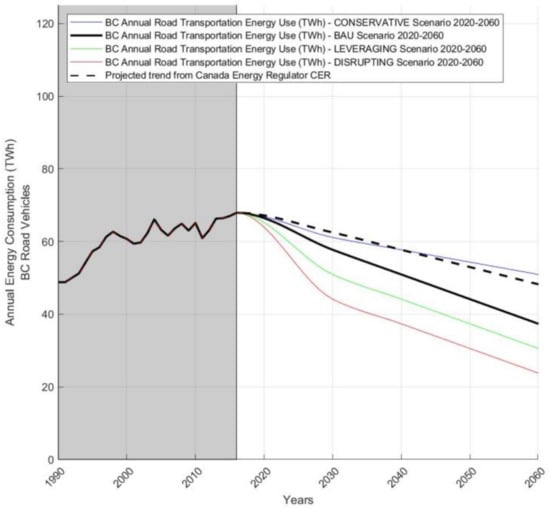
Figure 8.
B.C. road transportation annual energy use in (TWh), impacts of vehicle electrification.
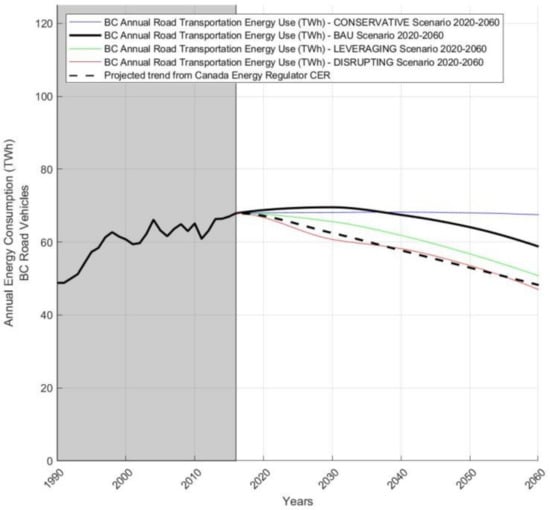
Figure 9.
B.C. road transportation annual energy use in (TWh), impacts of vehicle electrification and travel demand increase due to vehicle automation.
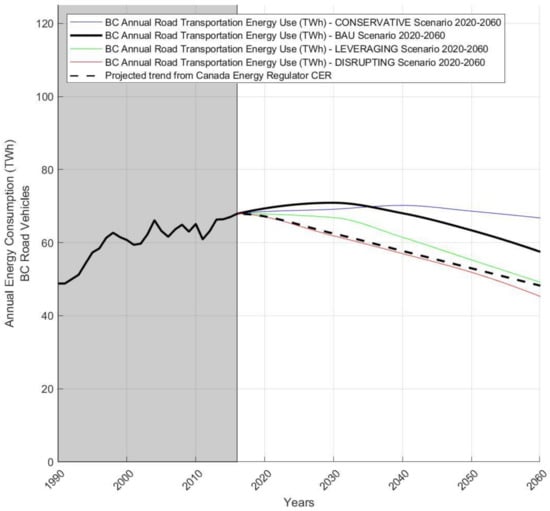
Figure 10.
B.C. road transportation annual energy use in (TWh), impacts of vehicle electrification, travel demand increases due to vehicle automation and increased energy use of automated vehicles arising from fueling, charging, and deadheading.
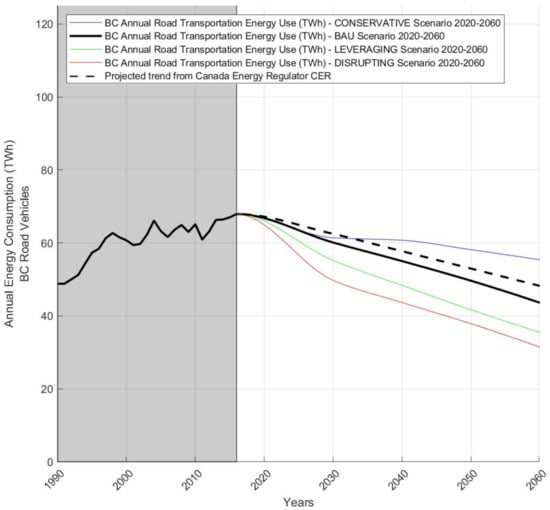
Figure 11.
B.C. road transportation annual energy use in (TWh), impacts of vehicle electrification, travel demand increases due to vehicle automation, more energy use of automated vehicles arising from fueling, charging, and deadheading, less energy use of automated vehicles arising from less congestion, fleet operations, platooning, and parking easiness.
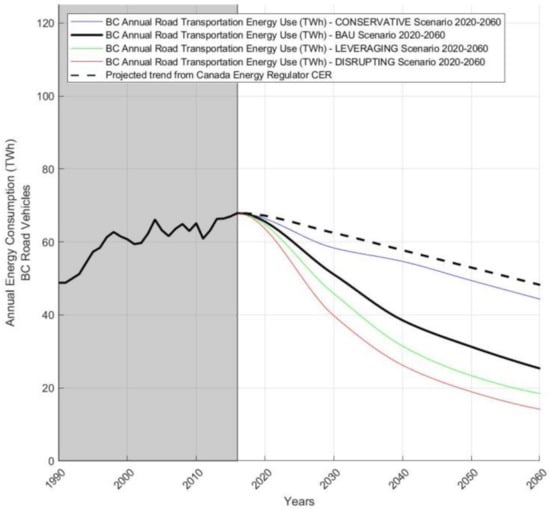
Figure 12.
B.C. road transportation annual energy use in (TWh), impacts of vehicle electrification, vehicle automation, and vehicle sharing.
B.C.’s road transportation annual energy use in (TWh) for the time frame 1990–2060 incorporating road vehicle electrification (Table 2) is illustrated in Figure 8. There is a similar trend between the CER projection, and the conservative scenario CS affected by road vehicle electrification. All other scenarios in Figure 8 go beyond the CER projection in terms of lower energy use levels and show larger energy use decreases with respect to current levels.
Figure 9 merges the effects of vehicle electrification (Figure 8) with vehicle automation-related travel demand increase (Table 3). Seniors, younger people, handicapped people, and long-distance travelers are expected to use more transportation energy because of vehicle automation. A general demand increase because of faster and cheaper vehicle kilometers is embedded in Figure 9. At this step, the CER projection matches with the most disruptive scenario employed in this study. The negative effects of demand increase, i.e., more energy use due to automation, balance the benefits coming from vehicle electrification.
Figure 10 illustrates the cumulative effects of vehicle electrification, travel demand increases due to vehicle automation and increased energy use of automated vehicles arising from fueling, charging, and deadheading (Table 4). Figure 9 and Figure 10 show similar results, with minor differences. The CER projection is more aligned with the disruptive scenario. In all scenarios, except for the conservative scenario, there is a tendency towards a decrease in energy use after 2030.
Figure 11 summarizes all effects of vehicle automation and vehicle electrification, adding the effects from reduced congestion, automated fleet operations, platooning, and parking easiness, on energy use (Table 5). Transportation energy use in this figure decreases for every year until 2060 in all scenarios. As an intermediate result of the hypothetical scenarios, it can be concluded that even without the effects of vehicle sharing, the impacts of vehicle electrification and automation are enough to decrease the transportation energy use uninterruptedly until 2060.
Figure 12 presents B.C.’s road transportation energy use to 2060 under the impacts of vehicle electrification, automation, and sharing. These are the effects given in Table 2, Table 3, Table 4, Table 5 and Table 6. All hypothetical scenarios in Figure 12 present lower energy use values than the CER projection. The BAU scenario consumes 51.1, 38.5, 31.3, and 25.3 TWh for 2030, 2040, 2050, and 2060, respectively. The data in 2016 is 67.9 TWh, so the energy use decreases in percent with respect to 2016 are 24.8%, 43.3%, 54%, and 62.8%, respectively. The energy savings in 2060 in the disruptive scenario reaches up to 80%.
Finally, Figure 13 merges all effects presented in Table 2, Table 3, Table 4, Table 5, Table 6 and Table 7. Figure 13 adds the effects given in Table 7 with the ones in Table 2, Table 3, Table 4, Table 5 and Table 6. Table 7 gives a prediction for the impacts of new technologies affecting road transportation needs. This incorporates disruptions arising from other technologies/events on transportation energy use. Pandemics which may result in community lockdowns leverage the effects of these factors given in Table 7.
The BAU scenario in Figure 13 yield 50.1, 34.7, 25.6, and 18.9 TWh for 2030, 2040, 2050, and 2060, respectively. The energy use decreases compared to 2016 are 26.3%, 49%, 62.24%, 72.1% respectively, for the same years. In the disruptive scenario, energy savings in 2060 reach up to 86%.
In this study, the energy impacts of electrification, automation, and sharing (recent disruptions in ground vehicle transportation) are analyzed. A similar approach to [41] is used in this study. Brown et al. [41] analyzed the energy impacts of vehicle automation. The authors found that vehicle automation could lead to either an increase or decrease in energy use. As a result of the incorporation of electrification and sharing, we were able to provide holistic estimates of the ground vehicle transportation energy use for the coming decades. Our estimates show mainly decreases of energy use under the heavy energy saving effects of vehicle electrification. We focused on a specific geographic area, British Columbia of Canada, where the historical data of ground transportation was publicly available.
4. Discussion
Road transportation energy use has increased during the historical 1990–2016 period mainly due to freight transportation. In this study, the average energy use in kWh per 100 km and GHG emissions in grams per km are presented for all vehicle classes in B.C., except motorcycles. Road transportation data shows that the number of motor vehicles per inhabitant is increasing, but road transportation energy use per capita-year is decreasing. When individual vehicle classes are analyzed, urban transit vehicles, inter-city buses, and heavy trucks are found to use higher amounts of energy per 100 km. If vehicle fleets (all vehicles of a single class) are considered, cars, passenger light trucks, medium trucks, and heavy trucks are found to use more energy than freight light trucks, school buses, urban transit vehicles, and inter-city buses.
Hypothetical scenarios have been presented to predict the road transportation energy use in B.C. to 2060. The scenarios incorporate the effects of road vehicle electrification, sharing, automation. In addition, influences of other technology disruptions like online shopping, e-learning, virtual and augmented reality, 3D printing are also included. The calculations are carried out by incorporating the influencing factors in a step-by-step approach, observing the combined effect of all factors in the resulting prediction. Projections of the Canadian Energy Regulator (CER) are included in the figures, to provide a comparison.
The main findings are:
- -
- When only the effect of vehicle electrification is considered, higher energy savings are expected compared to the CER scenario.
- -
- When the effects of vehicle electrification and automation are considered in combination, road transportation energy use decreases until 2060 for all scenarios. The BAU, Leveraging, and Disruptive scenarios result in higher energy savings compared to CER projection.
- -
- Combining the effects of vehicle electrification, automation, and sharing leads to a combined impact of energy savings that goes beyond the projection of CER, in all scenarios.
- -
- Disruptions in other technologies and the effects of pandemics like COVID-19 are included as a last step and reduce the transportation needs of people and communities. The combined disruptions have synergistic effects and lead to high energy savings. Energy savings can reach up to 86% in 2060 in the disruptive scenario.
The presented decreases in road transportation energy use for the years 2020–2060 should encourage policy makers and stakeholders to consider these new technologies. A clear benefit can be observed if all the technologies mentioned in this study, i.e., vehicle automation, vehicle sharing, and vehicle electrification, are adopted simultaneously, and parallel to other developments in other technology areas. B.C. has an important advantage in terms of low carbon energy, since the electric energy of the province is, to a great extent, generated using renewable sources. Whereas the implications of vehicle automation, vehicle sharing, and other technology disruptions are not straightforward, “vehicle powertrain electrification” in B.C. is a clear-cut strategy for reducing energy use and GHG emissions, given the low carbon intensity of the electricity mix, 98% of which consists of renewables (primarily hydro) and only 2% generation from back-up natural gas-powered plants [47].
The analysis presented here is focused on the energy use implications of recent technology disruptions and is based on available fleet data from peer-reviewed open access sources. However, each vehicle class is influenced differently by vehicle sharing, automation, and electrification. To expand this study, the effects of vehicle electrification, automation, and sharing should be broken down into distinct vehicle classes, using the existing and projected number of vehicles in B.C. This in conjunction with agent-based modelling work under way to embed all types of trips and vehicles within the province will enable more precise predictions of energy use and GHG emissions. Additional scenarios might also be included to further explore the range of energy implications of the various technologies alongside in-depth policy design to support and in some cases constrain their adoption. Our study focuses on the operational energy use of road transportation vehicle units, which consists of fuel and electric energy use for the total km’s travelled. A more in-depth analysis might include the effects of manufacturing and disposal/recycling of the corresponding road vehicles [48] to achieve a more precise determination of the overall road transportation energy use.
Author Contributions
Conceptualization, C.C., N.D., O.A.; methodology, C.C., N.D., O.A.; software, O.A.; formal analysis, C.C., O.A.; investigation, C.C., O.A.; resources, C.C., N.D., O.A.; data curation, C.C., N.D., O.A.; writing—original draft preparation, C.C., O.A.; writing—review and editing, C.C., N.D., O.A.; visualization, O.A.; supervision, C.C.; project administration, C.C., N.D.; funding acquisition, C.C., N.D. All authors have read and agreed to the published version of the manuscript.
Funding
This work was supported by PICS’ (Pacific Institute for Climate Solutions) “Transportation Futures for British Columbia” project.
Institutional Review Board Statement
Not applicable.
Informed Consent Statement
Not applicable.
Data Availability Statement
The main data sources used within this study can be found in the references [4,33,41].
Conflicts of Interest
The authors declare no conflict of interest. The funders had no role in the design of the study; in the collection, analyses, or interpretation of data; in the writing of the manuscript, or in the decision to publish the results.
Appendix A
| Vehicle Class | Vehicle Mass m (kg) | Wheel Rolling Resistance fRR (-) | Aerodynamic Projection Area A (m2) | Aerodynamic Drag Coefficient cD (-) | ICE Efficiency, Powertrain Efficiency |
| Car (CAR) | 1500 | 0.015 | 2 | 0.3 | 0.2, 0.9 |
| Passenger Light Truck (PLT) | 3500 | 0.015 | 3 | 0.4 | 0.2, 0.9 |
| Freight Light Truck (FLT) | 3500 | 0.015 | 3 | 0.4 | 0.2, 0.9 |
| School Bus (SB) | 15,000 | 0.015 | 7 | 0.7 | 0.2, 0.9 |
| Urban Transit (UT) | 20,000 | 0.015 | 7 | 0.7 | 0.3, 0.9 |
| Inter-City Bus (ICB) | 25,000 | 0.015 | 7 | 0.7 | 0.38, 0.9 |
| Medium Truck (MT) | 12,500 | 0.015 | 5 | 0.5 | 0.3, 0.9 |
| Heavy Truck (HT) | 40,000 | 0.015 | 8 | 0.9 | 0.38, 0.9 |
References
- Automated Vehicles for Safety. NHTSA. 2017. Available online: https://www.nhtsa.gov/technology-innovation/automated-vehicles-safety (accessed on 23 July 2019).
- Harper, C.D.; Hendrickson, C.T.; Mangones, S.; Samaras, C. Estimating potential increases in travel with autonomous vehicles for the non-driving, elderly and people with travel-restrictive medical conditions. Transp. Res. Part C Emerg. Technol. 2016, 72, 1–9. [Google Scholar] [CrossRef]
- Fagnant, D.J.; Kockelman, K. Preparing a nation for autonomous vehicles: Opportunities, barriers and policy recommendations. Transp. Res. Part A Policy Pract. 2015, 77, 167–181. [Google Scholar] [CrossRef]
- Wadud, Z.; MacKenzie, D.; Leiby, P. Help or hindrance? The travel, energy and carbon impacts of highly automated vehicles. Transp. Res. Part A Policy Pract. 2016, 86, 1–18. [Google Scholar] [CrossRef] [Green Version]
- Taiebat, M.; Brown, A.L.; Safford, H.R.; Qu, S.; Xu, M. A Review on Energy, Environmental, and Sustainability Implications of Connected and Automated Vehicles. Environ. Sci. Technol. 2018, 52, 11449–11465. Available online: http://pubs.acs.org/doi/10.1021/acs.est.8b00127 (accessed on 14 March 2019). [CrossRef] [PubMed]
- Driving Change, Technology and the Future of the Automated Vehicle; Senate of Canada: Ottawa, ON, Canada, 2018.
- Chen, Y.; Young, S.; Qi, X.; Gonder, J. A First-Order Estimate of Automated Mobility District Fuel Consumption and GHG Emission Impacts. In Road Vehicle Automation 4; Lecture Notes in Mobility; Meyer, G., Beiker, S., Eds.; Springer International Publishing: Cham, Switzerland, 2018; pp. 113–123. [Google Scholar]
- Climate Planning & Action—Province of British Columbia. Available online: https://www2.gov.bc.ca/gov/content/environment/climate-change/planning-and-action (accessed on 15 August 2019).
- Trends in Greenhouse Gas Emissions in B.C. (1990-2018). Available online: http://www.env.gov.bc.ca/soe/indicators/sustainability/ghg-emissions.html (accessed on 15 August 2019).
- Miller, S.A.; Heard, B.R. The Environmental Impact of Autonomous Vehicles Depends on Adoption Patterns. Environ. Sci. Technol. 2016, 50, 6119–6121. [Google Scholar] [CrossRef] [PubMed] [Green Version]
- Fagnant, D.J.; Kockelman, K.M. The travel and environmental implications of shared autonomous vehicles, using agent-based model scenarios. Transp. Res. Part C Emerg. Technol. 2014, 40, 1–13. [Google Scholar] [CrossRef]
- Stephens, T.S.; Gonder, J.; Chen, Y.; Lin, Z.; Liu, C.; Gohlke, D. Estimated Bounds and Important Factors for Fuel Use and Consumer Costs of Connected and Automated Vehicles 2016 Nov; Report No.: NREL/TP--5400-67216. Available online: http://www.osti.gov/servlets/purl/1334242/ (accessed on 29 March 2019).
- Delucchi, M.A.; Yang, C.; Burke, A.F.; Ogden, J.M.; Kurani, K.; Kessler, J.; Sperling, D. An assessment of electric vehicles: Technology, infrastructure requirements, greenhouse-gas emissions, petroleum use, material use, lifetime cost, consumer acceptance and policy initiatives. Philos. Trans. R. Soc. A Math. Phys. Eng. Sci. 2013, 372, 20120325. [Google Scholar] [CrossRef] [PubMed] [Green Version]
- New act ensures B.C. remains leader on clean energy vehicles. 2019. Available online: https://news.gov.bc.ca/releases/2019EMPR0018-001077 (accessed on 15 August 2019).
- Fleming, K.; Singer, M.R. Energy Implications of Current Travel and the Adoption of Automated Vehicles; Report No.: NREL/TP-5400-72675; US Department of Energy: Washington, DC, USA, 2019; p. 1510712. Available online: http://www.osti.gov/servlets/purl/1510712/ (accessed on 13 August 2019).
- Bösch, P.M.; Becker, F.; Becker, H.; Axhausen, K.W. Cost-based analysis of autonomous mobility services. Transp. Policy 2018, 64, 76–91. [Google Scholar] [CrossRef]
- Bauer, G.S.; Greenblatt, J.B.; Gerke, B.F. Cost, Energy, and Environmental Impact of Automated Electric Taxi Fleets in Manhattan. Environ. Sci. Technol. 2018, 52, 4920–4928. [Google Scholar] [CrossRef] [PubMed] [Green Version]
- Garcia-Castro, A.; Monzon, A.; Valdes, C.; Romana, M. Modeling different penetration rates of eco-driving in urban areas: Impacts on traffic flow and emissions. Int. J. Sustain. Transp. 2017, 11, 282–294. [Google Scholar] [CrossRef] [Green Version]
- Stern, R.E.; Cui, S.; Delle Monache, M.L.; Bhadani, R.; Bunting, M.; Churchill, M.; Hamilton, N.; Pohlmann, H.; Wu, F.; Piccoli, B.; et al. Dissipation of stop-and-go waves via control of autonomous vehicles: Field experiments. Transp. Res. Part C Emerg. Technol. 2018, 89, 205–221. [Google Scholar] [CrossRef] [Green Version]
- FOTW #1040, July 30, 2018: Average Vehicle Occupancy Remains Unchanged From 2009 to 2017. Energy.gov. Available online: https://www.energy.gov/eere/vehicles/articles/fotw-1040-july-30-2018-average-vehicle-occupancy-remains-unchanged-2009-2017 (accessed on 25 October 2019).
- Synced. Global Survey of Autonomous Vehicle Regulations. Medium. 2018. Available online: https://medium.com/syncedreview/global-survey-of-autonomous-vehicle-regulations-6b8608f205f9 (accessed on 23 July 2019).
- Walker, J. The Self-Driving Car Timeline—Predictions from the Top 11 Global Automakers. Available online: https://emerj.com/ai-adoption-timelines/self-driving-car-timeline-themselves-top-11-automakers/ (accessed on 23 July 2019).
- IEEE—5 September 2 2012. Available online: https://www.ieee.org/about/news/2012/5september-2-2012.html (accessed on 23 July 2019).
- Greenblatt, J.B.; Shaheen, S. Automated Vehicles, On-Demand Mobility, and Environmental Impacts. Curr. Sustain. Renew. Energy Rep. 2015, 2, 74–81. [Google Scholar] [CrossRef] [Green Version]
- Trommer, S.; Kröger, L.; Kuhnimhof, T. Potential Fleet Size of Private Autonomous Vehicles in Germany and the US. In Road Vehicle Automation 4; Lecture Notes in Mobility; Meyer, G., Beiker, S., Eds.; Springer International Publishing: Cham, Switzerland, 2018; pp. 247–256. [Google Scholar]
- BP Energy Outlook. BP Energy Economics. 2018. Available online: https://www.bp.com/content/dam/bp/business-sites/en/global/corporate/pdfs/energy-economics/energy-outlook/bp-energy-outlook-2018.pdf (accessed on 3 July 2019).
- Lennert, F.; Schönduwe, R. Disrupting Mobility: Decarbonising Transport ? In Disrupting Mobility: Impacts of Sharing Economy and Innovative Transportation on Cities; Meyer, G., Shaheen, S., Eds.; Lecture Notes in Mobility; Springer International Publishing: Cham, Switzerland, 2017; pp. 213–237. Available online: https://doi.org/10.1007/978-3-319-51602-8_14 (accessed on 2 August 2019).
- Chen, Y.; Gonder, J.; Young, S.; Wood, E. Quantifying autonomous vehicles national fuel consumption impacts: A data-rich approach. Transp. Res. Part A Policy Pract. 2019, 122, 134–145. Available online: https://linkinghub.elsevier.com/retrieve/pii/S0965856417300800 (accessed on 14 March 2019). [CrossRef]
- Erhardt, G.D.; Roy, S.; Cooper, D.; Sana, B.; Chen, M.; Castiglione, J. Do transportation network companies decrease or increase congestion? Sci. Adv. 2019, 5, eaau2670. [Google Scholar] [CrossRef] [PubMed] [Green Version]
- Qi, X.; Barth, M.J.; Wu, G.; Boriboonsomsin, K.; Wang, P. Energy Impact of Connected Eco-driving on Electric Vehicles. In Road Vehicle Automation 4; Lecture Notes in Mobility; Meyer, G., Beiker, S., Eds.; Springer International Publishing: Cham, Switzerland, 2018; pp. 97–111. [Google Scholar]
- Herrera, O.; Taiebat, M.; Sassani, F.; Mérida, W. Implications of transportation electrification in metro Vancouver. In Proceedings of the 2016 IEEE Canadian Conference on Electrical and Computer Engineering (CCECE), Vancouver, BC, Canada, 15–18 May 2016; pp. 1–4. [Google Scholar]
- Kamiya, G.; Axsen, J.; Crawford, C. Modeling the GHG emissions intensity of plug-in electric vehicles using short-term and long-term perspectives. Transp. Res. Part D Transp. Environ. 2019, 69, 209–223. [Google Scholar] [CrossRef]
- Government of Canada NRC. Transportation Sector—British Columbia and Territories. 2005. Available online: http://oee.nrcan.gc.ca/corporate/statistics/neud/dpa/menus/trends/comprehensive/trends_tran_bct.cfm (accessed on 23 July 2019).
- International Energy Agency. Fuel Economy of Road Vehicles; IEA Technology Roadmaps; OECD: Paris, France, 2012; Available online: https://www.oecd-ilibrary.org/energy/fuel-economy-of-road-vehicles_9789264185029-en (accessed on 29 March 2019).
- 2019 Fuel Consumption Guide; Natural Resources Canada: Ottowa, ON, Canada, 2019.
- Greenhouse Gases. Available online: https://www.bchydro.com/toolbar/about/sustainability/climate_action/greenhouse_gases.html (accessed on 2 August 2019).
- Zero-Emission Vehicle Update 2020; Clean BC Go Electric: Victoria, BC, Canada, 2020.
- Population Estimates—Province of British Columbia. Available online: https://www2.gov.bc.ca/gov/content/data/statistics/people-population-community/population/population-estimates (accessed on 18 October 2019).
- Government of Canada NEB. NEB—Canada’s Renewable Power Landscape 2016—Energy Market Analysis. 2019. Available online: https://www.cer-rec.gc.ca/nrg/sttstc/lctrct/rprt/2016cndrnwblpwr/prvnc/bc-eng.html (accessed on 25 October 2019).
- Levinson, D.M.; Krizek, K.J. Network Design Lab, 2017, Location is N/A. In The End of Traffic and the Future of Access:255; The National Academies of Sciences, Engineering, and Medicine: Washington, DC, USA, 2017. [Google Scholar]
- Brown, A.; Gonder, J.; Repac, B. An Analysis of Possible Energy Impacts of Automated Vehicles. In Road Vehicle Automation; Lecture Notes in Mobility; Meyer, G., Beiker, S., Eds.; Springer International Publishing: Cham, Switzerland, 2014; pp. 137–153. Available online: https://doi.org/10.1007/978-3-319-05990-7_13 (accessed on 24 July 2019).
- Fox-Penner, P.; Gorman, W.; Hatch, J. Long-term U.S transportation electricity use considering the effect of autonomous-vehicles: Estimates & policy observations. Energy Policy 2018, 122, 203–213. [Google Scholar]
- Greenblatt, J.B.; Saxena, S. Autonomous taxis could greatly reduce greenhouse-gas emissions of US light-duty vehicles. Nat. Clim. Change 2015, 5, 860–863. [Google Scholar] [CrossRef]
- Gawron, J.H.; Keoleian, G.A.; De Kleine, R.D.; Wallington, T.J.; Kim, H.C. Life Cycle Assessment of Connected and Automated Vehicles: Sensing and Computing Subsystem and Vehicle Level Effects. Environ. Sci. Technol. 2018, 52, 3249–3256. [Google Scholar] [CrossRef] [PubMed]
- Kaya, Y. Impact of Carbon Dioxide Emission Control on GNP Growth: Interpretation of Proposed Scenarios; IPCC Energy and Industry Subgroup, Response Strategies Working Group: Paris, France, 1990. [Google Scholar]
- Canada’s Energy Future 2019—Energy Supply and Demand Projections to 2040; Canada Energy Regulator: Calgary, AB, Canada, 2019; Volume 56.
- BC Hydro, Our Energy Mix. Available online: https://www.bchydro.com/toolbar/about/sustainability/our-clean-system.html (accessed on 12 January 2022).
- ICCT, The International Council on Clean Transportation, A Global Comparison of the Life-Cycle Greenhouse Gas Emissions of Combustion Engine and Electric Passenger Cars. Available online: https://theicct.org/publications/global-LCA-passenger-cars-jul2021 (accessed on 12 January 2022).
Publisher’s Note: MDPI stays neutral with regard to jurisdictional claims in published maps and institutional affiliations. |
© 2022 by the authors. Licensee MDPI, Basel, Switzerland. This article is an open access article distributed under the terms and conditions of the Creative Commons Attribution (CC BY) license (https://creativecommons.org/licenses/by/4.0/).

