1. Introduction
Indian road and traffic conditions are different from other developed countries as geographical, environmental conditions, the adaptation of traffic regulations, and vehicle population vary from one place to another. A drive cycle that is used for homologation is a sequence of vehicle speed (acceleration and deceleration) concerning time. The entire drive cycle will span over a few minutes and it will simulate the urban driving conditions of the vehicle. Drive cycles are an important part of vehicle testing, where for a specific vehicle segment or type, fuel quantity and emission rates are the deciding factors of vehicle usage concerning operating states (vehicle velocity, engine RPM, acceleration and deceleration rate, temperatures, etc.), road congestions and the behavior of the driver [
1,
2,
3]. Different standardized driving cycles are available for different objectives which are adopted by respective countries. The Indian Driving Cycle (IDC) was the first driving cycle proposed in India by ARAI (The Automotive Research Association of India) and was introduced in 1985 under Central Motor Vehicles Rules (CMVR) [
4]. In the present scenario, chassis dynamometers of various capacities are programmed to replicate the driving cycle based on the vehicle type to comply with emissions regulations. Electric Vehicles (EVs) and Hybrid-Electric-Vehicles (HEVs) are also certified for energy utilization and range by Indian testing agencies. Though EVs do not have direct carbon emissions, the energy consumption per kilometer and overall range of the vehicle are estimated using chassis dynamometer-based drive cycle performance [
1,
3,
5]. Usually, from an Indian perspective, there is a difference between rated energy consumption provided by the homologation agency and actual on-road energy consumption. The difference is mainly due to the laboratory test conditions and adopted drive cycles. In general, road congestion due to a large number of vehicles is a challenge to replicate in a standard driving cycle.
The drive cycles performed on the chassis represent only approximate drive conditions irrespective of different traffic conditions [
4]. Therefore, in this work, an attempt has been made to propose an actual urban drive cycle for estimating fuel or energy consumption using the Inertial Measurement Unit (IMU). The proposed method is used to develop a drive cycle by extracting the real trip data of a vehicle. There are various high-precision tools that are available for the extraction of drive trip data directly from the sensors. However, these precise measurements are not available on Indian scooters due to cost aspects. Various methods are used by researchers for the local drive cycle data acquisition specific to electric and hybrid electric vehicles like capturing OBD (On-Board Diagnostics) data using Bluetooth, Vehicle Speed Sensor, Smartphone-based Android Application, and using vehicle Acceleration data [
6,
7,
8,
9,
10,
11]. This paper describes the Inertial Measurement Unit (IMU) based real-time drive cycle capturing in Pune city and energy estimation of the vehicle in offline mode for a covered distance. Road load data can be captured effectively on the road using an IMU sensor, Current, Voltage, Wheel rpm, and a data acquisition system. Energy estimations can be carried out by using theoretical methods (modeling/simulation) or through experimental trials using measuring instruments.
In India, people prefer motorized two-wheelers for their day-to-day activities. Only a small percentage of Indian people prefer commuting using public transport and four-wheelers. Around 75 % of the vehicles sold in India are motorized two-wheelers and four-wheelers account for less than 14%. Selling engine-powered vehicles in the market is going to be difficult in the future due to the stringent emission norms and rising CO2 concentration in the atmosphere. Electric mobility is gaining attention all over the world to tackle emissions and CO2 contributed by the transportation sector. The Indian government has also taken many initiatives to augment the penetration of Electric Vehicles (EVs) in the market. As a first step, the government is focusing on two-wheelers as it does not require heavy charging infrastructure. The Indian government promotes electric vehicles through incentives like income tax benefits, reduced sales tax, and road tax benefits that attract the citizens as well as researchers in the automotive domain. The biggest disadvantage with EVs is the limited range, charging time, cost of the battery, and lack of charging infrastructure. So, to bridge the gap between conventional engine-powered vehicles and EVs, automotive industries are promoting hybrid electric vehicles.
There are operational areas where engines have challenges to meet the emission norms for example: during traffic congestion, when the vehicle velocity is low, at maximum load conditions, etc. Worldwide, automotive manufacturers are adopting expensive emission reduction technologies to tackle these exhaust emissions. Hybridization is a successful technology that can address the demerits of conventional engines and electric vehicle technology [
12,
13,
14]. In this study, a specific scooter segment (TVS Scooty Pep+) is chosen for hybridization due to the higher sale volume of this particular model. Most of the scooters in the Indian market use carburetor technology for fuel-air delivery, so the role of ECU interface in the scooter is limited or it is not present and this makes hybridization less complex. The selected vehicle is hybridized using a front wheel hub motor and selection of efficient hybrid architecture and energy management strategy for range extension is a challenge. The details of the architecture and control strategies for energy management are discussed in our earlier publication [
15]. For calculating vehicle velocity, almost all scooters either have an OBD port facility or vehicle/engine speed sensor installed on the gearbox or on the wheels. The gearbox sensing method is complex and expensive compared to the “rpm” sensor installed on the wheels. Vehicle velocity estimations using Accelerometer is a novel method. By acquiring and logging the accurate accelerometer data and GPS information, velocity can be calculated. IMU has a built-in accelerometer, Gyroscope to acquire real-time data. Moreover, application-based GPS coordinates are also logged for tracking the route. Here, the GPS application for location data relies on internet availability and its real-time data may lag during reading and recording. The GPS record for
Figure 1 shows a lesser receiving rate during low vehicle speed. However, IMU data is precise and does not rely on any external network connectivity due to direct local measurements. The benefit is due to the direct sensor placement on the vehicle so that the data can be immediately recorded. In addition, accurate IMU filtration improves the result.
After comparison in Fig.1, it is understood that the receiving rate is very important for the GPS, and data processing is important in IMU. Additionally, the integration of GPS and IMU will be the better solution to eliminate errors in the measurement. The novelty of this work is the method used for real-time drive cycle estimation and its application for HEV energy management of a scooter using simulation as well as real-time measurement. The accurate record of IMU data for Pune city is explained in
Section 4. Extensive data are collected and the results on the chosen track are verified experimentally for a hybrid scooter.
Figure 2 shows the outline of the work presented in this manuscript.
2. Error Estimations in IMU Measurements
One of the most important factors for errors in IMU is the acquisition of unwanted vibration which can be caused by several mechanisms like engine vibration, road irregularities. Vibration dampers in the vehicles are not able to arrest low amplitude high-frequency vibrations which is the most important cause appearance of random data in +g and −g. Random vibrations are directly plotted and their average values are calculated. Offset error is calculated by plotting the IMU data as shown in
Figure 3. The preliminary offset and sensor calibration is taken into consideration.
Uncertainty analysis is also essential to prove the accuracy of the experiments. All the measurements of physical quantities are subject to uncertainties.
Table 1 details the uncertainties of measured parameters.
To have reasonable limits of uncertainty for a computed value an expression is derived as follows.
Let “R” be the computed result function of the independently measured variables x
1, x
2, x
3, …, x
n, as per the relation.
and let error limits of the measured parameters be
and the error limits for the computed result be R ± ΔR.
Hence to get the realistic error limits for the computed result the principle of the root mean square method is used to get the magnitude of error given by Holman (1973) as
Using the above equation, the uncertainty in the computed values of Force, Power etc. were estimated. The measured values such as the mass of the Vehicle, Voltage, Current etc. are estimated from their respective uncertainties based on the Gaussian distribution. The uncertainty table for measuring sensors can be found below.
Manufacturer datasheet and experimental comparison with high-precision IMU sensor, the error in acceleration due to motion in the y-direction is estimated. For ±2 = 16,384 LSB/g is the bias considering this data from datasheet and this sensitivity because of low error per reading we took data and compared with X-sens IMU. So, the following error resulted in acceleration due to motion in y-direction which is 4.33% in dynamic conditions. The uncertainty of the estimated parameters for dynamic errors is given in
Table 2.
3. Noise and Data Filtration
Two-wheelers are more prone to vibrations due to engine and components. It is shown in
Figure 4 that vibrations are negligible at the start and once the vehicle starts on idle rpm, due to vehicle vibrations in all directions (x, y, z), forward accelerations (y-accelerations in accelerometer) are also increased.
Figure 4 shows Y-accelerations at idle and these accelerations are the result of vibrations. We are focusing on accelerations due to forward movement in IMU and hence the Moving average filter is used to remove unwanted noise. The window size of “10” is decided after various filter experiments on speed points.
4. Data Collection Methodology for Real-Time Drive Cycle
As the road conditions are much different (in India) from the lab environment, optimization of the Energy Management System (of HEV/EV) in line with standard Drive Cycles may not be adequate; hence, localized road conditions-based drive cycles can yield better output. Thus, it is better to capture variations in driving method, geographical condition, and energy consumption based on vehicle type in a localized driving cycle. All these parameters are important for the optimization of energy in HEV.
From the literature, it is understood that many researchers have used smartphones to collect data and to track the vehicle’s start to end time of the trip, for data logging, etc. [
6,
7]. GPS facilities in smartphones were used for velocity estimation [
6]. Vehicle Velocity is estimated by applying filters to the collected data. However, it is observed that the accuracy of test data is quite limited using smartphones since the GPS apps are designed not to burden on storage capacity. Also, velocity tracking may have less accuracy than professional devices with lowered data sampling rates. Most smartphones have Accelerometers, Magnetometers, and Gyroscope sensors for different applications. Mobile phone GPS can be used as a stand-by or can be used to compare the data with the output of accurate test devices for benchmarking. Local driving cycle logs are found very effective compared to Geographic Positioning Systems (GPS). A total of seven satellite-based positioning and navigation systems give approximate coordinates. To enhance the correctness in the detection of road profiles, a more accurate data extract can be conducted. Here, IMU removes all the GPS shortcomings and has various advantages compared to other sensors like better robustness against external noise than GPS due to direct measurement from the source. Also, IMU is economically reliable and readily mountable for development purposes [
16].
For better precision, an IMU is programmed with a higher sampling rate than smartphones can to record data in SD cards. For drive cycle estimation, the test route is selected and data are recorded using AN53 IMU data logger. The drive cycle extraction method is explained in
Section 4. During the study, the vehicle movement is captured under various conditions like gradual acceleration, quick acceleration, deceleration, etc. [
5,
7,
17]. Review shows that data loggers for below 0.5 kW EVs need to have a sampling rate from 1–3 Hz frequency to capture accurate vehicle dynamics. A too-high sampling rate increases the measurement noise and does not add any information. For this work, an 8 Hz sampling rate is selected for better estimations, and, accordingly, data are logged in SD card. As there is no specific drive cycle for EV and HEVs, the collected data which is the actual driving condition at a particular instant of the time is utilized for estimations, and the outputs are not compared with the standard driving cycle. For validation purposes, geographical distances are also calculated with the help of Google maps.
5. Data Logger System Development
A data logger is developed for Through-the-Road parallel HEV scooter and data are recorded based on the electric, engine, and hybrid modes using the Bosch BMI-088 IMU sensor.
Figure 5 shows the complete assembly of the IMU kit that is developed for recording the vehicle’s linear and angular accelerations with the programmable sampling rate. In
Figure 5, module ‘1’ is the shuttle board for IMU chip BMI 088. The shuttle board includes an IMU chip and interfacing facility. Power supply and I2C pins are interfaced with the processor. Module ‘2’ is a microcontroller unit (MCU) that interfaced with IMU, SD card, and power supply. Module ‘3’ is the SD card record facility. Serial Peripheral Interface (SPI) is used for micro-SD card interfacing and data are recorded. Module ‘4’ is a power bank used to power the MCU module.
Table 3 Describes the specifications of the data logger used in this work. An ATmega-2560 microcontroller-based Inter-IC communication (I2C) interfacing is developed.
As mentioned above, IMU is capable to output the data with 2.5 to 1600 Hz. A serial Interface with a 12,900 baud rate is used to verify the data on the serial monitor. The serial monitor for the data indicates sample number, X, Y, Z accelerations in m/s
2 followed by X, Y, Z angular displacements in degrees. An IMU sensor is used to estimate real-time vehicle state and velocity. In the HEV perspective, the drive cycle is used to find out covered distance and energy utilization for switching between the conventional engine and Motor.
Figure 6 describes the programming methodology of the data logger. Libraries interrupt and the serial port is initialized. All the necessary programming registers for I2C addresses, bandwidth, and output data rate are configured. A serial port is used for the initial check for data sample records during functionality development to confirm that the data logging pattern and data calibration are done correctly. Later, only the SD card records the same data pattern in the file on the vehicle as shown in
Figure 6. In this study, Ax subjects to lateral, Ay to forward, and Az to vertical accelerations. Accelerometer and Gyroscope are recorded every 200 ms. Data of all variables are later processed in a file to calculate vehicle speed in km/s.
6. Methodology for Estimating the Real-Time Drive Cycle
Figure 7 represents the methodology used for real-time drive cycle estimation from IMU. Data recorded by data logger at 8 Hz sampling rate is used for estimation of vehicle–road data characteristics. The sensor is calibrated in X, Y, and Z coordinates. IMU is interfaced with the Microcontroller through the I2C channel and the data are logged in the SD card by a firmware programming environment. While the data are logged into the SD card, every time an LED is programmed to blink so that it is easy to identify whether the data log is going on or facing any issues. Once the data are logged into the SD card for a known route, the data from the SD card is transferred to a computer for processing.
The motor installed on a scooter is 850 W, vehicle Gross Vehicle weight of 177.5 kg, then with 10 km/h vehicle velocity, Acceleration would be [
7],
The recorded accelerations with time frames are used to estimate the velocity. Let
be the processed velocity (km/s) at sampling time
, Y-acceleration, i.e., forward acceleration is
, let starting velocity be
and previous sampling time is
. Velocity at any sampling time in km/s can be calculated from the below equation,
A simplified formula for estimating tractive effort that includes drag force, rolling friction, and the gradient is used for estimating the energy consumption. Motor and engine outputs are calculated using calculated acceleration.
It is assumed that there is no inclination on-road, i.e.,
and hence gradient force in the above equation is zero. Additional electrical load like
, horn, marker lamps of the vehicle is also included. The power for the motor is estimated based on the Tractive Force (
, vehicle speed (
), and powertrain efficiency (
. The mathematical addition of all Power values (P) from the start time (
) to end time
for the one trip is given by [
7],
However, Energy can be estimated from instantaneous power as given below,
For 0.72 kWh of the battery pack, practical mileage on EV mode is observed to be 30 km. As stated above, if the required vehicle power is less (at lower speeds), then the vehicle switches to EV mode. The battery-pack power consumption can be calculated from battery voltage (V) and current (I) as given below,
Noise elimination is the biggest challenge in all data recording systems or Data Acquisition Systems (DAS). Multiple filtering methods are available for noise elimination. Analog and digital filtering are the two approaches to solve this challenge. Digital filtering using mathematical procedures is a
Very popular method due to the achievement of precision. Applications used the lowest possible energy consumption, and so response duration is to be expected. Moving Average filter is used for noise removal. The popular and simple method of “Moving Average Filter (MAF)” is chosen for this study. This method reduces noise without major data compromising [
18].
Figure 8 shows the MAF filtered data with the original. MAF has the characteristic equation as follows,
where
is output,
is input, and
n is the value of some readings to be averaged. The above difference equation is also known as the recursive form.
Using the accelerometer output, velocity is estimated by multiplying acceleration with time.
Figure 9 shows the plot of the estimated velocity of the vehicle with respect to time. To clearly show the velocity, the data are plotted for 500 s.
Energy utilization can be estimated in various ways. Using a fuel map table, the fuel consumption of the conventional engine can be estimated theoretically with drive velocity. The outputs of the estimations can be compared with the experimental fuel consumption data for calibration and to derive a correction factor. Generally, the experimental fuel consumption of the vehicle can be calculated by volumetric or by gravimetric measurement. For volumetric measurement, a standard 100 mL measuring jar will be connected to the carburetor and the distance covered for every 100 mL fuel consumption is found. Here, for fuel consumption measurements, the data are collected on a two-wheeler chassis dynamometer, and with the help of a burette, fuel consumption is found. Fuel maps are generated with different throttle openings and wheel rpms. In addition, on the test track, a 100 mL measuring jar is also used for fuel consumption estimation. On the same chassis dynamometer data are also collected on EV mode (for motor energy consumption).
Figure 10 shows the two-wheeler chassis dynamometer used in this work to acquire the fuel map data.
A fuel map for the ‘conventional engine’, Electric motor model for EV mode, and ‘Through-the-Road’ parallel configuration for the scooter model is developed using Matlab Simulink. With these maps, power requirement-based fuel consumption can be found if rpm and throttle angle is known. The fuel consumption results are discussed in the results and discussion section. The generated velocity from the IMU data logger can be fed to the model as a drive cycle to estimate the fuel consumption.
7. State of Charge (SOC) Estimation
SoC is the representation of battery capacity or charge available with the battery for utilization. SoC is useful for preventing the battery from over-charging or over-discharging during operation. Researchers are exploring various methods of estimating SoC for the battery pack as precise SoC estimation helps in the extension of battery life. It is observed from the literature that battery pack SoC estimation is the key parameter for the HEV controller. Effective energy management in HEV is carried out by optimization of switching between the conventional powertrain and electric motor. Drivability (smoothness of the switching and steady acceleration) is an important factor that needs to be considered while switching. Smooth drive performance is only possible when SoC is measured accurately. Lithium-ion battery packs are different from lead-acid batteries and they have different charge/discharge characteristics, i.e., the open-circuit voltage curve is not linear with SoC from 0% to 100% SoC range. To estimate SoC, open-circuit voltage (OCV), load voltage, and actual current consumption of the battery are continuously measured when the pack is connected to the load (OCV and Columb Counting method) with respect to time. With the recorded voltage, current, OCV, and nominal battery capacity SoC calculations are carried out.
8. Drive Track Selection
Figure 11 shows the route map of span 16 km selected in Pune city for the test drive cycle. To visualize the test track, an android application is installed on a mobile phone and it uses mobile phone GPS data to track the test vehicle. For calibration and benchmarking purposes, the test vehicle is driven multiple times on the test track. To avoid errors in fuel consumption measurement, the vehicle is driven (on engine and motor mode) during midnight to avoid traffic. For hybrid operation, the vehicle is driven during peak traffic hours to test the switching operation.
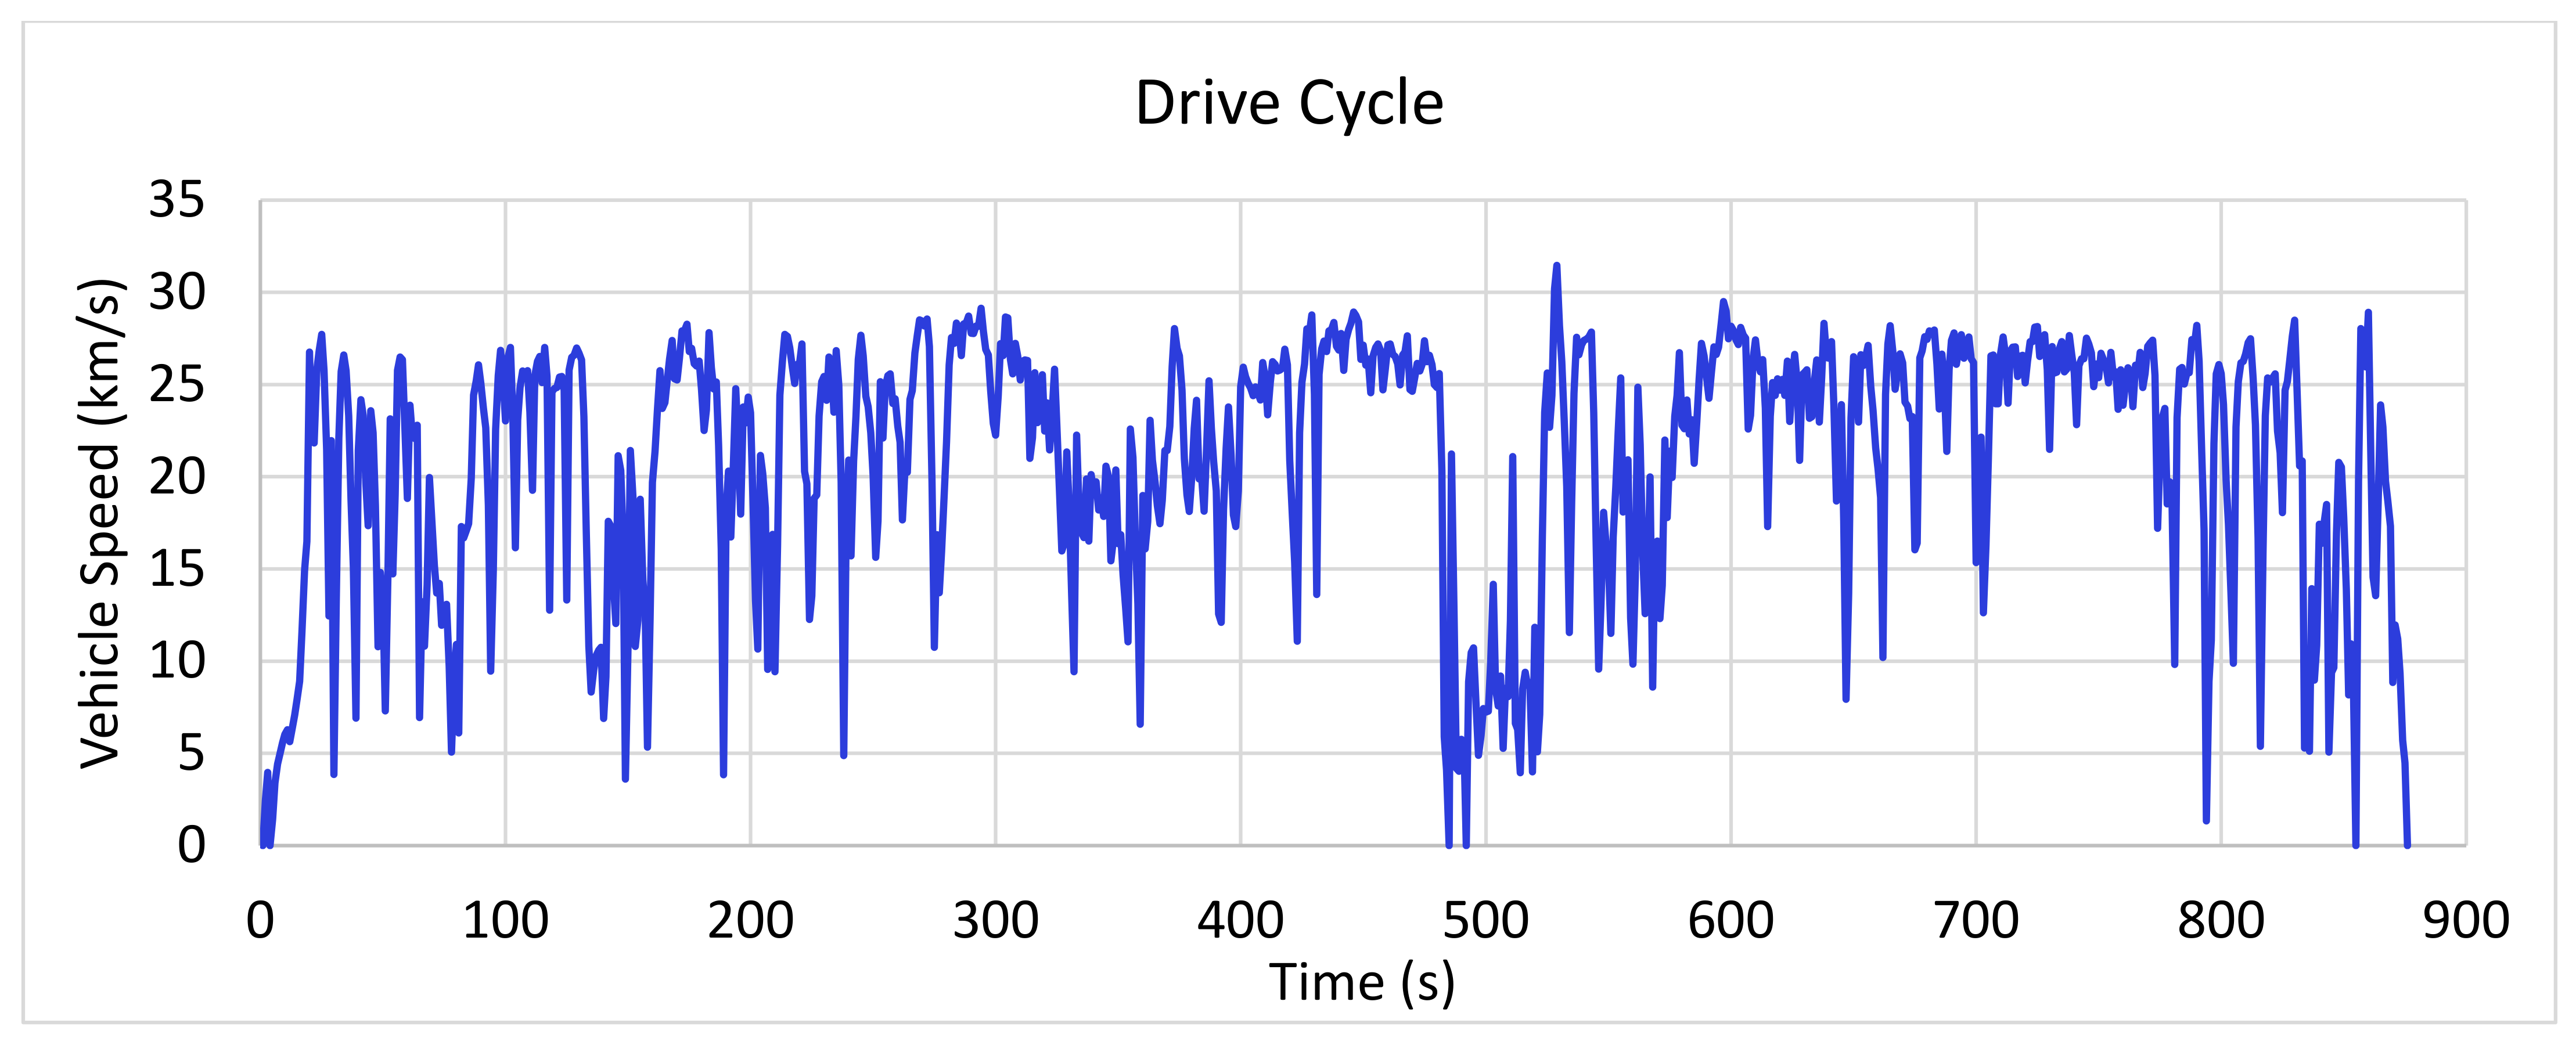
Figure 12 shows the calculated velocity vs time plot for the selected test track and it is given as an input drive cycle, with an average velocity of 26.86 km/h, observations are made on actual and simulation platforms.
9. Results and Discussions
The actual drive cycle on the city road is captured using IMU and given as input to fuel map tables for estimation of fuel consumption. Secondly, the same drive cycle is given to the Simulink-based EV model (BLDC motor model) in which SoC consumption is estimated. For the third, i.e., HEV mode, the controller takes input from the drive cycle and decides the power plant for traction. Based on the drive cycle velocity and SoC controller has control rules for energy-efficient HEV operations. A threshold of 20 km/h is set for EV mode, i.e., if velocity is below the threshold and the SoC battery is higher than 30%, EV mode is switched ON. If the SoC battery is below 30%, then the controller switches to Engine mode despite velocity value [
15]. Regeneration of energy into a battery is only considered in HEV mode.
Figure 13 shows the switching mode highlights for testing modes.
Based on the mode-wise testing procedures, following fuel consumptions, energy consumption, and covered ranges are tabulated. For covering the actual 16 km distance on different modes, observations are tabulated in
Table 4. Total Fuel Consumption for the selected track is 0.3892 kg, i.e., 4.943 kWh, whereas simulation results in 0.3694 kg, i.e., 4.691 kWh.
Figure 14 represents cumulative fuel consumption on engine mode for the entire inputted drive cycle. With an 8 Hz sampling rate, the data of 7300 samples are used for measurements and the graphs are plotted.
Similarly, motor-only mode simulation results and experimental results indicate 0.398 kWh battery capacity consumption with simulation for a 16 km range, whereas actual consumption indicated 0.382 kWh battery capacity consumption for the same range. With EV propulsion, SOC remained with battery is observed to be 60.53% by simulation and 60.61% experimental as shown.
Figure 15 shows the cumulative fuel consumption during HEV simulation mode.
Figure 16 shows Simulation results for SoC. These results are observed for engine and motor, respectively, and do not include regeneration of charge during braking. Regeneration mode during braking is disabled to measure the actual consumption on motor mode. Hybrid mode is the third mode, which only can regenerate electricity to the EV battery during coast down. The engine also additionally charges the battery when the SoC is less than 30%. Hybrid simulation estimates a total of 2.7388 kWh of energy which comprises 0.1788 kg gasoline consumption and 0.468 kWh of battery energy. The SoC consumption in
Figure 17 shows that 79.68% of capacity remains theoretically and 78.89% experimentally.
Figure 18 shows the covered driving range of 16 km. This range is chosen for all the testing modes.
It is concluded from the results that, for a 16 km track, energy consumption on engine only mode consumes 0.3892 kg of fuel. Hybrid conversion of a conventional vehicle was found to be more efficient for urban driving. The fossil fuel consumption with hybrid logic is enabled only when the vehicle speed is above 20 km/h and when the EV battery is discharged. Hence, during traffic EV mode is found to be efficient for start-stop functionality. Regeneration during coasting down, braking, and engine mode, additionally charges the EV batteries which helps to extend range marginally. Also, due to increased charging infrastructure, EV mode of operation will be easier in the future. Hence, it is indicated from the results that HEV conversion of the scooter is more energy efficient with parallel architecture. This is the prime advantage of a hybrid vehicle. As engine modification is very difficult in scooters, the in-use scooter hybridization will help to lower the fuel scarcity and emission issues.
10. Conclusions
It is concluded from the article that drive cycle estimation is possible with the help of IMU sensors. If an appropriate drive cycle is known then accurate energy consumption can be estimated with the described method in this article for engine, EV, and HEVs. The parallel hybrid converted scooter is equipped with a hybrid controller and the HEV control strategy is found useful for urban roads. The paper cites the estimation of drive cycle using IMU which helped to program the HEV controller. From the results, it is proven that HEV technology has the capability of better energy management and is found very efficient on congestive roads. Hence, HEV scooters play an important role in the improvement of fuel economy and lowering the carbon pollutants from the vehicle. Moreover, range extension is possible with the given configuration, and further can be increased with higher battery capacity. The energy consumption results highlight the hybrid benefits by lowering the tailpipe emissions and fuel consumption.
Author Contributions
Conceptualization, S.K.-N. and Chidambaram, R.K.C.; methodology, S.K.-N.; software, S.K.-N.; val-idation, S.K.-N. and R.K.C.; formal analysis, S.K.-N.; investigation, S.K.-N.; resources, S.K.-N. and R.K.C.; data curation, S.K.-N.; writing—original draft preparation, S.K.-N.; writing—review and editing, S.K.-N. and R.K.C.; visualization, S.K.-N., R.K.C. and S.P.; supervision, R.K.C.; project administration, S.K.-N.; funding acquisition, S.K.-N. All authors have read and agreed to the published version of the manuscript.
Funding
No external funding.
Institutional Review Board Statement
Not applicable.
Informed Consent Statement
Not applicable.
Data Availability Statement
Data is included in the text.
Conflicts of Interest
The authors declare no conflict of interest.
References
- Esteves-Booth, A.; Muneer, T.; Kirby, H.; Kubie, J.; Hunter, J. The measurement of vehicular driving cycle within the city of Edinburgh. Transp. Res. Part D Transp. Environ. 2001, 6, 209–220. [Google Scholar] [CrossRef]
- Parekh, V.; Shah, V. Measurement and Analysis of Indian Road Drive Cycles for Efficient and Economic Design of HEV Component. World Electr. Veh. J. 2015, 7, 121–132. [Google Scholar] [CrossRef] [Green Version]
- Geetha, A.; Subramani, C. Development of driving cycle under real world traffic conditions: A case study. Int. J. Electr. Comput. Eng. 2019, 9, 4798–4803. [Google Scholar] [CrossRef]
- Kamble, S.H.; Mathew, T.V.; Sharma, G. Development of real-world driving cycle: Case study of Pune, India. Transp. Res. Part D Transp. Environ. 2009, 14, 132–140. [Google Scholar] [CrossRef]
- Wang, Q.; Huo, H.; He, K.; Yao, Z.; Zhang, Q. Characterization of vehicle driving patterns and development of driving cycles in Chinese cities. Transp. Res. Part D Transp. Environ. 2008, 13, 289–297. [Google Scholar] [CrossRef]
- Han, H.; Yu, J.; Zhu, H.; Chen, Y.; Yang, J.; Zhu, Y.; Xue, G.; Li, M. SenSpeed: Sensing driving conditions to estimate vehicle speed in urban environments. IEEE Trans. Mob. Comput. 2014, 15, 727–735. [Google Scholar] [CrossRef]
- Rechkemmer, S.K.; Zang, X.; Boronka, A.; Zhang, W.; Sawodny, O. Utilization of Smartphone Data for Driving Cycle Synthesis Based on Electric Two-Wheelers in Shanghai. IEEE Trans. Intell. Transp. Syst. 2021, 22, 876–886. [Google Scholar] [CrossRef]
- Song, C.K.; Uchanski, M.; Hedrick, M.K. Vehicle Speed Estimation Using Accelerometer and Wheel Speed Measurements; Society of Automative Engineers, Inc.: Warrendale, PA, USA, 2018. [Google Scholar]
- Song, G.; Yu, L. Estimation of Fuel Efficiency of Road Traffic by Characterization of Vehicle-Specific Power and Speed Based on Floating Car Data. Transp. Res. Rec. J. Transp. Res. Board 2009, 2139, 11–20. [Google Scholar] [CrossRef]
- Wu, L.-J. Experimental Study on Vehicle Speed Estimation Using Accelerometer and Wheel Speed Measurements. In Proceedings of the Second International Conference on Mechanic Automation and Control Engineering, Inner Mongolia, China, 15–17 July 2011; pp. 294–297. [Google Scholar]
- Anselma, P.G.; Huo, Y.; Roeleveld, J.; Emadi, A.; Belingardi, G. Rapid optimal design of a multimode power split hybrid electric vehicle transmission. Proc. Inst. Mech. Eng. Part D J. Automob. Eng. 2018, 233, 740–762. [Google Scholar] [CrossRef]
- Zhang, F.; Hu, X.; Langari, R.; Cao, D. Energy management strategies of connected HEVs and PHEVs: Recent progress and outlook. Prog. Energy Combust. Sci. 2019, 73, 235–256. [Google Scholar] [CrossRef]
- Liu, T.; Huilong, Y.; Yu, H.; Hu, X. Robust Energy Management Strategy for a Range Extender Electric Vehicle via Genetic Algorithm Optimal torque distribution of a 4WD electric race car to achieve the minimum lap time View project Energy Management of Hybrid Electric Vehicles View Project Ro. 2018. Available online: https://www.researchgate.net/publication/326332196 (accessed on 3 October 2021).
- Martínez, L.R.; Prieto, M.D. New Trends in Electrical Vehicle Powertrains; IntechOpen: London, UK, 2019. [Google Scholar] [CrossRef] [Green Version]
- Kalyankar-Narwade, S.; Chidambaram, R.; Patil, S. Neural Network- and Fuzzy Control-Based Energy Optimization for the Switching in Parallel Hybrid Two-Wheeler. World Electr. Veh. J. 2021, 12, 35. [Google Scholar] [CrossRef]
- Gim, J.; Ahn, C. Imu-based virtual road profile sensor for vehicle localization. Sensors 2018, 18, 3344. [Google Scholar] [CrossRef] [PubMed] [Green Version]
- Brady, J.; O’Mahony, M. Development of a driving cycle to evaluate the energy economy of electric vehicles in urban areas. Appl. Energy 2016, 177, 165–178. [Google Scholar] [CrossRef]
- Ghio, A.; Escalante, S.; Tarrillo, J. Analysis of Moving Average Filter for IMU Measurements on an 8-bit Microcontroller. In Proceedings of the 2018 IEEE XXV International Conference on Electronics, Electrical Engineering and Computing (INTERCON), Lima, Peru, 8–10 August 2018; pp. 1–4. [Google Scholar] [CrossRef]
Figure 1.
Comparison of IMU and GPS data for estimation of vehicle speed (km/h). (a) Without filtering (b) with filtering.
Figure 1.
Comparison of IMU and GPS data for estimation of vehicle speed (km/h). (a) Without filtering (b) with filtering.
Figure 2.
Flowchart of the current work explaining the outline of the work.
Figure 2.
Flowchart of the current work explaining the outline of the work.
Figure 3.
Calculation of Preliminary offset error and Vibration rectification error.
Figure 3.
Calculation of Preliminary offset error and Vibration rectification error.
Figure 4.
Forward accelerations at idle.
Figure 4.
Forward accelerations at idle.
Figure 5.
IMU Data Logger.
Figure 5.
IMU Data Logger.
Figure 6.
Flowchart for data record handling in IMU Data Logger.
Figure 6.
Flowchart for data record handling in IMU Data Logger.
Figure 7.
Methodology for data capturing, processing, and plotting.
Figure 7.
Methodology for data capturing, processing, and plotting.
Figure 8.
Original IMU recorded data versus MAF data (Orange: Recorded data, Blue: Averaged data with window size = 10).
Figure 8.
Original IMU recorded data versus MAF data (Orange: Recorded data, Blue: Averaged data with window size = 10).
Figure 9.
Velocity estimated from acceleration using IMU.
Figure 9.
Velocity estimated from acceleration using IMU.
Figure 10.
Two-Wheeler Chassis dynamometer.
Figure 10.
Two-Wheeler Chassis dynamometer.
Figure 11.
Selected route map for drive cycle.
Figure 11.
Selected route map for drive cycle.
Figure 12.
Driving Cycle chosen in Pune city for 16 km driving range.
Figure 12.
Driving Cycle chosen in Pune city for 16 km driving range.
Figure 13.
The switching mode highlights for testing modes.
Figure 13.
The switching mode highlights for testing modes.
Figure 14.
Simulation results for cumulative Fuel consumption during Engine mode.
Figure 14.
Simulation results for cumulative Fuel consumption during Engine mode.
Figure 15.
Simulation results for fuel consumption during HEV mode.
Figure 15.
Simulation results for fuel consumption during HEV mode.
Figure 16.
Simulation results for SoC during ‘Motor only’ mode.
Figure 16.
Simulation results for SoC during ‘Motor only’ mode.
Figure 17.
Simulation results for SoC during HEV mode.
Figure 17.
Simulation results for SoC during HEV mode.
Figure 18.
Simulation results for Driving range during HEV mode.
Figure 18.
Simulation results for Driving range during HEV mode.
Table 1.
Estimated uncertainties of measured parameters.
Table 1.
Estimated uncertainties of measured parameters.
| Sr. No. | Name of Sensor | Uncertainty (%) |
|---|
| 1 | Vehicle weight | 0.05 |
| 2 | Accelerometer | 4.33 |
| 3 | Time | 0.01 |
Table 2.
Estimated uncertainties of estimated parameters.
Table 2.
Estimated uncertainties of estimated parameters.
| Sr. No. | E Parameters | Uncertainty (%) |
|---|
| 1 | Velocity | 0.5 |
| 2 | Power | 4.51 |
Table 3.
Data Logger Specification.
Table 3.
Data Logger Specification.
| Sr. No. | Description | Range |
|---|
| 1. | Operating Voltage range | 2.4 to 3.6 V |
| 2. | Operating Temperature range | −40 to +85 °C |
| 3. | Sampling Rate | 8 Hz |
Table 4.
Observations of practical and simulation results.
Table 4.
Observations of practical and simulation results.
| Sr. No. | Mode of Operation | Method | Total Fuel Consumed | Energy Consumption (kWh) | Total Energy Consumed | SOC |
|---|
| Kg | Gas. | Battery | kWh | % |
|---|
| 1 | Engine only | Simulation | 0.3892 | 4.943 | Nil | 4.943 | Nil |
| Experimental | 0.3694 | 4.691 | Nil | 4.091 | Nil |
| 2 | Motor
only | Simulation | Nil | Nil | 0.398 | 0.398 | 60.53 |
| Experimental | Nil | Nil | 0.382 | 0.382 | 60.42 |
| 3 | Hybrid | Simulation | 0.1788 | 2.2708 | 0.468 | 2.7388 | 79.68 |
| Experimental | 0.1677 | 2.1298 | 0.459 | 2.5888 | 78.89 |
| Publisher’s Note: MDPI stays neutral with regard to jurisdictional claims in published maps and institutional affiliations. |
© 2022 by the authors. Licensee MDPI, Basel, Switzerland. This article is an open access article distributed under the terms and conditions of the Creative Commons Attribution (CC BY) license (https://creativecommons.org/licenses/by/4.0/).


