Article

Evaluation of Holstein Cows with Tongue-Rolling: Plasma Metabolomics and Milk Proteomics

1
State Key Laboratory of Animal Nutrition and Feeding, Institute of Animal Sciences, Chinese Academy of Agricultural Sciences, Beijing 100193, China
2
College of Animal Science and Technology, China Agricultural University, Beijing 100193, China
*
Author to whom correspondence should be addressed.
Dairy 2025, 6(5), 53; https://doi.org/10.3390/dairy6050053
Submission received: 20 July 2025 / Revised: 9 September 2025 / Accepted: 20 September 2025 / Published: 23 September 2025
(This article belongs to the Section Dairy Animal Nutrition and Welfare)

Abstract

Stereotypic behaviors are common in farm animals and often signal poor welfare. Tongue-rolling is the most prevalent stereotypic behavior in cows. In this study, we compared the plasma and milk composition of 16 high-frequency tongue-rolling cows (HTR group) and 16 non-stereotypic cows (CON group). All cows were primiparous cows. Biochemical tests, plasma metabolomics, and milk proteomics revealed higher plasma triiodothyronine levels in HTR cows, and lower levels of αs1-casein, β-casein, κ-casein, and lactoferrin in their milk. Multi-omics analyses identified 103 differential metabolites and 73 differential proteins, including various GTP-binding proteins, with the Ras signaling pathway being significantly upregulated in the HTR cows. GO enrichment analysis highlighted significant changes in molecular function, particularly related to GTP/GDP-binding proteins. Additionally, HTR cows exhibited elevated cellular metabolic activity. These findings suggest that high-frequency tongue-rolling is associated with altered endocrine and metabolic profiles, disrupted milk protein synthesis, and impaired immune function potential. The reduction in key milk proteins and lactoferrin may negatively impact milk quality and immune defense. Further research is needed to clarify the causal relationship between these physiological changes and tongue-rolling, providing insights into the underlying mechanisms of stereotypic behaviors in dairy cows and their implications for animal welfare and milk production.

1. Introduction

Stereotypic behaviors are continuous, repetitive, and seemingly non-functional actions observed in various animals, including farm, zoo, companion, and wild animals [1,2,3,4]. These behaviors have long been considered indicators of poor animal welfare, often associated with suboptimal living conditions [5], restricted behavioral expression [6], and inadequate dietary nutrition [3,7]. Among cows, common stereotypic behaviors include tongue-rolling, feed-tossing, and excessive rubbing [8]. Tongue-rolling (TR), characterized by repeated circular movements of the cow’s tongue inside and outside the mouth [8], is the most prevalent stereotypic behavior in dairy farming [9] and is categorized as a form of non-nutritive oral behavior (NNOB). Recent studies have shown that the prevalence of TR in dairy cows is approximately 30% [8,10], and it tends to increase initially and then decrease with the progression of days in milk.
Researchers have proposed that stereotypic behaviors arise when animals are prevented from performing highly motivated behaviors [11,12]. For instance, cows with shorter feeding times spend more time TR [13], and feed restriction has been shown to increase the expression of TR [14,15]. Frequent expression of TR is often associated with adverse physiological changes. Sun et al. [16] reported that TR cows exhibited significantly lower ruminal pH, acetate-to-propionate ratio, and total volatile fatty acid concentrations compared with control cows. In addition, serum levels of total cholesterol, triglycerides, thyroid hormones, norepinephrine, and interleukin-6 were elevated in tongue-rolling cows. Mahmoud et al. [17] further suggested that TR cows experience anemia, reduced energy availability, and oxidative stress. Research has shown that high-concentrate diets reduce feeding and rumination time in ruminants [18], which may lead to the emergence of NNOB, such as tongue-rolling [3]. Several studies have also shown that increasing roughage in the diet can reduce NNOB in Holstein cows, including both heifers and bulls [19,20,21,22].
Although omics techniques are widely applied in livestock and poultry research, including breeding, disease diagnosis, nutrition, and welfare [23,24,25], their application to animal behavior, particularly in the context of stereotypic behaviors, remains limited. Brinker et al. [26] demonstrated that γ-aminobutyric acid is involved in abnormal behavior in laying hens through whole genome sequencing. Similarly, Sun et al. [16] used 16S rDNA sequencing to analyze rumen microbes in dairy cows and found that Firmicutes were less abundant in cows exhibiting TR behavior compared to those without stereotypic behavior. Additionally, Wilson et al. [27] identified an association between tail-biting behavior in pigs and Sus scrofa chromosome 16 using genome-wide association analyses.
In our previous study, we found that milk protein percentage, milk true protein percentage, and milk crude protein percentage were significantly lower in high-frequency TR cows than in non-stereotypic cows [8]. Building on these findings, this study aims to investigate the differences in plasma metabolites and milk proteins between high-frequency TR cows and non-stereotypic cows using metabolomics and proteomics. We hypothesize that high-frequency TR cows exhibit significant metabolic differences compared to non-stereotypic cows, particularly in relation to milk protein metabolism. Furthermore, the milk quality of TR cows may be inferior.

2. Materials and Methods

2.1. Animal Welfare Statement

The experiment was performed at the dairy farm of the Shandong Yinxiang Weiye Group Company (Cao County, Shandong, China, 115°26′ E, 34°50′ N). The farm keeps Holstein cows for milk production. All experiments were approved by the Animal Ethics Committee of the Chinese Academy of Agricultural Sciences (Beijing, China, approval number IAS2023-68).

2.2. Animal, Management, and Behavioral Observations

A total of 916 first-lactation dairy cows were housed in three large cowsheds. Each cowshed contained two pens, and each pen was equipped with 200 individual stalls. All cows were milked three times a day (8:00, 15:00, 20:00), and after each milking, they were fed total mixed ration (TMR) at 8:30, 15:30, 20:30. The TMR was sieved through a four-layer Penn State Particle Separator, with 10.30%, 34.95%, 15.32%, and 39.42% of the feed retained on the first, second, third, and fourth layers, respectively. Dietary ingredients are described in Table A1. The TMR diet consisted of 61.62% roughage and 38.37% concentrate. Veterinarians conducted daily health checks and assessed body condition scores (BCS, on a scale of 1 to 5) monthly. Milk yield and days in milk (DIM) of lactating cows were automatically recorded every day by a fully automated milking system.
Three trained observers conducted behavioral scans of all 916 cows over a 10-day period (21–30 April) using the scan sampling method [28]. The recorded stereotypic behaviors included TR, pica, feed-tossing, inter-sucking, head-shaking, excessive-grooming, excessive-vocalizing, and excessive-rubbing. Prior to the formal observation period, the observers underwent a 3-day calibration phase in the same cowshed, focusing on TR. The prevalence-adjusted bias-adjusted kappa (PABAK) values for all stereotypic behaviors exceeded 0.8, indicating a high level of agreement among the observers in identifying stereotypic behaviors. During the formal observation phase, three observers were randomly assigned to different cowsheds on the first day, ensuring that each cowshed had one observer. To minimize bias, the observers rotated daily among the three cowsheds, completing a full rotation every three days, such that each observer covered all cowsheds within each cycle. For each scan sampling session, the observer slowly walked through the cowshed from one end to the other, visually inspecting all cows and recording the cow’s ID and specific types of stereotypic behavior displayed. Each session lasted for 10 min, followed by a 10-min break. Observations were carried out 10 times in the morning (08:00–11:10) and another 10 times in the afternoon (14:00–17:10), resulting in 20 observations per day across 10 consecutive days, yielding a total of 200 observations.
During the behavioral observation period, ambient temperature (Ta) and relative humidity (RH) in the barn were automatically recorded every 10 min using Kestrel 5400 Heat Stress Trackers (Nielsen-Kellerman, Boothwyn, PA, USA), and the temperature–humidity index (THI) was calculated using the following formula: THI = (1.8 × Ta + 32) − (0.55 − 0.0055 × RH) × (1.8 × Ta − 26). Throughout the observation period, the THI in the cowsheds averaged 59.60 ± 6.62.
After the behavioral observation, we ranked cows based on the number of observed TR occurrences and classified those with TR occurrences exceeding 1.5 times the first quartile as high-frequency TR cows. These cows exhibited a minimum of five TR episodes during 200 behavioral observations and did not display any other stereotypic behaviors. According to statistical calculations, a total of 55 cows were classified as high-frequency TR cows. We randomly selected 16 cows from the high-frequency TR cows as the high-frequency TR group (HTR group). To minimize the potential impact of DIM on this study, we randomly selected 16 cows from 108 non-stereotypic cows whose DIM was comparable to that of the HTR group to serve as the control group (CON group). All selected cows were confirmed to be healthy following veterinary examination. We conducted behavioral observations for an additional 3 days to ensure that HTR cows continued to exhibit TR, while CON cows remained free of stereotypic behaviors.

2.3. Sample Collection

To minimize potential variations due to feeding status and circadian rhythms, blood samples were collected before the morning feeding on the first day following the 3-day behavioral observation. Blood was collected from the caudal vertebral vein of each cow using a 20 mL syringe. Collected blood samples were centrifuged at 3000 r/min for 10 min at 4 °C. The plasma was then extracted and divided into four 2 mL cryotubes, which were initially stored in liquid nitrogen and subsequently transferred to a −80 °C freezer for storage prior to plasma biochemistry and untargeted metabolomics analyses.
On the first day after completing blood sample collection, 100 mL of milk samples were collected from each selected cow during milking at a ratio of 4:3:3 (morning: noon: evening). These samples were divided into five 20 mL cryotubes, stored in liquid nitrogen, and later transferred to a −80 °C freezer for storage before milk protein and proteomics analyses.

2.4. Biochemical Testing of Plasma and Milk Samples

We collected 32 frozen blood samples (16 per group) for plasma biochemical indicators testing. The measured indicators included stress markers such as dopamine (DA), and 5-hydroxytryptamine (5-HT), adrenaline (ADR) and norepinephrine (NOR); energy metabolism markers such as total cholesterol (TC), triglycerides (TG), high-density lipoprotein (HDL), low-density lipoprotein (LDL), glucose (GLU), free fatty acids (FFA), β-hydroxybutyric acid (β-HB), thyroxine (T4), triiodothyronine (T3), insulin (INS), and insulin-like growth factor-1 (IGF-1); protein metabolism markers such as albumin (ALB), total protein (TP), and urea nitrogen (UREA); and antioxidant markers such as lactate dehydrogenase (LDH), superoxide dismutase (SOD), glutathione peroxidase (GSH-Px), total antioxidant capacity (T-AOC), and catalase (CAT). The detection methods for TC, TG, HDL, LDL, GLU, FFA, β-HB, ALB, TP, UREA, LDH, SOD, GSH-Px, T-AOC, and CAT were colorimetric methods, while IGF-1, and ADR were detected using enzyme linked immunosorbent assay (ELISA), and DA, 5-HT, NOR, T4, T3 and INS were measured using radioimmunoassay (RIA). The test kits were provided by the Beijing Sinouk Institute of Biological Technology.
We collected 32 frozen milk samples (16 per group) for the milk biochemical indicators testing, including αs1-casein (αs1-CN), αs2-casein (αs2-CN), β-casein (β-CN), κ-casein (κ-CN), α-lactalbumin (α-LA), β-lactoglobulin (β-LG), and lactoferrin (LF). These indicators were detected using ELISA. The testing kits were provided by Shanghai Hengyuan Biological Technology Co., Ltd. (Shanghai, China), and the dairy farm provided the dairy herd improvement (DHI) data for the selected cows. The DHI testing of milk samples was performed using a FOSS MilkoScan FT+ (FOSS A/S, Hillerød, Denmark), including the determination of milk protein percentage, milk fat percentage, lactose percentage, true protein percentage, and crude protein percentage.

2.5. Untargeted Metabolomics Analysis

Due to cost considerations, we randomly selected 24 high-quality frozen plasma samples (12 per group), from which 100 µL of each sample was transferred into separate 1.5 mL centrifuge tubes for metabolomics analyses. Subsequently, 300 µL of pre-cooled acetonitrile (−20 °C; Thermo Fisher Scientific, Waltham, MA, USA) was added to each tube. The samples were vortexed for 1 min and then allowed to stand overnight at −20 °C. The plasma samples were centrifuged at 12,000 rpm for 20 min at 4 °C using a Legend Micro 17R centrifuge (Thermo Fisher Scientific, Waltham, MA, USA). From each sample, 100 µL of supernatant was collected for untargeted metabolomics analysis using liquid chromatography–mass spectrometry (LC-MS). Additionally, 50 µL of each supernatant was pooled to create quality control (QC) samples. LC-MS analysis was performed on a TripleTOF 6600+ system (Sciex, Framingham, MA, USA) equipped with a Waters HSS T3 column (50 mm × 2.1 mm, 1.8 µm; Waters Corporation, Milford, MA, USA).

2.6. Statistical Analysis

2.6.1. Data-Independent Acquisition Proteomics Analysis

Due to cost considerations, we randomly selected 24 high-quality frozen milk samples (12 from each group) for data-independent acquisition (DIA) proteomic analyses. These milk samples were obtained from the same cows from which plasma samples were collected for metabolomics analysis. Peptide fractions were prepared following the method of Wiśniewski et al. [29] and redissolved in 10 µL of 0.1% formic acid solution. The samples were then separated using a Vanquish liquid chromatography system (Thermo Fisher Scientific, Waltham, MA, USA) equipped with a nano Viper C18 column (75 µm × 250 mm, 2 µm, Thermo Fisher Scientific, Waltham, MA, USA). The mobile phase A consisted of an aqueous solution of 0.1% formic acid (Sigma-Aldrich, St. Louis, Missouri, USA), while mobile phase B was an aqueous solution of 80% acetonitrile and 0.1% formic acid. The peptide mixtures were subsequently analyzed and identified using an Orbitrap Exploris 480 mass spectrometer (Thermo Fisher Scientific, Waltham, MA, USA).

2.6.2. Biochemical Data Analysis

The information on BCS and DIM of lactating cows on the day before the start of the 10-day behavioral observation was included as categorical and continuous covariates, respectively, in the statistical analysis of biochemical data variables. Normality tests were conducted on all plasma and milk biochemical data. Data that did not conform to normality (including TG, T3, INS, IGF-1, ADR, 5-HT, SOD, GSH-Px, and CAT) were analyzed using Mann–Whitney U tests. All other data were analyzed using Student’s t-tests. Results from data that did not follow a normal distribution were presented as medians in figures, whereas other data were presented in tables as mean values ± SD. For all biochemical data, p-values < 0.05 were considered statistically significant.

2.6.3. Metabolomics Data Analysis

The raw files obtained from mass spectrometry were imported into Progenesis QI software (Waters Corporation, Milford, MA, USA) for data preprocessing and identification. Subsequently, QC analyses were conducted to verify the accuracy and reliability of the data. Metabolomics data were median-normalized and subsequently imported into MetaboAnalyst 6.0 (https://www.metaboanalyst.ca, Canada, 13 January 2025) for further analysis [30]. We first assessed the clustering of the metabolomics data using principal components analysis (PCA), followed by a series of t-tests for all metabolites, and orthogonal partial least squares–discriminant analysis (OPLS-DA) was employed to distinguish between the HTR cows and CON cows. The OPLS-DA model was validated with 1000 permutation tests, yielding R2Y and Q2 values greater than 0.5. The p-values were adjusted for multiple testing using the Benjamini–Hochberg method. Differential metabolites were identified based on an adjusted p-value < 0.05, variable importance in the projection (VIP) score ≥ 1, and a fold change (FC) > 1.2 or FC < 0.83. The results were visualized using a volcano plot.
All differential metabolites were classified at the superclass level. The compound names were entered into MBROLE 2.0 (http://csbg.cnb.csic.es/mbrole2/, Spain, 13 January 2025) [31]. We compared the differential metabolites against the Bos taurus (cow) database and conducted Kyoto encyclopedia of genes and genomes (KEGG) pathway enrichment analyses.
The OPLS-DA plot was generated using MetaboAnalyst 6.0, while the volcano plot and KEGG pathway enrichment plot were created using SRplot (http://www.bioinformatics.com.cn, China, 13 January 2025) [32]. The pie chart depicting superclass-level classification was produced using OmicStudio tools (https://www.omicstudio.cn, China, 13 January 2025) [33].

2.6.4. Proteomics Data Analysis

The raw files obtained from mass spectrometry were analyzed using DIA-NN 1.8.1 (UK) with the UniProt_Bos taurus (Bovine)_37503_20231123.fasta database to identify the UniProt IDs of each protein. The proteomics data were processed using the Limma package in R 4.3.2 on macOS to identify differentially expressed proteins (DEPs). The p-values were adjusted for multiple testing using the Benjamini–Hochberg method, and DEPs were defined as those with an adjusted p-value < 0.05 and an FC > 1.2 or <0.83. The results were visualized as volcano plots.
The UniProt IDs of all DEPs were then entered into DAVID v2024q4 (https://davidbioinformatics.nih.gov, USA, 13 January 2025) [34] for KEGG pathway enrichment analysis and gene ontology (GO) enrichment analysis, using the Bos taurus (cow) species as a reference. The Z-score for each significantly enriched KEGG pathway was calculated to determine whether the pathway is upregulated or downregulated. The GO enrichment analysis encompassed biological processes (BP), cellular components (CC), and molecular functions (MF).
Additionally, the UniProt IDs of DEPs were input into STRING 12.0 (https://cn.string-db.org, Switzerland, 13 January 2025) [35] to identify protein–protein interactions (PPI) with a Combined_score > 0.4.
The volcano plot and KEGG pathway enrichment plot for DEPs were generated using SRplot, the GO enrichment analysis plot was created using GraphPad Prism 10 (USA), and the PPI network was constructed using Cytoscape 3.10.2 (USA).

3. Results

3.1. Comparative Analysis of Plasma and Milk Biochemical Indicators in HTR and CON Cows

Table 1 and Figure 1 present the differences in plasma biochemical indicators between the HTR and CON cows. It is evident that the HTR and CON cows differed only in plasma T3 levels, with T3 levels being higher in the HTR cows than in CON cows (p < 0.05).
Table 2 details the differences in DHI and biochemical indicators of milk samples between the HTR and CON cows. HTR cows had significantly lower milk protein percentage, crude protein percentage, and true protein percentage, as well as lower levels of αs1-CN, β-CN, κ-CN, and LF in milk compared with CON cows (p < 0.05).

3.2. Metabolomics and Proteomics Profiling of HTR and CON Cows

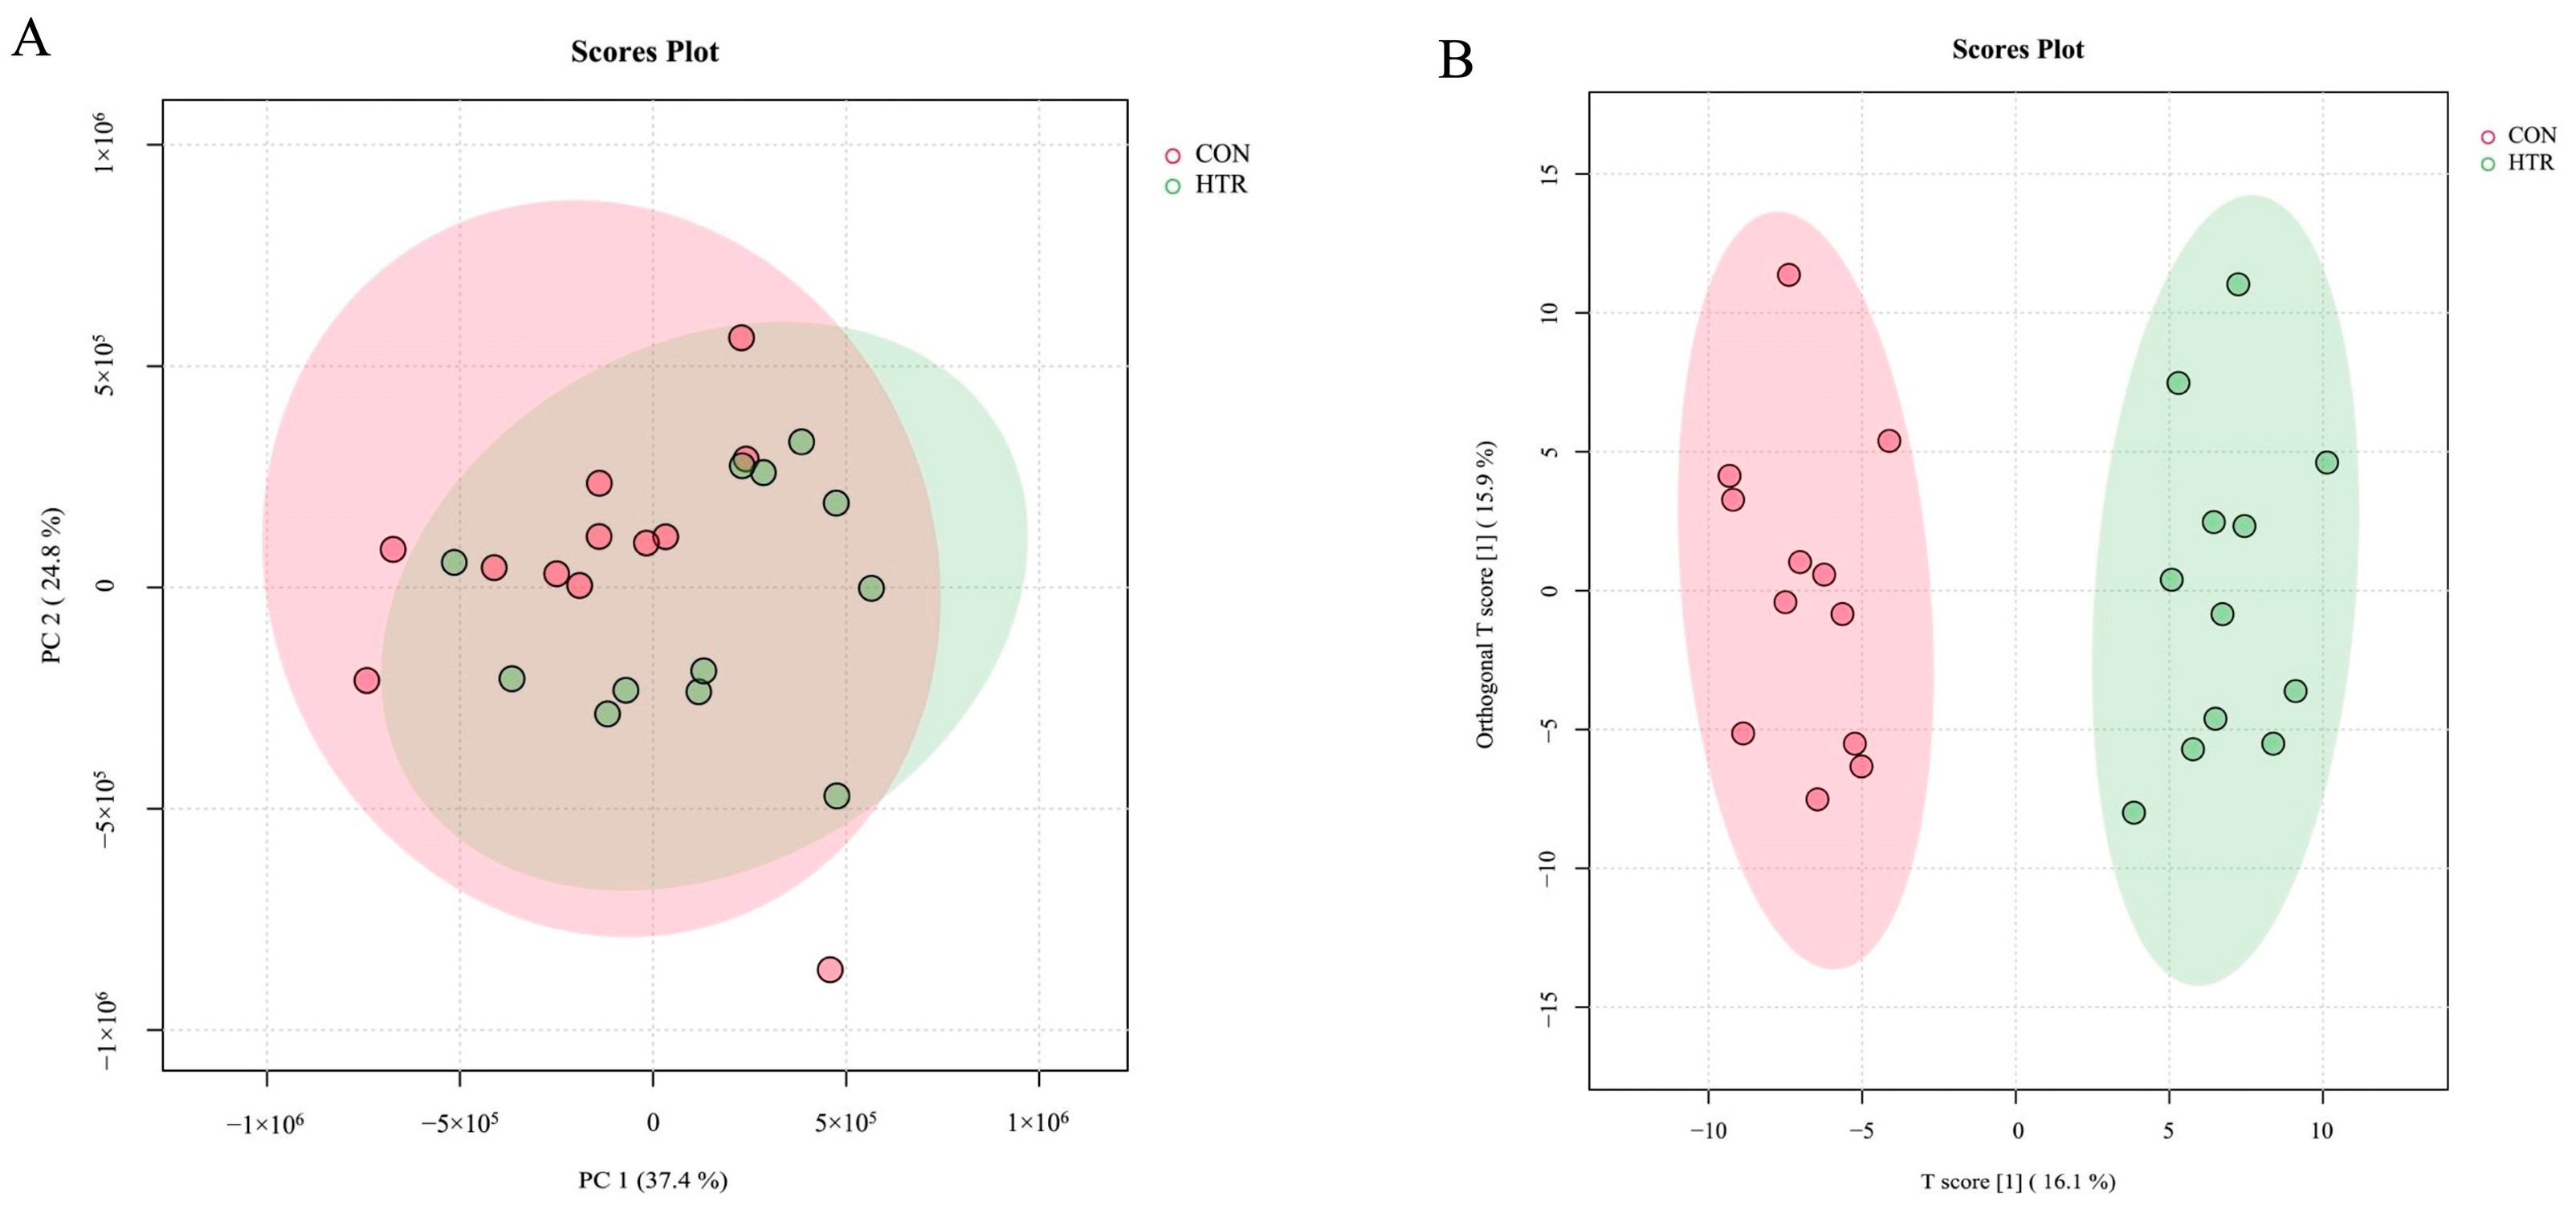
As depicted in Figure A1A. The PCA plot showed partial overlaps between the HTR and CON cows at the metabolomics level, suggesting limited separation. Consequently, we performed OPLS-DA on the metabolomics data (Figure A1B). The OPLS-DA plot demonstrated a complete separation between the HTR and CON cows at the metabolomics level.
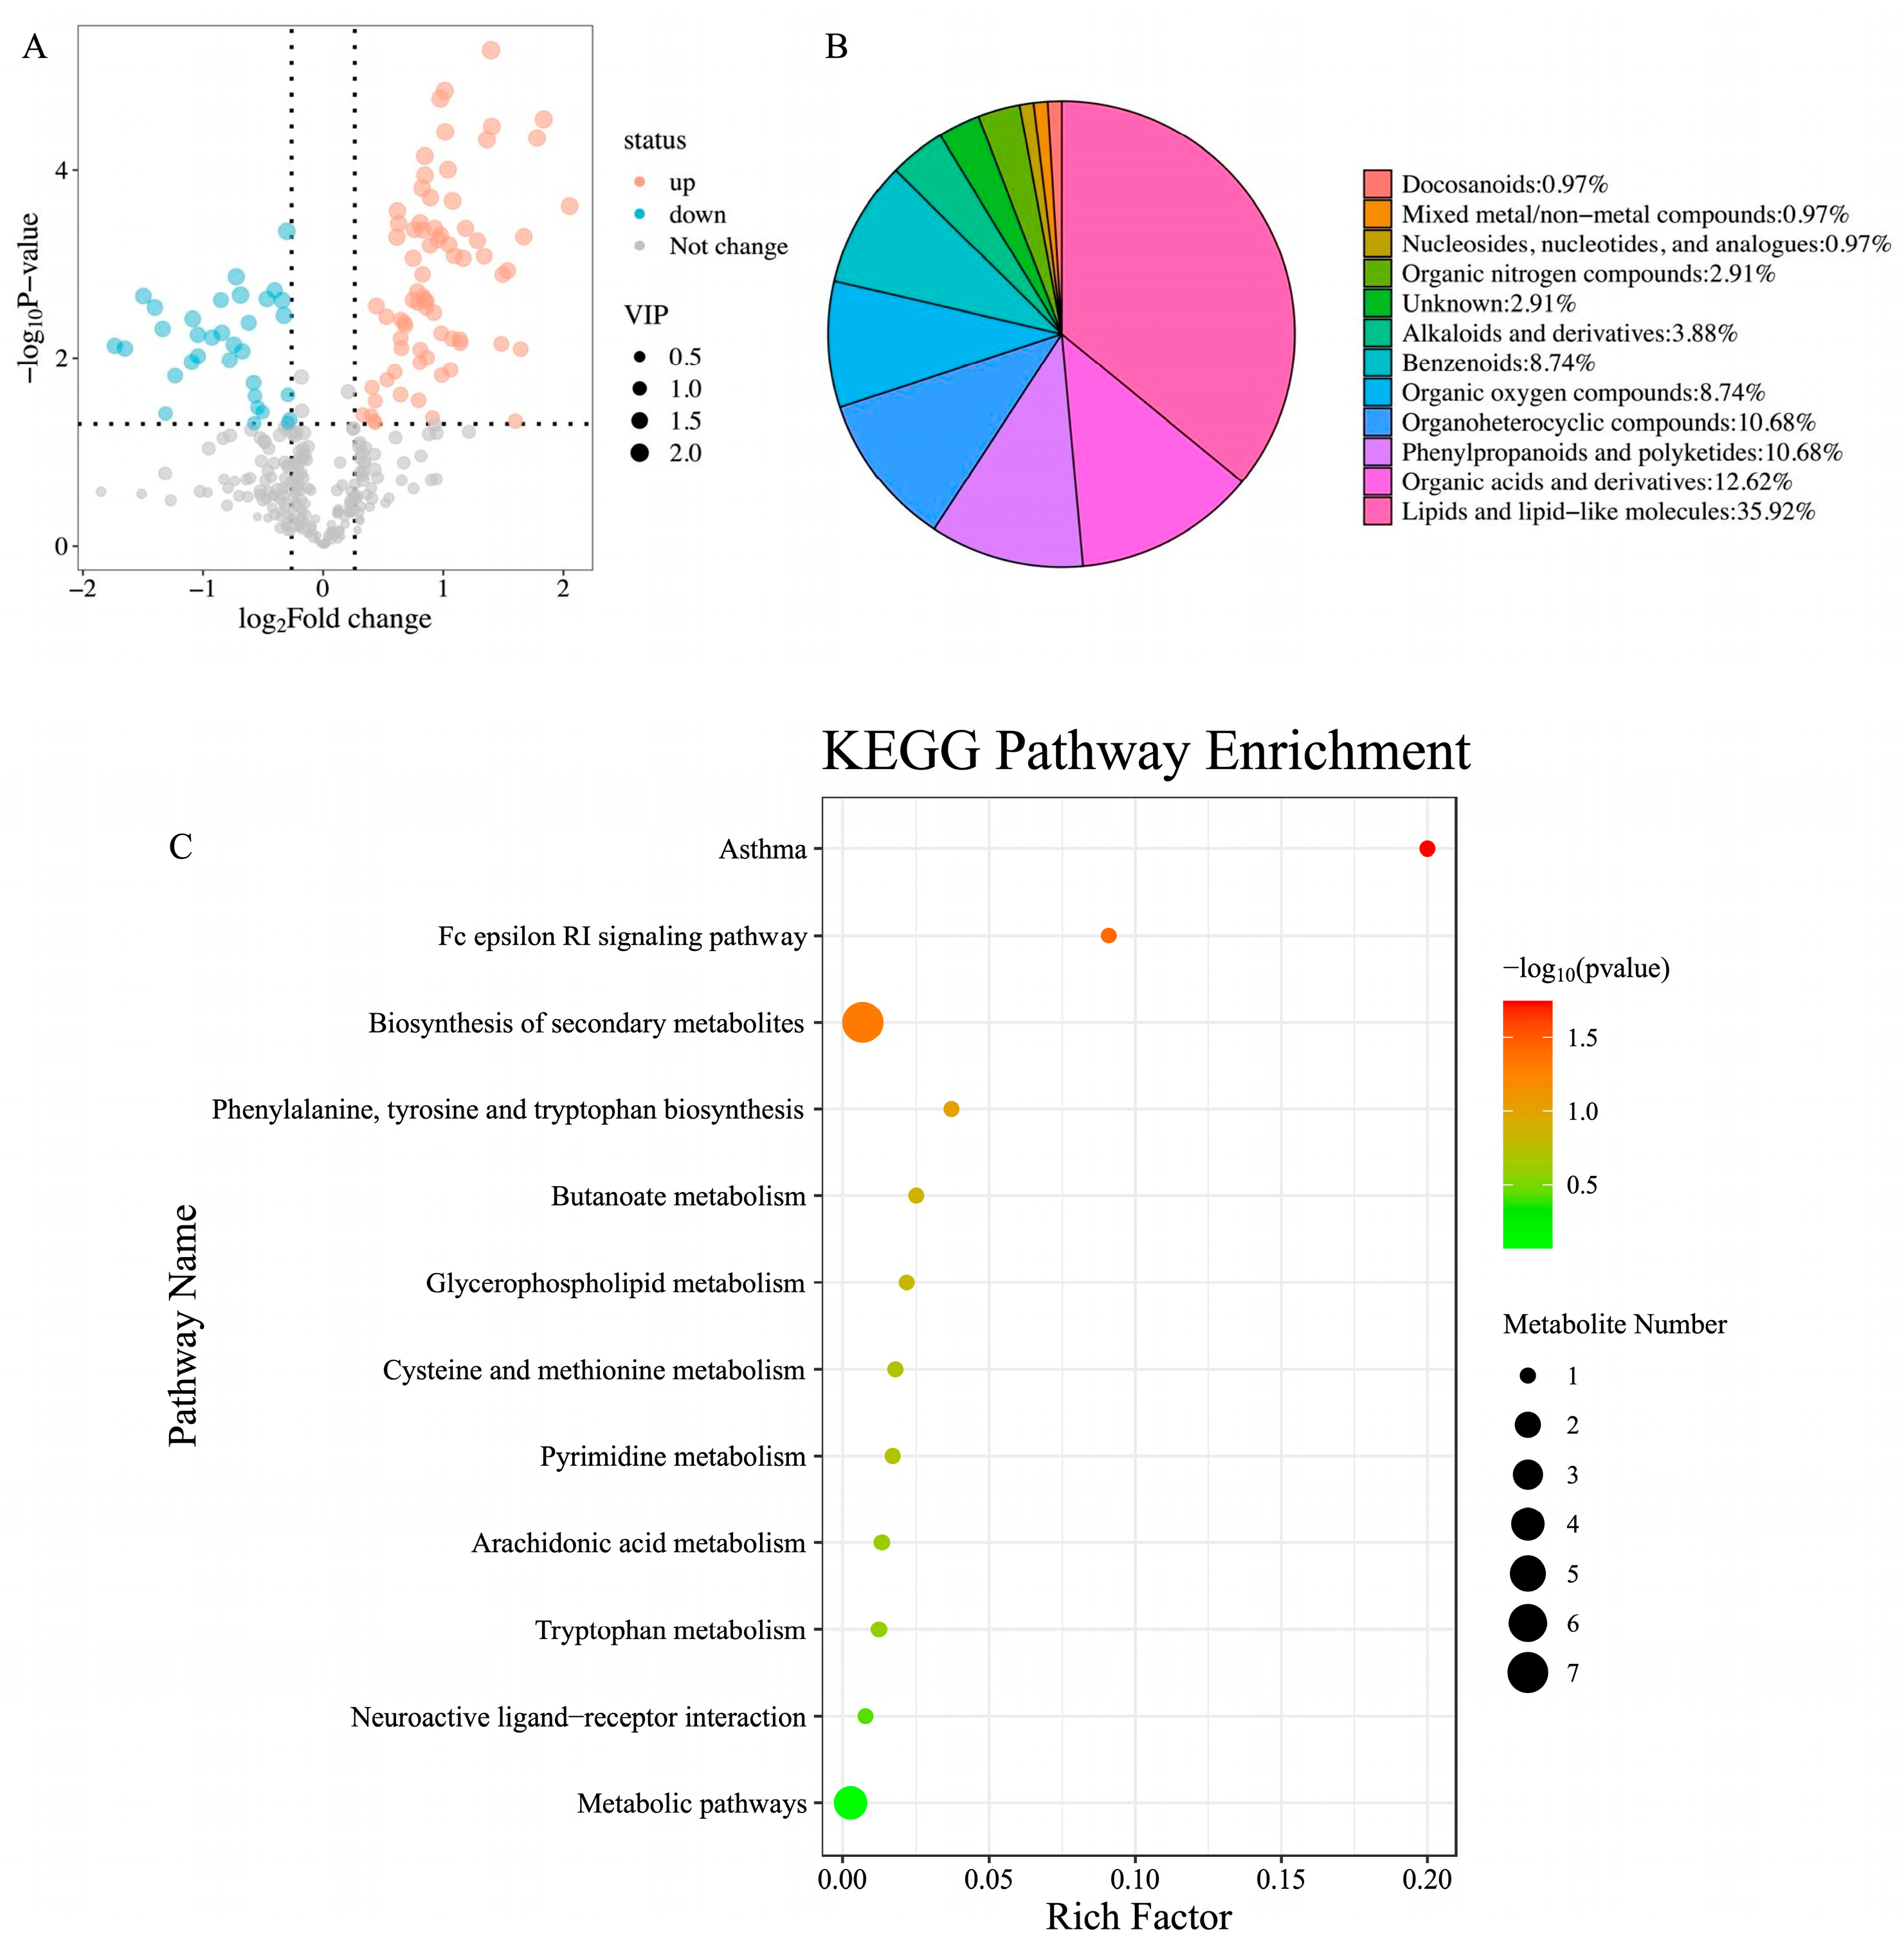
The volcano plot of the metabolomics data revealed 103 differential metabolites (Figure 2A), including 73 upregulated and 30 downregulated metabolites (HTR vs. CON), such as megalomicin C2 (p = 2.41 × 10⁻⁴, FC = 4.147), leukotriene C4 (p = 3.68 × 10⁻⁴, FC = 1.546), 2′,3′-Cyclic UMP (p = 0.007, FC = 0.301). These 103 metabolites were classified into 12 classes at the superclass level (including the unknown group), with 3 metabolites remaining unnamed at this time and therefore belong to the unknown group (Figure 2B). As illustrated in Figure 2B, the “Lipids and lipid-like molecules” class accounted for the largest share at 35.92%, while “Organic acids and derivatives”, “Phenylpropanoids and polyketides”, and “Organoheterocyclic compounds” each accounted for more than 10%.
KEGG enrichment analysis of all differential metabolites revealed three significantly altered metabolic pathways: “Biosynthesis of secondary metabolites” (p = 0.049), “Fc epsilon RI signaling pathway” (p = 0.039), and “Asthma” (p = 0.018), all of which were upregulated in the HTR cows relative to the CON cows (Figure 2C).
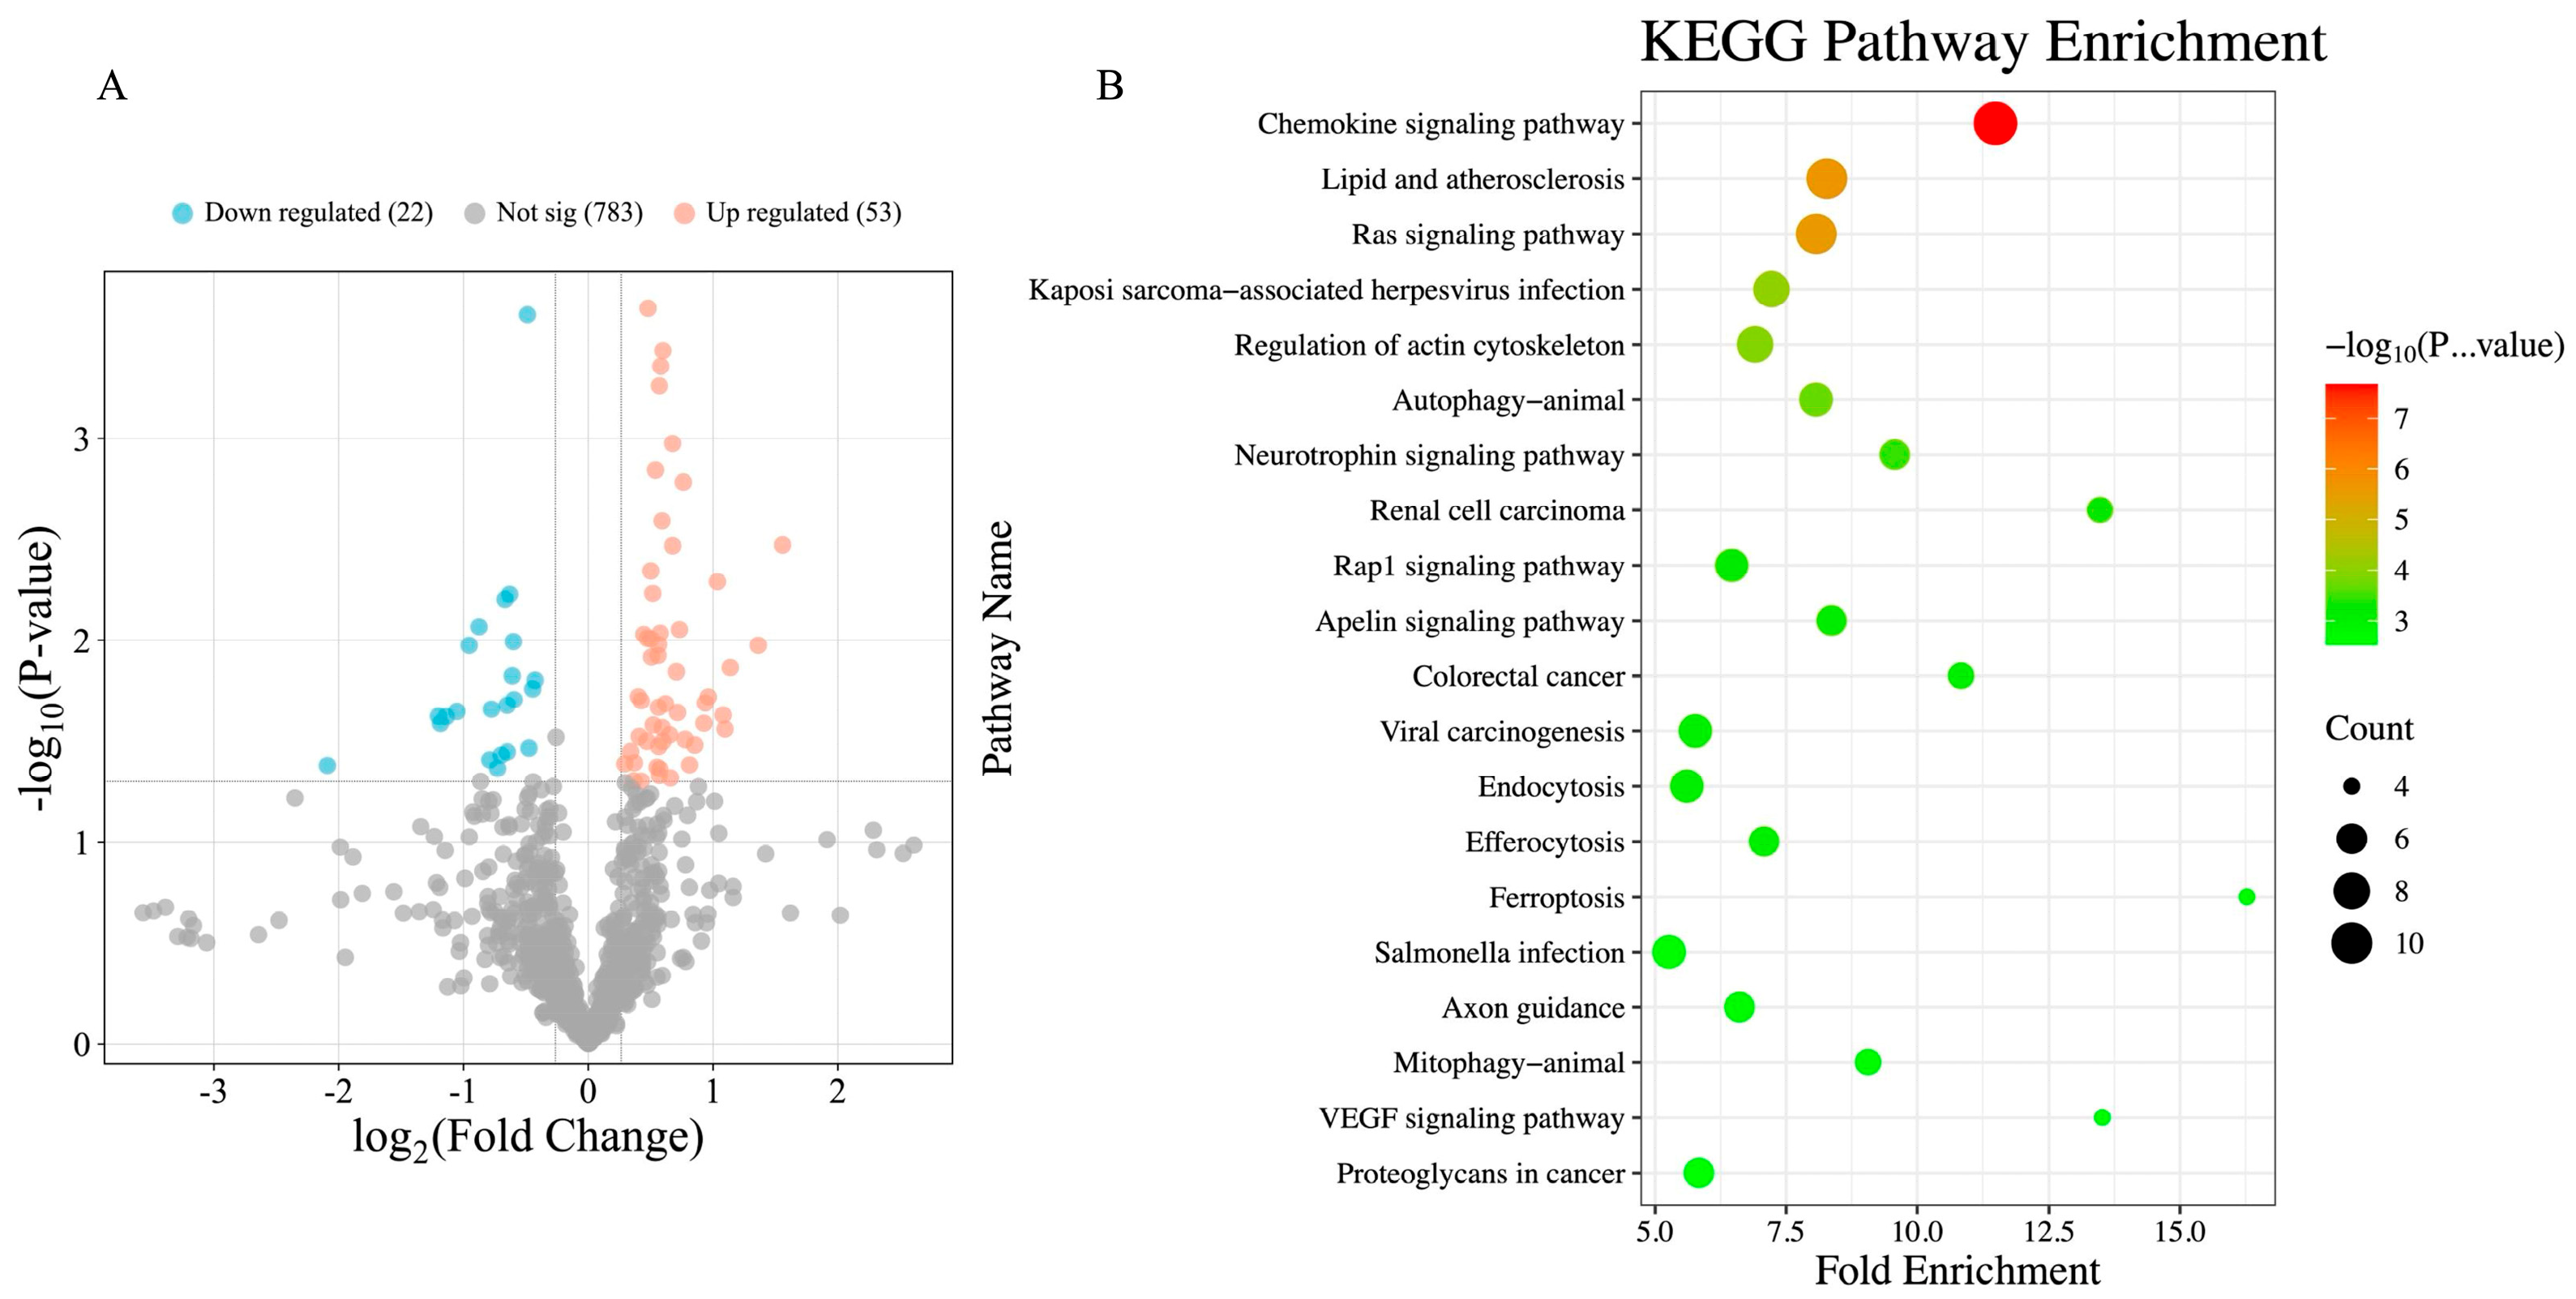
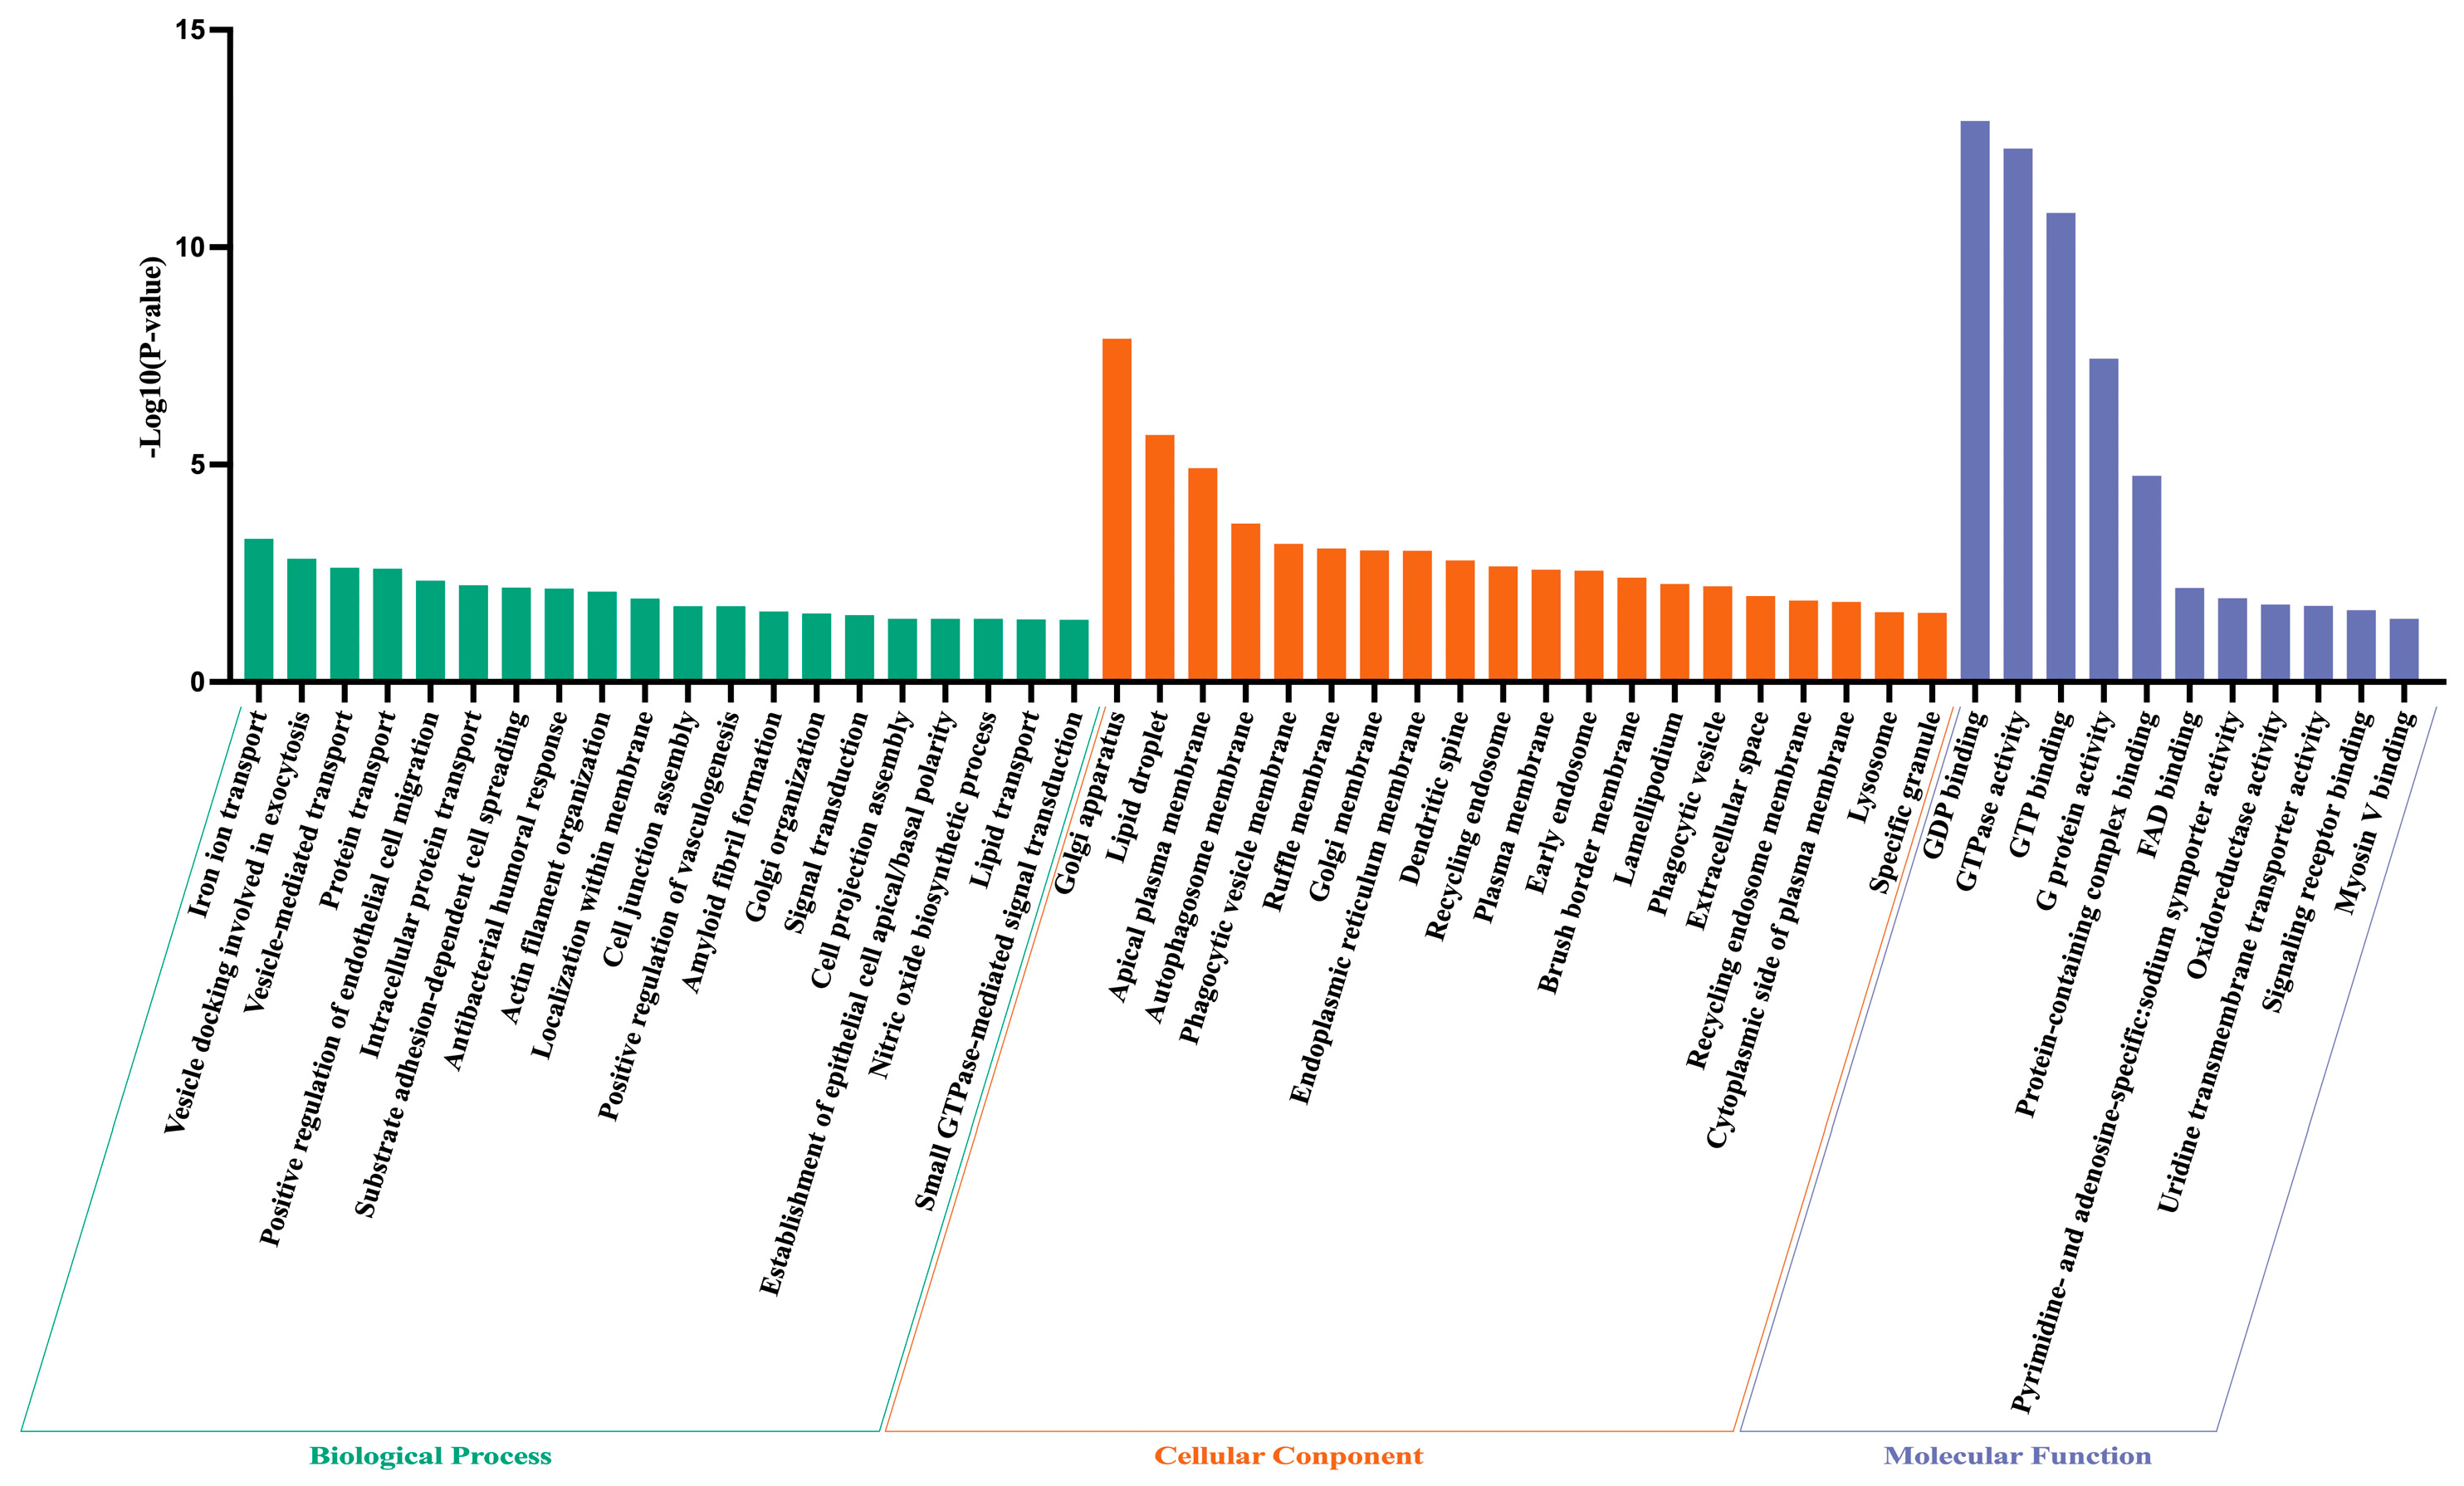
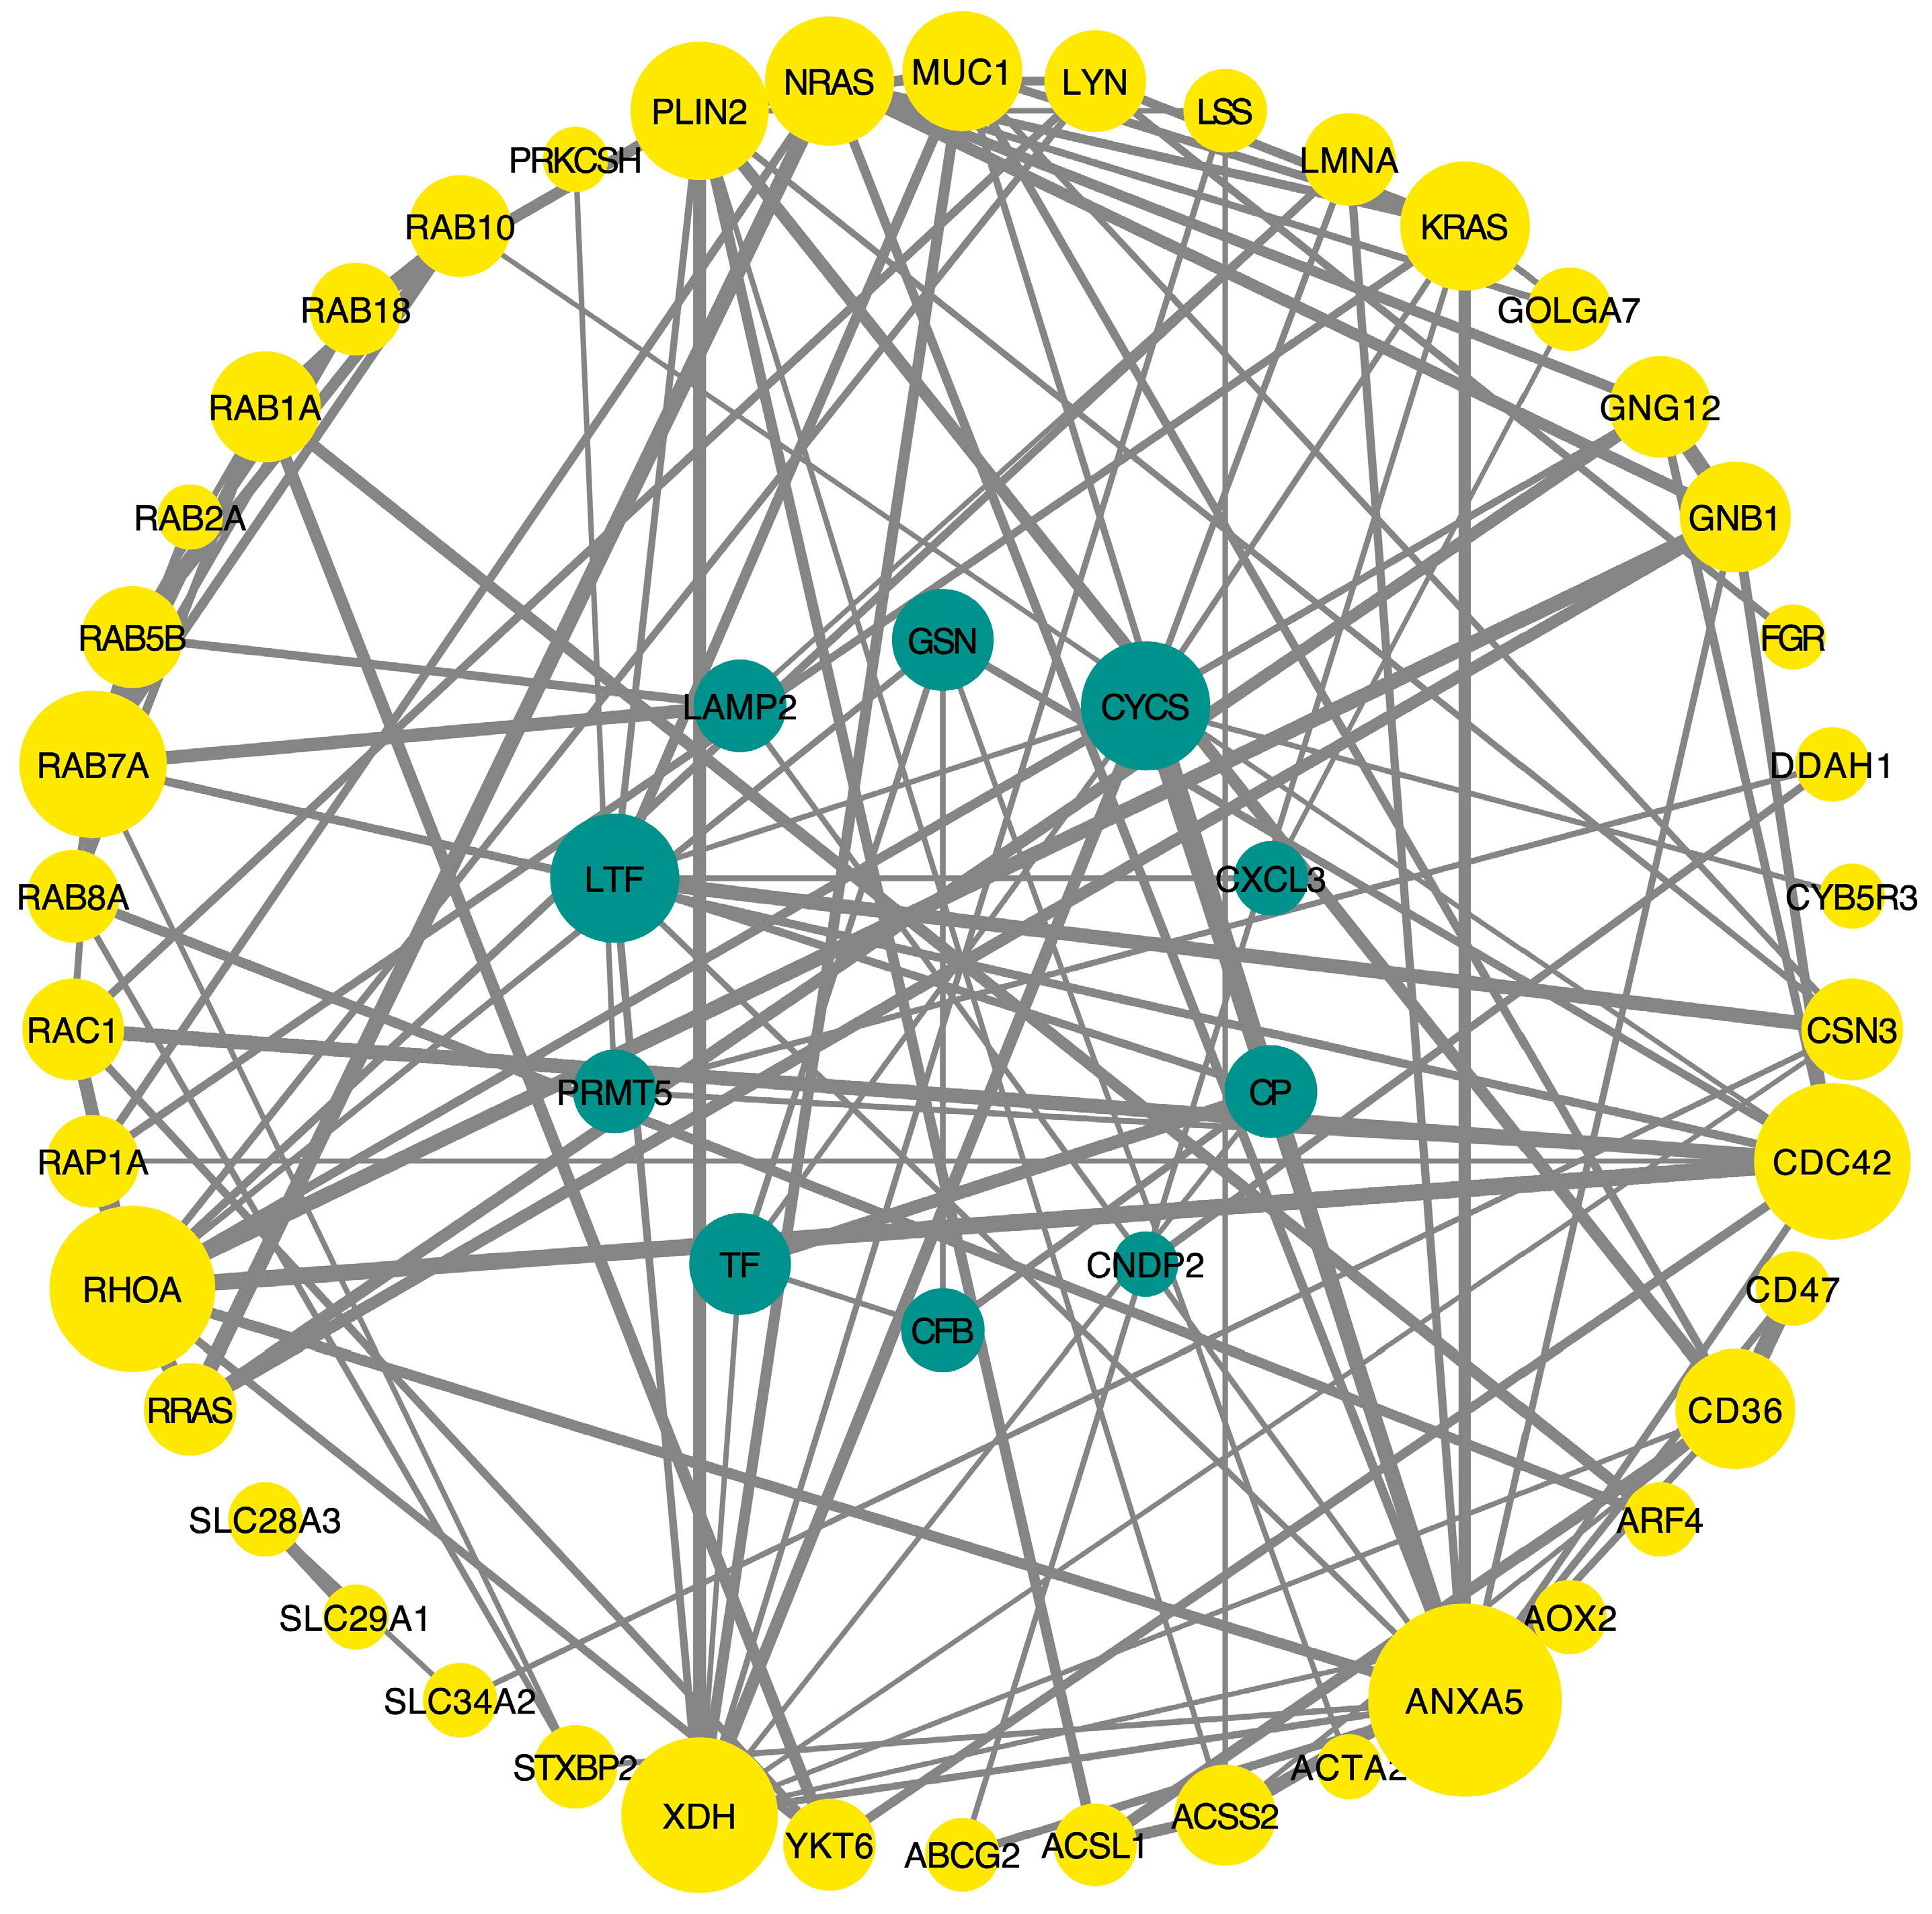
The volcano plot of the proteomics data showed 75 DEPs (Figure 3A), including 53 upregulated DEPs and 22 downregulated DEPs (HTR vs. CON). KEGG enrichment analysis revealed that the 75 DEPs were significantly enriched in 46 KEGG pathways (Figure 3B), among which only Ferroptosis (Z-score = −1) and Mineral absorption (Z-score = −0.58) were significantly downregulated (HTR vs. CON). Figure 3B displays the top 20 KEGG pathways ranked by p-value, whereas Table A2 lists all significantly enriched KEGG pathways. GO enrichment analysis revealed that the BP, CC, and MF categories were significantly enriched in a total of 61 GO terms, with 24, 26, and 11 terms, respectively (Figure 4). For BP and CC, Figure 4 presents the top 20 GO terms ranked by p-value, while Table A3 provides detailed p-values and Fold Enrichment values for all significantly enriched BP, CC, and MF GO terms. The PPI network is depicted in Figure 5, involving 52 proteins and 122 interactions identified. Notably, ANXA5, RHOA, CDC42, XDH, and RAB7A were key nodes in the PPI network, each having more than 10 interactions, primarily involving Ras superfamily-related proteins.

4. Discussion

Based on previous research, we selected HTR cows and initially evaluated the differences in plasma metabolites and milk proteins between HTR cows and CON cows using biochemical tests and omics analyses. As hypothesized, HTR cows showed significant differences in milk proteins compared to those in the CON cows, which will be the focus of future investigations.

4.1. Enhanced Metabolic Activity in HTR Cows: Evidence from Plasma Biochemical Indicators and Milk Proteomics

4.1.1. Variations in Plasma Biochemical Indicators

The metabolic processes within animals are intricate and influenced by various factors, including environment, disease, and diet. Stereotypic behaviors have long been recognized as indicators of poor welfare. Sun et al. [16] proposed that TR behavior might be an outward expression of elevated stress in cows, as indicated by significantly higher serum 5-HT levels in TR cows compared to non-stereotypic cows. DA and 5-HT, common stress indicators, are typically positively correlated with stress levels, reflecting the activity of the locus coeruleus–norepinephrine (LC-NE) axis. Nevertheless, in this study, there were no significant differences in plasma DA and 5-HT levels between HTR and CON cows, suggesting that the stress levels were not significantly different between the two groups.
Plasma levels of T3 and T4 are commonly used indicators of metabolic activity. These thyroid hormones are regulated by the hypothalamic–pituitary–thyroid (HPT) axis, and their circulating levels reflect the integrated activity of this axis [36,37,38]. In this study, plasma T3 levels were significantly higher in HTR cows compared to CON cows, corroborating the findings of Sun et al. [16] and suggesting that TR cows may possess greater metabolic activity than non-stereotypic cows. Additionally, the upregulation of the biosynthesis of the secondary metabolites pathway in HTR cows compared to CON cows suggests that HTR cows exhibit elevated metabolic activity, consistent with plasma biochemistry results, such as higher T3.

4.1.2. Upregulation of GTP-Binding Protein Family Members Indicates Enhanced Cellular Activity in HTR Cows

GO enrichment analysis revealed greater diversity and upregulation of molecular functions related to GDP binding, GTPase activity, and GTP binding in HTR cows, suggesting enhanced cellular metabolic activity. Many of the upregulated proteins belonged to the Ras superfamily of small GTPases, which includes Rab, Rho, Ras, Arf, and Ran families [39,40]. These proteins are essential for intracellular processes such as membrane trafficking, autophagy, cytoskeletal organization, and signal transduction.
Rab1A and Rab1B regulate membrane trafficking between the endoplasmic reticulum and Golgi apparatus [41,42], while Rab2, Rab7, and Rab8 are crucial for autophagosome maturation and autophagosome–lysosome fusion [43,44,45]. Rab10 and Rab18 contribute to ER stability and lipid droplet growth, respectively [46,47,48]. The upregulation of these Rab proteins suggests enhanced intracellular trafficking and autophagic activity in HTR cows. Although no significant differences in circulating stress indicators were observed between groups, these molecular changes may still reflect local cellular adjustments associated with the sustained performance of stereotypic behavior.
KEGG enrichment analysis confirmed upregulation of the Ras signaling pathway in HTR cows. Enriched proteins included CDC42, NRas, and KRas, which regulate proliferation, migration, survival, and cytoskeletal dynamics [49,50]. The activation of the Ras signaling pathway in HTR cows may contribute to enhanced cellular plasticity, which could help buffer physiological fluctuations associated with stereotypic behavior.
PPI network analysis further revealed a strong association between CD36 and CD47. CD36, a fatty acid transporter and metabolic sensor, regulates FA uptake and homeostasis [51,52,53], while CD47 regulates immune responses and tissue homeostasis [54,55]. The co-upregulation of CD36 and CD47 suggests that HTR cows may initiate compensatory metabolic and immunological responses to maintain systemic balance.
Taken together, the molecular profiles of HTR cows indicate coordinated upregulation of metabolic, autophagic, and signaling pathways. Although no significant differences in circulating stress indicators were detected between HTR and control cows, these molecular changes may represent local or cell-level adjustments to altered energy demands and behavioral patterns associated with stereotypic behavior. This suggests that tongue-rolling may not only be a behavioral manifestation but also be underpinned by metabolic and immunological reprogramming at the molecular level.

4.2. Reduced Milk Quality in HTR Cows: Evidence from Milk Biochemical Indicators and Proteomics

In this study, the milk produced by HTR cows had significantly lower protein percentage, crude protein percentage, and true protein percentage compared with CON cows, consistent with our previous findings [8]. Therefore, we further examined the levels of various caseins, α-LA, β-LG, and LF in the milk of HTR and CON cows.
Milk protein is a vital nutrient in cow’s milk, significantly contributing to its nutritional value. The protein content in milk is one of the primary indicators of milk quality. Casein, the predominant protein in cow’s milk, constitutes about 80% of the total milk protein [56] and includes αs1-CN, αs2-CN, β-CN, and κ-CN. The primary role of caseins is to provide nutrients and minerals for the offspring. In addition, caseins supply amino acids and confer immune protection to neonates [57,58]. Caseins are associated with each other and with calcium phosphate in the form of colloidal nanostructures called micelles. Among them, αs1-CN, αs2-CN, and β-CN are involved in calcium binding and associate through weak interactions, being predominantly located in the inner regions of the spherical micelles [59,60]. In contrast, κ-CN interacts with whey proteins and provides steric and electrostatic stabilization, thereby ensuring repulsion between micelles [61]. In our previous research, we observed that high-frequency TR cows had significantly lower percentages of total milk protein, true protein, and crude protein compared to non-stereotypic cows [8]. In this study, the levels of αs1-CN, β-CN, and κ-CN were significantly lower in the HTR cows compared to the CON cows, further suggesting that milk produced by HTR cows may be of lower quality.
LF is a non-haem iron-binding glycoprotein with immune functions [62]. It has a strong iron-binding capacity, which enhances iron absorption and utilization, maintaining iron homeostasis in the body [63,64]. Additionally, LF protects the intestinal tract, modulates anti-inflammatory responses, and promotes intestinal cell growth [65,66]. In this study, we found that the milk LF concentration in HTR cows was significantly lower than in CON cows, further suggesting that milk from HTR cows is of lower quality. Proteomic analysis also supported this observation, as evidenced by reduced levels of lactotransferrin and κ-casein in HTR cows.
Proteomics KEGG enrichment analysis showed that serotransferrin was involved in both significantly downregulated pathways. Serotransferrin, also known as transferrin, not only plays a role in iron transport, absorption, and utilization in the body but also participates in cell growth, differentiation, and antimicrobial activity [67]. Serotransferrin is widely distributed in body tissues and is also present in the bovine mammary gland [68]. In this study, the serotransferrin levels in milk from the HTR cows were significantly lower than those in the CON cows. As mentioned earlier, lactoferrin levels were also significantly lower in the HTR cows compared to the CON cows. These findings suggest that HTR cows may be at risk of iron metabolism disorders, potentially compromising the antimicrobial properties and bioavailability of iron in milk.

4.3. Metabolomics Reveals Impaired Immune Function in HTR Cows

Metabolomics techniques have become integral to animal science research, aiding in the assessment of farm animal production performance and the investigation of disease mechanisms, among other applications. However, their use in the study of stereotypic behaviors has been limited. In this study, we compared metabolomic and proteomic differences between HTR cows and CON cows.
Megalomicin C2, a compound synthesized by Micromonospora megalomicea, exhibits antiparasitic, antiviral, and antimicrobial properties similar to erythromycin [69,70]. It is involved in the biosynthesis of 12-, 14-, and 16-membered macrolides and secondary metabolites (https://www.kegg.jp, 13 January 2025). Our metabolomic analysis revealed that plasma Megalomicin C2 levels were significantly higher in the HTR cows compared to the CON cows. Cyclic nucleotide monophosphates, such as 2’,3’-Cyclic UMP (cUMP), serve as ubiquitous signaling molecules involved in pyrimidine metabolism and broader metabolic pathways. Recent research has identified cUMP as a crucial second messenger in bacterial immunity against viruses [71]. In our study, plasma 2’,3’-cUMP levels were significantly lower in HTR cows than in CON cows. These alterations may indicate perturbations in pathways associated with antiviral defense mechanisms and immune regulation, though further functional studies are required to validate their biological significance.
The upregulation of the Fc epsilon RI signaling and Asthma pathways was linked to significantly higher plasma leukotriene C4 (LTC4) levels in HTR cows compared to CON cows. Arachidonic acid metabolism produces leukotrienes, which play a pivotal role in innate immunity and inflammatory responses [72,73]. LTC4, synthesized from LTA4 via LTC4 synthase, increases vascular permeability and regulates smooth muscle tone [73]. Considering these functional roles, our findings may indicate a potential involvement of inflammatory processes in HTR cows. Nevertheless, since classical indicators of inflammation were not measured, these results should be interpreted with caution, and further studies are warranted.

4.4. Metabolomics and Proteomics Correlation Analysis

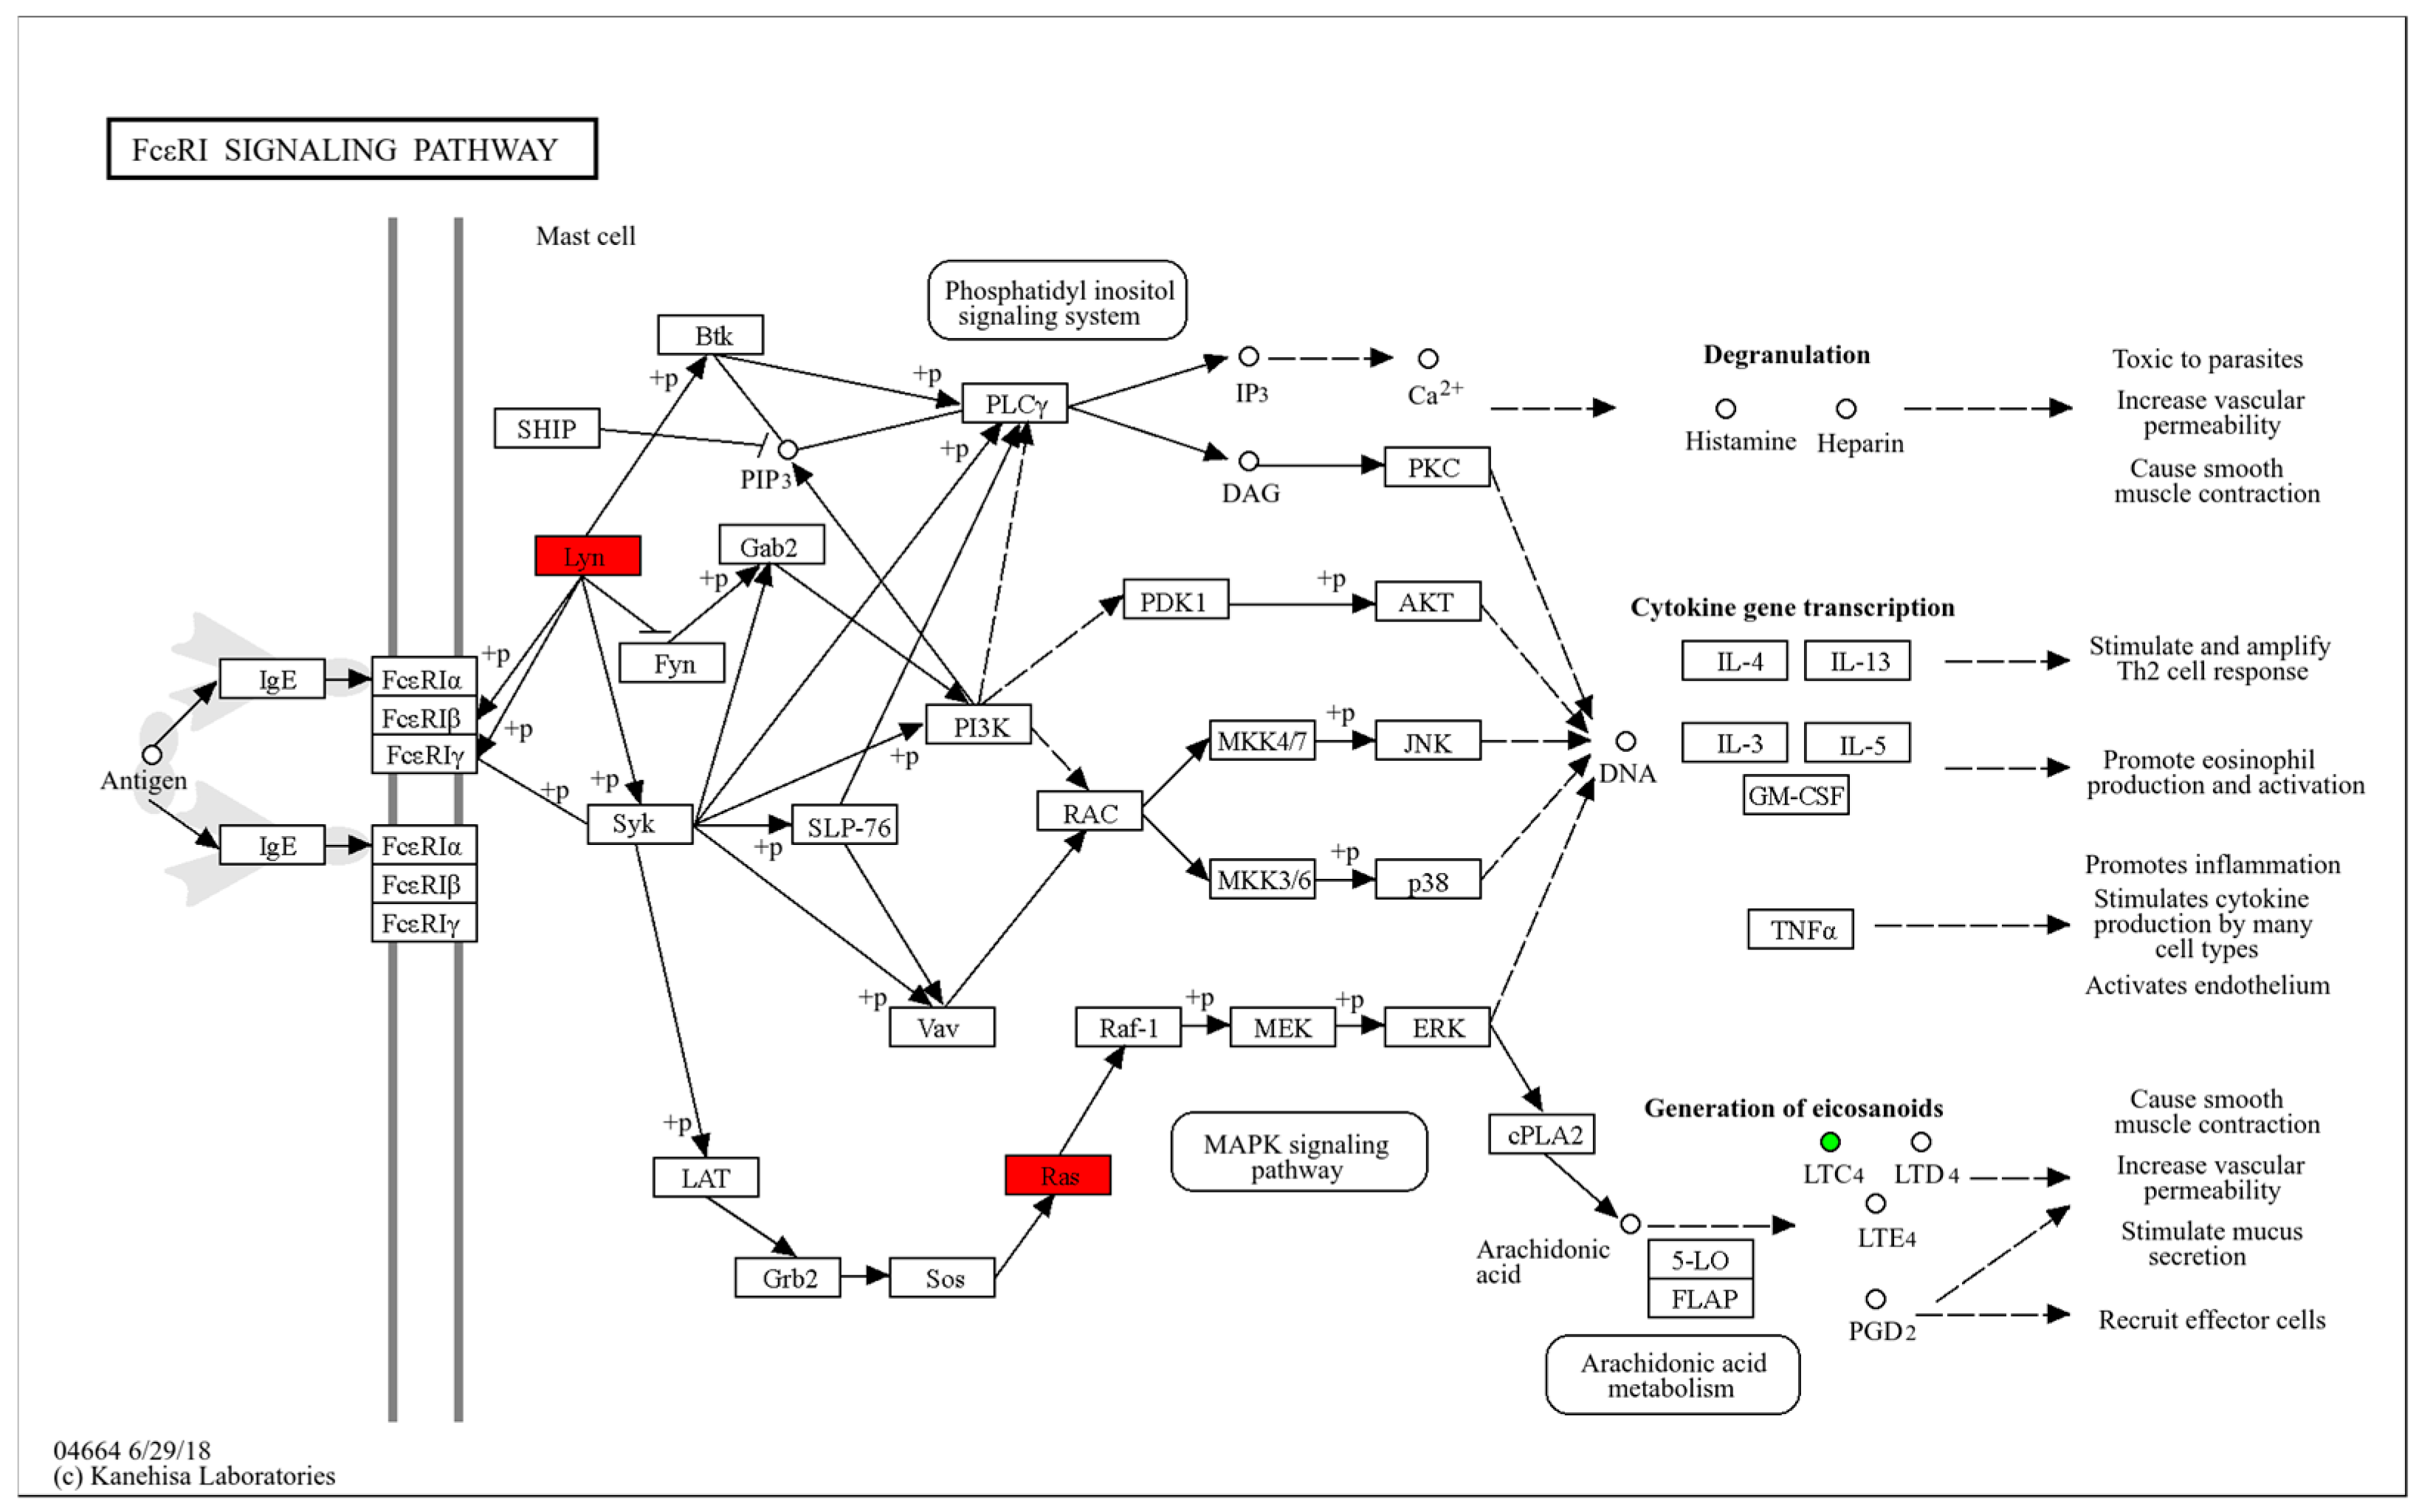
Both metabolomics and proteomics analyses revealed enrichment in the Fc epsilon RI signaling pathway (Figure A2). The Fc epsilon RI complex forms through the interaction of the Fc end of antigen-specific immunoglobulin E (IgE) with a high-affinity receptor on the cell surface [74]. Fc epsilon RI is a unique molecular target that triggers mast cell responses and plays a role in allergic reactions [75,76]. In this study, compared to the CON cows, the HTR cows showed upregulation of Tyrosine-protein kinase, GTPase KRas, GTPase NRas, and LTC4, which are enriched in the Fc epsilon RI signaling pathway, leading to increased vascular permeability, smooth muscle contraction, and stimulated mucus secretion. Thus, the enrichment observed in HTR cows may reflect a potential involvement of this pathway, but the functional consequences remain to be clarified.

5. Conclusions

In conclusion, HTR cows were associated with distinct alterations in both plasma and milk profiles. HTR cows exhibited elevated plasma T3 levels, indicating endocrine activation, while their milk contained reduced concentrations of αs1-CN, β-CN, κ-CN, and LF, suggesting impaired protein synthesis, diminished immune defense capacity, and reduced milk quality. Multi-omics analyses further demonstrated substantial changes in metabolites and proteins, with enrichment of GTP/GDP-binding proteins and activation of the Ras signaling pathway, reflecting increased cellular metabolic activity. Together, these findings provide evidence that tongue-rolling behavior is not merely a stereotypy but may reflect systemic physiological changes that compromise milk quality and cow welfare. Future studies should investigate the causal mechanisms linking metabolic dysregulation to tongue-rolling, with the ultimate goal of developing strategies to mitigate its negative impact on dairy production.

Author Contributions

Conceptualization: C.L., G.Z. and X.G.; Data curation: C.L., X.C. and J.G.; Formal analysis: C.L.; Methodology: C.L., X.C., T.F., J.G., G.Z. and X.G.; Validation: X.C.; Investigation: C.L., X.C., T.F. and J.G.; Visualization: C.L.; Project administration: G.Z. and X.G.; Supervision: X.G.; Funding acquisition: X.G.; Writing—original draft: C.L.; Writing—review and editing: C.L., X.C., T.F., J.G., G.Z. and X.G. All authors have read and agreed to the published version of the manuscript.

Funding

This research was funded by the National Nature Science Foundation of China, grant number 32272926; the Agricultural Science and Technology Innovation Program, grant number ASTIP-IAS07.

Institutional Review Board Statement

All experiments were approved by the Animal Ethics Committee of the Chinese Academy of Agricultural Sciences (Beijing, China, approval number IAS2023-68, approval date 4 April 2023).

Informed Consent Statement

Not applicable.

Data Availability Statement

The data presented in this study are available on request from the corresponding author. The data presented in this study are part of an ongoing large-scale research project. The full dataset will be made publicly available upon the completion of the entire project.

Acknowledgments

The authors thank the staff of Shandong Yinxiang Weiye Group Company.

Conflicts of Interest

The authors declare no conflicts of interest.

Abbreviations

The following abbreviations are used in this manuscript:
5-HT5-hydroxytryptamine
ADRAdrenaline
ALBAlbumin
BCSBody condition score
BPBiological processes
CATCatalase
CCCellular components
CONControl
cUMP2′,3′-cyclic UMP
DADopamine
DEPDifferentially expressed proteins
DHIDairy herd improvement
DIAData-independent acquisition
DIMDays in milk
ELISAEnzyme-linked immunosorbent assay
FCFold change
FFAFree fatty acids
GLUGlucose
GOGene ontology
GSH-PxGlutathione peroxidase
HDLHigh-density lipoprotein
HPTHypothalamic–pituitary–thyroid
HTRHigh-frequency tongue-rolling
IgEImmunoglobulin E
IGF-1Insulin-like growth factor-1
INSInsulin
KEGGKyoto encyclopedia of genes and genomes
LC-MSLiquid chromatography–mass spectrometry
LC-NELocus coeruleus–norepinephrine axis
LDHLactate dehydrogenase
LDLLow-density lipoprotein
LFLactoferrin
LTC4Leukotriene C4
MFMolecular functions
NNOBNon-nutritive oral behavior
NORNorepinephrine
OPLS-DAOrthogonal partial least squares–discriminant analysis
PABAKPrevalence-adjusted bias-adjusted kappa
PCAPrincipal components analysis
PPIProtein–protein interactions
QCQuality control
RHRelative humidity
RIARadioimmunoassay
SODSuperoxide dismutase
T3Triiodothyronine
T4Thyroxine
TaAmbient temperature
T-AOCTotal antioxidant capacity
TCTotal cholesterol
TGTriglycerides
THITemperature–humidity index
TMRTotal mixed ration
TPTotal protein
TRTongue-rolling
UREAUrea nitrogen
VIPVariable importance in the projection
α-LAα-lactalbumin
αs1-CNαs1-casein
αs2-CNαs2-casein
β-CNβ-casein
β-HBβ-hydroxybutyric acid
β-LGβ-lactoglobulin
κ-LGκ-casein

Appendix A

Table A1. Ingredients and nutrient composition of experimental diet (%, DM basis).
ItemsValue
IngredientsContent, %
Alfalfa10.39
Oat hay2.42
Dandelion0.48
Whole corn silage48.33
Cottonseed2.90
Beet pulp2.42
Ground corn7.49
Pressed corn9.42
Soybean meal8.70
Rapeseed meal1.69
DDGS 10.72
Extruded soybean1.33
Mineral and vitamin mix 23.70
Nutrient composition
DM, % of wet TMR62.40
CP17.06
EE3.32
NDF35.75
ADF18.20
NEL/(MJ/kg)6.11
1 DDGS, Distillers Dried Grains with Solubles. 2 Contained the following per kg of diets: VA 170,000 IU, VD 8000 IU, VE 9000 IU, Ca 160 g, Fe 800 mg, Cu 680 mg, Mn 3500 mg, Zn 7500 mg, Se 80 mg, I 400 mg, Co 38 mg.
Table A2. The information on significantly enriched KEGG pathways.
Pathway Namep-ValueFold EnrichmentZ-Score
Chemokine signaling pathway<0.00111.4872.714
Lipid and atherosclerosis<0.0018.2761.897
Ras signaling pathway<0.0018.0753.162
Kaposi sarcoma-associated herpesvirus infection<0.0017.2201.414
Regulation of the actin cytoskeleton<0.0016.9072.121
Autophagy–animal<0.0018.0701.890
Neurotrophin signaling pathway<0.0019.5742.449
Renal cell carcinoma<0.00113.4762.236
Rap1 signaling pathway<0.0016.4642.646
Apelin signaling pathway<0.0018.3682.449
Colorectal cancer0.00110.8402.236
Viral carcinogenesis0.0015.7691.890
Endocytosis0.0015.6072.646
Efferocytosis0.0017.0812.449
Ferroptosis0.00216.282−1.000
Salmonella infection0.0025.2681.890
Axon guidance0.0026.6122.449
Mitophagy–animal0.0029.0662.236
VEGF signaling pathway0.00313.5222.000
Proteoglycans in cancer0.0035.8382.449
MAPK signaling pathway0.0034.6542.646
Relaxin signaling pathway0.0047.5552.236
Fc epsilon RI signaling pathway0.00511.2372.000
Phagosome0.0096.0071.342
Adherens junction0.0118.5782.000
B cell receptor signaling pathway0.0118.4872.000
Tight junction0.0125.5402.236
Fc gamma R-mediated phagocytosis0.0128.1411.000
AGE-RAGE signaling pathway in diabetic complications0.0147.8222.000
Pancreatic secretion0.0147.7462.000
C-type lectin receptor signaling pathway0.0157.5262.000
Pathways in cancer0.0182.8702.121
Cholinergic synapse0.0196.9372.000
Tuberculosis0.0194.7491.342
Leukocyte transendothelial migration0.0206.7612.000
Serotonergic synapse0.0226.5392.000
Sphingolipid signaling pathway0.0236.3822.000
AMPK signaling pathway0.0246.3322.000
T cell receptor signaling pathway0.0256.2332.000
Alcoholism0.0274.2802.236
Apoptosis0.0355.4271.000
Mineral absorption0.0379.651−0.577
Long-term depression0.0389.4981.732
Phospholipase D signaling pathway0.0405.1802.000
PI3K-Akt signaling pathway0.0423.0531.633
Long-term potentiation0.0468.5481.732
Table A3. The p-values and Fold Enrichment values of GO terms.
GO TypeGO Termsp-ValueFold Enrichment
BPIron ion transport<0.00125.228
BPVesicle docking involved in exocytosis0.00151.785
BPVesicle-mediated transport0.0028.816
BPProtein transport0.0026.287
BPPositive regulation of endothelial cell migration0.00528.938
BPIntracellular protein transport0.0066.804
BPSubstrate adhesion-dependent cell spreading0.00723.998
BPAntibacterial humoral response0.00723.426
BPActin filament organization0.0089.506
BPLocalization within membrane0.012163.984
BPCell junction assembly0.018109.323
BPPositive regulation of vasculogenesis0.018109.323
BPAmyloid fibril formation0.02481.992
BPGolgi organization0.02611.713
BPSignal transduction0.0293.422
BPCell projection assembly0.03554.661
BPEstablishment of epithelial cell apical/basal polarity0.03554.661
BPNitric oxide biosynthetic process0.03554.661
BPLipid transport0.0369.839
BPSmall GTPase-mediated signal transduction0.0379.742
BPRegulation of cell shape0.0389.552
BPRac protein signal transduction0.04443.729
BPProtein localization to plasma membrane0.0488.482
BPProtein stabilization0.0488.409
CCGolgi apparatus<0.0017.169
CCLipid droplet<0.00128.476
CCApical plasma membrane<0.00110.200
CCAutophagosome membrane<0.00133.338
CCPhagocytic vesicle membrane<0.00123.167
CCRuffle membrane<0.00121.357
CCGolgi membrane<0.0016.087
CCEndoplasmic reticulum membrane<0.0014.344
CCDendritic spine0.00217.086
CCRecycling endosome0.00215.358
CCPlasma membrane0.0031.669
CCEarly endosome0.0038.458
CCBrush border membrane0.00431.065
CCLamellipodium0.00611.023
CCPhagocytic vesicle0.00625.004
CCExtracellular space0.0112.494
CCRecycling endosome membrane0.01316.806
CCCytoplasmic side of plasma membrane0.01516.018
CCLysosome0.0256.328
CCSpecific granule0.02675.937
CCExtracellular exosome0.02811.265
CCCytoskeleton0.0294.250
CCLate endosome0.03410.150
CCMembrane raft0.0429.072
CCMidbody0.0458.762
CCLate endosome membrane0.0458.762
MFGDP binding<0.00155.349
MFGTPase activity<0.00115.327
MFGTP binding<0.00111.889
MFG protein activity<0.00162.268
MFProtein-containing complex binding<0.00118.280
MFFAD binding0.00723.721
MFPyrimidine- and adenosine-specific: sodium symporter activity0.012166.048
MFOxidoreductase activity0.0177.339
MFUridine transmembrane transporter activity0.018110.698
MFSignaling receptor binding0.0226.576
MFMyosin V binding0.03555.349
BP: biological processes; CC: cellular components; MF: molecular functions.
Figure A1. The PCA and OPLS-DA results of HTR and CON cows. (A) PCA of metabolomics in the HTR and CON cows. Each point represents a sample, with green indicating the HTR cows and red indicating the CON cows. Principal Component 1 accounts for 37.4% of the variance, while Principal Component 2 accounts for 24.8%; (B) OPLS-DA of metabolomics in the HTR cows and CON cows. Each point represents a sample, with green indicating the HTR cows and red indicating the CON cows. The OPLS-DA model was validated using 1000 permutation tests, resulting in a Q2 value of 0.682 and an R2Y value of 0.944.
Dairy 06 00053 g0a1
Figure A2. Fc epsilon RI signaling pathway. Red represents differential proteins, and green represents differential metabolites. Both differential proteins and metabolites are upregulated in the TR group relative to the CON group. The two gray solid lines on the left represent the cell membrane. Black solid lines with arrows indicate direct interactions, while black dashed lines with arrows indicate indirect interactions, representing multiple intermediate steps that have been omitted.
Dairy 06 00053 g0a2

References

  1. Novak, J.; Bailoo, J.D.; Melotti, L.; Rommen, J.; Würbel, H. An Exploration Based Cognitive Bias Test for Mice: Effects of Handling Method and Stereotypic Behaviour. PLoS ONE 2015, 10, e0130718. [Google Scholar] [CrossRef]
  2. Ahola, M.K.; Vapalahti, K.; Lohi, H. Early Weaning Increases Aggression and Stereotypic Behaviour in Cats. Sci. Rep. 2017, 7, 10412. [Google Scholar] [CrossRef]
  3. Ridge, E.E.; Foster, M.J.; Daigle, C.L. Effect of Diet on Non-Nutritive Oral Behavior Performance in Cattle: A Systematic Review. Livest. Sci. 2020, 238, 104063. [Google Scholar] [CrossRef]
  4. Li, C.; Gu, X. Oral Stereotypic Behaviors in Farm Animals and Their Causes. Anim. Res. One Health 2024, 2, 337–351. [Google Scholar] [CrossRef]
  5. Kelly, K.R.; Harrison, M.L.; Size, D.D.; MacDonald, S.E. Individual Effects of Seasonal Changes, Visitor Density, and Concurrent Bear Behavior on Stereotypical Behaviors in Captive Polar Bears (Ursus Maritimus). J. Appl. Anim. Welf. Sci. 2015, 18, 17–31. [Google Scholar] [CrossRef] [PubMed]
  6. Boddicker, N.; Gabler, N.K.; Spurlock, M.E.; Nettleton, D.; Dekkers, J.C.M. Effects of Ad Libitum and Restricted Feed Intake on Growth Performance and Body Composition of Yorkshire Pigs Selected for Reduced Residual Feed Intake. J. Anim. Sci. 2011, 89, 40–51. [Google Scholar] [CrossRef] [PubMed]
  7. Riber, A.B.; Tahamtani, F.M.; Steenfeldt, S. Effects of Qualitative Feed Restriction in Broiler Breeder Pullets on Behaviour in the Home Environment. Appl. Anim. Behav. Sci. 2021, 235, 105225. [Google Scholar] [CrossRef]
  8. Li, C.; Chen, X.; Fang, T.; Gu, X. Do Cows with Stereotypic Tongue-Rolling Behaviour Cope Better with Their Environment? Front. Vet. Sci. 2024, 11, 1404539. [Google Scholar] [CrossRef]
  9. Redbo, I. Relations between Oral Stereotypies, Open-Field Behavior, and Pituitary–Adrenal System in Growing Dairy Cattle. Physiol. Behav. 1998, 64, 273–278. [Google Scholar] [CrossRef]
  10. Robbins, J.A.; McCandless, K.; Weary, D.M.; Paros, M. Breed, Parity, and Days in Milk Affect Risk of Tongue Rolling in Dairy Cows. JDS Commun. 2023, 4, 210–213. [Google Scholar] [CrossRef]
  11. Redbo, I.; Emanuelson, M.; Lundberg, K.; Oredsson, N. Feeding Level and Oral Stereotypies in Dairy Cows. Anim. Sci. 1996, 62, 199–206. [Google Scholar] [CrossRef]
  12. Redbo, I.; Nordblad, A. Stereotypies in Heifers Are Affected by Feeding Regime. Appl. Anim. Behav. Sci. 1997, 53, 193–202. [Google Scholar] [CrossRef]
  13. Lindström, T.; Redbo, I. Effect of Feeding Duration and Rumen Fill on Behaviour in Dairy Cows. Appl. Anim. Behav. Sci. 2000, 70, 83–97. [Google Scholar] [CrossRef]
  14. Downey, B.C.; Tucker, C.B. Early Life Access to Hay Does Not Affect Later Life Oral Behavior in Feed-Restricted Heifers. J. Dairy. Sci. 2023, 106, 5672–5686. [Google Scholar] [CrossRef]
  15. Horvath, K.C.; Miller-Cushon, E.K. Evaluating Effects of Providing Hay on Behavioral Development and Performance of Group-Housed Dairy Calves. J. Dairy Sci. 2019, 102, 10411–10422. [Google Scholar] [CrossRef]
  16. Sun, F.; Zhao, Q.; Chen, X.; Zhao, G.; Gu, X. Physiological Indicators and Production Performance of Dairy Cows With Tongue Rolling Stereotyped Behavior. Front. Vet. Sci. 2022, 9, 840726. [Google Scholar] [CrossRef]
  17. Mahmoud, M.M.; Saeed, H.E.; Abdel-Hamied, E. Clinical, Hemato-Biochemical and Oxidative Stress Biomarkers Alterations in Dairy Heifers with Tongue-Rolling. Egypt. J. Vet. Sci. 2024, 1–8. [Google Scholar] [CrossRef]
  18. Welch, J.G.; Smith, A.M. Forage Quality and Rumination Time in Cattle. J. Dairy Sci. 1970, 53, 797–800. [Google Scholar] [CrossRef]
  19. Castells, L.; Bach, A.; Araujo, G.; Montoro, C.; Terré, M. Effect of Different Forage Sources on Performance and Feeding Behavior of Holstein Calves. J. Dairy Sci. 2012, 95, 286–293. [Google Scholar] [CrossRef]
  20. Devant, M.; Penner, G.B.; Marti, S.; Quintana, B.; Fábregas, F.; Bach, A.; Arís, A. Behavior and Inflammation of the Rumen and Cecum in Holstein Bulls Fed High-Concentrate Diets with Different Concentrate Presentation Forms with or without Straw Supplementation1. J. Anim. Sci. 2016, 94, 3902–3917. [Google Scholar] [CrossRef]
  21. Horvath, K.C.; Miller-Cushon, E.K. The Effect of Milk-Feeding Method and Hay Provision on the Development of Feeding Behavior and Non-Nutritive Oral Behavior of Dairy Calves. J. Dairy Sci. 2017, 100, 3949–3957. [Google Scholar] [CrossRef]
  22. Mirzaei, M.; Khorvash, M.; Ghorbani, G.R.; Kazemi-Bonchenari, M.; Ghaffari, M.H. Growth Performance, Feeding Behavior, and Selected Blood Metabolites of Holstein Dairy Calves Fed Restricted Amounts of Milk: No Interactions between Sources of Finely Ground Grain and Forage Provision. J. Dairy Sci. 2017, 100, 1086–1094. [Google Scholar] [CrossRef]
  23. Fabrile, M.P.; Ghidini, S.; Conter, M.; Varrà, M.O.; Ianieri, A.; Zanardi, E. Filling Gaps in Animal Welfare Assessment through Metabolomics. Front. Vet. Sci. 2023, 10, 1129741. [Google Scholar] [CrossRef]
  24. Liu, B.; Zhao, R.; Wu, T.; Ma, Y.; Gao, Y.; Wu, Y.; Hao, B.; Yin, J.; Li, Y. Transcriptomes Reveal microRNAs and mRNAs in Different Photoperiods Influencing Cashmere Growth in Goat. PLoS ONE 2023, 18, e0282772. [Google Scholar] [CrossRef]
  25. Zeng, M.; Wang, X.; Qiu, Y.; Sun, X.; Qiu, H.; Ma, X.; Lv, Q.; Gao, J.; Wang, C.; Chang, Q. Metabolomic and Systematic Biochemical Analysis of Sheep Infected with Fasciola Hepatica. Vet. Parasitol. 2023, 313, 109852. [Google Scholar] [CrossRef]
  26. Brinker, T.; Bijma, P.; Vereijken, A.; Ellen, E.D. The Genetic Architecture of Socially-Affected Traits: A GWAS for Direct and Indirect Genetic Effects on Survival Time in Laying Hens Showing Cannibalism. Genet. Sel. Evol. 2018, 50, 38. [Google Scholar] [CrossRef]
  27. Wilson, K.; Zanella, R.; Ventura, C.; Johansen, H.L.; Framstad, T.; Janczak, A.; Zanella, A.J.; Neibergs, H.L. Identification of Chromosomal Locations Associated with Tail Biting and Being a Victim of Tail-Biting Behaviour in the Domestic Pig (Sus Scrofa Domesticus). J. Appl. Genet. 2012, 53, 449–456. [Google Scholar] [CrossRef]
  28. Lehner, P.N. Sampling Methods in Behavior Research. Poult. Sci. 1992, 71, 643–649. [Google Scholar] [CrossRef]
  29. Wiśniewski, J.R. Quantitative Evaluation of Filter Aided Sample Preparation (FASP) and Multienzyme Digestion FASP Protocols. Anal. Chem. 2016, 88, 5438–5443. [Google Scholar] [CrossRef]
  30. Pang, Z.; Lu, Y.; Zhou, G.; Hui, F.; Xu, L.; Viau, C.; Spigelman, A.F.; MacDonald, P.E.; Wishart, D.S.; Li, S.; et al. MetaboAnalyst 6.0: Towards a Unified Platform for Metabolomics Data Processing, Analysis and Interpretation. Nucleic Acids Res. 2024, 52, W398–W406. [Google Scholar] [CrossRef]
  31. López-Ibáñez, J.; Pazos, F.; Chagoyen, M. MBROLE 2.0-Functional Enrichment of Chemical Compounds. Nucleic Acids Res. 2016, 44, W201–W204. [Google Scholar] [CrossRef]
  32. Tang, D.; Chen, M.; Huang, X.; Zhang, G.; Zeng, L.; Zhang, G.; Wu, S.; Wang, Y. SRplot: A Free Online Platform for Data Visualization and Graphing. PLoS ONE 2023, 18, e0294236. [Google Scholar] [CrossRef]
  33. Lyu, F.; Han, F.; Ge, C.; Mao, W.; Chen, L.; Hu, H.; Chen, G.; Lang, Q.; Fang, C. OmicStudio: A Composable Bioinformatics Cloud Platform with Real-Time Feedback That Can Generate High-Quality Graphs for Publication. Imeta 2023, 2, e85. [Google Scholar] [CrossRef]
  34. Sherman, B.T.; Hao, M.; Qiu, J.; Jiao, X.; Baseler, M.W.; Lane, H.C.; Imamichi, T.; Chang, W. DAVID: A Web Server for Functional Enrichment Analysis and Functional Annotation of Gene Lists (2021 Update). Nucleic Acids Res. 2022, 50, W216–W221. [Google Scholar] [CrossRef]
  35. Szklarczyk, D.; Kirsch, R.; Koutrouli, M.; Nastou, K.; Mehryary, F.; Hachilif, R.; Gable, A.L.; Fang, T.; Doncheva, N.T.; Pyysalo, S.; et al. The STRING Database in 2023: Protein-Protein Association Networks and Functional Enrichment Analyses for Any Sequenced Genome of Interest. Nucleic Acids Res. 2023, 51, D638–D646. [Google Scholar] [CrossRef]
  36. Busato, A.; Faissler, D.; Küpfer, U.; Blum, J.W. Body Condition Scores in Dairy Cows: Associations with Metabolic and Endocrine Changes in Healthy Dairy Cows. J. Vet. Med. Ser. A 2002, 49, 455–460. [Google Scholar] [CrossRef]
  37. Rowntree, J.E.; Hill, G.M.; Hawkins, D.R.; Link, J.E.; Rincker, M.J.; Bednar, G.W.; Kreft, R.A. Effect of Se on Selenoprotein Activity and Thyroid Hormone Metabolism in Beef and Dairy Cows and Calves. J. Anim. Sci. 2004, 82, 2995–3005. [Google Scholar] [CrossRef]
  38. Mendoza, A.; Hollenberg, A.N. New Insights into Thyroid Hormone Action. Pharmacol. Ther. 2017, 173, 135–145. [Google Scholar] [CrossRef]
  39. Wennerberg, K.; Rossman, K.L.; Der, C.J. The Ras Superfamily at a Glance. J. Cell Sci. 2005, 118, 843–846. [Google Scholar] [CrossRef]
  40. Eckenstaler, R.; Hauke, M.; Benndorf, R.A. A Current Overview of RhoA, RhoB, and RhoC Functions in Vascular Biology and Pathology. Biochem. Pharmacol. 2022, 206, 115321. [Google Scholar] [CrossRef]
  41. Langemeyer, L.; Fröhlich, F.; Ungermann, C. Rab GTPase Function in Endosome and Lysosome Biogenesis. Trends Cell Biol. 2018, 28, 957–970. [Google Scholar] [CrossRef]
  42. Hatoyama, Y.; Homma, Y.; Hiragi, S.; Fukuda, M. Establishment and Analysis of Conditional Rab1- and Rab5-Knockout Cells Using the Auxin-Inducible Degron System. J. Cell Sci. 2021, 134, jcs259184. [Google Scholar] [CrossRef] [PubMed]
  43. Ding, X.; Jiang, X.; Tian, R.; Zhao, P.; Li, L.; Wang, X.; Chen, S.; Zhu, Y.; Mei, M.; Bao, S.; et al. RAB2 Regulates the Formation of Autophagosome and Autolysosome in Mammalian Cells. Autophagy 2019, 15, 1774–1786. [Google Scholar] [CrossRef]
  44. Kuchitsu, Y.; Fukuda, M. Revisiting Rab7 Functions in Mammalian Autophagy: Rab7 Knockout Studies. Cells 2018, 7, 215. [Google Scholar] [CrossRef]
  45. Kern, A.; Dikic, I.; Behl, C. The Integration of Autophagy and Cellular Trafficking Pathways via RAB GAPs. Autophagy 2015, 11, 2393–2397. [Google Scholar] [CrossRef] [PubMed]
  46. English, A.R.; Voeltz, G.K. Rab10 GTPase Regulates ER Dynamics and Morphology. Nat. Cell Biol. 2013, 15, 169–178. [Google Scholar] [CrossRef]
  47. Salloum, S.; Wang, H.; Ferguson, C.; Parton, R.G.; Tai, A.W. Rab18 Binds to Hepatitis C Virus NS5A and Promotes Interaction between Sites of Viral Replication and Lipid Droplets. PLoS Pathog. 2013, 9, e1003513. [Google Scholar] [CrossRef] [PubMed]
  48. Xu, D.; Li, Y.; Wu, L.; Li, Y.; Zhao, D.; Yu, J.; Huang, T.; Ferguson, C.; Parton, R.G.; Yang, H.; et al. Rab18 Promotes Lipid Droplet (LD) Growth by Tethering the ER to LDs through SNARE and NRZ Interactions. J. Cell Biol. 2018, 217, 975–995. [Google Scholar] [CrossRef]
  49. Jansen, S.; Gosens, R.; Wieland, T.; Schmidt, M. Paving the Rho in Cancer Metastasis: Rho GTPases and Beyond. Pharmacol. Ther. 2018, 183, 1–21. [Google Scholar] [CrossRef]
  50. Llavero, F.; Arrazola Sastre, A.; Luque Montoro, M.; Martín, M.A.; Arenas, J.; Lucia, A.; Zugaza, J.L. Small GTPases of the Ras Superfamily and Glycogen Phosphorylase Regulation in T Cells. Small GTPases 2021, 12, 106–113. [Google Scholar] [CrossRef]
  51. Samovski, D.; Sun, J.; Pietka, T.; Gross, R.W.; Eckel, R.H.; Su, X.; Stahl, P.D.; Abumrad, N.A. Regulation of AMPK Activation by CD36 Links Fatty Acid Uptake to β-Oxidation. Diabetes 2015, 64, 353–359. [Google Scholar] [CrossRef]
  52. Zhao, L.; Zhang, C.; Luo, X.; Wang, P.; Zhou, W.; Zhong, S.; Xie, Y.; Jiang, Y.; Yang, P.; Tang, R.; et al. CD36 Palmitoylation Disrupts Free Fatty Acid Metabolism and Promotes Tissue Inflammation in Non-Alcoholic Steatohepatitis. J. Hepatol. 2018, 69, 705–717. [Google Scholar] [CrossRef]
  53. Li, Y.; Huang, X.; Yang, G.; Xu, K.; Yin, Y.; Brecchia, G.; Yin, J. CD36 Favours Fat Sensing and Transport to Govern Lipid Metabolism. Prog. Lipid Res. 2022, 88, 101193. [Google Scholar] [CrossRef]
  54. Logtenberg, M.E.W.; Scheeren, F.A.; Schumacher, T.N. The CD47-SIRPα Immune Checkpoint. Immunity 2020, 52, 742–752. [Google Scholar] [CrossRef] [PubMed]
  55. Tanase, C.; Enciu, A.M.; Codrici, E.; Popescu, I.D.; Dudau, M.; Dobri, A.M.; Pop, S.; Mihai, S.; Gheorghișan-Gălățeanu, A.-A.; Hinescu, M.E. Fatty Acids, CD36, Thrombospondin-1, and CD47 in Glioblastoma: Together and/or Separately? Int. J. Mol. Sci. 2022, 23, 604. [Google Scholar] [CrossRef]
  56. Zhao, L.L.; Wang, X.L.; Tian, Q.; Mao, X.Y. Effect of Casein to Whey Protein Ratios on the Protein Interactions and Coagulation Properties of Low-Fat Yogurt. J. Dairy Sci. 2016, 99, 7768–7775. [Google Scholar] [CrossRef] [PubMed]
  57. Runthala, A.; Mbye, M.; Ayyash, M.; Xu, Y.; Kamal-Eldin, A. Caseins: Versatility of Their Micellar Organization in Relation to the Functional and Nutritional Properties of Milk. Molecules 2023, 28, 2023. [Google Scholar] [CrossRef]
  58. Roy, D.; Ye, A.; Moughan, P.J.; Singh, H. Composition, Structure, and Digestive Dynamics of Milk From Different Species—A Review. Front. Nutr. 2020, 7, 577759. [Google Scholar] [CrossRef]
  59. De Kruif, C.G.; Huppertz, T.; Urban, V.S.; Petukhov, A.V. Casein Micelles and Their Internal Structure. Adv. Colloid Interface Sci. 2012, 171–172, 36–52. [Google Scholar] [CrossRef] [PubMed]
  60. Dalgleish, D.G.; Corredig, M. The Structure of the Casein Micelle of Milk and Its Changes During Processing. Annu. Rev. Food Sci. Technol. 2012, 3, 449–467. [Google Scholar] [CrossRef]
  61. De Kruif, C.G.; Zhulina, E.B. κ-Casein as a Polyelectrolyte Brush on the Surface of Casein Micelles. Colloids Surf. A Physicochem. Eng. Asp. 1996, 117, 151–159. [Google Scholar] [CrossRef]
  62. Ragland, S.A.; Criss, A.K. From Bacterial Killing to Immune Modulation: Recent Insights into the Functions of Lysozyme. PLoS Pathog. 2017, 13, e1006512. [Google Scholar] [CrossRef]
  63. Bonaccorsi Di Patti, M.C.; Cutone, A.; Polticelli, F.; Rosa, L.; Lepanto, M.S.; Valenti, P.; Musci, G. The Ferroportin-Ceruloplasmin System and the Mammalian Iron Homeostasis Machine: Regulatory Pathways and the Role of Lactoferrin. Biometals 2018, 31, 399–414. [Google Scholar] [CrossRef]
  64. Cutone, A.; Lepanto, M.S.; Rosa, L.; Scotti, M.J.; Rossi, A.; Ranucci, S.; De Fino, I.; Bragonzi, A.; Valenti, P.; Musci, G.; et al. Aerosolized Bovine Lactoferrin Counteracts Infection, Inflammation and Iron Dysbalance in A Cystic Fibrosis Mouse Model of Pseudomonas Aeruginosa Chronic Lung Infection. Int. J. Mol. Sci. 2019, 20, 2128. [Google Scholar] [CrossRef]
  65. Vega-Bautista, A.; de la Garza, M.; Carrero, J.C.; Campos-Rodríguez, R.; Godínez-Victoria, M.; Drago-Serrano, M.E. The Impact of Lactoferrin on the Growth of Intestinal Inhabitant Bacteria. Int. J. Mol. Sci. 2019, 20, 4707. [Google Scholar] [CrossRef]
  66. Fan, L.L.; Yao, Q.Q.; Wu, H.M.; Wen, F.; Wang, J.Q.; Li, H.Y.; Zheng, N. Protective Effects of Recombinant Lactoferrin with Different Iron Saturations on Enteritis Injury in Young Mice. J. Dairy. Sci. 2022, 105, 4791–4803. [Google Scholar] [CrossRef]
  67. Bartnikas, T.B. Known and Potential Roles of Transferrin in Iron Biology. Biometals 2012, 25, 677–686. [Google Scholar] [CrossRef]
  68. Wattez, J.S.; Delmont, A.; Bouvet, M.; Beseme, O.; Goers, S.; Delahaye, F.; Laborie, C.; Lesage, J.; Foligné, B.; Breton, C.; et al. Maternal Perinatal Undernutrition Modifies Lactose and Serotranferrin in Milk: Relevance to the Programming of Metabolic Diseases? Am. J. Physiol. Endocrinol. Metab. 2015, 308, E393–E401. [Google Scholar] [CrossRef] [PubMed]
  69. Bonay, P.; Durán-Chica, I.; Fresno, M.; Alarcón, B.; Alcina, A. Antiparasitic Effects of the Intra-Golgi Transport Inhibitor Megalomicin. Antimicrob. Agents Chemother. 1998, 42, 2668–2673. [Google Scholar] [CrossRef] [PubMed]
  70. Volchegursky, Y.; Hu, Z.; Katz, L.; McDaniel, R. Biosynthesis of the Anti-Parasitic Agent Megalomicin: Transformation of Erythromycin to Megalomicin in Saccharopolyspora Erythraea. Mol. Microbiol. 2000, 37, 752–762. [Google Scholar] [CrossRef] [PubMed]
  71. Tal, N.; Morehouse, B.R.; Millman, A.; Stokar-Avihail, A.; Avraham, C.; Fedorenko, T.; Yirmiya, E.; Herbst, E.; Brandis, A.; Mehlman, T.; et al. Cyclic CMP and Cyclic UMP Mediate Bacterial Immunity against Phages. Cell 2021, 184, 5728–5739.e16. [Google Scholar] [CrossRef]
  72. Harizi, H.; Gualde, N. The Impact of Eicosanoids on the Crosstalk between Innate and Adaptive Immunity: The Key Roles of Dendritic Cells. Tissue Antigens 2005, 65, 507–514. [Google Scholar] [CrossRef] [PubMed]
  73. Rinaldo-Matthis, A.; Haeggström, J.Z. Structures and Mechanisms of Enzymes in the Leukotriene Cascade. Biochimie 2010, 92, 676–681. [Google Scholar] [CrossRef] [PubMed]
  74. Turner, H.; Kinet, J.-P. Signalling through the High-Affinity IgE Receptor FcεRI. Nature 1999, 402, 24–30. [Google Scholar] [CrossRef] [PubMed]
  75. Oettgen, H.C.; Burton, O.T. IgE Receptor Signaling in Food Allergy Pathogenesis. Curr. Opin. Immunol. 2015, 36, 109–114. [Google Scholar] [CrossRef]
  76. Nagata, Y.; Suzuki, R. FcεRI: A Master Regulator of Mast Cell Functions. Cells 2022, 11, 622. [Google Scholar] [CrossRef]
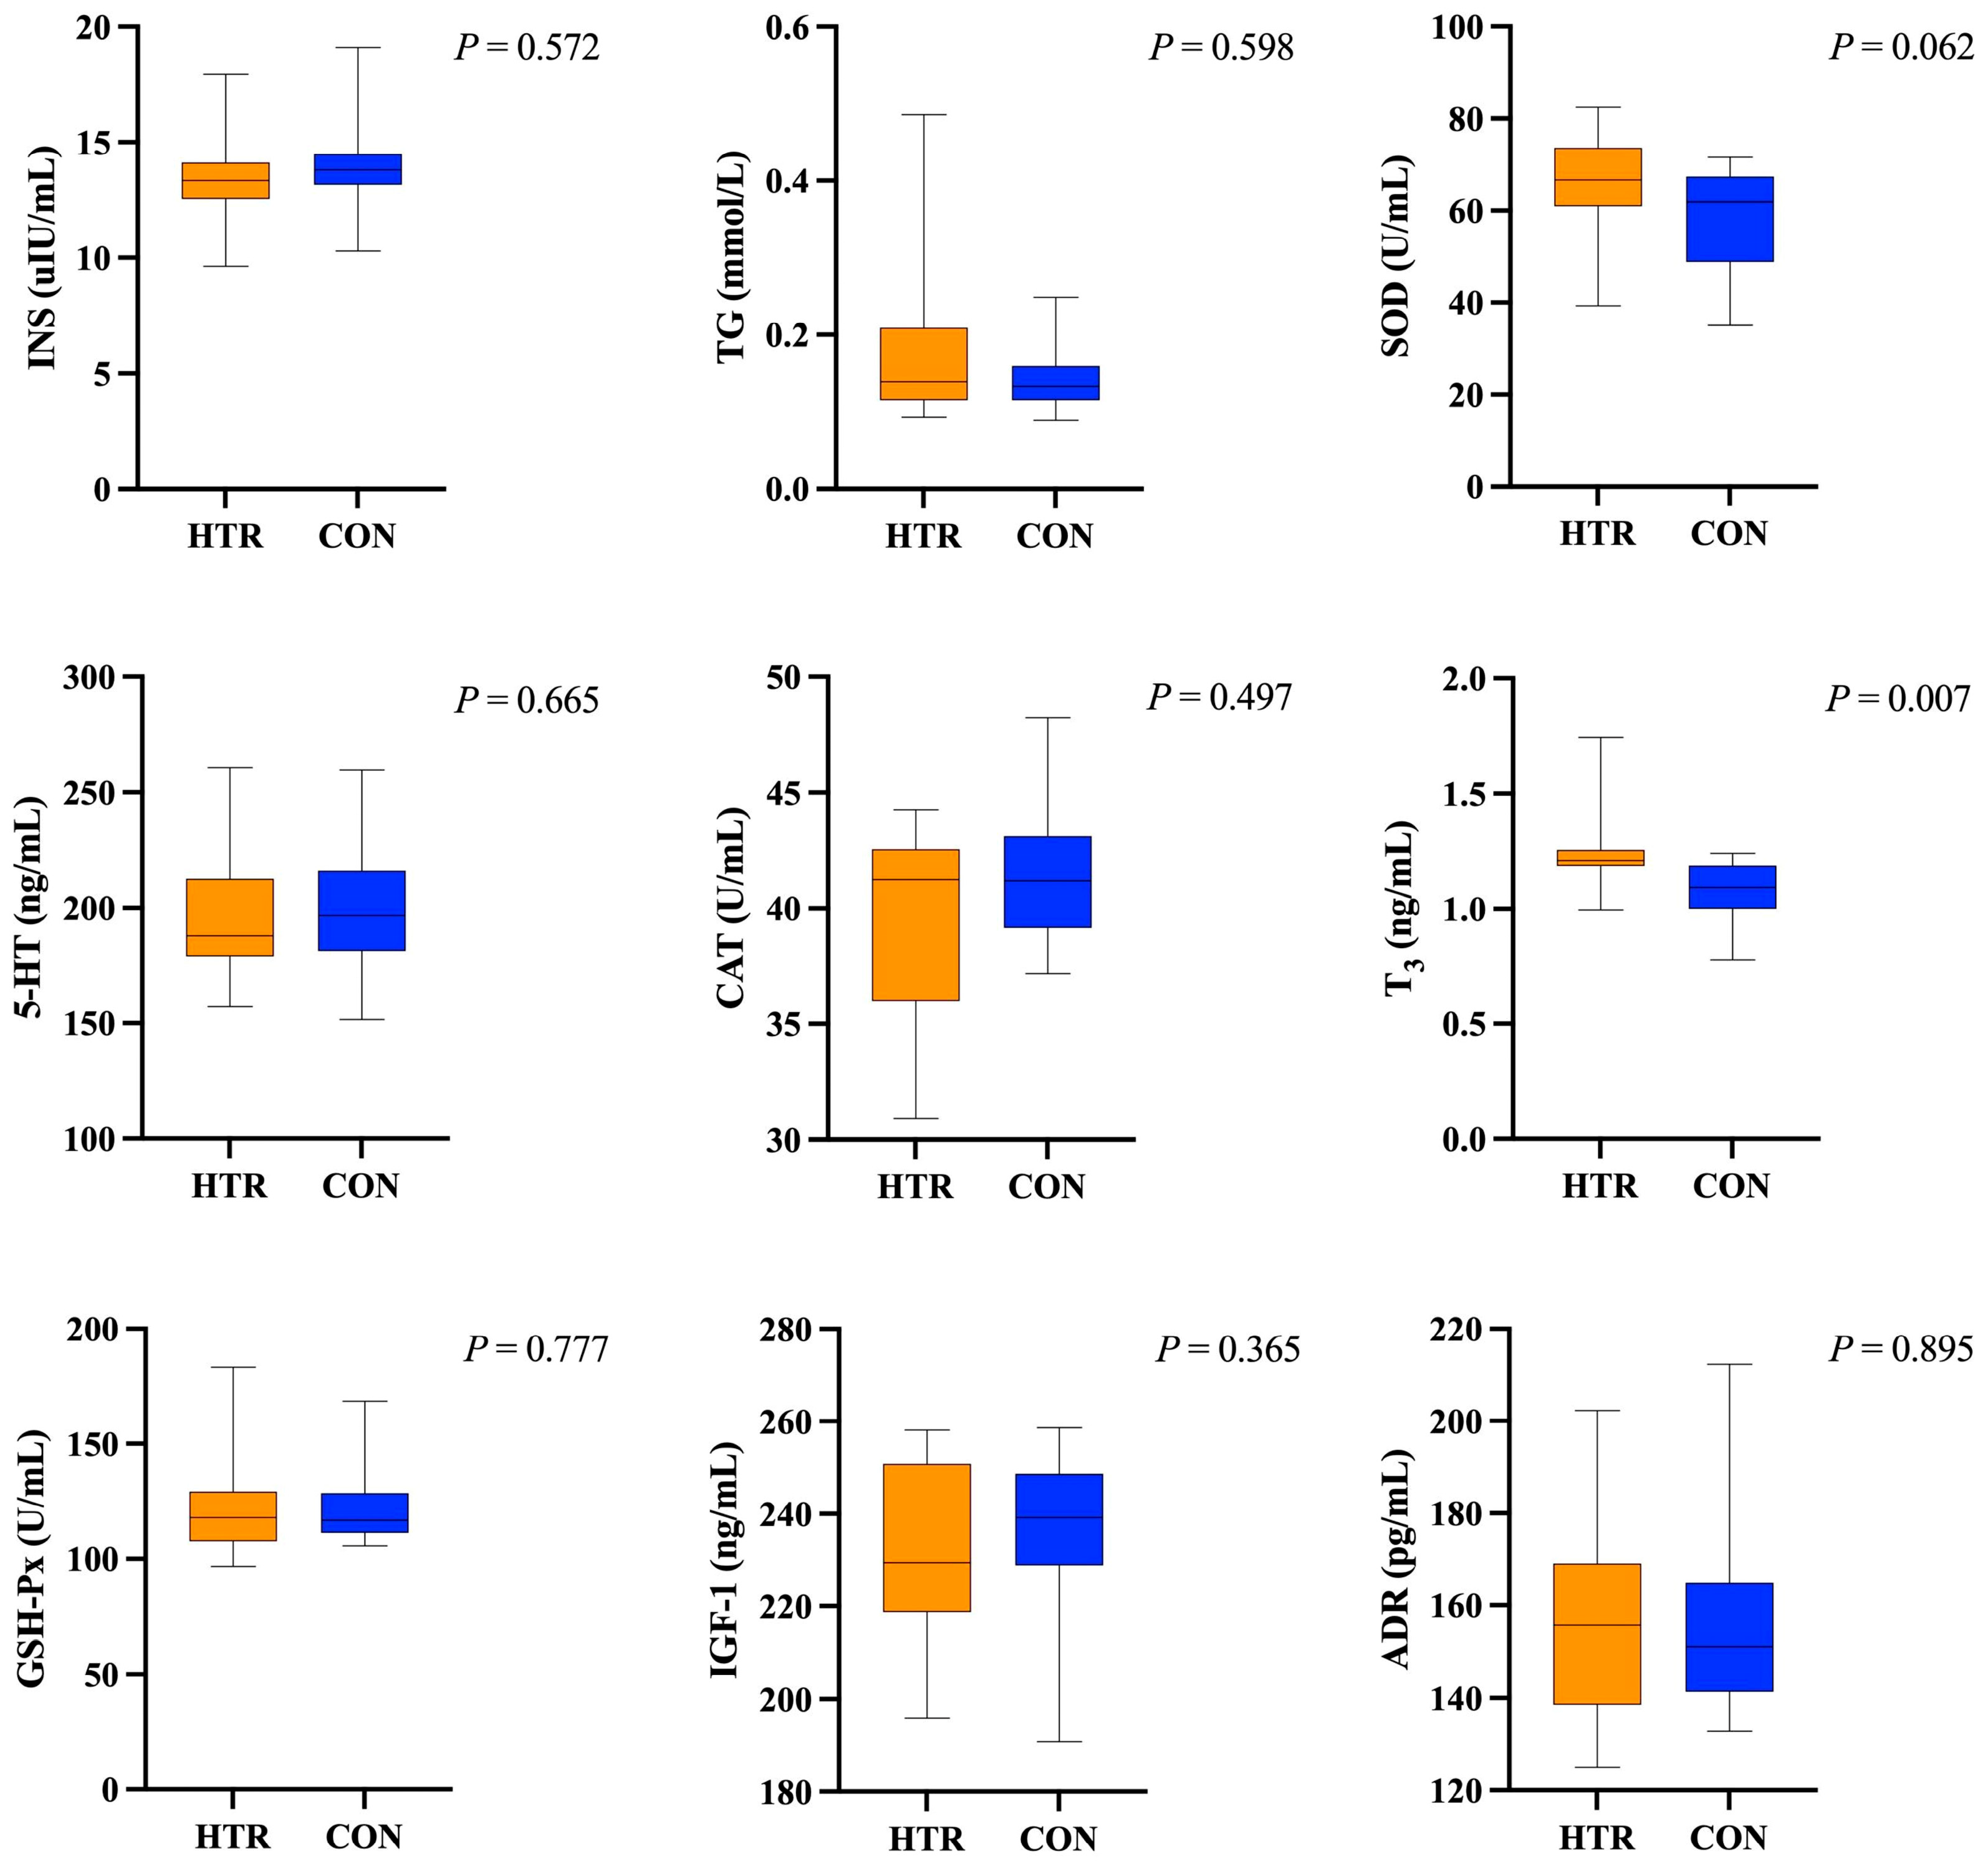
Figure 1. Differences in non-normally distributed plasma biochemical indicators in HTR and CON. INS: insulin; TG: triglycerides; SOD: superoxide dismutase; 5-HT: 5-hydroxytryptamine; CAT: catalase; T3: triiodothyronine; GSH-Px: glutathione peroxidase; IGF-1: insulin-like growth factor-1; ADR: adrenaline. HTR: The group of cows with high-frequency tongue-rolling behavior. CON: The group of cows without stereotypic behaviors.
Dairy 06 00053 g001
Figure 2. Differences in metabolomics results of HTR and CON cows. (A) Volcano plot of differential metabolites between the HTR cows and CON cows. Each point represents a metabolite, with red indicating the metabolites upregulated in the HTR cows relative to the CON cows, blue indicating the metabolites downregulated in the HTR group relative to the CON group, and grey indicating non-significant differences. The size of each point reflects the metabolite’s VIP value; (B) Classification of all differential metabolites between the HTR and CON groups; (C) KEGG enrichment analysis of differential metabolites between the HTR and CON groups. Each point represents a metabolic pathway, with the color of the point indicating the pathway’s −log10p-value. The redder the color, the smaller the p-value; the greener the color, the larger the p-value. The size of the point represents the number of metabolites enriched in the pathway.
Dairy 06 00053 g002
Figure 3. Differences in proteomics results of HTR and CON cows. (A) Volcano plot of differential proteins between the HTR cows and CON cows. The x-axis represents log2(fold change), and the y-axis represents −log10p-value. Each point represents a protein, with red indicating the proteins upregulated in the HTR cows relative to the CON cows, blue indicating the proteins downregulated in the HTR cows relative to the CON cows, and grey indicating non-significant differences in HTR cows relative to CON cows; (B) KEGG enrichment analysis of differential proteins between the HTR cows and CON cows. Only the top 20 KEGG pathways ranked by p-value are shown. The x-axis represents Fold Enrichment, and the y-axis represents pathway names. Each point represents a pathway, with the color of the point indicating the pathway’s −log10p-value. The redder the color, the larger the −log10p-value (and the smaller the p-value). The size of the point represents the number of proteins enriched in that pathway.
Dairy 06 00053 g003
Figure 4. GO enrichment analysis of DEPs between the HTR and CON cows. Only the top 20 GO terms ranked by p-value are shown for Biological Process (BP) and Cellular Component (CC); 11 GO terms ranked by p-value are shown for Molecular Function (MF). Green indicates BP, orange indicates CC, and purple indicates MF. The x-axis represents GO terms, and the y-axis represents −log10p-value.
Dairy 06 00053 g004
Figure 5. Protein–protein interaction network. Each point represents a DEP. Yellow indicates proteins upregulated in the HTR cows relative to the CON cows, while green indicates downregulated proteins. The size of each point reflects the number of interactions associated with that protein; the more interactions, the larger the point. Each line connecting two proteins indicates an interaction between them. The thickness of the line represents the combined score of the interaction; thicker lines indicate a higher combined score, and thinner lines indicate a lower combined score, with all combined scores being greater than 0.4.
Dairy 06 00053 g005
Table 1. Differences in plasma biochemical indicators that conform to normality in HTR and CON cows.
ItemHTR 1CON 2p-Value
DA (pg/mL)120.07 ± 11.56121.06 ± 11.160.809
NOR (pg/mL)423.51 ± 53.99429.28 ± 46.630.746
TC (mmol/L)5.24 ± 0.975.40 ± 1.060.650
HDL (mmol/L)2.99 ± 0.483.05 ± 0.520.745
LDL (mmol/L)1.35 ± 0.361.44 ± 0.410.474
GLU (mmol/L)3.10 ± 0.413.35 ± 0.350.074
FFA (mmol/L)0.28 ± 0.060.24 ± 0.070.123
β-HB (mmol/L)0.43 ± 0.120.47 ± 0.120.344
T4 (ng/mL)58.34 ± 3.8058.82 ± 5.390.773
ALB (g/L)31.85 ± 4.2930.37 ± 4.070.327
TP (g/L)68.91 ± 7.7465.98 ± 7.690.297
UREA (mmol/L)4.33 ± 0.594.61 ± 0.810.277
LDH (U/L)1141.03 ± 223.941071.17 ± 195.140.360
T-AOC (U/mL)9.12 ± 1.679.66 ± 1.050.288
1 HTR: The group of cows with high-frequency tongue-rolling behavior. 2 CON: The group of cows without stereotypic behaviors.
Table 2. Differences in DHI and milk biochemical indicators in HTR and CON cows.
ItemHTR 1CON 2p-Value
Milk yield (kg/d)33.56 ± 9.8631.23 ± 7.940.449
Milk protein percentage (%)3.37 ± 0.153.71 ± 0.17<0.001
Milk fat percentage (%)3.80 ± 0.683.92 ± 0.470.587
Milk lactose percentage (%)5.28 ± 0.905.23 ± 0.100.155
Milk true protein percentage (%)3.37 ± 0.153.69 ± 0.17<0.001
Milk crude protein percentage (%)3.57 ± 0.143.90 ± 0.17<0.001
αs1-CN (μg/mL)54.91 ± 1.5056.25 ± 1.500.016
αs2-CN (μg/mL)40.54 ± 1.6741.13 ± 2.070.381
β-CN (μg/mL)99.31 ± 2.42103.73 ± 2.71<0.001
κ-CN (μg/mL)23.46 ± 0.8624.25 ± 0.910.020
α-LA (μg/mL)26.09 ± 1.0526.44 ± 0.620.282
β-LG (μg/mL)334.06 ± 11.54341.09 ± 9.220.070
LF (μg/mL)789.57 ± 31.37826.24 ± 32.680.002
1 HTR: The group of cows with high-frequency tongue-rolling behavior. 2 CON: The group of cows without stereotypic behaviors.
Disclaimer/Publisher’s Note: The statements, opinions and data contained in all publications are solely those of the individual author(s) and contributor(s) and not of MDPI and/or the editor(s). MDPI and/or the editor(s) disclaim responsibility for any injury to people or property resulting from any ideas, methods, instructions or products referred to in the content.