Article

Balancing Trade-Offs in Milk Production by Making Use of Animal Individual Energy Balancing

1
Department of Animal Nutrition and Animal Health, Faculty of Organic Agricultural Sciences, University of Kassel, Nordbahnhofstr. 1a, 37213 Witzenhausen, Germany
2
Educational and Research Center for Animal Husbandry, Hofgut Neumuehle, 67728 Muenchweiler an der Alsenz, Germany
*
Author to whom correspondence should be addressed.
Dairy 2022, 3(2), 345-363; https://doi.org/10.3390/dairy3020027
Submission received: 31 January 2022 / Revised: 26 March 2022 / Accepted: 29 April 2022 / Published: 17 May 2022

Abstract

:
Traditionally, the energy supply of dairy cows is based on the average performance of the herd. Because this contradicts the great variation in requirements between individual animals, the objective of the present study was to quantify both the extent and consequences of variation in the relevant sub-variables used to calculate the energy balance (EB) on an individual animal basis. Total energy supply (TES) and requirements (TER) of 28 multiparous German Holstein dairy cows fed TMR with 7.0 MJ NEL were studied between the 2nd and 15th week after calving. TES, mainly influenced by DMI, increased from 100.1 (week 2) to 152.1 MJ NEL/d (week 15; p < 0.01). Weekly coefficients of variation (CV) ranged between 0.10 and 0.16 and were similar to the CV of DMI (0.09 to 0.17). TER, as the sum of energy requirement for maintenance (body weight) and production (milk yield), decreased from 174.8 (week 2) to 164.5 MJ NEL/d (week 15; p < 0.01) and CV varied between 0.16 (week 2) and 0.07 (week 11). EB increased from −74.8 (week 2) to −12.4 MJ NEL/d (week 15; p < 0.01) and CV varied from 0.32 (week 3) to 1.01 (week 10). The results indicate that calculating EB on an individual animal basis is a prerequisite to identify animals with an increased risk of failing to cope with their energy situation, which cause failure costs that drain the profit of affected cows.

1. Introduction

The average milk production per cow and year has continuously increased over the past decades [1]. The reasons are multifactorial and can be attributed not only to breeding for a high milk yield, but also to improvements in feeding regimes and increased management efforts [2,3]. An increase in milk yield is equivalent to an increase in energy requirements for milk production. Daily requirements for glucose, amino acids, and fatty acids during this period are, for example, respectively more than 2.7, 2.0, and 4.5 times higher than the uterine requirements during the last third of gestation [4]. However, energy intake does not increase at the same rate, particularly in the first weeks after calving [5,6]. The gap between energy requirements and supply causes a metabolic challenge for the dairy cow. Despite the increase in animal body mass and girth associated with breeding for higher milk yield, it is not possible for dairy cows to absorb the amount of energy from feed that is required for the maintenance of body functions and milk production. In addition, with each increase in body size, body mass, and milk yield, energy requirements continue to increase and the gap between energy requirements and supply continues to widen [1,7,8]. This inevitably leads to a massive energy deficit or negative energy balance (NEB) and an enhanced need for metabolic regulation by the cow [9]. If sufficient energy can no longer be consumed to meet the demand, the body mobilizes body fat reserves, resulting in increased lipolysis [10]. The continually increasing hepatic uptake of non-esterified fatty acids (NEFA) from the blood can lead to the development of fatty liver, which in turn can have far-reaching negative consequences on overall body functioning [9,11,12]. An increase in NEB is associated with a decrease in reproductive performance [13,14,15] and claw health [11]. Furthermore, additional health risks are created by the increase in milk yield because it leads to insufficient glucose content for the maintenance of the immune system due to the inability of intermediary metabolism to provide sufficient glucose to meet the simultaneous needs of mammary and immune cells [16]. Metabolic disorders indicate an excessive overload of the adaptive capacity [9]. This increases the risk of involuntary culling and of economic losses [17,18]. These losses are high in the case of a short useful lifespan since the costs incurred for rearing, keeping, and feeding have usually not yet been recovered by the animal. Due to the economic implications, knowledge and control of the animal-individual energy balance is one of the most important tasks in dairy farming [19].
Energy balance (EB) is calculated as the energy ingested through feed, ideally corrected for the animal-individual level of digestibility, minus the energy required to maintain body functions, milk production, and pregnancy. Therefore, EB is a calculated variable consisting of several sub-variables. The sub-variables can vary over time within one animal and between individual animals of the same genotype or in the same stage of lactation due to reinforcing, but nevertheless partly opposing, biological processes [20]. For example, an increase in milk yield leads to an increase in feed intake [21,22,23] but feed digestibility decreases as feed intake increases [24,25].
In the past, many studies have addressed the magnitude of energy deficit at the beginning of lactation and its effects on animal health. However, the implications of the variation within and between sub-variables on EB are often unknown or faded out when using prediction equations or table values to formulate feeding rations [26]. Therefore, the objective of the present study was to quantify the extent of intra- and interindividual variation in the relevant sub-variables and its effects on the intra- and interindividual variation of EB.

2. Materials and Methods

2.1. Animals, Housing and Diet

The study was carried out between April and October 2018 at the Educational and Research Center for Animal Husbandry, Hofgut Neumuehle, Muenchweiler a.d. Alsenz, Germany. Twenty-eight German Holstein dairy cows, ranging from the second to eighth parity (mean = 2.9; SD = 1.3), and between the second and fifteenth week of lactation were used. The cows were housed together with non-experimental cows in a free-stall barn with 60 cubicles and 30 feeding units. Cows had unlimited access to fresh water and were fed a total mixed ration (TMR) ad libitum (Table 1). The TMR was prepared in the morning and delivered twice daily (60% of total daily amount at 6 am and 40% of total daily amount at 11 A.M.).

2.2. Data and Sample Collection

Individual feed intake was measured daily with an Insentec B.V. (Marknesse, The Netherlands) RIC (Roughage Intake Control) automatic weighing system. Cows were identified using individual collar transponders, which provided access to the feeding unit. TMR intake per visit was calculated from the differences in trough weight between start and end of the visit. The daily dry matter intake (DMI) per cow was calculated by adding the recorded daily amount of fresh matter intake and multiplying the result by the diet DM content and averaged over one week. Body weight of all cows was measured daily following the AM and PM milking using weighing scales and averaged over one week. Due to a technical error, no weights could be recorded over a period of six weeks. The missing data were linear interpolated using the ‘linear trend at point’ method in the replace missing values command of the SPSS 25.0 software (IBM Company Inc., Chicago, IL, USA). As an additional animal control, body condition score (BCS) was assessed biweekly by trained observers to the nearest quarter unit on a scale from 1 (emaciated) to 5 (obese; [27]) with intermediate steps of 0.25 points. The missing BCS data every second week were smoothed across lactation using natural cubic splines of degree 3 [28,29].
Cows were milked twice daily between 5.00 and 7.30 A.M. and between 3.30 and 6.00 P.M. The daily milk yield was recorded electronically via the herd management system Dairy Plan C21 (GEA Farm Technologies, Boenen, Germany). Milk aliquots from one evening and the next morning were taken biweekly and pooled for further analysis of milk fat, protein, and lactose by infrared spectrophotometry using a MilkoScan FT6000 (Foss Analytical A/S, Hillerød, Denmark).
TMR samples were taken daily within one hour of feed delivery. Daily samples were combined on a weekly basis with a representative TMR sample of 800–1000 g to determine the weekly dry matter content. Starting at the day of calving, individual cow fecal samples were collected weekly two hours after morning milking via rectal palpation. The samples were labelled and stored frozen at −20 °C until chemical analysis. Deviations in fecal content within a day, especially in aNDFom and iNDF240, were reduced by defining a fixed time of feeding and sampling, which remained constant over the test period.

2.3. Chemical Analysis

Dry matter (DM) content was determined in a two-step process. Thawed TMR and feces samples were first oven dried at 60 °C for 48 h and ground to 1 mm particle size. This was followed by drying at 105 °C for 3 h until constant weight was achieved. Organic matter (OM) was measured by ashing (550 °C) overnight. The dried and ground samples were submitted to Cumberland Valley Analytical Services Inc., Waynesboro, PA (CVAS) for chemical analysis. All TMR samples were analyzed for DM, OM (method 942.05; [30], CP (method 990.03; [30], SP [31], EE (method 2003.05; [30]), aNDFom using α-amylase and expressed exclusive of residual ash [32], ADF (expressed inclusive of residual ash, method 978.10; [30]), lignin (method 973.18; [30]), ethanol soluble carbohydrates (ESC), starch [33] and iNDF240 [34]. Dried and ground fecal samples were split into two subsamples. One subsample was analyzed with near infrared reflectance spectroscopy (NIRS) described by Althaus et al. [35]. The analysis included DM, OM, and CP. The other subsample was submitted to CVAS for the determination of ADF, aNDFom, and iNDF240.

2.4. Calculations and Statistical Analysis

For comparison, DMI was predicted with the Gruber Model 5, which is a standard model for TMR without hay [36]. The prediction model was based on days in milk (DIM), the effect of country and breed, parity, body weight (BW), and milk yield (MY). In the present study, mean values of the animals in the different stages of lactation were used. The diet characteristics used in the model were the proportion of concentrate in the mixed ration (cDMI%; %concentrate of the mixed ration; DM/day) and the net energy (NE) value of forage (NELf; MJNE/kg DM) [37].
Organic matter digestibility was calculated from iNDF240 as an internal marker and nutrient concentrations in TMR and feces using the following equation by [38]:
Organic matter digestibility (g/kg) = 100 − {100 × (TMR iNDF240/fecal iNDF240) ×
[fecal OM content (% of DM)/TMR OM content (% of DM)]}
The energy corrected milk yield (ECM) was calculated as follows [39]:
ECM (kg/day) = milk yield (kg/d) × {([0.38 × fat (%) + 0.21 protein (%)] + 1.05)/3.28}
ECM was calculated with the daily milk yield and the fat and protein content from the milk check. The daily ECM was averaged over one week.
EB was calculated from the total energy supply (TES), the energy requirement for maintenance (ERM), and the energy requirement for production (ERP) of ECM as proposed by GfE [40]. Energy requirement for the production of 1 kg ECM was calculated with 3.28 MJ NEL [40]:
TES (MJ NEL/d) = DMI (kg) × MJ NEL/kg DM
ERM (MJ NEL/d) = 0.293 × BW 0.75 (kg)
ERP (MJ NEL/d) = ECM (kg) × 3.28 (MJ NEL)
TER (MJ NEL/d) = ERM (MJ NEL/d) + ERP (MJ NEL/d)
EB (MJ NEL/d) = TES (MJ NEL/d) − ERM (MJ NEL/d) − ERP (MJ NEL/d)
Data were analyzed using SPSS 25.0 software (IBM Company Inc., Chicago, IL, USA). The mean, range, standard deviation (SD), and coefficient of variation (CV), calculated as ratio of standard deviation to mean, were calculated. Each variable was checked for normal distribution by a histogram and a Q–Q plot. Changes in each parameter for all cows over the course of the study are shown by box plots that represent the median, interquartile range, and extreme cases of individual variables. The individual comparisons were performed using post-hoc pairwise comparisons, with the Sidak correction applied, to determine which of the comparisons were significant. When the Mauchly’s test indicated that the assumption of sphericity had been violated, the degrees of freedom were corrected using Greenhouse–Geisser estimates if the estimate was lower than 0.75 or the Huynh–Feld estimate if the estimate was greater than 0.75 [41]. The effect sizes for the main effects and interactions were determined by partial eta squared (η2) values. Partial eta squared (η2) values were classified as small (0.01 to 0.059), moderate (0.06 to 0.137), and large (>0.137). Differences were considered significant at a level of p ≤ 0.05, and a tendency was considered at 0.05 < p ≤ 0.10. The relationship between EB and BCS was analyzed using Pearson’s correlation.
Cows were retrospectively grouped in quartiles based on average energy balance between week 2 and 15 of lactation. The formation of groups using such quartiles has the advantage of separating cows with high differences in EB more precisely.
Groups were defined as low, intermediate, and upper quartile of mean energy balance.
Performance data were analyzed using ANOVA, with quartiles as the fixed factor. The individual quartile comparisons were performed using post-hoc pairwise comparisons, with the Sidak correction applied. Furthermore, linear regressions were performed to analyze the impact of variation in the different sub-variables on the variation of EB.

3. Results

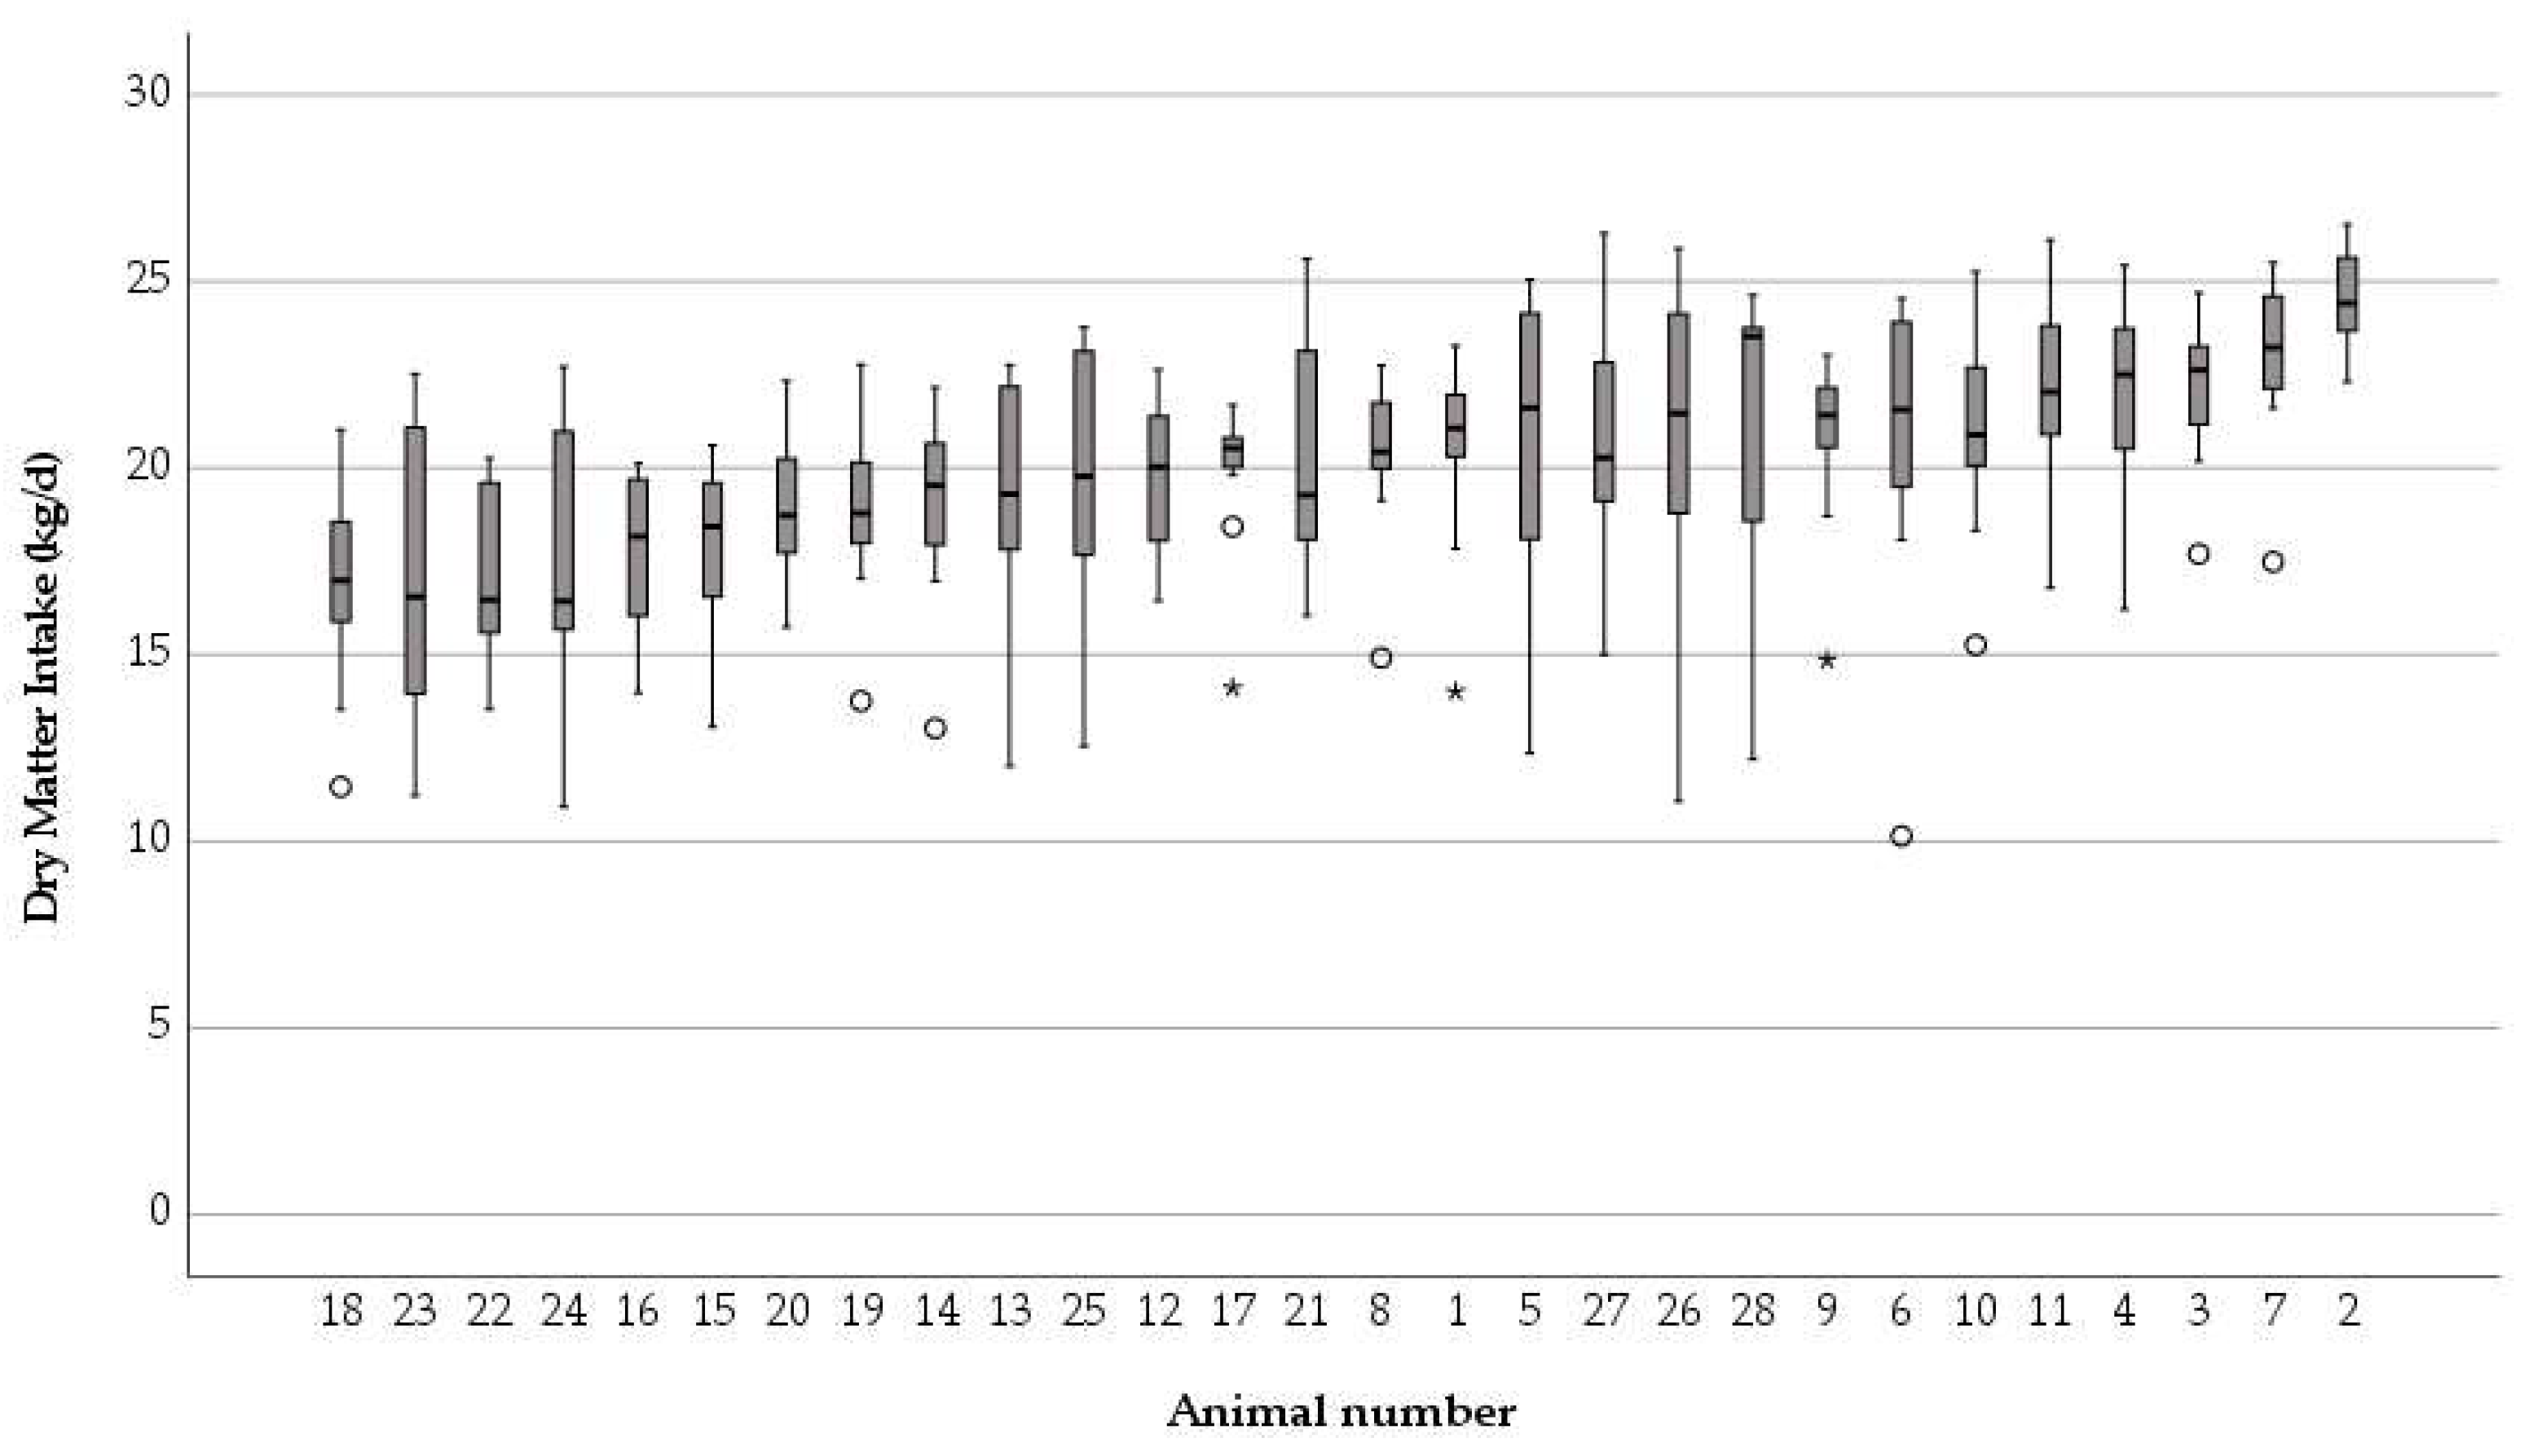
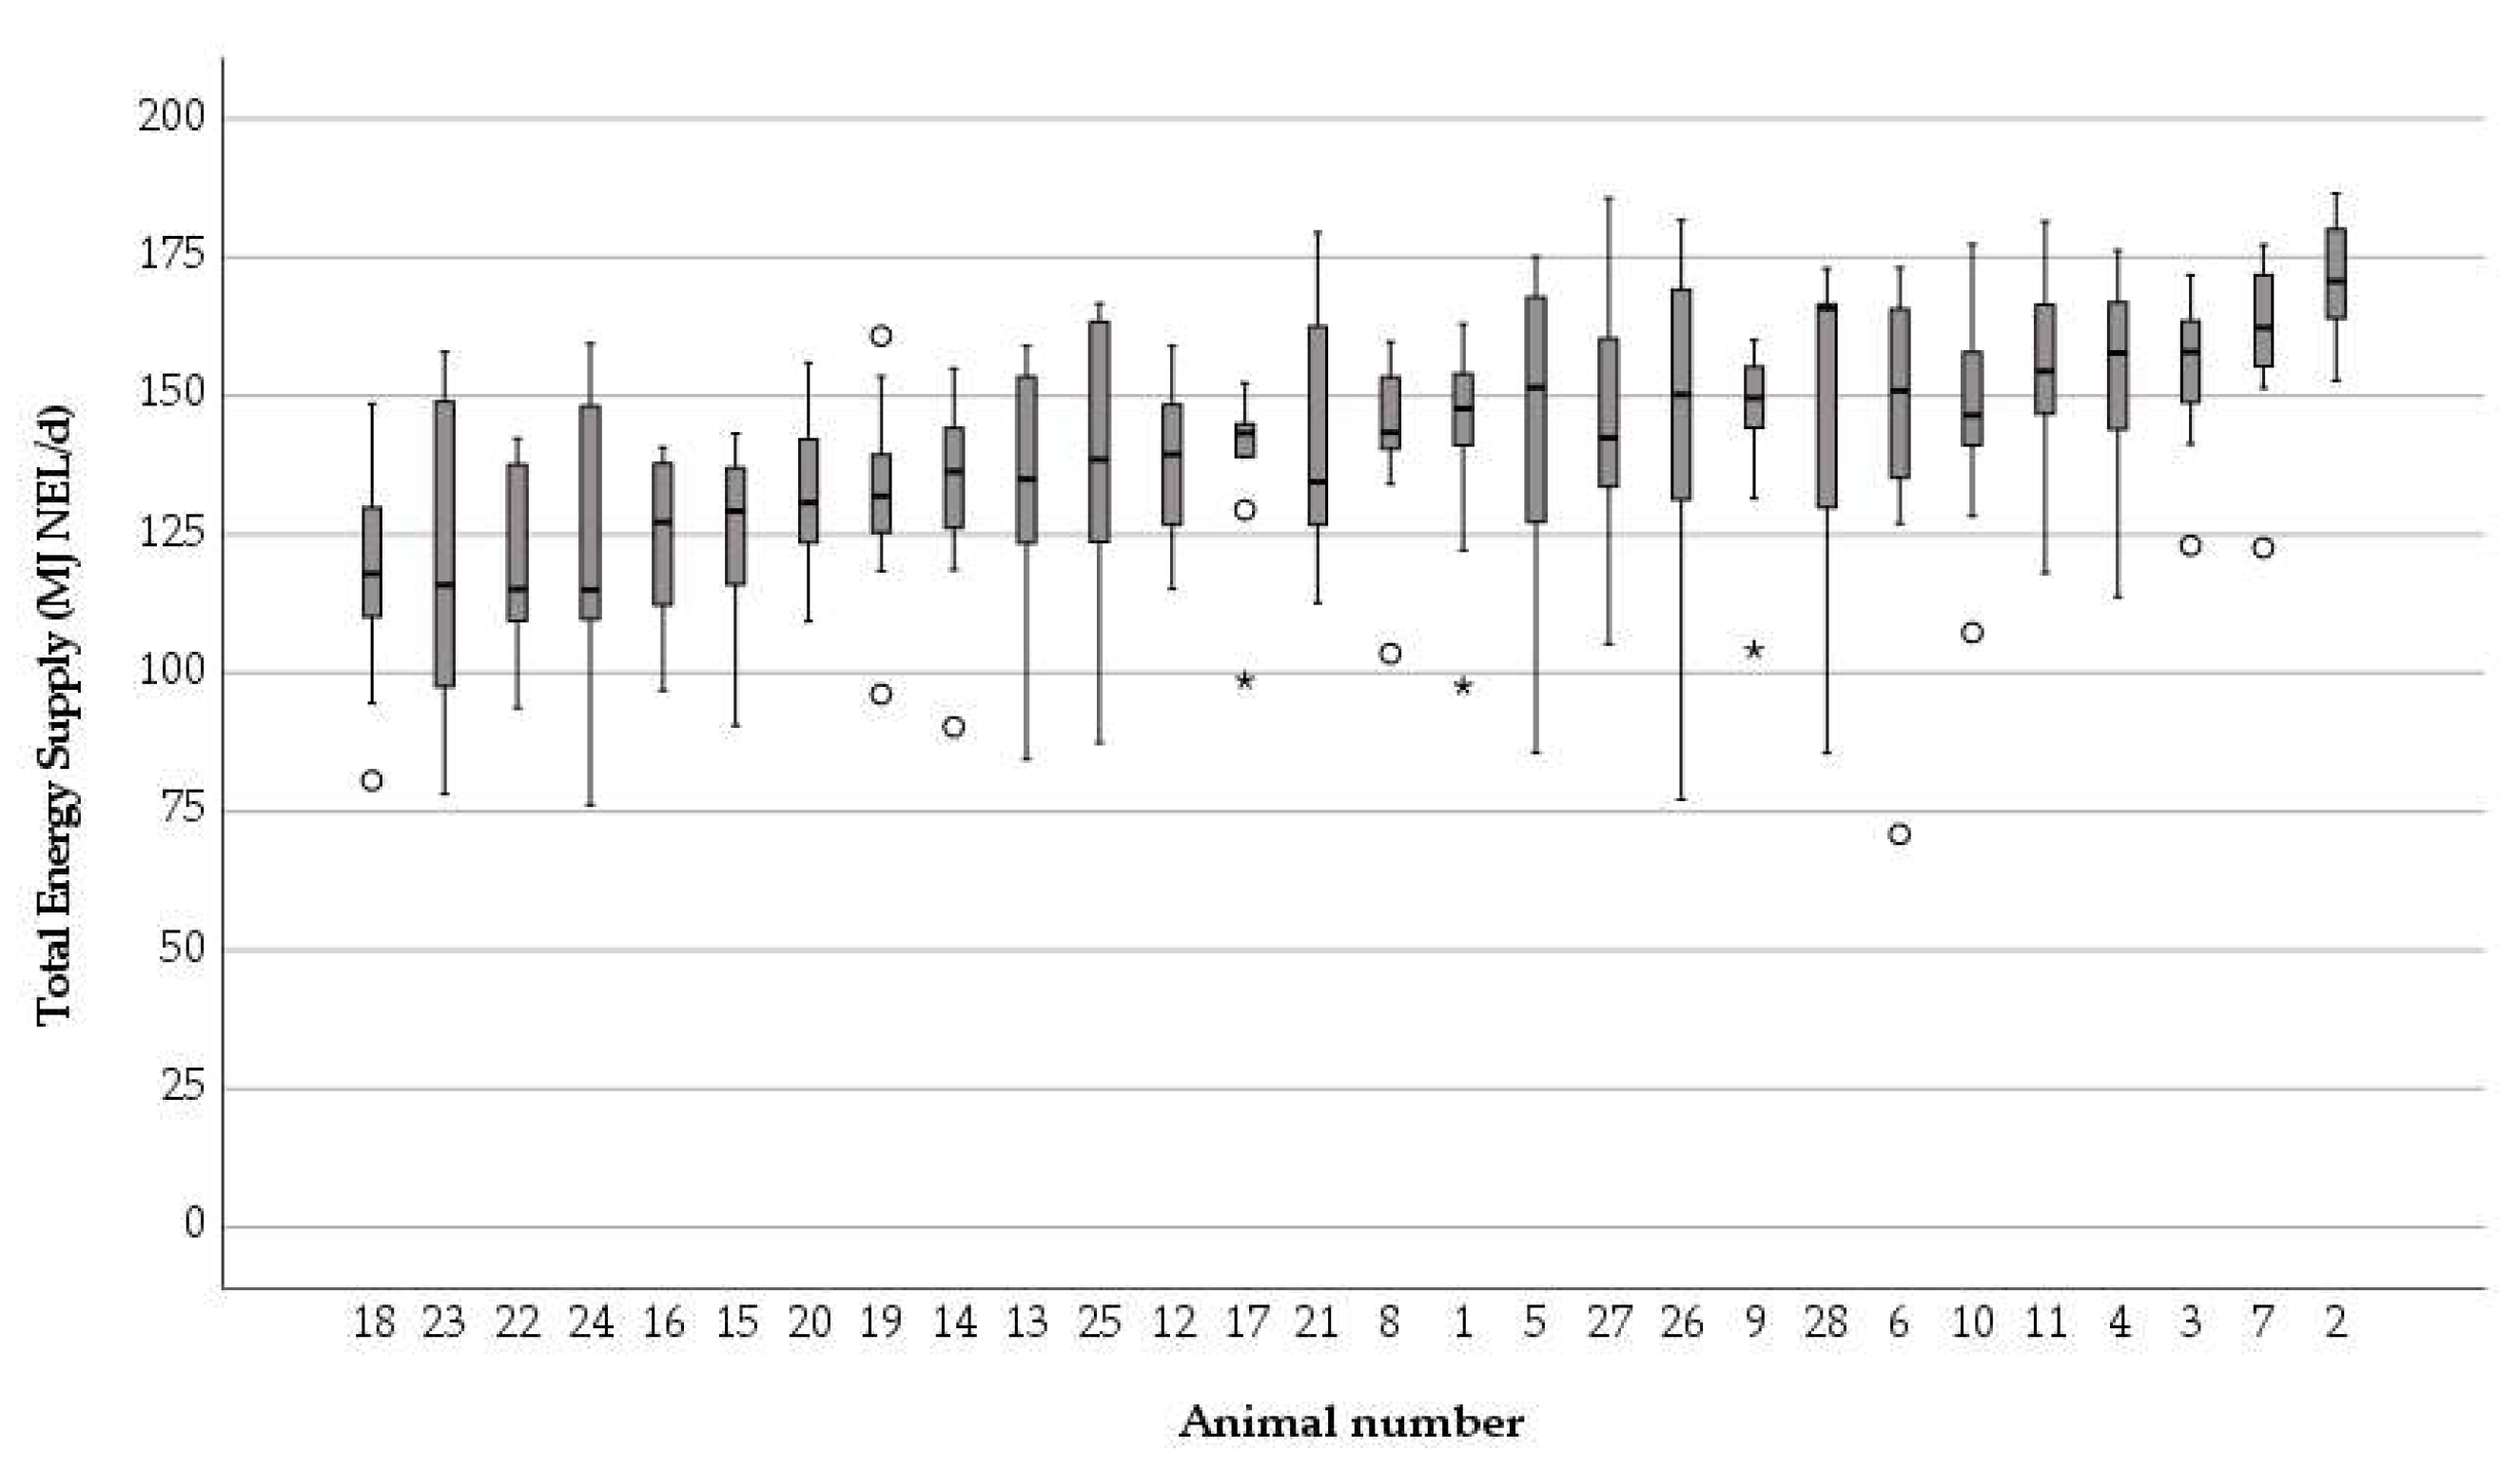
3.1. Variation of Energy Supply Parameter

The energy content of the offered total mixed rations during the trial period was constant at 7.0 ± 0.0 MJ NEL. DMI significantly increased with a linear (p < 0.001; η2 = 0.75) and quadratic (p < 0.001; η2 = 0.677) trend from a mean value of 14.3 ± 2.3 kg DMI per day in week 2 up to 22.1 ± 2.3 kg in week 11. Thereafter, DMI varied until the 15th week of lactation between 21.2 und 21.7 kg DMI. Weekly CV values of DMI ranged between 0.09 (week 9) and 0.17 (week 2). This was also shown in Rumphorst et al. [42]. Mean individual cow DMI (Figure 1) between week 2 and 15 of lactation ranged between 16.8 ± 2.5 kg and 24.5 ± 1.3 kg DMI per day and was significantly different between animals (p = 0.00; η2 = 0.669). The CV of DMI for individual animals over the trial period ranged between 0.05 and 0.25.
By comparing the predicted DMI with the measured DMI, differences up to 6.7 kg DMI/d could be detected (Table 2). In addition, the measured DMI showed a high variation with CV values up to 0.15 and wide ranges between minimum (min) and maximum (max) DMI during the different stages of lactation.
Organic matter digestibility (OMD) during the trial period varied between 738.6 g/kg (week 2) and 725.1 g/kg (week 8). Weekly CV values of OMD ranged between 0.02 and 0.03. Mean individual cow OMD ranged between 712.6 ± 17.7 and 744.2 ± 16.5 g OM/kg DM and it was also significantly different between animals (p = 0.00; η2 = 0.275). The CV of individual animal OMD ranged between 0.02 and 0.04.
Total energy supply (TES) increased with a linear (p < 0.001; η2 = 0.753) and quadratic (p < 0.001; η2 = 0.674) trend from a mean value of 100.1 ± 15.8 MJ NEL/day in week 2 up to 152.1 ± 15.4 MJ NEL/day in week 15. Weekly CV values of TES ranged between 0.10 (week 9, 11 and 15) and 0.16 (week 2, 3, 14). Mean individual cow TES (Figure 2) varied between 117.3 ± 17.9 and 171.1 ± 10.1 MJ NEL per day (p = 0.00; η2 = 0.669) and the CV ranged between 0.06 and 0.25.
BCS decreased with a linear (p = 0.025; η2 = 0.23) and quadratic (p = 0.005; η2 = 0.33) trend from a mean value of 3.1 BCS points in week 2 to 2.84 in week 9. Thereafter, BCS increased up to 2.9 BCS points in the 15th week of lactation (Figure 3).
BCS changes between two weeks are shown in Figure 4.
Mean individual cow BCS during the trial period ranged between 2.4 ± 0.2 and 3.6 ± 0.4 and the CV varied between 0.00 and 0.15 (Figure 5).

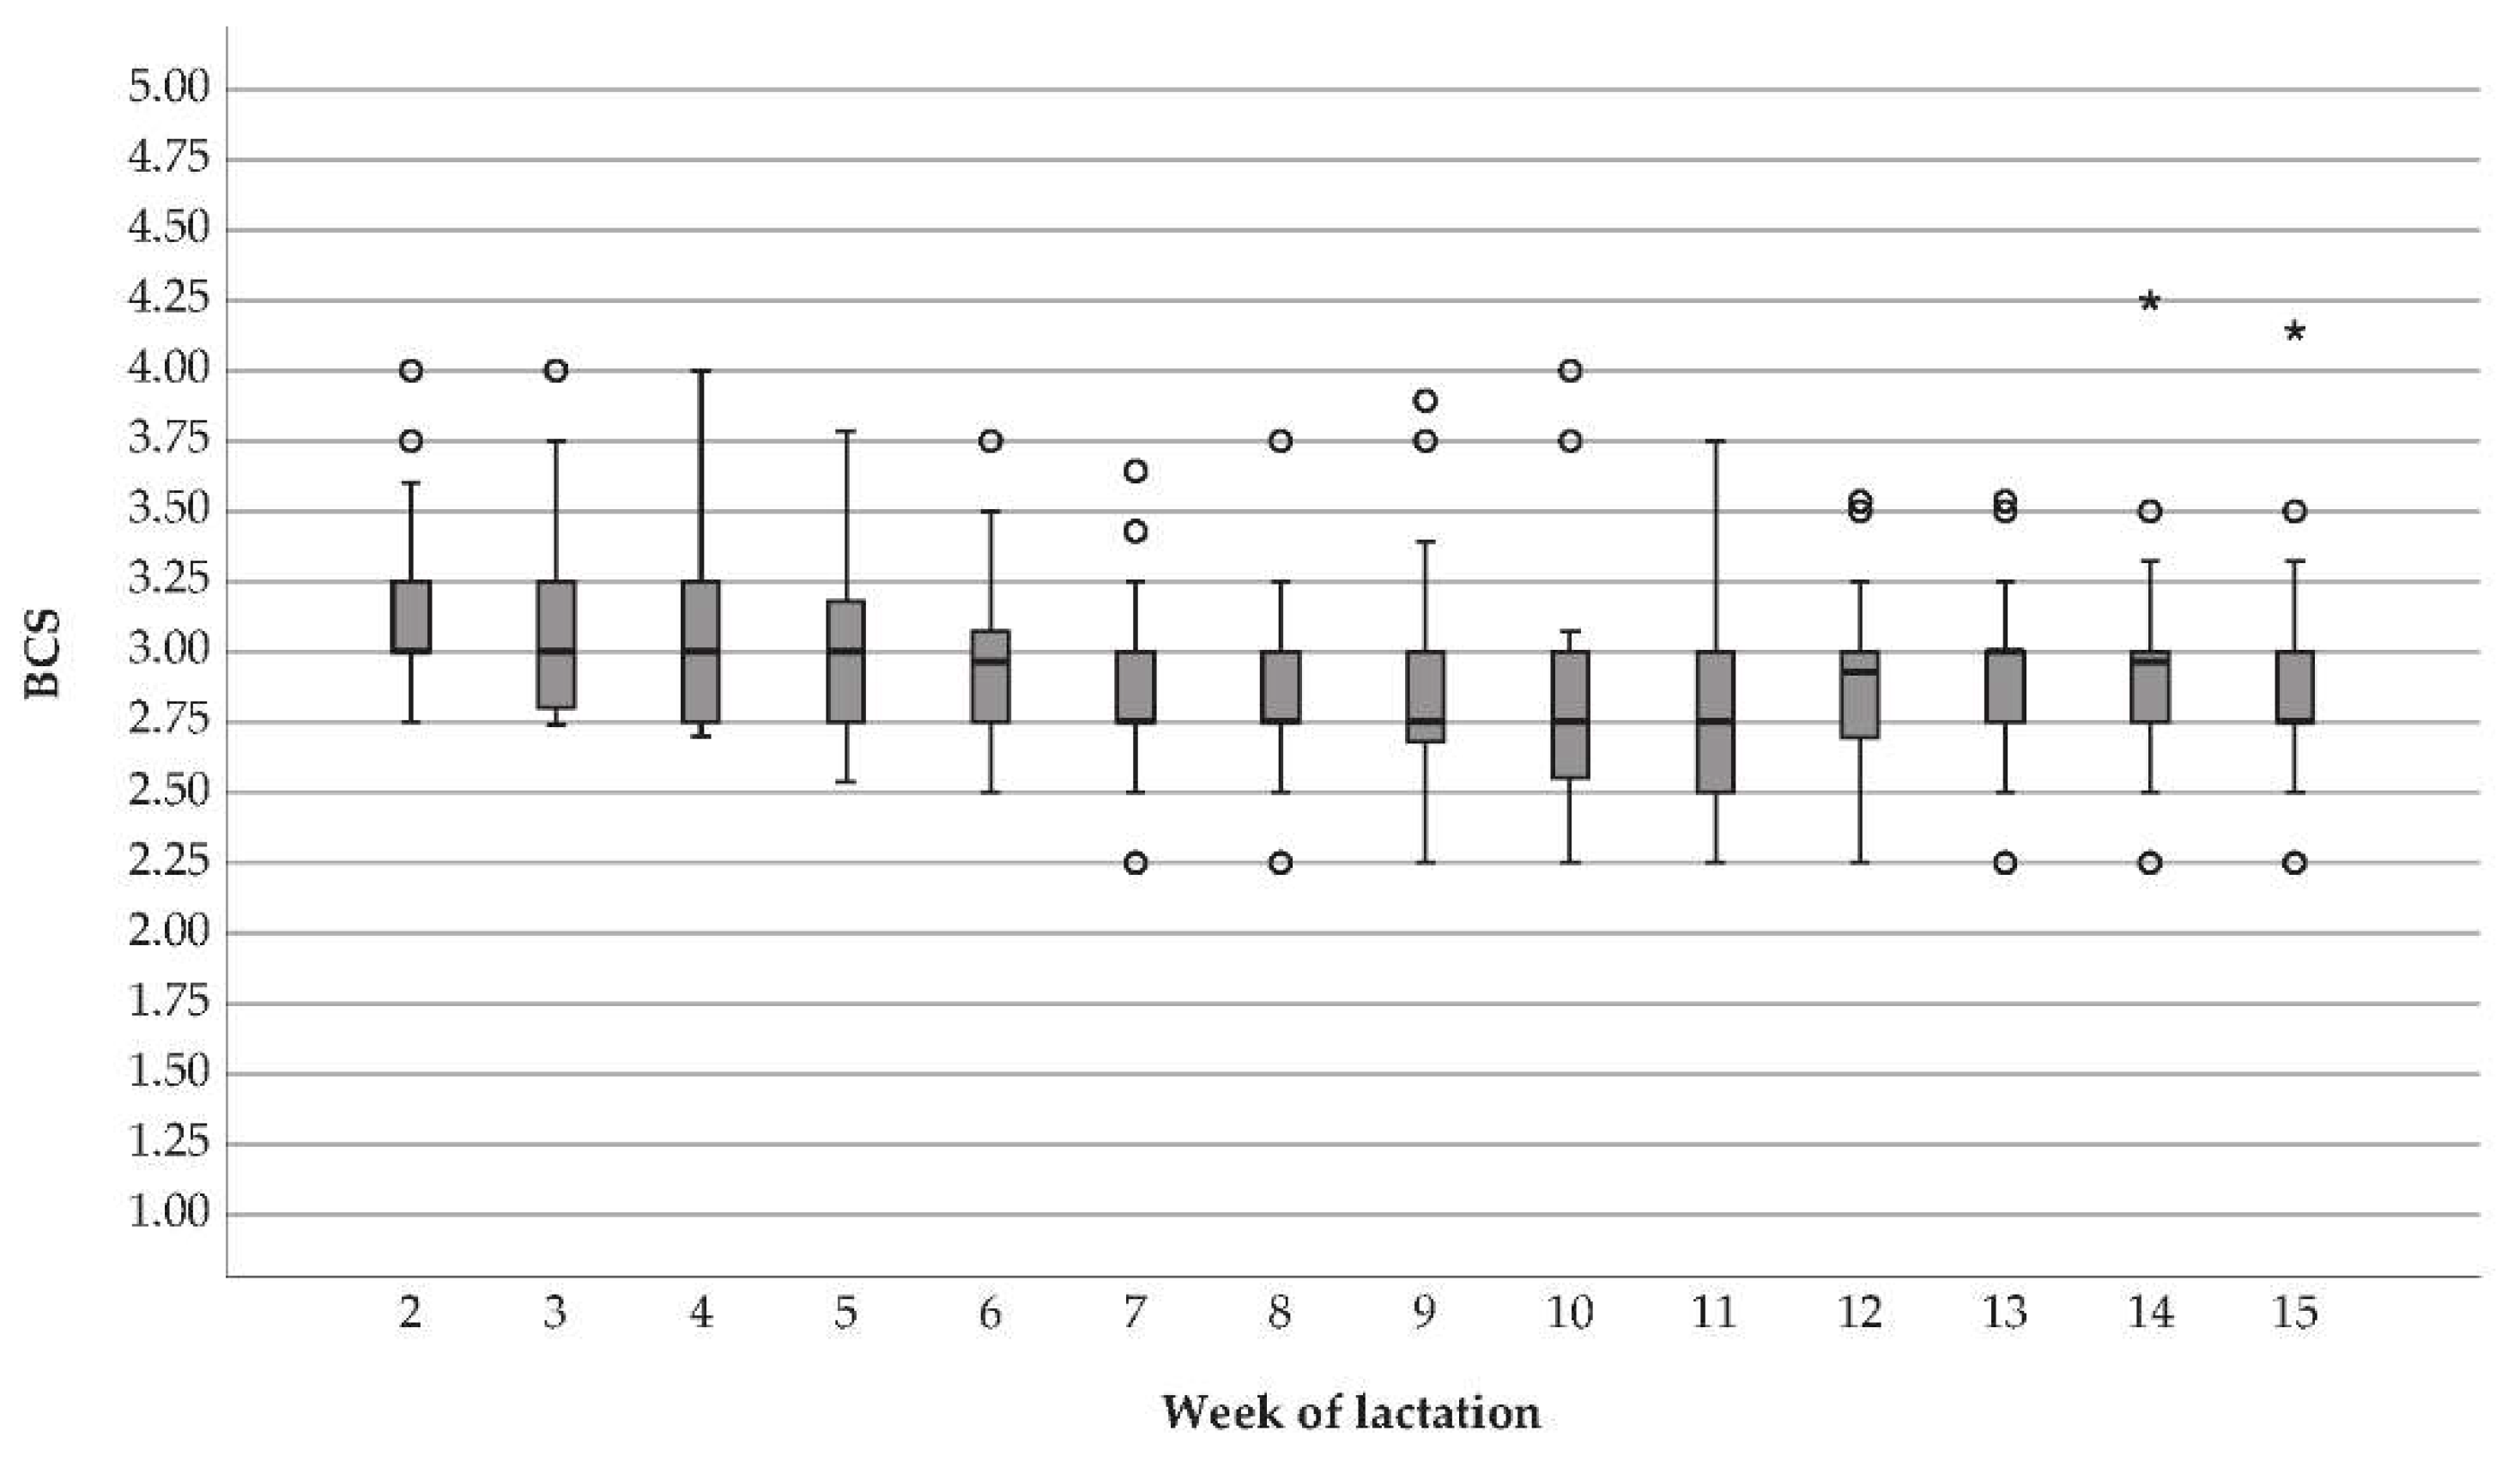
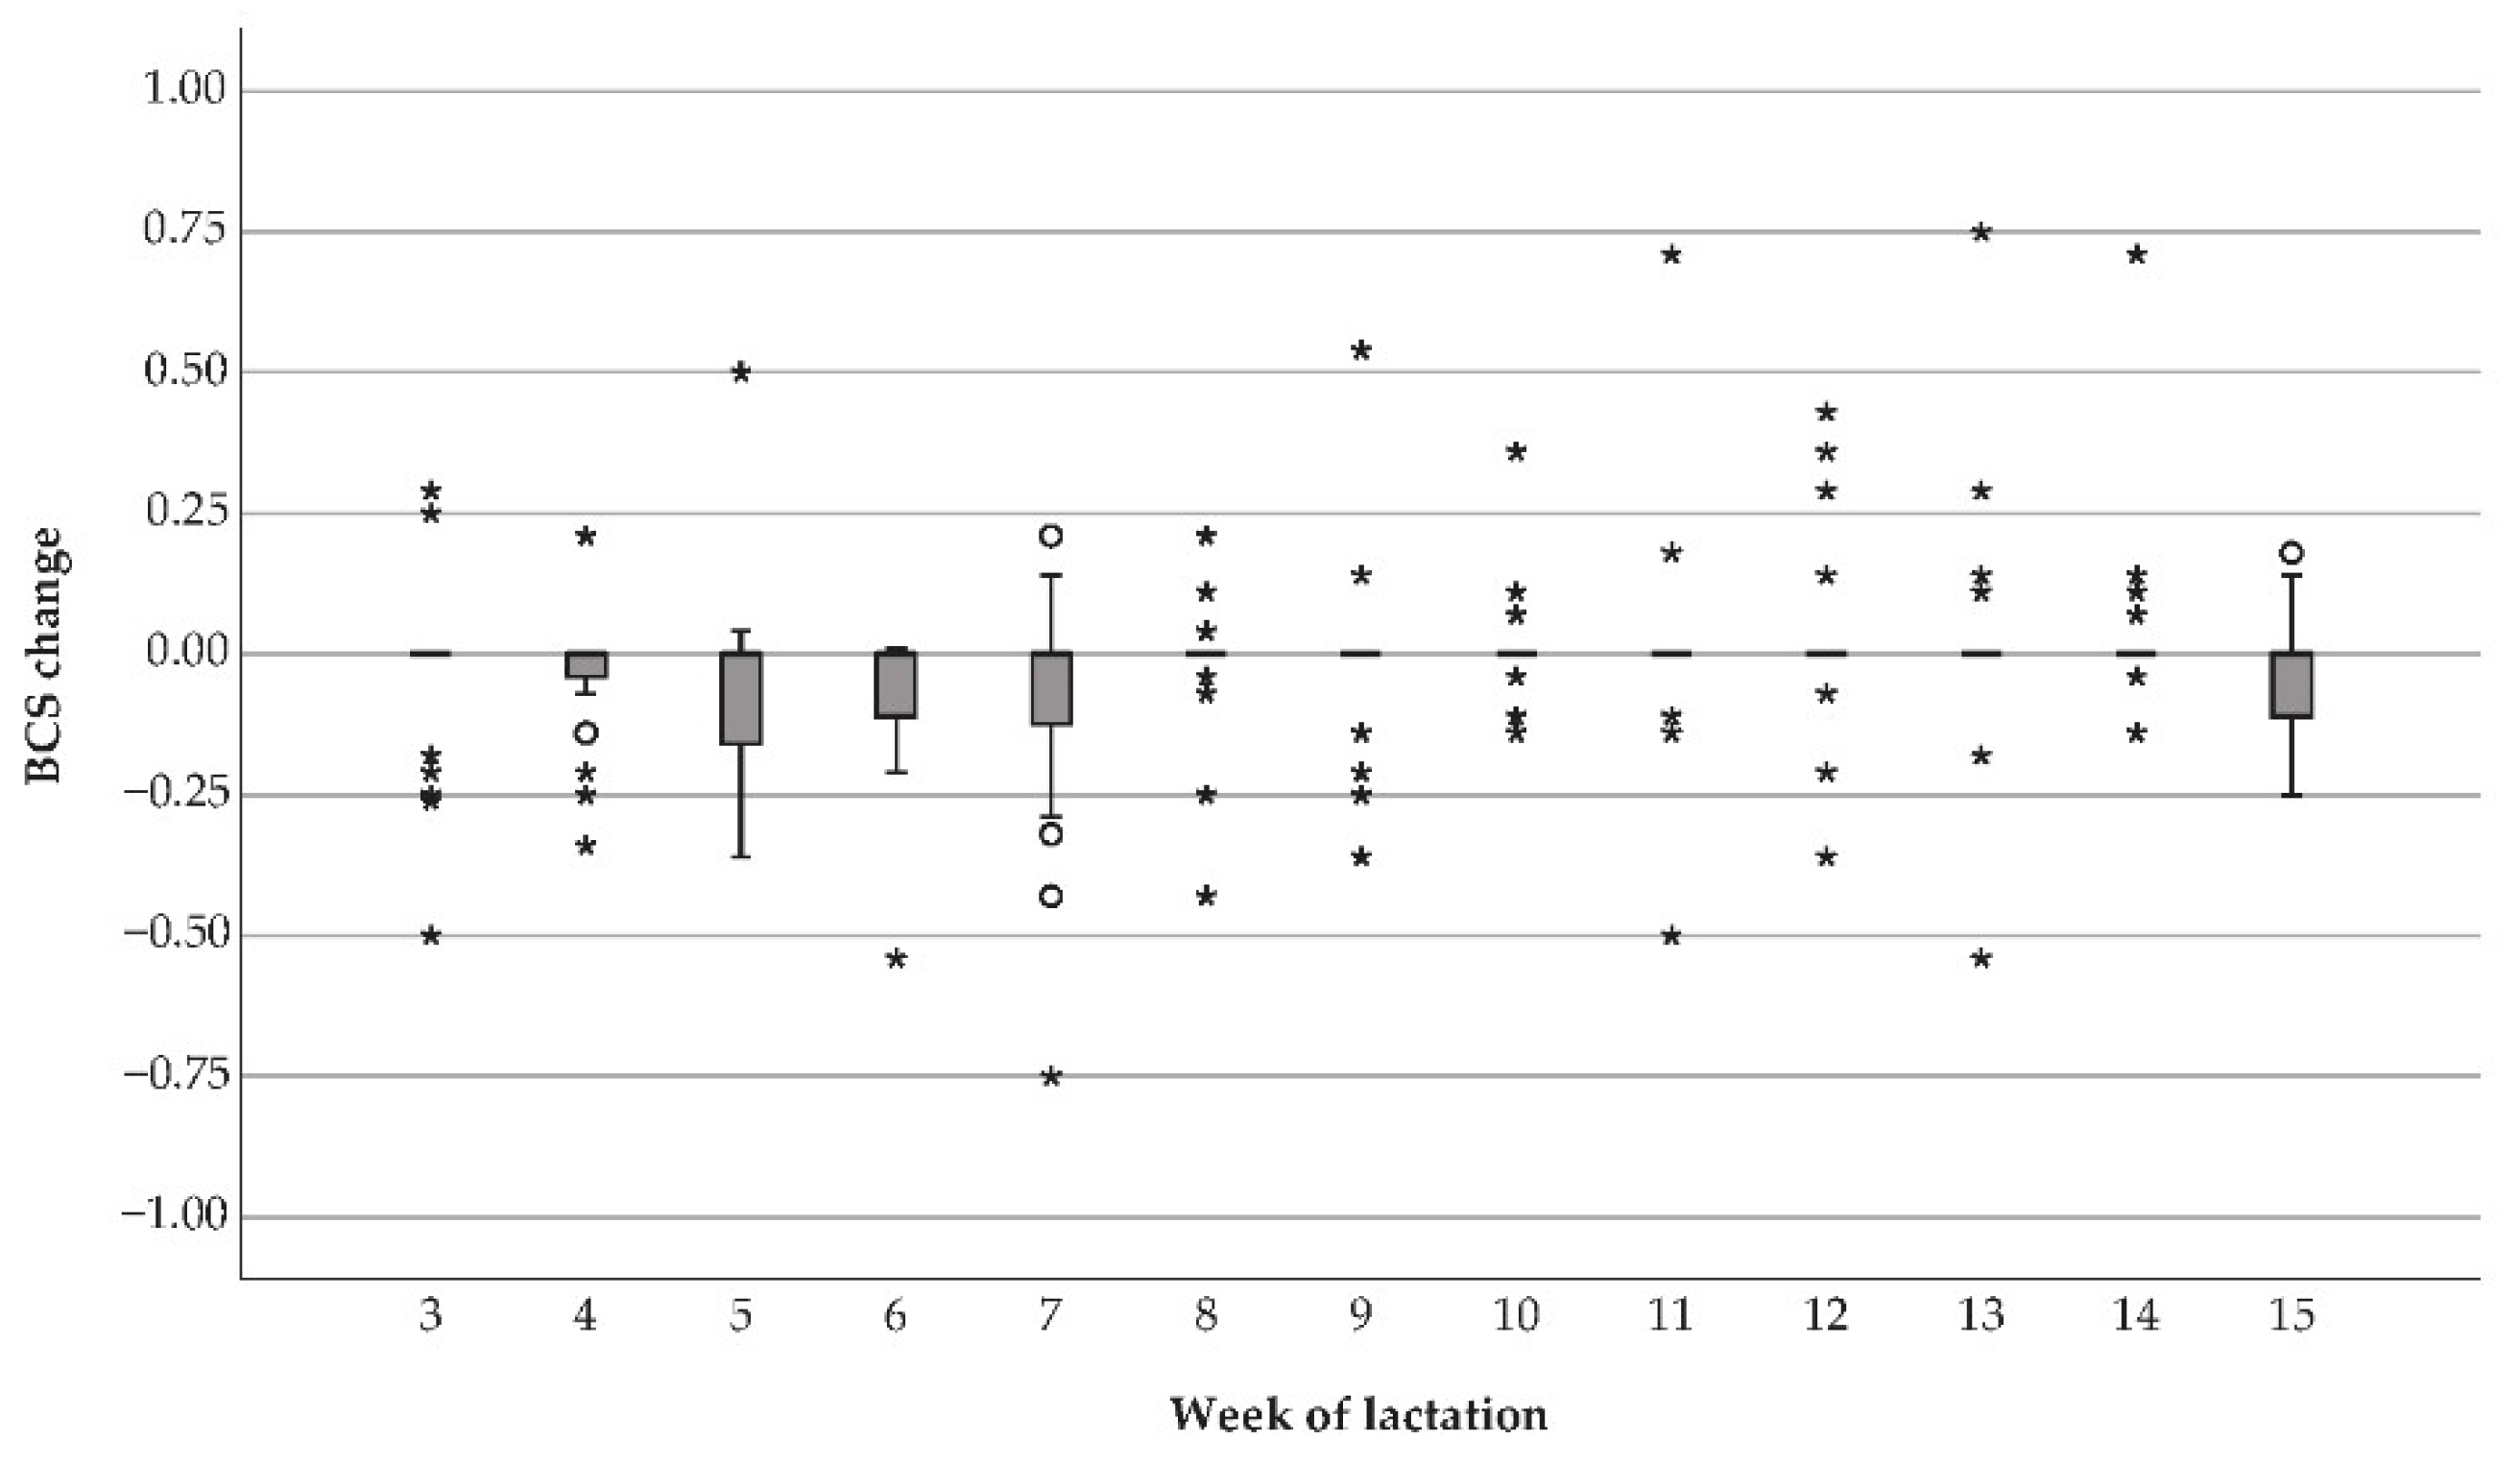
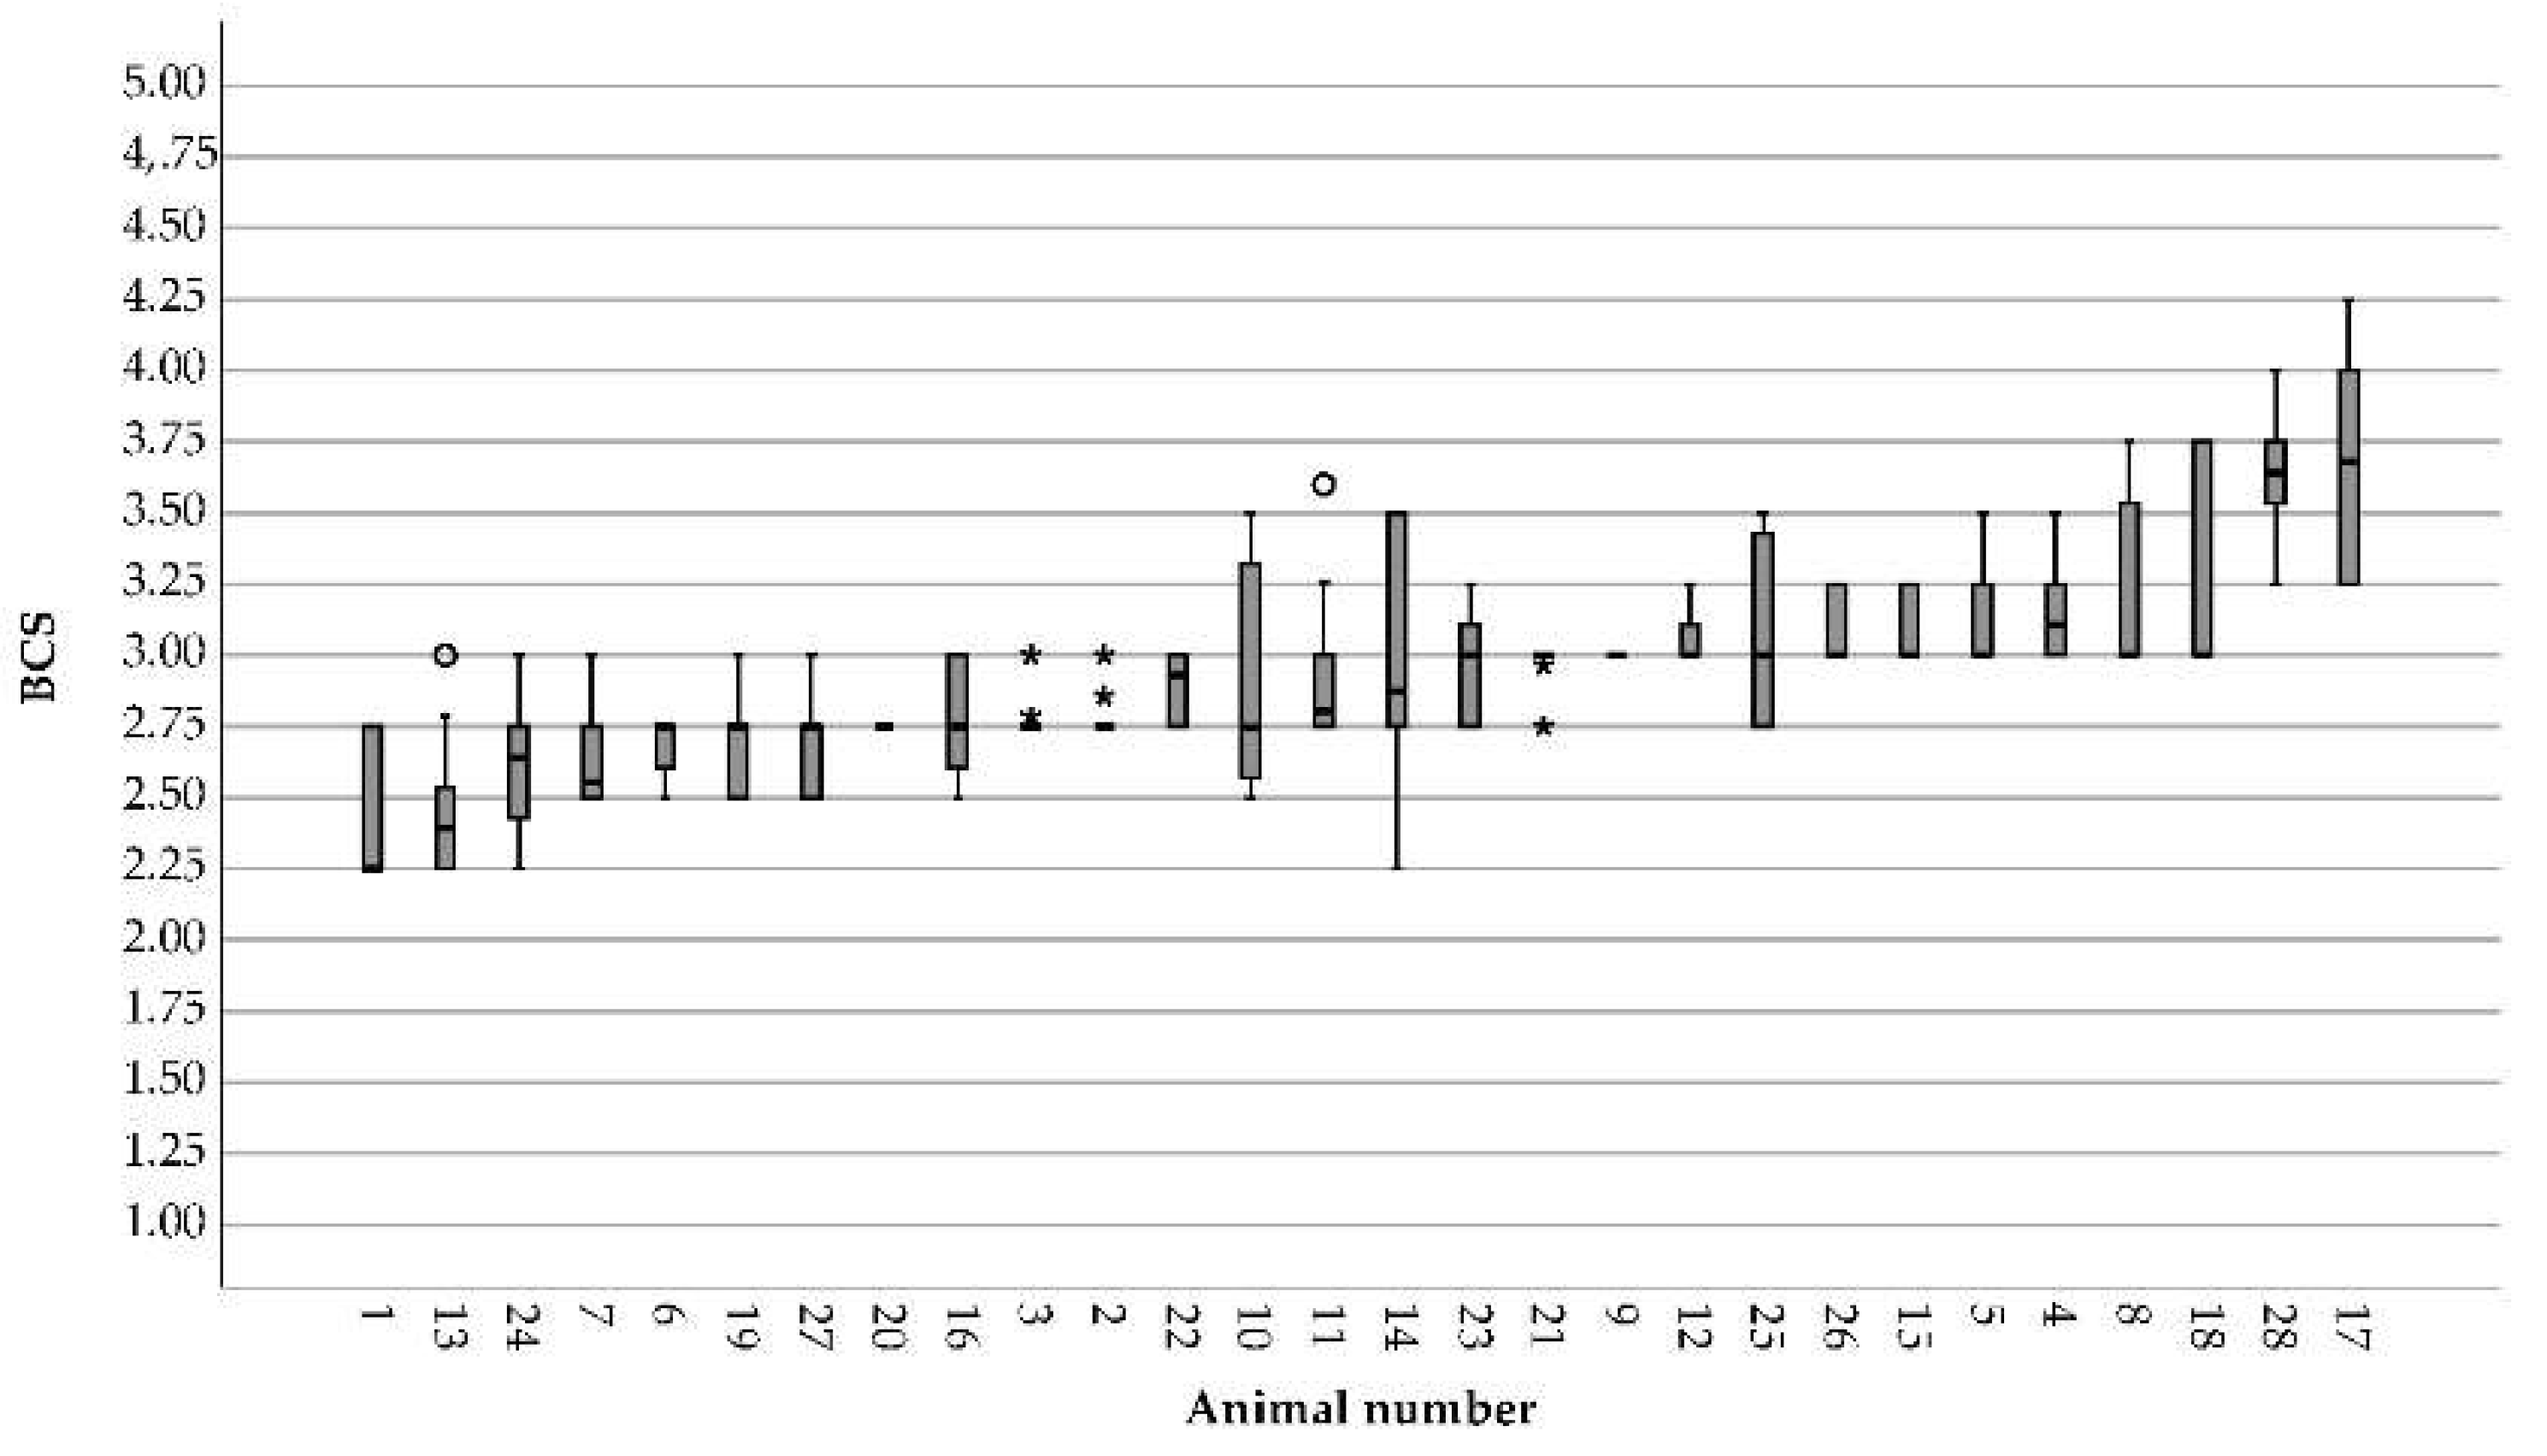
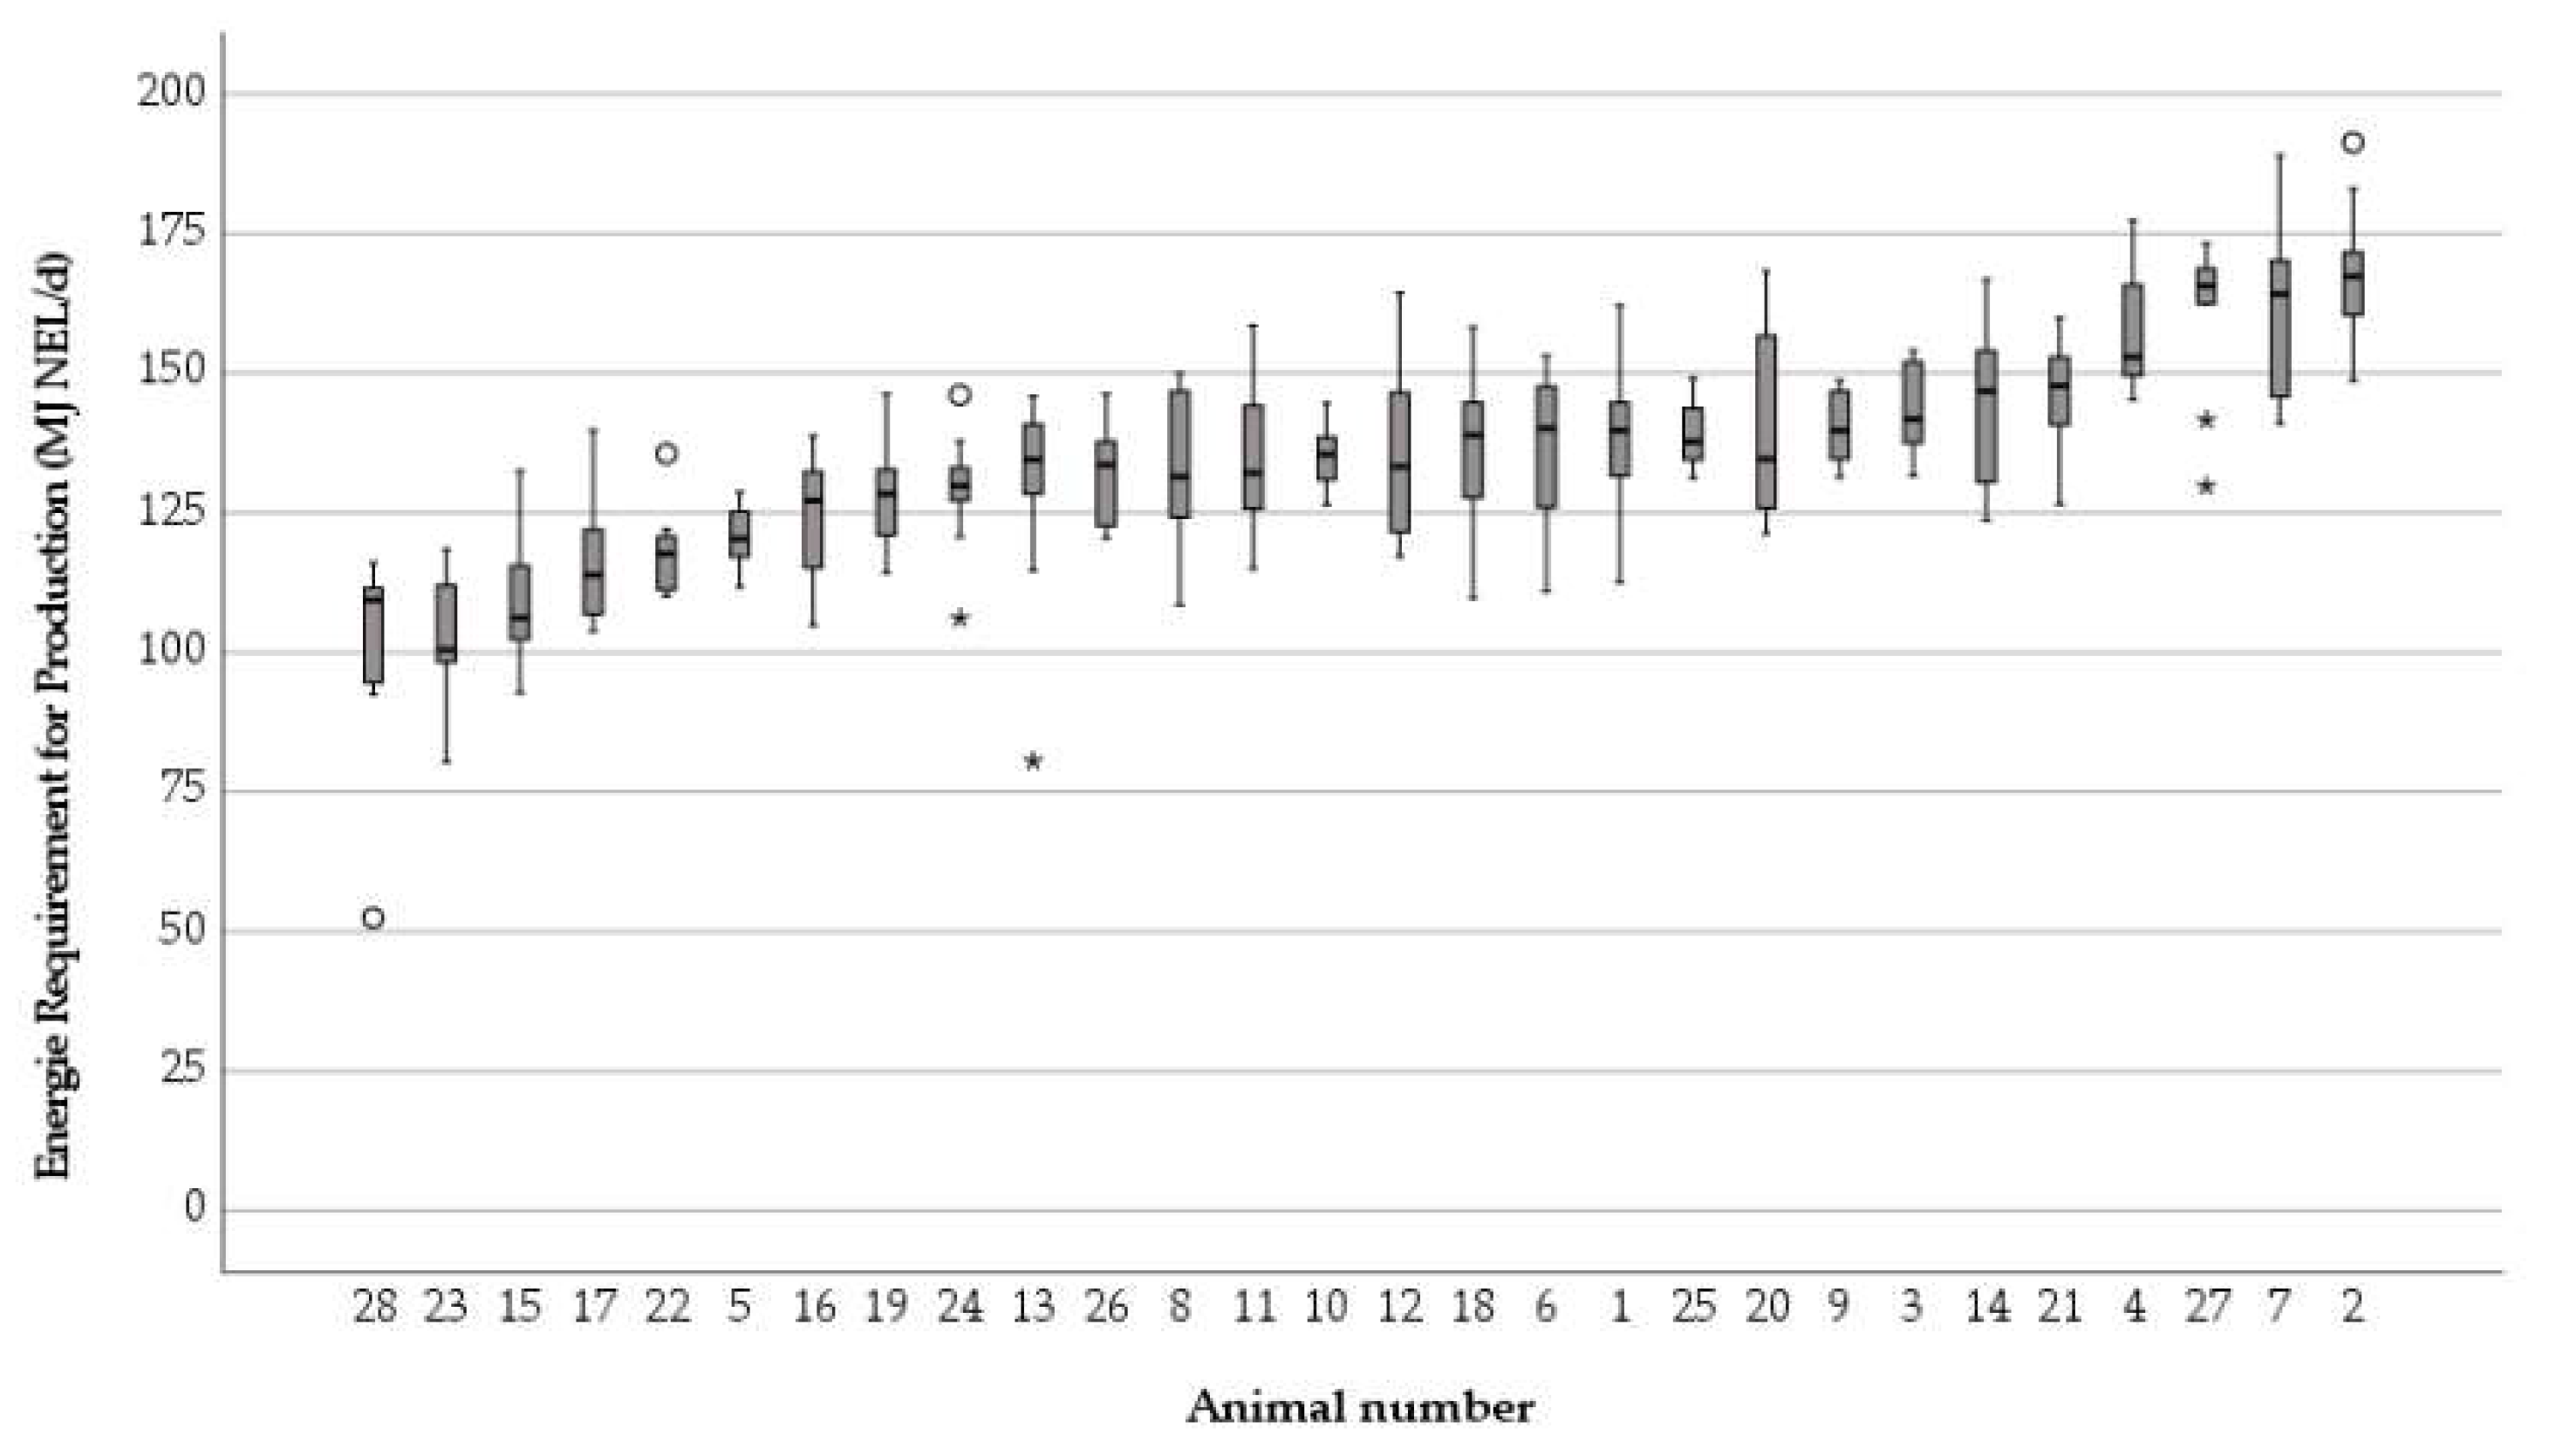
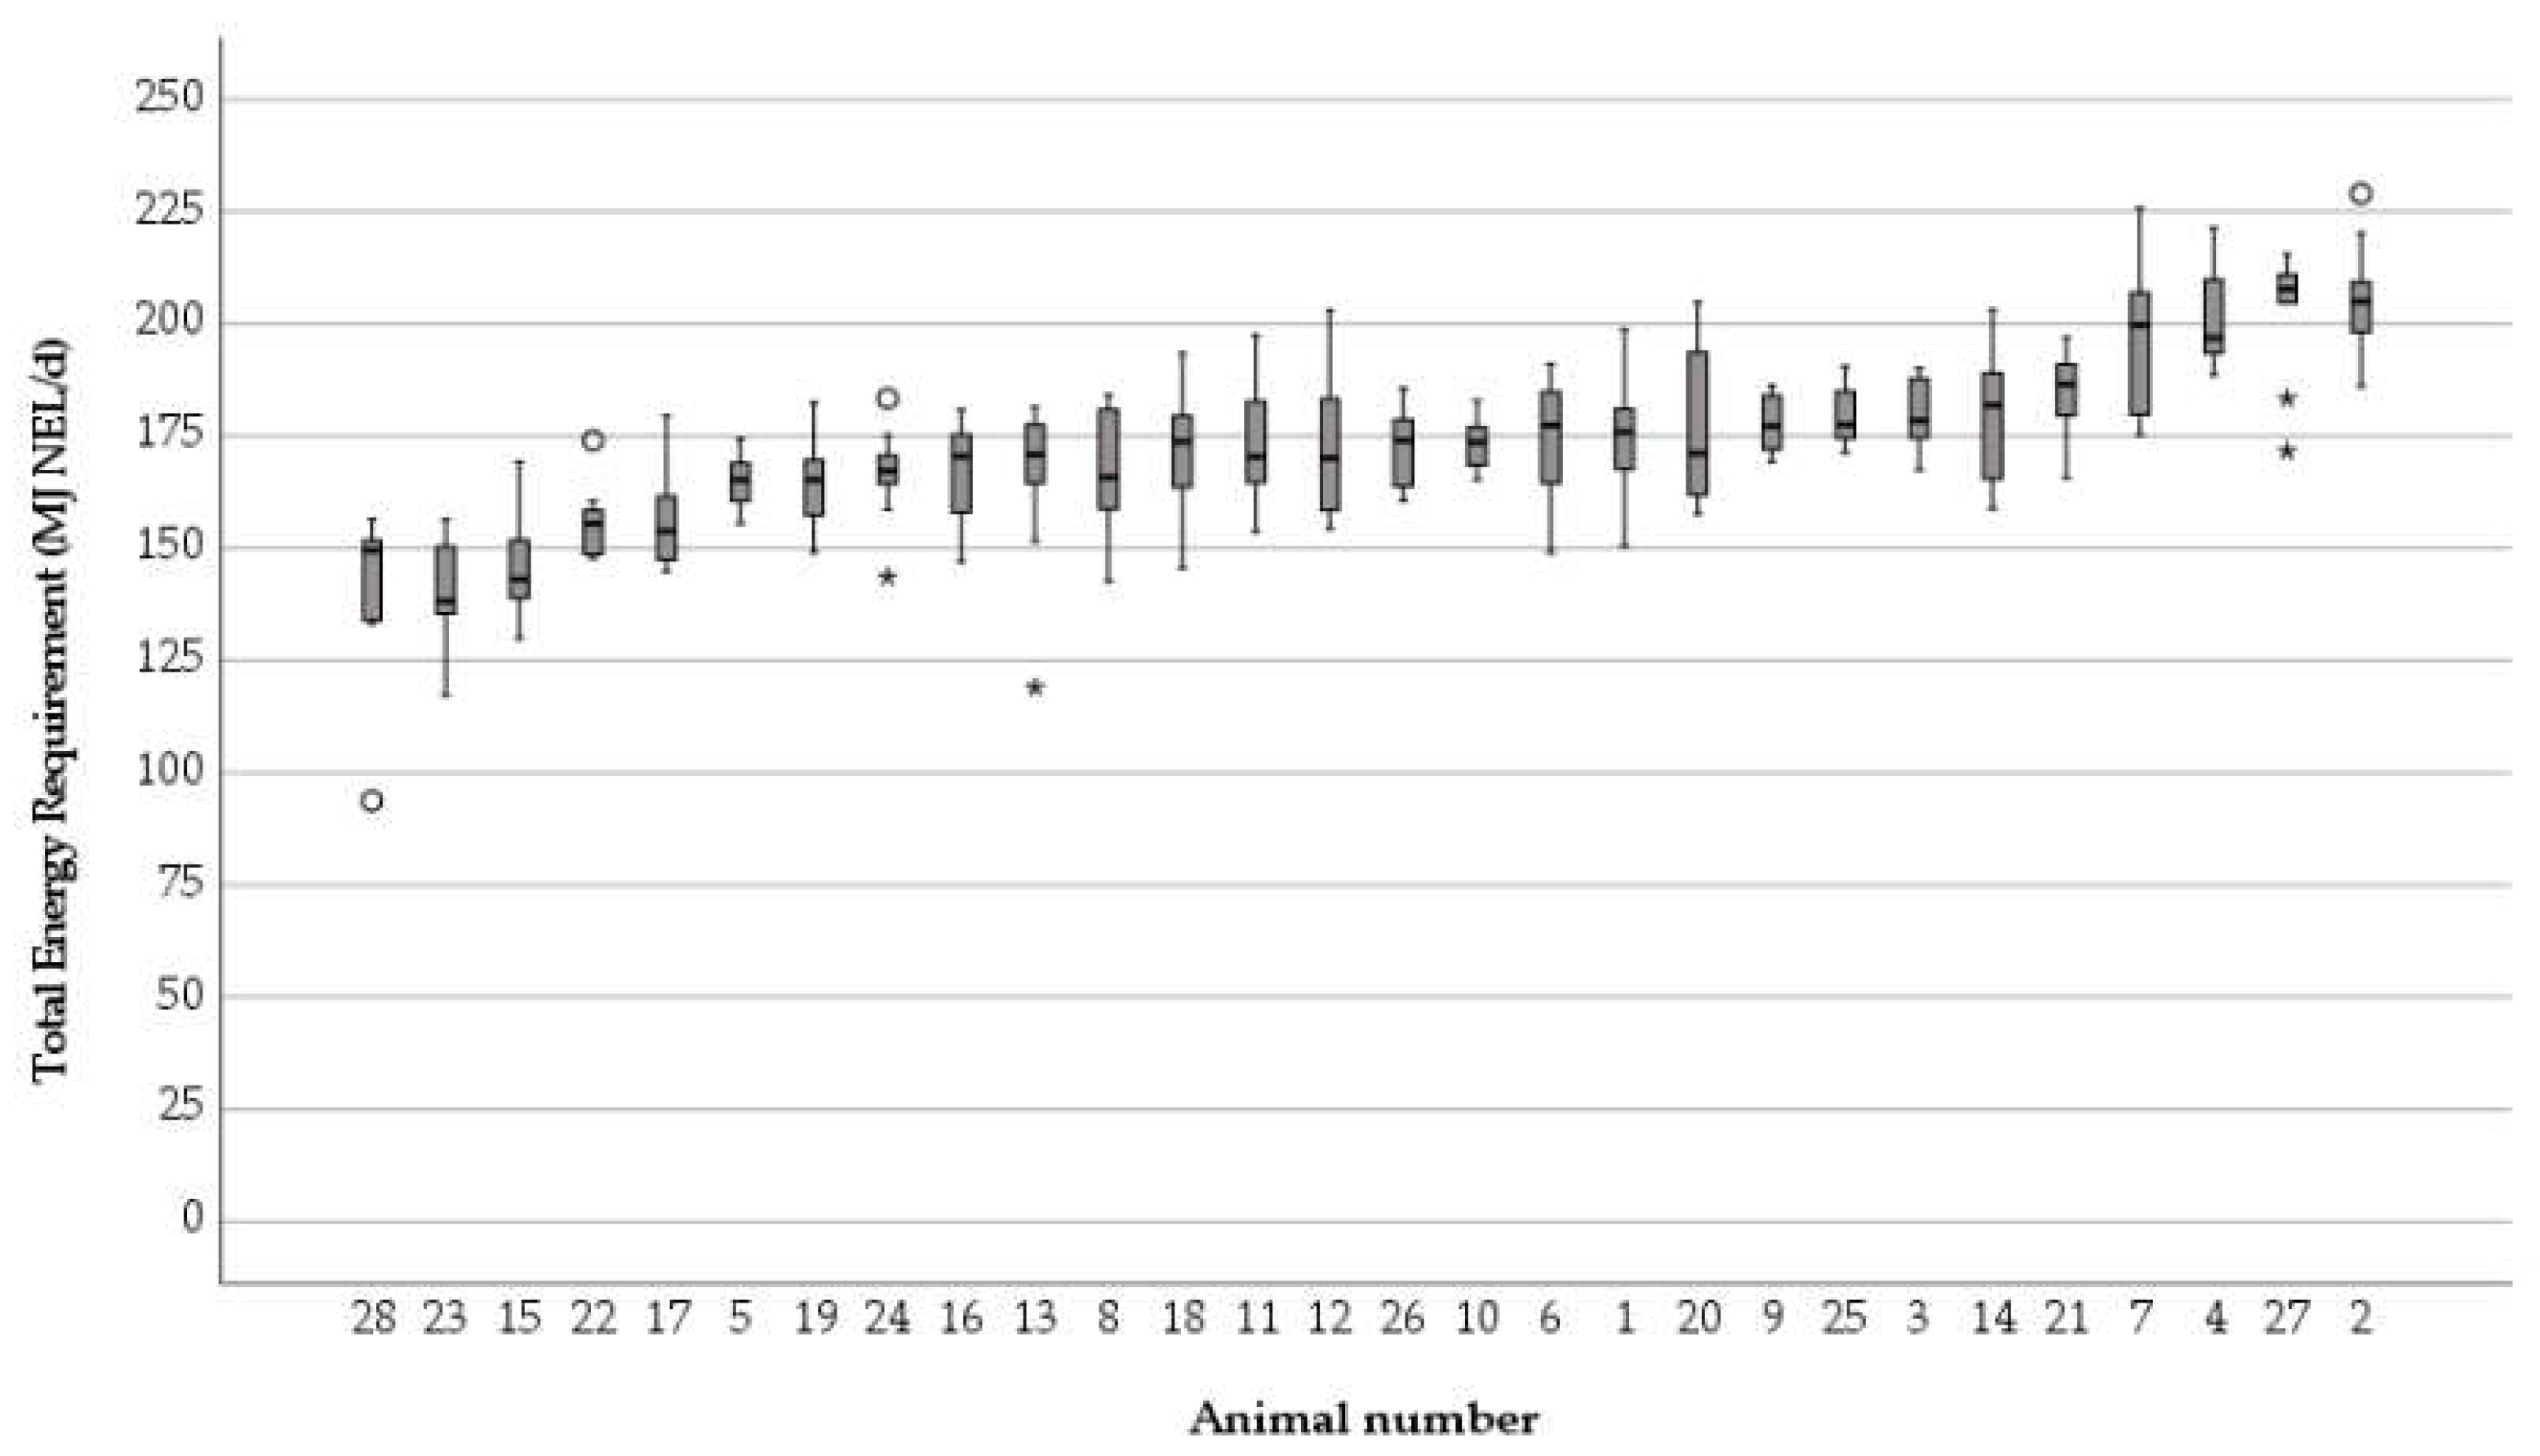
3.2. Variation of Energy Requirement Parameters

Body weight decreased from 669.7 ± 58.8 kg in week 2 to 659.4 ± 64.1 kg in week 12 and was not significantly different over the trial period. Mean individual cow BW during the trial period ranged between 593.7 ± 11.5 and 818.3 ± 19.7 kg and the CV varied between 0.01 and 0.05. ECM reached a mean value of 42.9 kg ECM and significantly increased with a linear (p < 0.001; η2 = 0.628) trend from a mean value of 43.3 ± 8.8 kg ECM per day in week 2 up to 44.6 ± 7.1 kg in week 4. Thereafter, ECM varied until the 15th week of lactation between 40.3 and 43.9 kg. Weekly CV values of ECM ranged between 0.1 (week 11) and 0.2 (week 2). Mean individual cow ECM between weeks 2 and 15 of lactation ranged between 32.1 ± 6.4 kg and 53.4 ± 3.4 kg ECM per day (p = 0.00; η2 = 0.740) and the CV of ECM ranged between individual animals from 0.04 to 0.2.
Energy requirement for maintenance (ERM) varied between 38.5 ± 2.6 (week 2) and 38.0 ± 2.8 MJ NEL (week 12). Mean individual ERM ranged between 34.3 ± 0.3 and 44.8 ± 0.8 MJ NEL and CV values varied between 0.01 and 0.04.
Energy requirement for production (ERP) decreased in a linear trend (p < 0.001; η2 = 0.633) from 140.8 ± 21.8 (week 3) to 126.2 ± 14.5 MJ NEL in week 15. Mean individual ERP varied between 100.6 ± 20.0 and 167.6 ± 10.8 MJ NEL between individual cows and CV values ranged between 0.04 and 0.2 (Figure 6).
Total energy requirement (TER) had a mean of 172.6 MJ NEL/d and decreased in the same way as ERP (p < 0.001; η2 = 0.314) from 174.8 ± 28.0 (week 2) to 164.5 ± 14.4 MJ NEL/d in week 15. CV varied between 0.16 in week 2 and 0.07 in week 11. Mean individual TER varied between 140.9 ± 19.7 and 205.2 ± 10.7 MJ NEL/d between individual cows (Figure 7). CV values ranged between 0.03 and 0.14. The share of ERM in the TER was 22.4% on average and varied between a 16.3% at minimum and 44.0% at maximum.
In contrast, the share of ERP in TER averaged 77.6% with a minimum of 56% and a maximum of 83%. On average, TER was 1.3 times higher than TES. The minimum TER was 0.9 times and the maximum 2.4 times above the TES. Linear regression showed a strong positive trend for CV of ERP (0.727, p < 0.01), indicating that the variation in TER is essentially influenced by the variation in ERP. Variation in ERM showed no significant effect on variation in TER (−0.057, p = 0.610).

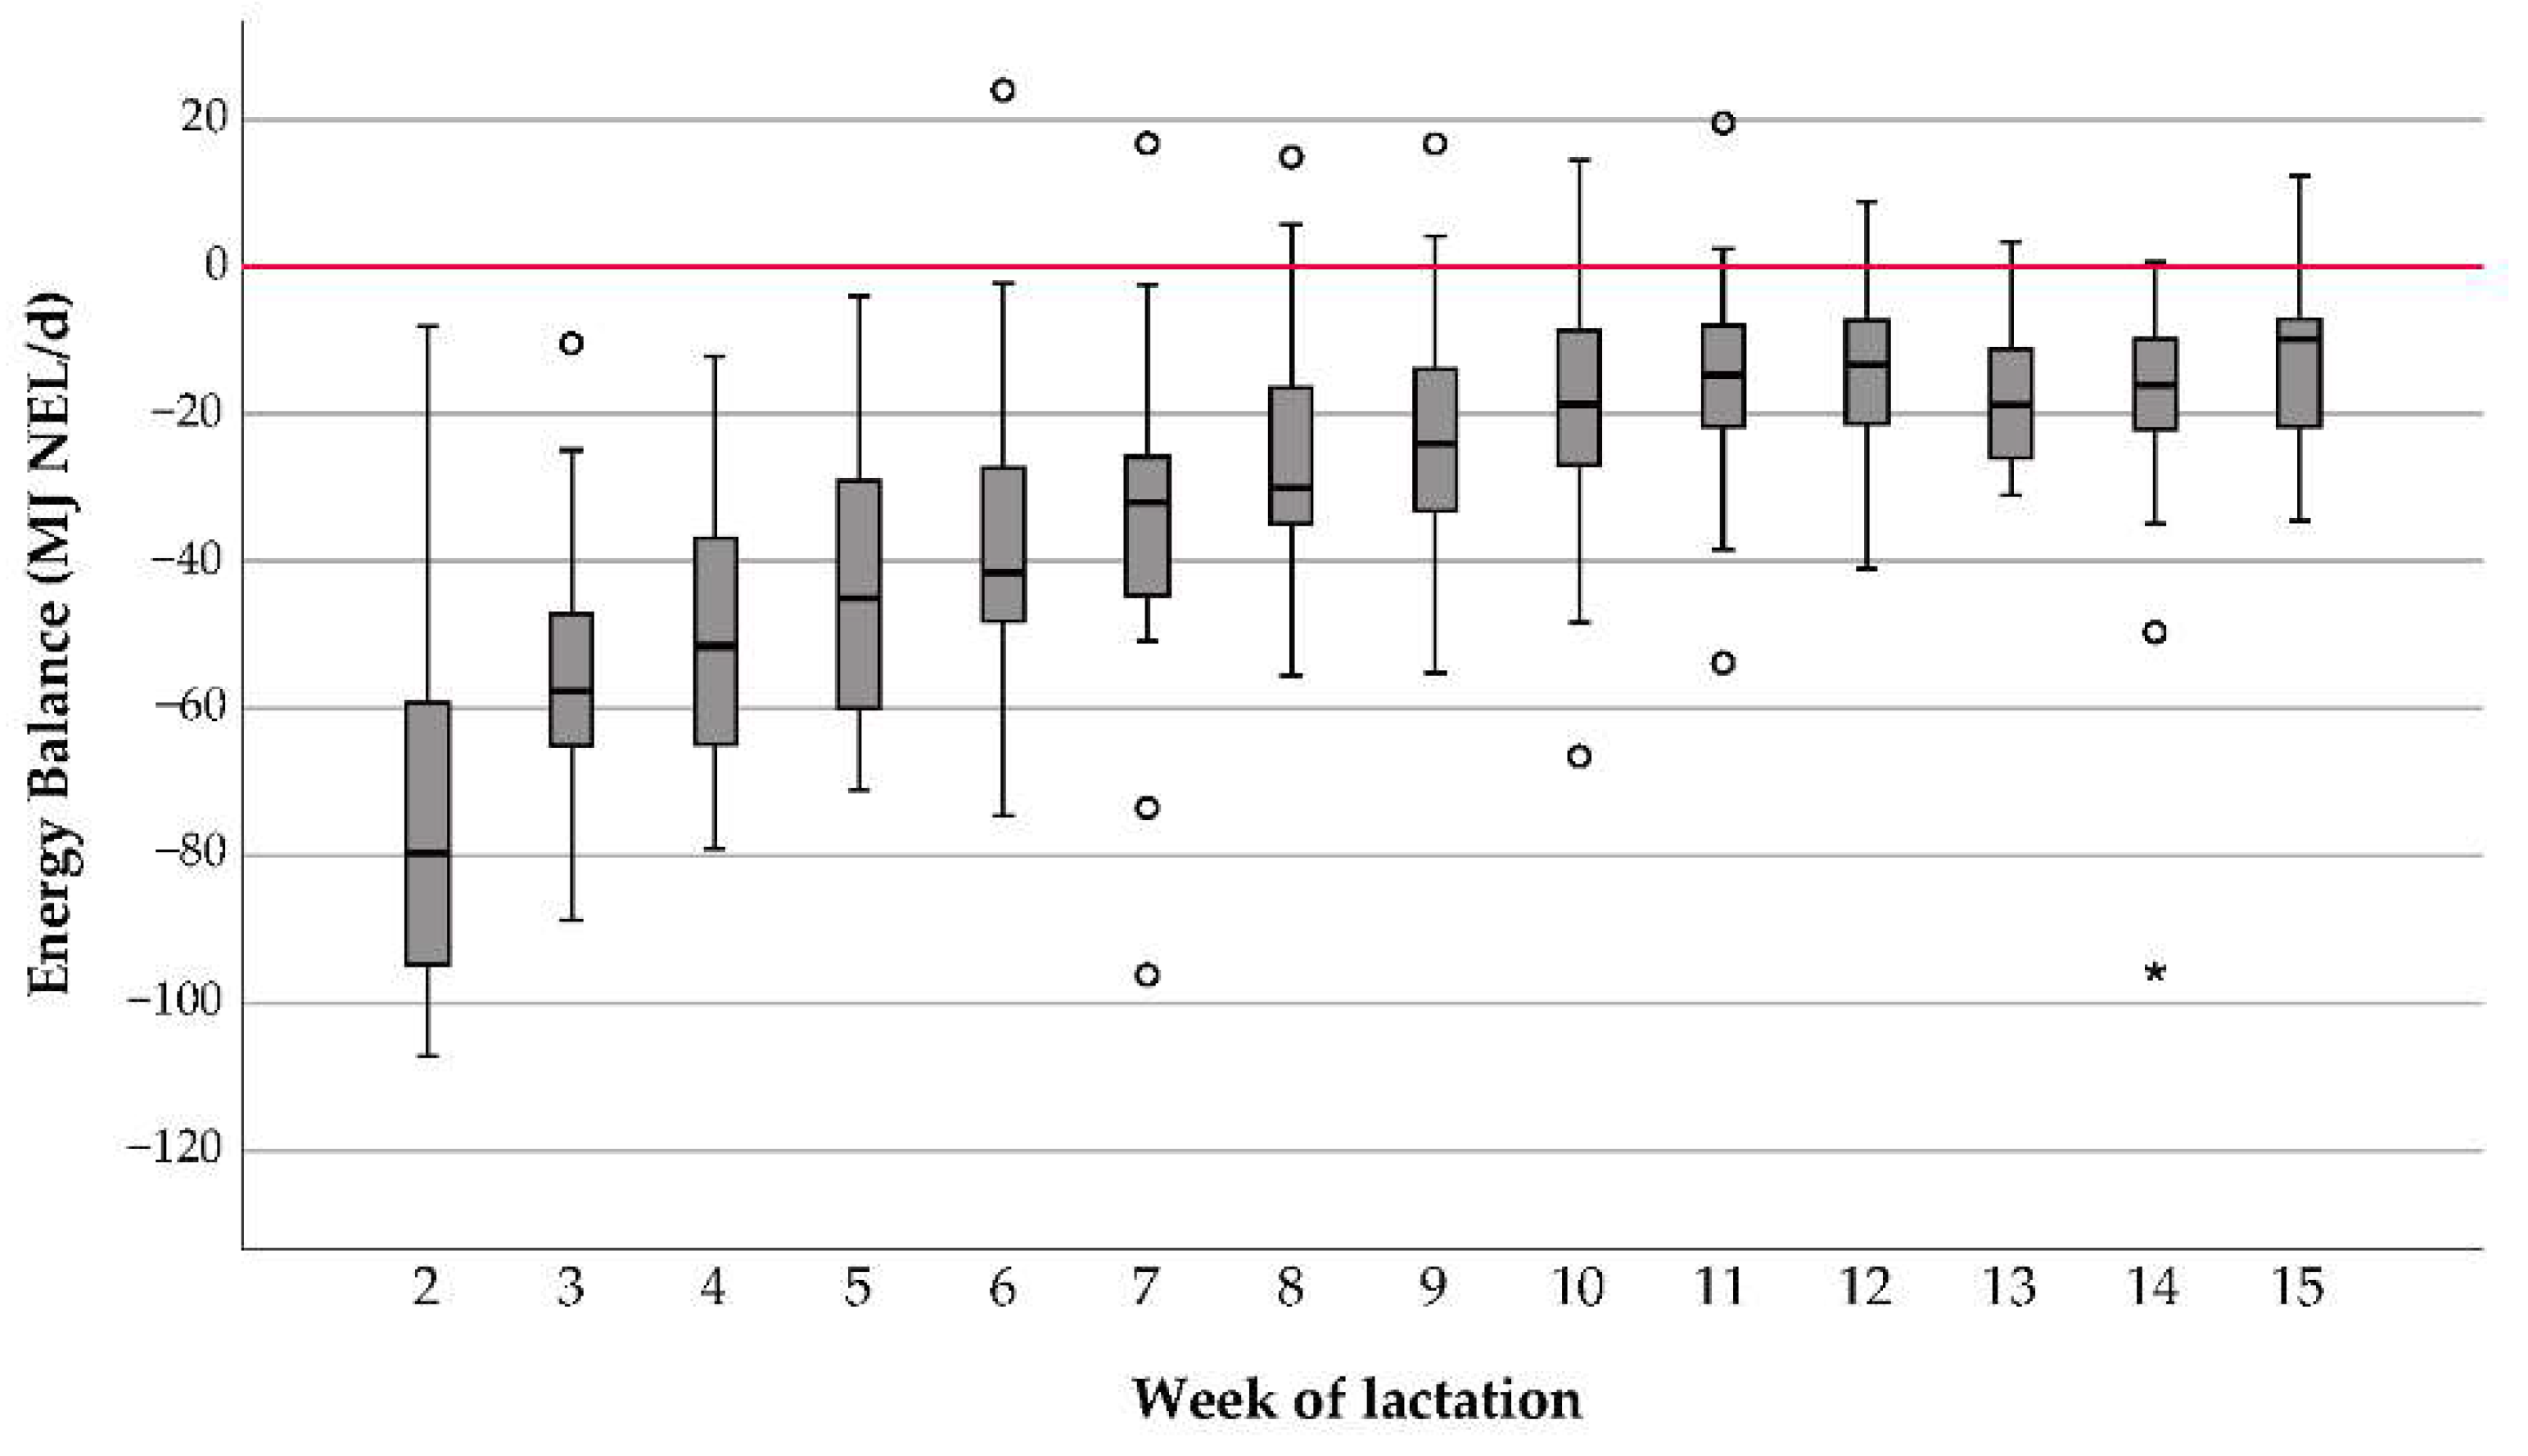
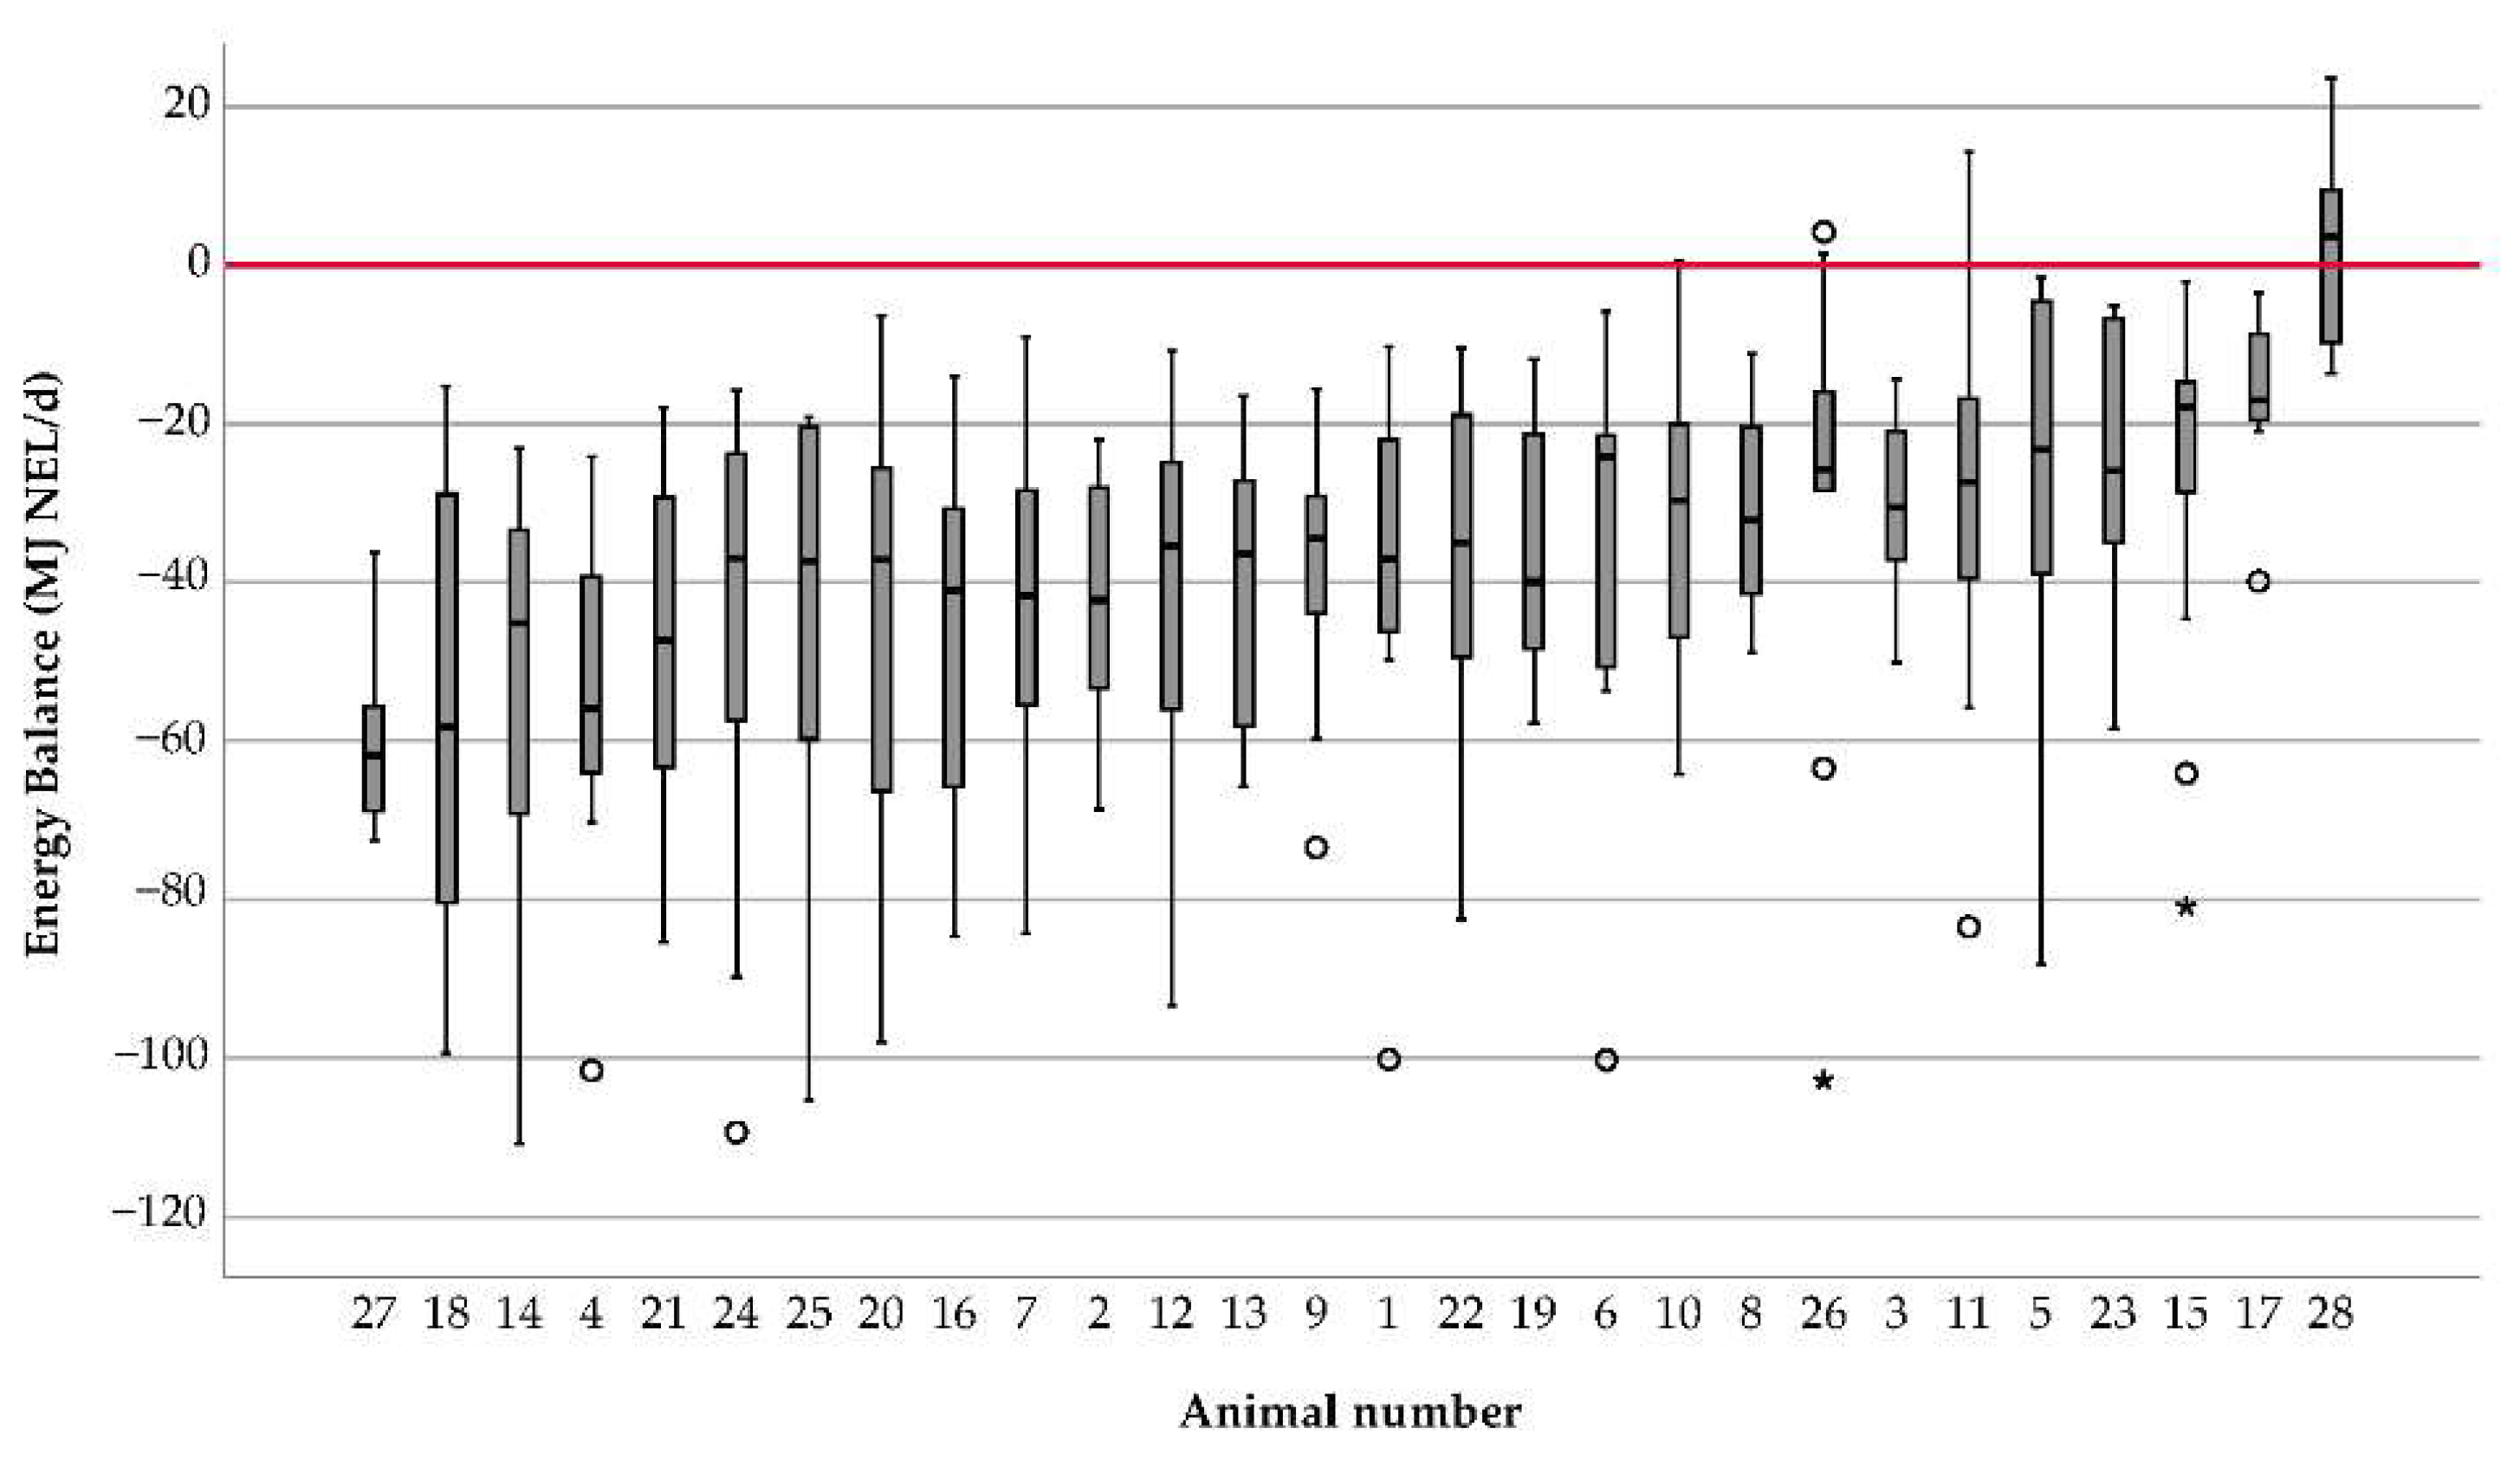
3.3. Variation of Energy Balance during Early Lactation

The values of the calculated energy balance (EB) increased with a linear (p < 0.001; η2 = 0.895) and quadratic (p < 0.001; η2 = 0.584) trend from −74.8 ± 24.9 MJ NEL/d in week 2 to −12.4 ± 12.2 MJ NEL/d in week 15 (Figure 8). CV values varied between 0.32 in week 3 and 1.01 in week 10.
Mean individual cow EB ranged between −56.4 ± 13.6 kg and 5.2 ± 14.0 MJ NEL/d (p = 0.00; η2 = 0.675), as shown in Figure 9. The CV of EB during the trial period ranged from 0.24 and 2.68 between individual animals.
Other parameters to describe the extent of NEB in early lactation were the timepoint and the value of the nadir. A total of 71% (n = 20) of the dairy cows reached the nadir in weeks 2 and 3 with a mean value of −82 MJ NEL/d. A total of 25% (n = 7) reached the nadir between weeks 4 and 7 with a mean value of −49 MJ NEL/d. One cow achieved the nadir in week 10 with a value of −13 MJ NEL/d. These values also showed a large variation in the course of energy balance in early lactation.
No significant correlation between BCS and EB and BCS changes and EB could be detected over the weeks of lactation (p > 0.05; −0.07) but mean BCS and mean EB of the individual dairy cows were significantly positive correlated (p = 0.025; 0.42).
To further analyze the cows with different energy balances, the cows were retrospectively grouped in quartiles based on average energy balance between weeks 2 and 15 of lactation. Cows with the lowest mean energy balance between weeks 2 and 15 of lactation reached higher values than cows in the other quartiles in mean milk yield (p < 0.05), milk fat content, fat:protein ratio (p < 0.01), ECM yield (p < 0.01), energy requirement for production (p < 0.05), and total energy requirement (p < 0.05), but also reached the lowest mean DMI, the lowest energy supply, and the lowest energy balance (p < 0.001). Milk protein content was highest in the upper quartile (p < 0.01) (Table 3).
Linear regression between sub-variables and EB showed a strong positive trend for the CV of ECM (p < 0.01), indicating that the variation in energy balance is essentially influenced by the variation in milk yield. Variation in DMI or OMD showed no significant effect on variation in EB (Table 4).

4. Discussion

In the conventional approach, energy balance is often deduced from a modeled curve for an average cow in a group or herd [43], with individual animals in a group or herd usually deviating from this virtual cow. However, neither deviations from the average nor variations in sub-variables and the corresponding EB between individual animals and over time are usually unconsidered [26].

4.1. Variation in Energy Supply Variables

Feed intake, defined as DMI per day, is the most important component of nutrient and energy intake in dairy cows. During the study, DMI increased from a mean of 14.3 ± 2.3 kg in week 2 to 22.1 ± 2.3 kg in week 11. This course was similar to the course described by Kessel et al. [44]. The mean between-cow CV in DMI during the trial period was 0.13, with a range between 0.09 (week 9) and 0.17 (week 2). The mean CV was similar to the between-cow CV value of 0.14 we estimated from the meta dataset of Huhtanen et al. [45] and slightly lower than the CV value of 0.18 we estimated from the meta dataset of Cabezas-Garcia et al. [46] and the CV of 0.20 between days 5 and 100 of lactation reported in Collard et al. [11]. Besides the large variation between dairy cows, there was a large variation in DMI with CV values between 0.05 and 0.25 within individual cows during early lactation. This makes an accurate prediction of DMI for individual animals nearly impossible. Although the variation in DMI has often been described, it has not yet been considered in the assessment of energy balance. The large variations in DMI can be explained by interactions between a variety of influencing factors.
Besides the factors of feed composition, environment, and management, which were the same for all animals in this study, DMI was affected by the number of meals consumed per day, the length of meals, and the rate of eating during meals as well as by different mechanisms that may affect the total daily DMI between cows [47,48]. These can be roughly divided into physical (e.g., rumen filling), endocrine (e.g., gut peptides), and metabolic (e.g., oxidation of fuels) regulatory mechanisms that additively decide when to start or stop a meal [49,50]. However, social interaction and possible social stress due to ranking as well as health status and milk yield also influence DMI levels [48,49].
Differences of up to 6.7 kg DMI/d were found when comparing predicted DMI to measured DMI (Table 2). Although the accuracy of the Gruber model was high compared to other estimating equations [37], the results once again show that estimating animal-specific feed intake based on herd average values is not very reliable. This applies even more so given the dynamic developments within individual animals during early lactation.
Despite the difference in the feeding ration compared to other studies, the mean value of OM (729 g/kg DM) was only slightly lower than the mean value of Cabezas-Garcia et al. [46], who reported a mean value for OM of 740 g/kg DM, which was very similar to the OM digestibility value of 728 g/kg presented in a meta-analysis by Huhtanen et al. [51] and also to the TDN value of the TMR (732 g/kg). The mean between-cow CV of OMD during the trial period was 0.03, with a range between 0.02 and 0.03. In recent meta-analyses, lower CV values of OMD of 0.014 [52] and 0.013 [46] were reported. The results demonstrate that there is comparably little variability among early-lactating dairy cows in their ability to digest a given diet. The individual cow CV was also low with a range between 0.02 and 0.04.
To facilitate comparability with the common method of EB calculation, total energy supply (TES) was calculated by multiplying DMI with the NEL value calculated with the TDN value of the TMR instead of the animal individual OMD. This is the reason why similar variations in TES and DMI were observed within and between animals.
During the first weeks after calving, when variations in DMI and TES between cows are especially relatively large, DMI and TES values gained from estimation formulars lack accuracy. Only by focusing on the individual animal and considering the animal-specific variation is it possible to obtain a more accurate assessment of the energy supply of the animals. The above-mentioned alternative calculations by means of estimation equations are currently not accurate enough at the individual animal level and require a high additional effort, which is in practice not accepted due to the limited possibilities of direct intervention (e.g., if the DMI is too low). Suitable technologies, especially for recording animal specific DMI, are not currently available in practice. At the same time, several projects are working on a way to measure feed intake [53].
In order to reduce the rate of animals in a group with insufficient energy supply, the establishment of feeding groups based on the nutrient and energy demand is one approach among others [54]. In this context, McGilliard et al. [55] suggested grouping cows by energy and protein requirements using clustering algorithms rather than by milk yield, as is traditionally done. Such grouping can reduce within-group variation and increase differentiation of a cross-group variation.

4.2. Variation in Energy Requirement Variables

Due to the early stage of lactation and the fact that only multi-lactating cows were considered in this study, only energy requirements for maintenance and performance and not for growth or pregnancy were considered with regard to energy output. Compared to our study, Poncheki et al. [56] reported a similar mean body weight for multiparous dairy cows at calving of 676.7 kg but a higher loss in body weight of up to more than 50 kg. Gross et al. [57] also described a greater body weight loss of around 56 ± 4 kg in the first weeks after calving, which is a response to NEB. Due to the comparatively small changes in body weight, the maintenance requirements only fluctuated moderately between 38.5 ± 2.6 (week 2) and 38.0 ± 2.8 MJ NEL (week 12), but high variation with CV values between 0.01 and 0.04 could be detected. Being only an average of 24% of total energy requirements, maintenance energy requirements played a rather subordinate role in the variables influencing the energy balance. Furthermore, they can be well determined, and changes can be readily identified in practice by regular animal weighing.
Milk production was high with a mean value of 45.9 ± 6.2 kg/d and was similar to values in other experiments in which cows were fed a diet with 160 g/ kg CP and 7.0 MJ NEL/kg DM during early lactation [58]. Azizi et al. [59] also reported similarly high ECM yields during early lactation in multiparous dairy cows with a mean of 44.5 kg/d with a similar level of energy concentration in the rations (6.99 MJ NEL/kg DM). Weekly CV values of EM ranged between 0.1 (week 11) and 0.2 (week 2). Besides the large variation between dairy cows, there was a large variation in ECM with CV values between 0.05 and 0.25 within individual cows during early lactation, which also resulted in a large variation in energy requirement for production. Furthermore, the variation in ECM showed a significant influence on the variation in EB. DeVries and Veerkamp [43] and McParland et al. [60] also reported a negative genetic correlation (−0.29) between milk yield and predicted EB. In contrast to the energy requirement for maintenance, the energy requirement for production was much higher and accounted for nearly 78% of total energy requirement, and is thus critical to the level of energy balance. The level and variation of energy requirements for maintenance and production resulted in a wide variation of total energy requirements between animals, especially at the beginning of lactation.
However, total energy requirements of individual animals also varied during the experimental period with CV values ranging from 0.03 to 0.14. At the minimum, TER averaged 140.9 ± 19.7 and at the maximum, 205.2 ± 10.7 MJ NEL/d. This range shows that it is almost impossible to compare the energy requirements of animals kept and fed under exactly the same conditions and at the same stage of lactation. However, because McNamara [61] also described a variation in energy requirements for cows kept under similar conditions, the observed variation between individual cows can be considered as usual in herds. Because of the huge variation and the importance of the amount of energy requirement, it is necessary to control the sub-variables of energy requirement. To control energy requirement for production, milk quantity and quality records can already be used in practice to regularly collect data, map lactation curves, and identify changes in energy requirement. In addition to recording live weight and calculating the energy requirement for maintenance, this data also allowed for a comparatively good estimate of energy requirements for production. However, because of a lack of suitable processing and linking of the data as well as suitable animal-specific instructions for action, the step of calculating energy requirements is currently still mostly omitted in practice. With regard to the potential further development of on-farm technical hardware and software, a first could be conducted to record the level of animal-specific energy supply and reconcile it with the demand.

4.3. Variation in Energy Balance

Due to the exact recording of the sub-variables and the realizable comparison of supply and demand, it was possible to map the animal-specific energy balance during lactation. The values of the calculated energy balance (EB) increased during the experimental period from −74.8 ± 24.9 MJ NEL/d in week 2 to −12.4 ± 12.2 MJ NEL/d in week 15. Variation in the variables resulted in an increase in the CV of EB. The CV varied from 0.32 at week 3 to 1.01 at week 10. Mean individual cow EB ranged from −56.4 ± 13.6 kg to +5.2 ± 14.0 MJ NEL/d (p = 0.00; η2 = 0.675) (Figure 9). The CV of EB during the experimental period ranged from 0.24 to 2.68 between animals. This corresponded to the results obtained by Beerda et al. [20], Kessel et al. [44], and Jorritsma et al. [26], who reported a large energy deficit and a large variation between animals during this period. A total of 71% of the trial cows reached the nadir in weeks 2 and 3 with a mean value of −82 MJ NEL/d. These results are similar to the course observed by DeVries et al. [62] and Jorritsma et al. [26], who described a timeframe between 2.5- and 12-days p.p. in which most cows reached the lowest of all EB values. Furthermore, the study revealed a wide variation in the depth of the nadir between individuals. In a study investigating the onset of luteal activity in association with NEB, DeVries and Veerkamp [43] also reported a wide variation in the depth of the nadir between individuals. In a further study, the balance between energy supply and energy requirement was on average attained at approximately week 10 p.p. (72 d p.p.) [62]. Other studies reported an achievement of positive EB on average in week 6 p.p. (day 41.5 [43] and 45 [63]) with a range of one to 15 weeks (7 and 105 days), respectively, and a standard deviation of three weeks (21 days). In the present study, only 25% (n = 7) reached a positive energy balance by week 15 p.p., indicating a comparably long period of NEB. A common EB pattern during early lactation is a negative start after calving, followed by a steady increase and then a decrease after return to positive values and stabilization after 17 to 21 weeks p.p. [62]. In order to confirm and establish a continuation of progression, it is necessary to choose a period beyond the 15th week of lactation for future studies. Nevertheless, it is self-explanatory that the longer the duration of NEB, the greater the difficulty for a cow to metabolically adapt [44].
Between cows under standardized conditions, a large variation in numerous parameters was also observed in other dairy related areas. For example, Kessel et al. [44] described remarkable differences in the concentrations of metabolites and hormones during the first weeks after calving. This indicates that the ability to adapt to the metabolic challenge varies greatly between individual animals. Similar results were shown by the comparison of the three groups formed retrospectively based on average EB (Table 3). Animals with a particularly large energy deficit in the first weeks after calving showed the highest milk yield, the highest milk fat content, the lowest milk protein content, the highest fat:protein ratio, and the highest ECM performance. High milk fat content and low milk protein content are the results of postpartum body fat mobilization caused by the energy deficit. The resulting elevated fat:protein ratio can be used as a first indicator of a negative energy balance. If the fat:protein quotient rises above 1.3 in the first weeks after calving, an increased risk of ketosis can be assumed [64,65]. Overall, these animals showed the lowest energy intake, caused by the lowest DMI and at the same time, the highest energy requirement and the highest OMD. A reason for the highest OMD could be the deficient situation caused by low DMI, where digestion is more effective because of a lower passage rate [24,25].
As part of an additional animal check, the BCS of the individual animals was also assessed during the course of lactation. In practice, this is often used as an indicator for the energetic deficit of the cows as it can be determined relatively easily under farm conditions. In this study, animals with a particularly large energy deficit in the first weeks after calving reached the highest BCS and BW changes between weeks 6 to10, whereas animals with medium or lower energy deficit reached the highest negative changes between weeks 2 to 5. In addition, the group of animals with the largest deficit was not able to reach positive BW changes during the course of study and reached peak milk nearly a week later (week 4.7; 51.8 kg ECM/d) with the highest peak milk in comparison to the average value of the group with the lowest deficit (week 4.0; 44.4 kg ECM/d) during the first weeks after calving. In the presented study, the group of animals with a particularly large energy deficit in the first weeks after calving was not able to adjust their body fat mobilization to the level of energy needed for milk yield. If sufficient energy cannot be provided by body fat mobilization, there is an increased risk of disease due to metabolic overload [16]. The variation in peak milk, BW, and BCS changes were high and only a low correlation between the mean EB and the mean BCS value was found. No correlation could be proven between the EB and BCS values in the course of lactation. The BCS is suitable for monitoring the body condition of the animals, the observation of which is particularly important at the beginning of lactation, but in this study can be seen to have only a slight correlation with the extent of the calculated energy balance. Other ways to monitor health status may include the measurement of blood plasma NEFA concentration, but these were not determined in this study. Both factors have already been demonstrated as indicators of NEB in other studies [29,66], but do not allow for mapping of the extent of variation between individuals nor identification of the causal variable responsible for NEB. However, with the help of energy balancing, it is possible to address several components and thus obtain a comprehensive overview of the energy situation of the animals. This is highly relevant, especially with regard to the close link between negative EB and the occurrence of production diseases. To achieve a long-term reduction in production diseases through the early detection of animals at particularly high risk, knowledge of individual energy and nutrient availability as well as the corresponding variables and the variation within and between dairy cows is of great importance, especially in early lactation. The high variation in the sub-variables of the energy balance between and within cows during early lactation indicates the necessity to monitor the available nutrient and energy amount on an individual animal basis. In addition to monitoring, there is also a necessity for continuous adjustment of demand and supply [67]. Only when the extent of NEB and the variation between individual animals is known can target oriented options for action be taken. A less frequently discussed potential management measure to improve NEB in early lactation is to temporarily reduce milking frequency, for example, to once-daily milking at the beginning of lactation [68,69,70]. Lower milking frequency at the beginning of lactation reduces energy loss for milk production. This results in less metabolic disturbance and a reduction in immunosuppression without negative effects on the rest of lactation [70].
However, in the long-term, breeding objectives must be modified to focus on a more consistent lactation curve, lifetime performance, and longevity rather than milk yield and peak performance. The concentration on breeding for increased milk yield has simultaneously resulted in lower energy balances and continued focus on performance improvement can be expected to have serious consequences for cow metabolism, animal health, and failure costs [9,60].

5. Conclusions

The results of the present study showed a large intra- and interindividual variation in the sub-variables of energy requirements, energy supply, and finally, in energy balance during early lactation. When farm management is challenged to balance the trade-offs in dairy production between animal needs and economic demands, the results indicate the need to monitor available nutrient and energy levels on an individual animal basis and to continuously adjust energy supply. To date, little consideration has been given to the variation in energy supply between and within individual animals over a period of time because of the difficulty in collecting the information needed to calculate EB under practical conditions. The variation between individual animals as well as the extent of the negative energy balance show that the current herd-based approach to assessing the energy situation is not sufficiently target-oriented in determining the animal-specific requirements and enabling a supply that meets the requirements. In order to achieve economically fundamental long-term reductions in production diseases and a consequent containment of useful lifespans by early identification of animals with a particularly high risk of production diseases, knowledge of the individual energy and nutrient availability, corresponding sub-variables, and the variation within and between dairy cows is essential, especially in early lactation. The focus on individual animal care pays off by reducing health and economic risks and thus represents a good investment, regardless of the individual farm situation.

Author Contributions

Conceptualization, T.R. and A.S.; Formal analysis, T.R.; Investigation, T.S.; Resources, C.K.; Data curation, T.R.; Writing—original draft preparation, T.R.; Writing—review and editing, T.S., C.K. and A.S.; Visualization, T.R.; Supervision, A.S. All authors have read and agreed to the published version of the manuscript.

Funding

This research received no external funding.

Institutional Review Board Statement

All procedures described in this study were performed according to the German Animal Welfare Act and approved by the local authority for animal welfare affairs (Landesuntersuchungsamt Rheinland-Pfalz; G 18-20-073) in Koblenz, Germany.

Informed Consent Statement

Not applicable.

Data Availability Statement

The data presented in this study are available on request from the corresponding author.

Acknowledgments

The authors thank the staff at the Educational and Research Center for Animal Husbandry Hofgut Neumuehle and especially Michael Berger for their assistance during the trial. We are grateful to Regina Vickery-Grund for her critical review of the manuscript, and thank Susanne Hartmann, Petra Zahnwetzer, and the CVAS team for excellent technical assistance.

Conflicts of Interest

The authors declare no conflict of interest.

Abbreviations

ADFacid detergent fiber
ADFDdigestible acid detergent fiber
aNDFomneutral detergent fiber assayed with heat-stable amylase and expressed exclusive of residual ash
ANOVAanalysis of variance
CPcrude protein
CPDdigestible crude protein
CVcoefficient of variation
CVASCumberland Valley Analytical Services Inc.
DMdry matter
DMIdry matter intake
EBenergy balance
EEether extract
ESCethanol-soluble carbohydrates
GLMgeneralized linear models
iNDF240240 h in vitro indigestible neutral detergent fiber
IQRinterquartile range
LMMlinear mixed model
NDFDdigestible neutral detergent fiber
NEFAnon-esterified fatty acids
NEBnegative energy balance
NELnet energy for lactation
NIRSnear infrared reflectance spectroscopy
OMorganic matter
OMDdigestible organic matter
RICroughage intake control
RSErelative standard error
SDstandard deviation
SPsoluble protein
TDNtotal digestibly nutrient
TERtotal energy requirement
TEStotal energy supply
TMRtotally mixed ration

References

  1. Hansen, L.B. Consequences of Selection for Milk Yield from a Geneticist’s Viewpoint. J. Dairy Sci. 2000, 83, 1145–1150. [Google Scholar] [CrossRef]
  2. VandeHaar, M.J.; St-Pierre, N. Major Advances in Nutrition: Relevance to the Sustainability of the Dairy Industry. J. Dairy Sci. 2006, 89, 1280–1291. [Google Scholar] [CrossRef]
  3. Barkema, H.W.; von Keyserlingk, M.A.G.; Kastelic, J.P.; Lam, T.J.G.M.; Luby, C.; Roy, J.-P.; LeBlanc, S.J.; Keefe, G.P.; Kelton, D.F. Invited review: Changes in the dairy industry affecting dairy cattle health and welfare. J. Dairy Sci. 2015, 98, 7426–7445. [Google Scholar] [CrossRef] [Green Version]
  4. Bell, A.W. Regulation of Organic Nutrient Metabolism During Transition from Late Pregnancy to Early Lactation. J. Anim. Sci. 1995, 73, 2804–2819. [Google Scholar] [CrossRef]
  5. NRC. Nutrient Requirements of Dairy Cattle, 7th Revised ed.; National Academies Press: Washington, DC, USA, 2001.
  6. de Souza, R.A.; Tempelman, R.J.; Allen, M.S.; VandeHaar, M.J. Updating predictions of dry matter intake of lactating dairy cows. J. Dairy Sci. 2019, 102, 7948–7960. [Google Scholar] [CrossRef] [Green Version]
  7. Oltenacu, P.A.; Broom, D.M. The impact of genetic selection for increased milk yield on the welfare of dairy cows. Anim. Welf. 2010, 19, 39–49. [Google Scholar]
  8. Bauman, D.E.; Currie, W.B. Partitioning of Nutrients During Pregnancy and Lactation: A Review of Mechanisms Involving Homeostasis and Homeorhesis. J. Dairy Sci. 1980, 63, 1514–1529. [Google Scholar] [CrossRef]
  9. Sundrum, A. Metabolic Disorders in the Transition Period Indicate that the Dairy Cows’ Ability to Adapt is Overstressed. Animals 2015, 5, 978–1020. [Google Scholar] [CrossRef]
  10. Sordillo, L.M.; Raphael, W. Significance of metabolic stress, lipid mobilization, and inflammation on transition cow disorders. Vet. Clin. Food Anim. Pract. 2013, 29, 267–278. [Google Scholar] [CrossRef]
  11. Collard, B.L.; Boettcher, P.J.; Dekkers, J.; Petitclerc, D.; Schaeffer, L.R. Relationships Between Energy Balance and Health Traits of Dairy Cattle in Early Lactation. J. Dairy Sci. 2000, 83, 2683–2690. [Google Scholar] [CrossRef]
  12. Knight, C.H.; Beever, D.E.; Sorensen, A. Metabolic loads to be expected from different genotypes under different systems. BSAP Occas. Publ. 1999, 24, 27–35. [Google Scholar] [CrossRef]
  13. Butler, W.R.; Smith, R.D. Interrelationships Between Energy Balance and Postpartum Reproductive Function in Dairy Cattle. J. Dairy Sci. 1989, 72, 767–783. [Google Scholar] [CrossRef]
  14. Nebel, R.L.; McGilliard, M.L. Interactions of High Milk Yield and Reproductive Performance in Dairy Cows. J. Dairy Sci. 1993, 76, 3257–3268. [Google Scholar] [CrossRef]
  15. Domecq, J.J.; Skidmore, A.L.; Lloyd, J.W.; Kaneene, J.B. Relationship Between Body Condition Scores and Conception at First Artificial Insemination in a Large Dairy Herd of High Yielding Holstein Cows. J. Dairy Sci. 1997, 80, 113–120. [Google Scholar] [CrossRef]
  16. Habel, J.; Sundrum, A. Mismatch of Glucose Allocation between Different Life Functions in the Transition Period of Dairy Cows. Animals 2020, 10, 1028. [Google Scholar] [CrossRef]
  17. Habel, J.; Uhlig, V.; Hoischen-Taubner, S.; Schwabenbauer, E.-M.; Rumphorst, T.; Ebert, L.; Möller, D.; Sundrum, A. Income over service life cost—Estimation of individual profitability of dairy cows at time of death reveals farm-specific economic trade-offs. Livest. Sci. 2021, 254, 104765. [Google Scholar] [CrossRef]
  18. Langford, F.M.; Stott, A.W. Culled early or culled late: Economic decisions and risks to welfare in dairy cows. Anim. Welf. 2012, 21, 41–55. [Google Scholar] [CrossRef]
  19. van Soest, F.J.S.; Mourits, M.C.M.; Blanco-Penedo, I.; Duval, J.; Fall, N.; Krieger, M.; Sjöstrom, K.; Hogeveen, H. Farm-specific failure costs of production disorders in European organic dairy herds. Prev. Vet. Med. 2019, 168, 19–29. [Google Scholar] [CrossRef]
  20. Beerda, B.; Ouweltjes, W.; Šebek, L.; Windig, J.J.; Veerkamp, R.F. Effects of Genotype by Environment Interactions on Milk Yield, Energy Balance, and Protein Balance. J. Dairy Sci. 2007, 90, 219–228. [Google Scholar] [CrossRef]
  21. Roseler, D.K.; Fox, D.G.; Pell, A.N.; Chase, L.E. Evaluation of Alternative Equations for Prediction of Intake for Holstein Dairy Cows. J. Dairy Sci. 1997, 80, 864–877. [Google Scholar] [CrossRef]
  22. Martin, O.; Sauvant, D. Metaanalysis of Input/Output Kinetics in Lactating Dairy Cows. J. Dairy Sci. 2002, 85, 3363–3381. [Google Scholar] [CrossRef] [Green Version]
  23. Hristov, A.N.; Price, W.J.; Shafii, B. A Meta-Analysis on the Relationship Between Intake of Nutrients and Body Weight with Milk Volume and Milk Protein Yield in Dairy Cows. J. Dairy Sci. 2005, 88, 2860–2869. [Google Scholar] [CrossRef] [Green Version]
  24. Thornton, R.F.; Minson, D.J. The relationship between apparent retention time in the rumen, voluntary intake, and apparent digestibility of legume and grass diets in sheep. Aust. J. Agric. Res. 1973, 24, 889. [Google Scholar] [CrossRef]
  25. Mertens, D.R.; Grant, R.J. Digestibility and Intake. In Forages, 7th ed.; Collins, M., Nelson, C.J., Moore, K.J., Barnes, R.F., Eds.; Wiley Blackwell: Hoboken, NJ, USA, 2020; pp. 609–631. ISBN 9781119436669. [Google Scholar]
  26. Jorritsma, R.; Wensing, T.; Kruip, T.A.M.; Vos, P.L.A.M.; Noordhuizen, J.P.T.M. Metabolic changes in early lactation and impaired reproductive performance in dairy cows. Vet. Res. 2003, 34, 11–26. [Google Scholar] [CrossRef] [Green Version]
  27. Ferguson, J.D.; Galligan, D.T.; Thomsen, N. Principal Descriptors of Body Condition Score in Holstein Cows. J. Dairy Sci. 1994, 77, 2695–2703. [Google Scholar] [CrossRef]
  28. Hastie, T.; Tibshirani, R. Generalized Additive Models, 1st ed.; Chapman and Hall: London, UK, 1990; ISBN 978-0412343902. [Google Scholar]
  29. Thorup, V.M.; Edwards, D.; Friggens, N.C. On-farm estimation of energy balance in dairy cows using only frequent body weight measurements and body condition score. J. Dairy Sci. 2012, 95, 1784–1793. [Google Scholar] [CrossRef] [Green Version]
  30. AOAC International. Official Methods of Analysis of AOAC International; AOAC International: Gaithersburg, MD, USA, 2006. [Google Scholar]
  31. Krishnamoorthy, U.; Muscato, T.V.; Sniffen, C.J.; van Soest, P.J. Nitrogen Fractions in Selected Feedstuffs. J. Dairy Sci. 1982, 65, 217–225. [Google Scholar] [CrossRef]
  32. van Soest, P.J.; Robertson, J.B.; Lewis, B.A. Methods for Dietary Fiber, Neutral Detergent Fiber, and Nonstarch Polysaccharides in Relation to Animal Nutrition. J. Dairy Sci. 1991, 74, 3583–3597. [Google Scholar] [CrossRef]
  33. Hall, M.B. Determination of starch, including maltooligosaccharides, in animal feeds: Comparison of methods and a method recommended for AOAC collaborative study. J. AOAC Int. 2009, 92, 42–49. [Google Scholar] [CrossRef] [Green Version]
  34. Raffrenato, E. Physical, Chemical and Kinetic Factors Associated with Fiber Digestibility in Ruminants and Models Describing These Relationships. Ph.D. Thesis, Cornell University, Ithaca, NY, USA, 2011. [Google Scholar]
  35. Althaus, B.; Papke, G.; Sundrum, A. Technical note: Use of near infrared reflectance spectroscopy to assess nitrogen and carbon fractions in dairy cow feces. Anim. Feed Sci. Technol. 2013, 185, 53–59. [Google Scholar] [CrossRef]
  36. Gruber, L.; Schwarz, F.J.; Erdin, D.; Fischer, B.; Spiekers, H.; Steingass, H. Vorhersage der Futteraufnahme von Milchkühen—Datenbasis von 10 Forschungs- und Universitätsinstituten Deutschlands, Österreichs und der Schweiz; VDLUFA-Verl.: Darmstadt, Germany, 2004. [Google Scholar]
  37. Jensen, L.M.; Nielsen, N.I.; Nadeau, E.; Markussen, B.; Nørgaard, P. Evaluation of five models predicting feed intake by dairy cows fed total mixed rations. Livest. Sci. 2015, 176, 91–103. [Google Scholar] [CrossRef]
  38. Schalla, A.; Meyer, L.; Meyer, Z.; Onetti, S.; Schultz, A.; Goeser, J. Hot topic: Apparent total-tract nutrient digestibilities measured commercially using 120-hour in vitro indigestible neutral detergent fiber as a marker are related to commercial dairy cattle performance. J. Dairy Sci. 2012, 95, 5109–5114. [Google Scholar] [CrossRef]
  39. Spiekers, H.; Nußbaum, H.; Potthast, V. Erfolgreiche Milchviehfütterung, 5., erw. und Aktualisiert Aufl.; DLG-Verl.: Frankfurt am Main, Germany, 2009; ISBN 3769007301. [Google Scholar]
  40. GfE. Gesellschaft für Ernährungsphysiologie.Empfehlungen zur Energie- und Nährstoffversorgung der Milchkühe und Aufzuchtrinder. Energie- und Nährstoffbedarf Landwirtschaftlicher Nutztiere Nr, 8th ed.; DLG-Verl.: Frankfurt am Main, Germany, 2001. [Google Scholar]
  41. Girden, E.R. ANOVA: Repeated Measures; Sage Publications: Newbury Park, CA, USA, 2003; ISBN 9780803942578. [Google Scholar]
  42. Rumphorst, T.; Scheu, T.; Koch, C.; Sundrum, A. Inter- and Intra-Individual Variation in the Behavior of Feed Intake on Nutrient Availability in Early Lactating Dairy Cows. Animals 2021, 12, 37. [Google Scholar] [CrossRef]
  43. DeVries, M.J.; Veerkamp, R.F. Energy Balance of Dairy Cattle in Relation to Milk Production Variables and Fertility. J. Dairy Sci. 2000, 83, 62–69. [Google Scholar] [CrossRef]
  44. Kessel, S.; Stroehl, M.; Meyer, H.H.D.; Hiss, S.; Sauerwein, H.; Schwarz, F.J.; Bruckmaier, R.M. Individual variability in physiological adaptation to metabolic stress during early lactation in dairy cows kept under equal conditions. J. Anim. Sci. 2008, 86, 2903–2912. [Google Scholar] [CrossRef]
  45. Huhtanen, P.; Cabezas-Garcia, E.H.; Krizsan, S.J.; Shingfield, K.J. Evaluation of between-cow variation in milk urea and rumen ammonia nitrogen concentrations and the association with nitrogen utilization and diet digestibility in lactating cows. J. Dairy Sci. 2015, 98, 3182–3196. [Google Scholar] [CrossRef] [Green Version]
  46. Cabezas-Garcia, E.H.; Krizsan, S.J.; Shingfield, K.J.; Huhtanen, P. Between-cow variation in digestion and rumen fermentation variables associated with methane production. J. Dairy Sci. 2017, 100, 4409–4424. [Google Scholar] [CrossRef]
  47. Grant, R.J.; Albright, J.L. Feeding Behaviour. In Farm Animal Metabolism and Nutrition; D’Mello, J.P.F., Ed.; CABI Publishing: Wallingford, UK, 2000; ISBN 9780851993782. [Google Scholar]
  48. Dado, R.G.; Allen, M.S. Variation in and Relationships Among Feeding, Chewing, and Drinking Variables for Lactating Dairy Cows. J. Dairy Sci. 1994, 77, 132–144. [Google Scholar] [CrossRef]
  49. Allen, M.S.; Piantoni, P. Metabolic control of feed intake: Implications for metabolic disease of fresh cows. Vet. Clin. North. Am. Food Anim. Pract. 2013, 29, 279–297. [Google Scholar] [CrossRef]
  50. Dulphy, J.P.; Demarquilly, C. The regulation and prediction of feed intake in ruminants in relation to feed characteristics. Livest. Prod. Sci. 1994, 39, 1–12. [Google Scholar] [CrossRef]
  51. Huhtanen, P.; Ahvenjärvi, S.; Broderick, G.A.; Reynal, S.M.; Shingfield, K.J. Quantifying ruminal digestion of organic matter and neutral detergent fiber using the omasal sampling technique in cattle—A meta-analysis. J. Dairy Sci. 2010, 93, 3203–3215. [Google Scholar] [CrossRef]
  52. Guinguina, A.; Yan, T.; Lund, P.; Bayat, A.R.; Hellwing, A.L.F.; Huhtanen, P. Between-cow variation in the components of feed efficiency. J. Dairy Sci. 2020, 103, 7968–7982. [Google Scholar] [CrossRef]
  53. Bezen, R.; Edan, Y.; Halachmi, I. Computer vision system for measuring individual cow feed intake using RGB-D camera and deep learning algorithms. Comput. Electron. Agric. 2020, 172, 105345. [Google Scholar] [CrossRef]
  54. St-Pierre, N.R.; Thraen, C.S. Animal Grouping Strategies, Sources of Variation, and Economic Factors Affecting Nutrient Balance on Dairy Farms. J. Anim. Sci. 1999, 77, 72–83. [Google Scholar] [CrossRef] [Green Version]
  55. McGilliard, M.L.; Swisher, J.M.; James, R.E. Grouping Lactating Cows by Nutritional Requirements for Feeding. J. Dairy Sci. 1983, 66, 1084–1093. [Google Scholar] [CrossRef]
  56. Poncheki, J.K.; Canha, M.L.S.; Viechnieski, S.L.; de Almeida, R. Analysis of daily body weight of dairy cows in early lactation and associations withproductive and reproductive performance. R. Bras. Zootec. 2015, 44, 187–192. [Google Scholar] [CrossRef] [Green Version]
  57. Gross, J.; van Dorland, H.A.; Bruckmaier, R.M.; Schwarz, F.J. Performance and metabolic profile of dairy cows during a lactational and deliberately induced negative energy balance with subsequent realimentation. J. Dairy Sci. 2011, 94, 1820–1830. [Google Scholar] [CrossRef]
  58. Komaragiri, M.; Erdman, R.A. Factors Affecting Body Tissue Mobilization in Early Lactation Dairy Cows. 1. Effect of Dietary Protein on Mobilization of Body Fat and Protein. J. Dairy Sci. 1997, 80, 929–937. [Google Scholar]
  59. Azizi, O.; Kaufmann, O.; Hasselmann, L. Relationship between feeding behaviour and feed intake of dairy cows depending on their parity and milk yield. Livest. Sci. 2009, 122, 156–161. [Google Scholar] [CrossRef]
  60. McParland, S.; Kennedy, E.; Lewis, E.; Moore, S.G.; McCarthy, B.; O'Donovan, M.; Berry, D.P. Genetic parameters of dairy cow energy intake and body energy status predicted using mid-infrared spectrometry of milk. J. Dairy Sci. 2015, 98, 1310–1320. [Google Scholar] [CrossRef] [Green Version]
  61. McNamara, J.P. TRIENNIAL LACTATION SYMPOSIUM: Systems biology of regulatory mechanisms of nutrient metabolism in lactation. J. Anim. Sci. 2015, 93, 5575–5585. [Google Scholar] [CrossRef]
  62. DeVries, M.J.; van der Beek, S.; Kaal-Lansbergen, L.; Ouweltjes, W.; Wilmink, J. Modeling of Energy Balance in Early Lactation and the Effect of Energy Deficits in Early Lactation on First Detected Estrus Postpartum in Dairy Cows. J. Dairy Sci. 1999, 82, 1927–1934. [Google Scholar] [CrossRef]
  63. Grummer, R.R.; Rastani, R.R. When Should Lactating Dairy Cows Reach Positive Energy Balance? Prof. Anim. Sci. 2003, 19, 197–203. [Google Scholar] [CrossRef]
  64. Grieve, D.; Korver, S.; Rijpkema, Y.; Hof, G. Relationship between milk composition and some nutritional parameters in early lactation. Livest. Prod. Sci. 1986, 14, 239–254. [Google Scholar] [CrossRef]
  65. Heuer, C.; Schukken, Y.H.; Dobbelaar, P. Postpartum Body Condition Score and Results from the First Test Day Milk as Predictors of Disease, Fertility, Yield, and Culling in Commercial Dairy Herds. J. Dairy Sci. 1999, 82, 295–304. [Google Scholar] [CrossRef]
  66. Mäntysaari, P.; Mäntysaari, E.A.; Kokkonen, T.; Mehtiö, T.; Kajava, S.; Grelet, C.; Lidauer, P.; Lidauer, M.H. Body and milk traits as indicators of dairy cow energy status in early lactation. J. Dairy Sci. 2019, 102, 7904–7916. [Google Scholar] [CrossRef] [Green Version]
  67. Sundrum, A. Nutrition and Health-Management in Dairy Production. In Livestock Health and Farming; IntechOpen: London, UK, 2020. [Google Scholar]
  68. Bar-Pelled, U.; Maltz, E.; Bruckental, I.; Folman, Y.; Kali, Y.; Gacitua, H.; Lehrer, A.R.; Knight, C.H.; Robinson, B.; Voet, H.; et al. Relationship Between Frequent Milking or Suckling in Early Lactation and Milk Production of High Producing Dairy Cows. J. Dairy Sci. 1995, 78, 2726–2736. [Google Scholar] [CrossRef]
  69. Stelwagen, K.; Phyn, C.V.C.; Davis, S.R.; Guinard-Flament, J.; Pomiès, D.; Roche, J.R.; Kay, J.K. Invited review: Reduced milking frequency: Milk production and management implications. J. Dairy Sci. 2013, 96, 3401–3413. [Google Scholar] [CrossRef]
  70. Lacasse, P.; Vanacker, N.; Ollier, S.; Ster, C. Innovative dairy cow management to improve resistance to metabolic and infectious diseases during the transition period. Res. Vet. Sci. 2018, 116, 40–46. [Google Scholar] [CrossRef]
Figure 1. Dry matter intake (kg/day) measured between weeks 2 and 15 postpartum (p.p.). In each subfigure, the boxplots respectively highlight the median, upper, and lower quartiles of each week. Box whiskers extended to the most extreme nonoutlier data points above and below the box; data points were considered as outliers if they lay more than 1.5 times the interquartile range from the edge of the box. Small circles = outliers (1.5 × interquartile range (IQR)); asterisks = extreme values (3 × IQR).
Dairy 03 00027 g001
Figure 2. Total energy supply (MJ NEL/d) calculated between weeks 2 and 15 postpartum (p.p.). In each subfigure, the boxplots respectively highlight the median, upper, and lower quartiles of each week. Box whiskers that extended to the most extreme nonoutlier data points were considered as outliers if they lay more than 1.5 times the interquartile range from the edge of the box. Small circles = outliers (1.5 × interquartile range (IQR)); asterisks = extreme values (3 × IQR).
Dairy 03 00027 g002
Figure 3. BCS data of dairy cows (n = 28) between weeks 2 and 15 postpartum (p.p.). In each subfigure, the boxplots respectively highlight the median, upper, and lower quartiles of each week. Box whiskers extended to the most extreme nonoutlier data points were considered as outliers if they lay more than 1.5 times the interquartile range from the edge of the box. Small circles = outliers (1.5 × interquartile range (IQR)); asterisks = extreme values (3 × IQR).
Dairy 03 00027 g003
Figure 4. BCS change between two weeks of dairy cows (n = 28) between week 2 and 15 postpartum (p.p.). In each subfigure, the boxplots respectively highlight the median, upper, and lower quartiles of each week. Box whiskers extended to the most extreme nonoutlier data points were considered as outliers if they lay more than 1.5 times the interquartile range from the edge of the box. Small circles = outliers (1.5 × interquartile range (IQR)); asterisks = extreme values (3 × IQR).
Dairy 03 00027 g004
Figure 5. BCS data between weeks 2 and 15 postpartum (p.p.). In each subfigure, the boxplots respectively highlight the median, upper, and lower quartiles of each week. Box whiskers extended to the most extreme nonoutlier data points were considered as outliers if they lay more than 1.5 times the interquartile range from the edge of the box. Small circles = outliers (1.5 × interquartile range (IQR)); asterisks = extreme values (3 × IQR).
Dairy 03 00027 g005
Figure 6. Energy requirement for production (MJ NEL/d) calculated between weeks 2 and 15 postpartum (p.p.). In each subfigure, the boxplots respectively highlight the median, upper, and lower quartiles of each week. Box whiskers extended to the most extreme nonoutlier data points were considered as outliers if they lay more than 1.5 times the interquartile range from the edge of the box. Small circles = outliers (1.5 × interquartile range (IQR)); asterisks = extreme values (3 × IQR).
Dairy 03 00027 g006
Figure 7. Total energy requirement (MJ NEL/d) calculated between weeks 2 and 15 postpartum (p.p.). In each subfigure, the boxplots respectively highlight the median, upper, and lower quartiles of each week. Box whiskers extended to the most extreme nonoutlier data points were considered as outliers if they lie more than 1.5 times the interquartile range from the edge of the box. Small circles = outliers (1.5 × interquartile range (IQR)); asterisks = extreme values (3 × IQR).
Dairy 03 00027 g007
Figure 8. Energy balance (MJ NEL/d) of dairy cows (n = 28) between weeks 2 and 15 postpartum (p.p.). In each subfigure, the boxplots respectively highlight the median, upper, and lower quartiles of each week. Box whiskers extended to the most extreme nonoutlier data points were considered as outliers if they lay more than 1.5 times the interquartile range from the edge of the box. Small circles = outliers (1.5 × interquartile range (IQR)); asterisks = extreme values (3 × IQR).
Dairy 03 00027 g008
Figure 9. Energy balance (MJ NEL/d) calculated between weeks 2 and 15 postpartum (p.p.). In each subfigure, the boxplots respectively highlight the median, upper, and lower quartiles of each week. Box whiskers extended to the most extreme nonoutlier data points were considered as outliers if they lay more than 1.5 times the interquartile range from the edge of the box. Small circles = outliers (1.5 × interquartile range (IQR)); asterisks = extreme values (3 × IQR).
Dairy 03 00027 g009
Table 1. Ingredient and chemical composition, and energy content of the total mixed ration.
Diet Composition (g/kg) aChemical Composition (g/kg) b
MeanSD
Beet pressed pulp silage188.3Dry matter 402.013.8
Grass silage97.0
Grass hay74.7OM931.43.8
Maize silage259.6CP157.48.1
Concentrate380.4SP63.27.3
EE43.02.4
aNDFom355.18.8
ADF219.34.9
Lignin28.31.2
iNDF240 86.44.5
Starch182.314.8
ESC63.13.4
TDN c732.05.0
Energy (MJ/kg DM)
NEL d7.00.0
a,b Diet and chemical composition reported on 105 °C dry matter. Averaged values based on weekly conducted feed analysis; diet was offered as TMR. ADF, acid detergent fiber, expressed inclusive of residual ash; CP, crude protein; EE, ether extract; ESC, ethanol-soluble carbohydrates; iNDF240, indigestible aNDFom; OM, organic matter; SD, standard deviation; SP, soluble protein. c TDN (g/kg), Total digestibly nutrient values for TMR samples were calculated from the TDN value using Equations (2)–(5) by [5]. d NEL for TMR samples were calculated from the TDN value using Equations (2) and (3) by [5].
Table 2. Predicted DMI vs. measured DMI during different stage of early lactation (n = 28).
Up to 4th
Week of Lactation
Up to 8th
Week of Lactation
Up to 12th
Week of Lactation
Up to 15th
Week of Lactation
Intercept2274227422742274
country × breedHF h (GER + AT) dHF h (GER + AT)HF h (GER + AT)HF h (GER + AT)
lactation 2–32–32–32–3
DIM a285684105
BW b667.16663.40664.13663.33
MY c42.6647.5046.8244.72
Concentrate proportion38.1038.1038.1038.10
NEL value of forage6.806.806.806.80
Predicted DMI e23.4925.5226.0125.77
Mean measured DMI16.7920.1321.7221.39
SD measured DMI 2.602.512.342.71
CV measured DMI 0.150.120.110.13
Mean max DMI22.1224.8925.7925.77
Mean min DMI11.2715.2316.9415.07
Difference mean predicted and measured DMI6.705.394.294.38
a DIM, days in milk. b BW, body weight. c MY, milk yield. d HF h (GER + AT), Holstein Frisian breed on a high management level, in Germany GER) and Austria (AT). e DMI, dry matter intake.
Table 3. Mean, SD, min, and max values of early lactating dairy cows grouped in quartiles according to mean energy balance observed between weeks 2 and 15 of lactation.
Quartile of Mean Energy Balance Value during Early Lactation
Lower Quartile (<25%)Intermediate QuartileUpper Quartile (>75%)
MeanSDMinMaxMeanSDMinMaxMeanSDMinMaxp
Lactation 3.20.82.04.02.91.62.08.03.01.12.05.0
Milk yield (kg/d)47.8 a5.235.056.546.7 ab5.925.461.041.9 b4.819.050.4*
Milk yield (kg/d) in 1st milk check42.1 a3.936.447.639.6 ab6.425.446.235.9 b8.919.044.6*
Milk fat (%)3.90.92.56.23.70.72.15.83.60.72.46.4NS 1
Milk protein (%)3.0 b0.32.63.72.9 b0.22.53.93.2 a0.22.83.9**
Ratio fat:protein1.3 a0.30.92.41.2 ab0.20.81.71.1 b0.20.71.7**
ECM (kg/d)45.8 a5.234.056.543.5 ab6.025.660.839.4 b5.616.750.4*
ECM (kg/d) in 1st milk check 48.0 a4.241.453.143.3 ab8.925.652.438.7 b10.816.749.9*
Week of Peak Milk4.72.7294.32.3294.02.8210NS
Peak Milk (kg ECM/d)51.8 a3.846.356.548.6 ab6.337.860.844.4 b5.036.650.4*
Body weight (BW) (kg/d)669.176.1574.5801.4653.743.6565.6781.2682.169.2604.5841.9NS
BW changes wk 2–5−2.714.8−32.612.4−3.619.7−41.730.2−16.719.8−43.23.4NS
BW changes wk 6–10−3.4 11.1−20.015.15.7 24.6−46.344.611.7 16.3−5.244.5NS
BW changes wk 11–15−1.36.3−10.63.61.223.3−35.137.918.320.1−6.847.5NS
BCS2.90.42.33.82.80.32.33.53.20.42.84.3NS
BCS (1st test) 3.30.42.33.83.00.22.83.33.30.43.04.0NS
BCS changes wk 2–5−0.10.2−0.40.3−0.10.2−0.50.0−0.10.3−0.60.3NS
BCS changes wk 6–10−0.40.3−0.80.0−0.10.1−0.30.00.20.4−0.10.8NS
BCS changes wk 11–150.10.30.00.50.00.1−0.30.30.00.4−0.80.5NS
DMI (kg/d)19.23.210.926.320.23.310.126.520.63.012.226.1NS
OMD(g/kg)731.021.3681.9774.8728.519.6667.3786.6727.219.0679.2787.6NS
TES (MJ NEL/d)134.422.976.2185.7141.623.070.9186.6144.020.785.6181.5NS
ES as a multiple of ERmain3.20.51.94.13.40.61.74.73.40.51.84.3NS
ERmain (MJ NEL/d)38.53.334.444.137.91.934.043.338.73.333.745.8NS
ERpro (MJ NEL/d)143.7 a16.3106.1177.4136.3 ab18.980.4191.3123.5 b17.852.5158.5*
TER (MJ NEL/d)182.2 a18.1143.7221.5174.2 ab18.6117.2229.0162.2 b17.093.7197.5*
EB (MJ NEL/d)−47.6 c26.0−107.2−7.1−32.8 b21.5−101.410.7−18.2 a21.7−84.523.9***
a,b values with different superscripts within the same line are significantly different. 1 NS = not significant (p > 0.05); * p < 0.05; ** p < 0.01; *** p < 0.001.
Table 4. The effect of variation in sub-variables on variation in energy balance (EB) (n = 28).
VariableEstimateSE ap
Intercept−1.4980.6310.026
CV DMI b0.3822.2970.869
CV OMD c−9.01518.2020.625
CV ECM d12.4443.4680.001
0.375
a Standard error. b Coefficient of variation of dry matter intake. c Coefficient of variation of organic matter digestibility. d Coefficient of variation of energy corrected milk.
Publisher’s Note: MDPI stays neutral with regard to jurisdictional claims in published maps and institutional affiliations.

