Predicting Differences in Model Parameters with Individual Parameter Contribution Regression Using the R Package ipcr
Abstract
:1. Introduction
2. Introductory Example
3. Derivation and Properties of Individual Parameter Contributions
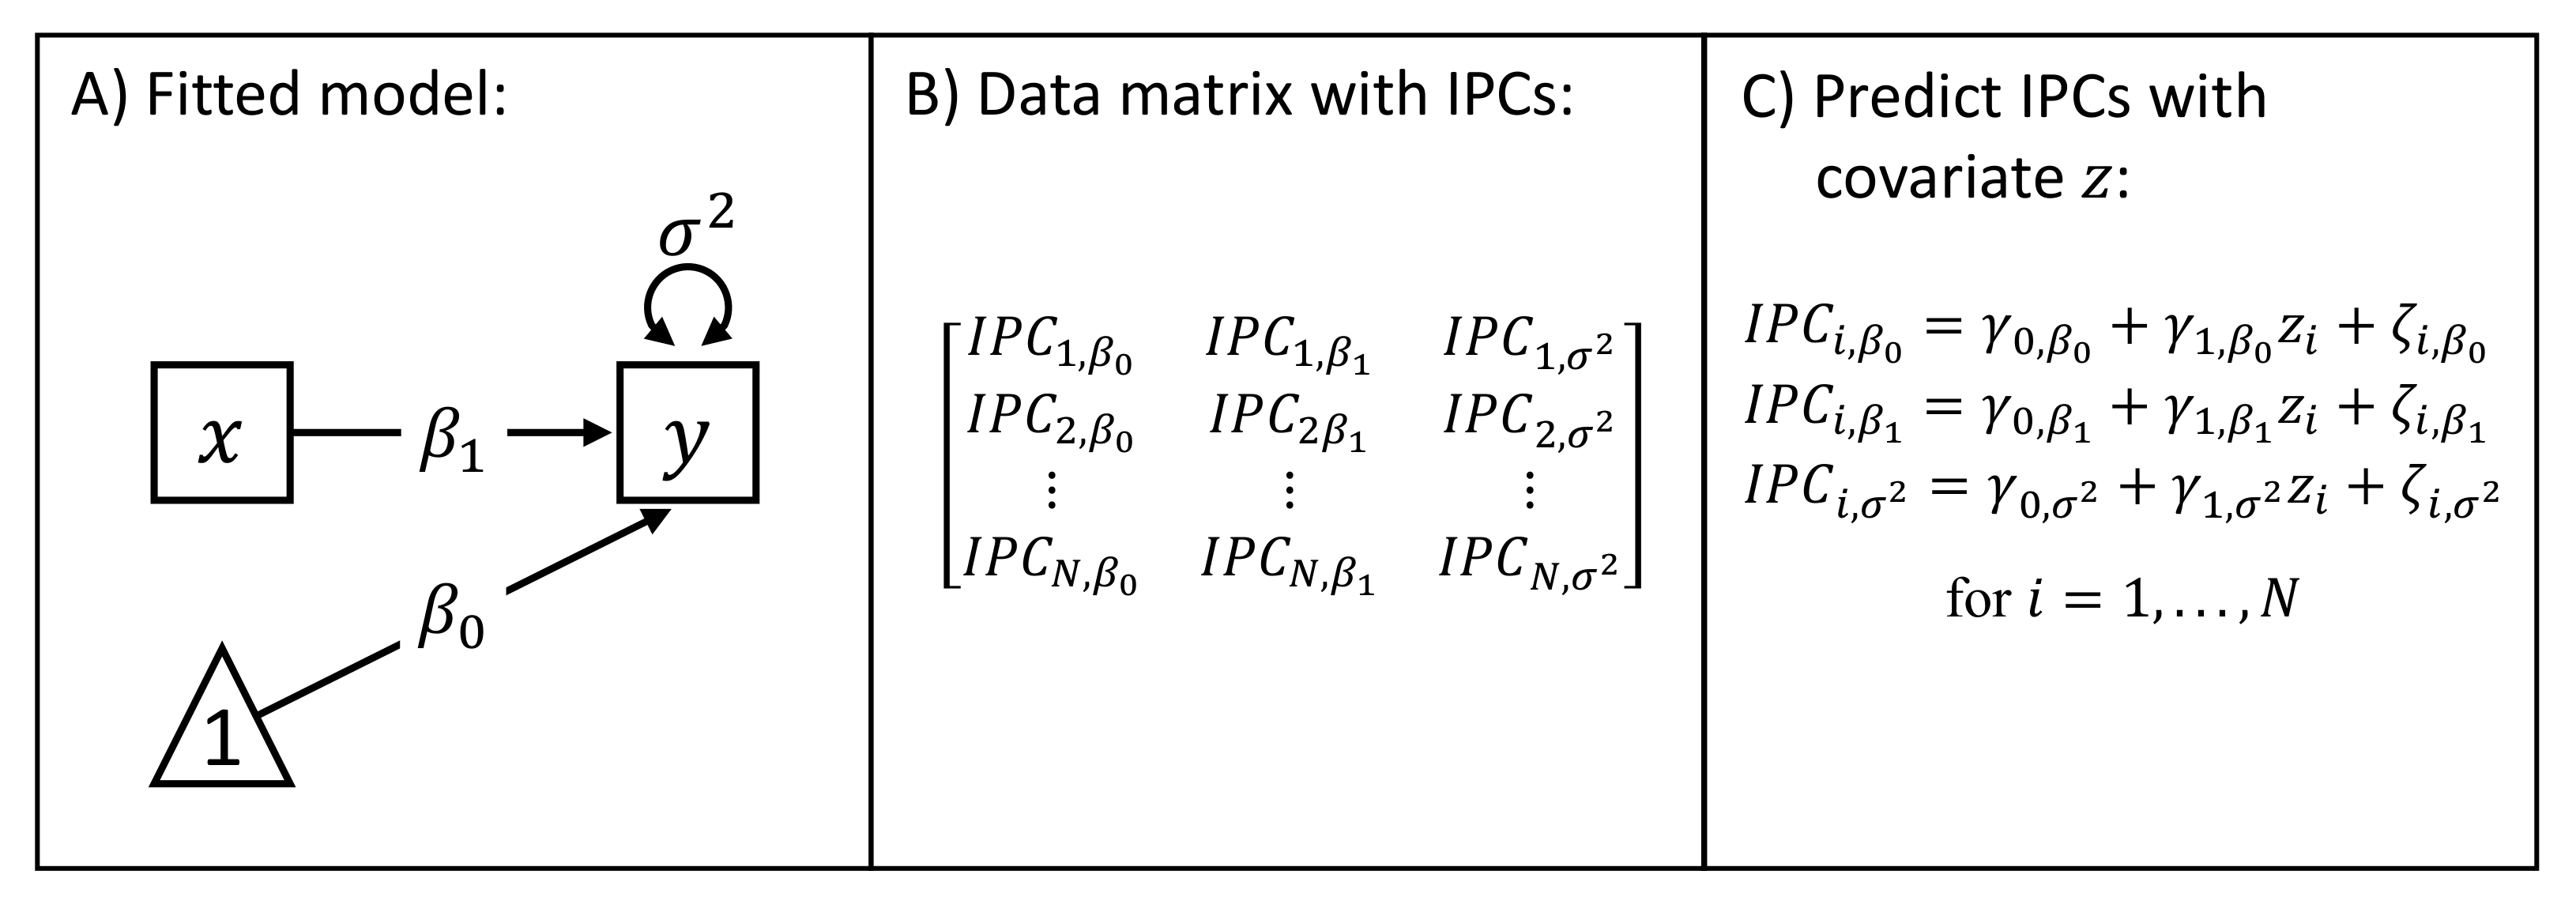
3.1. Calculation of the Individual Parameter Contributions
3.2. Bias Correction Procedure
4. The ipcr Package: Overview and Installation
5. Application
5.1. Data Overview
5.2. Data Pre-Processing
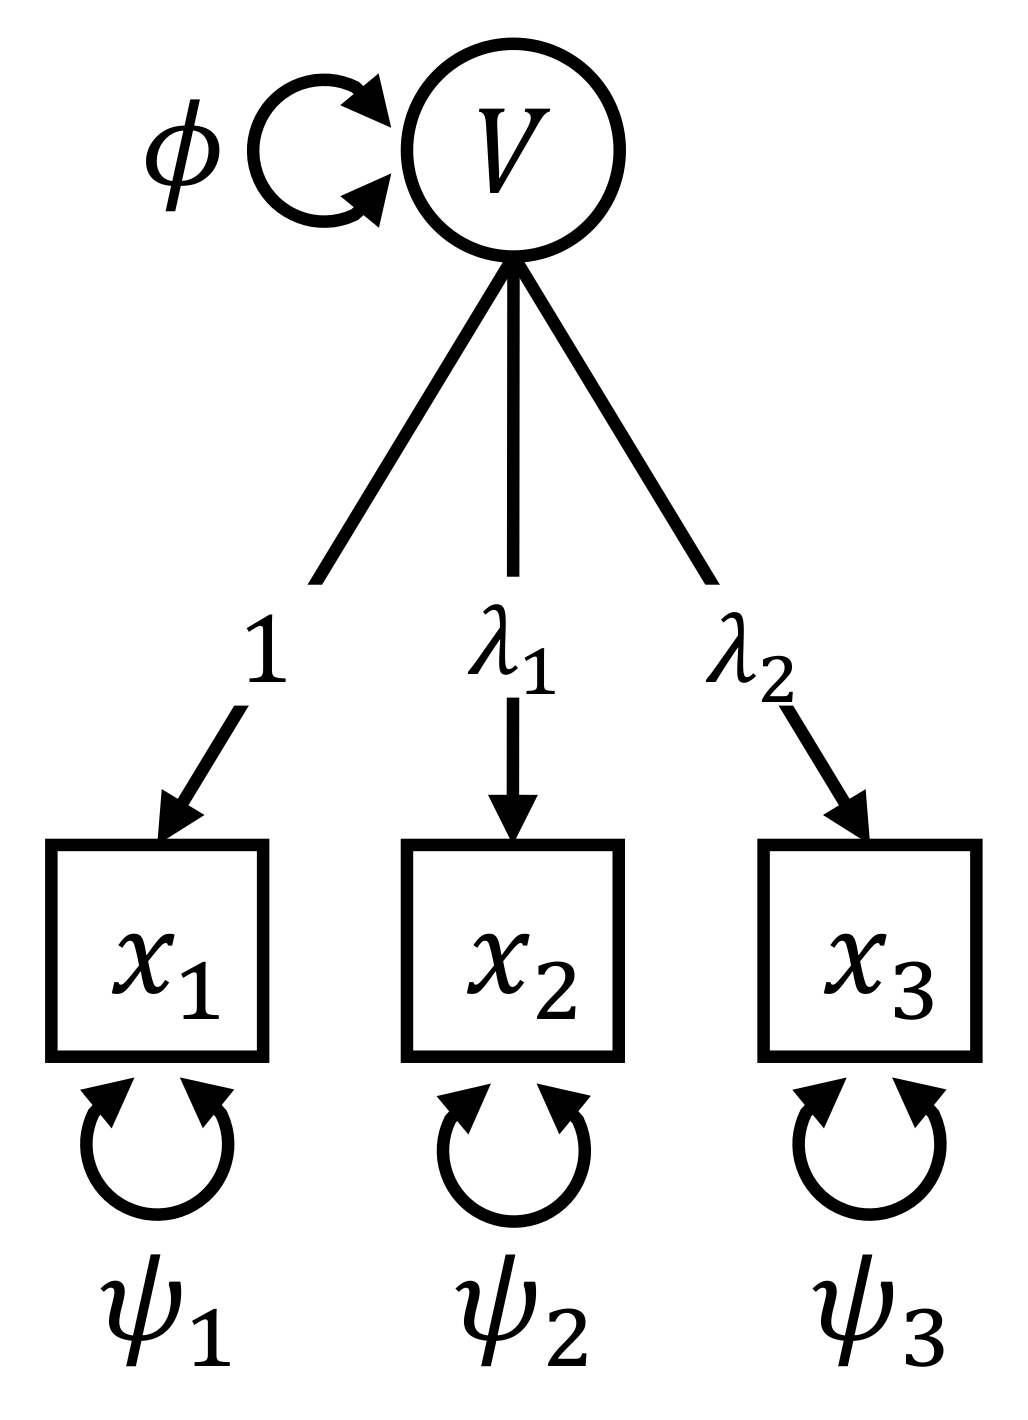
5.3. Fitting the Model
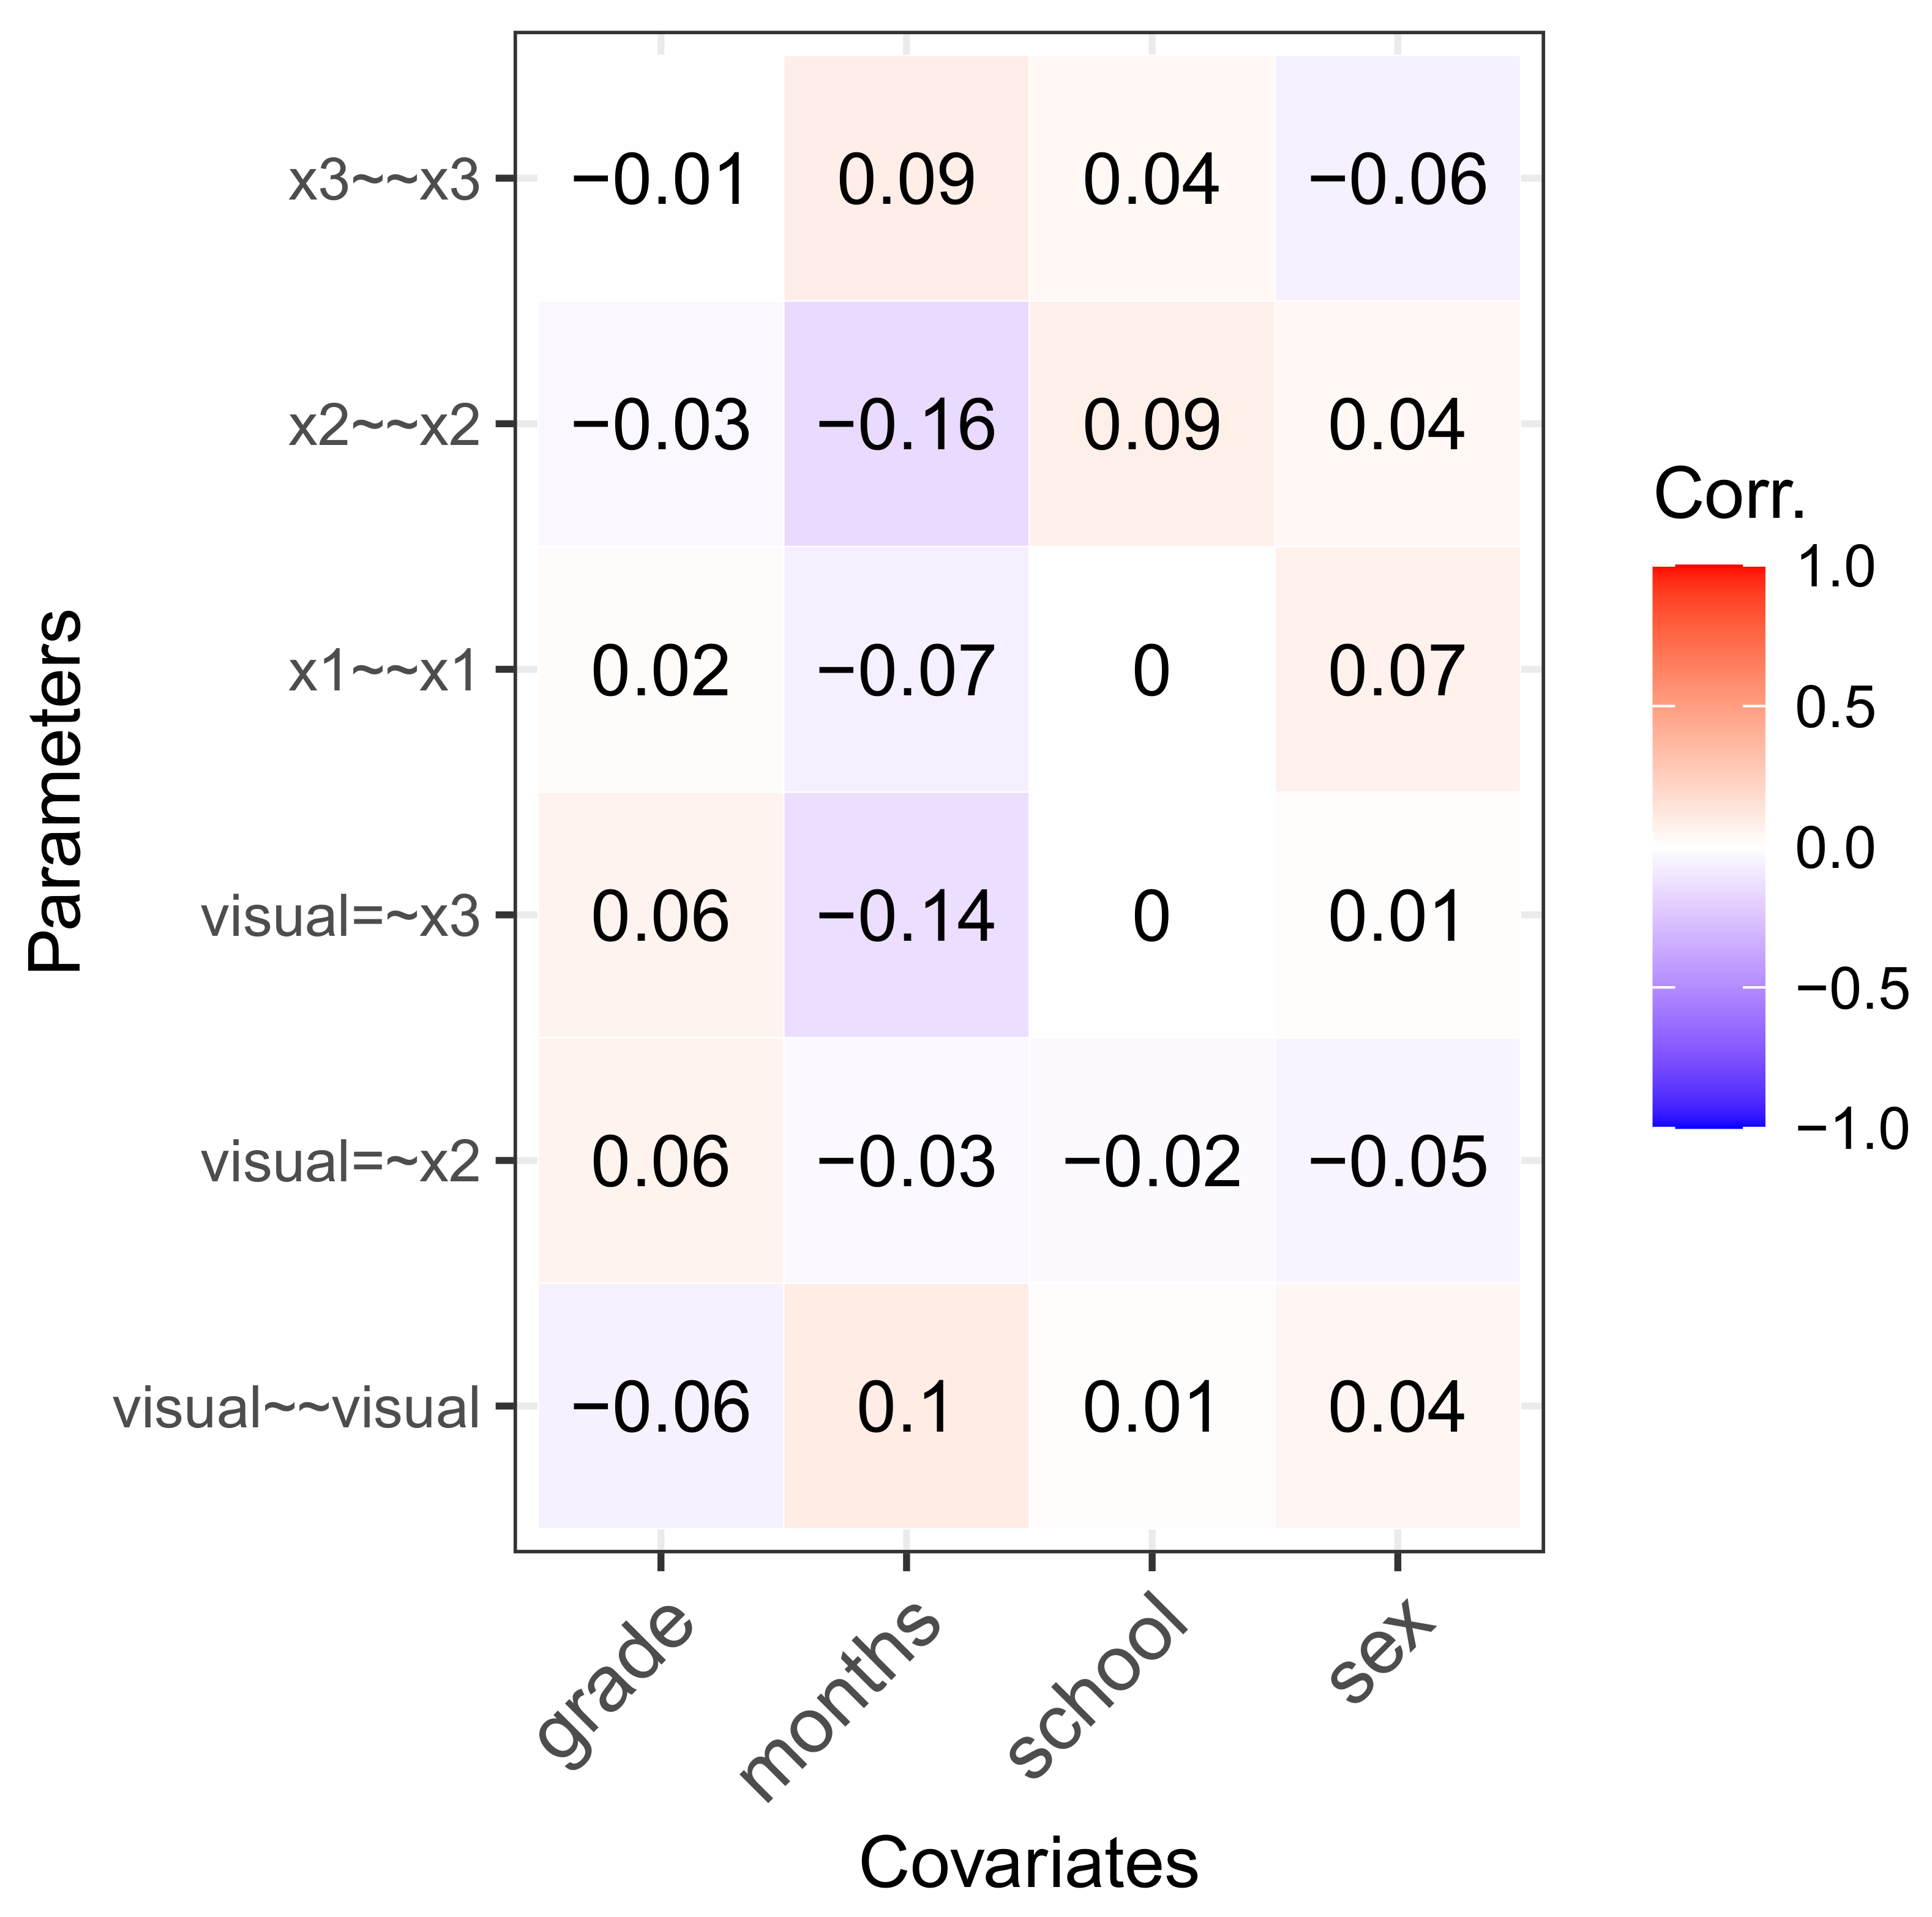
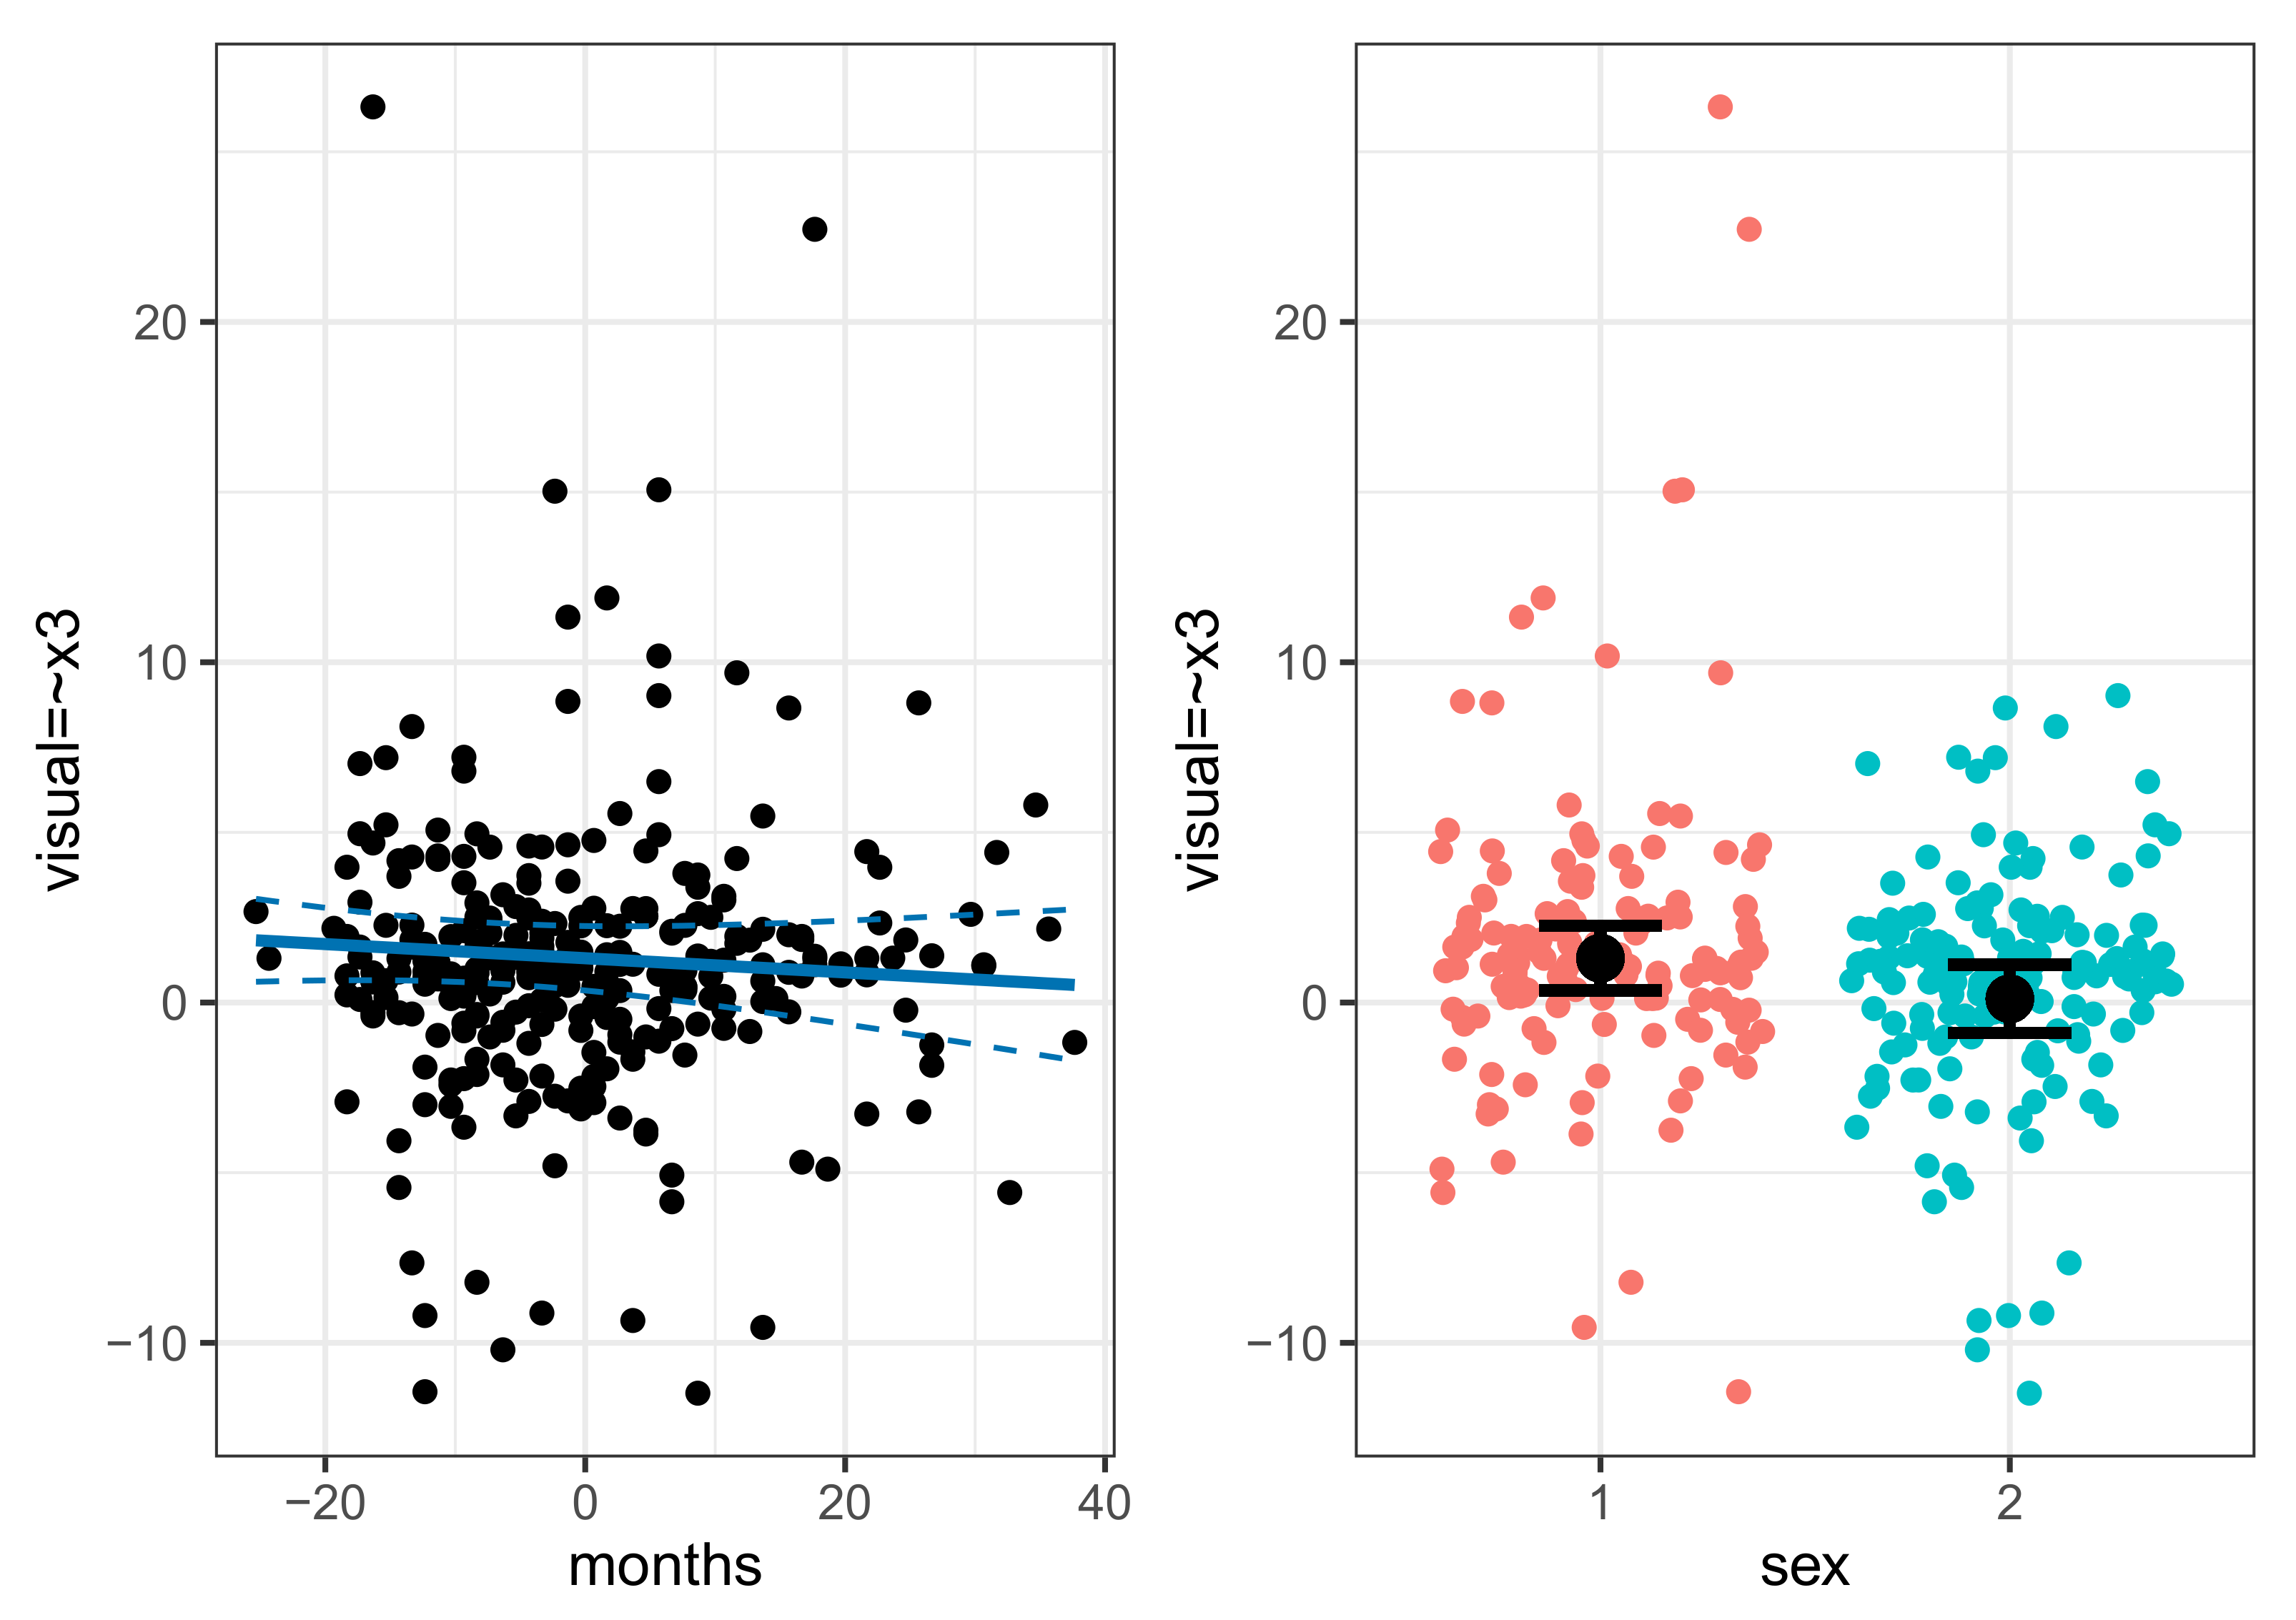
5.4. Individual Parameter Contribution Regression
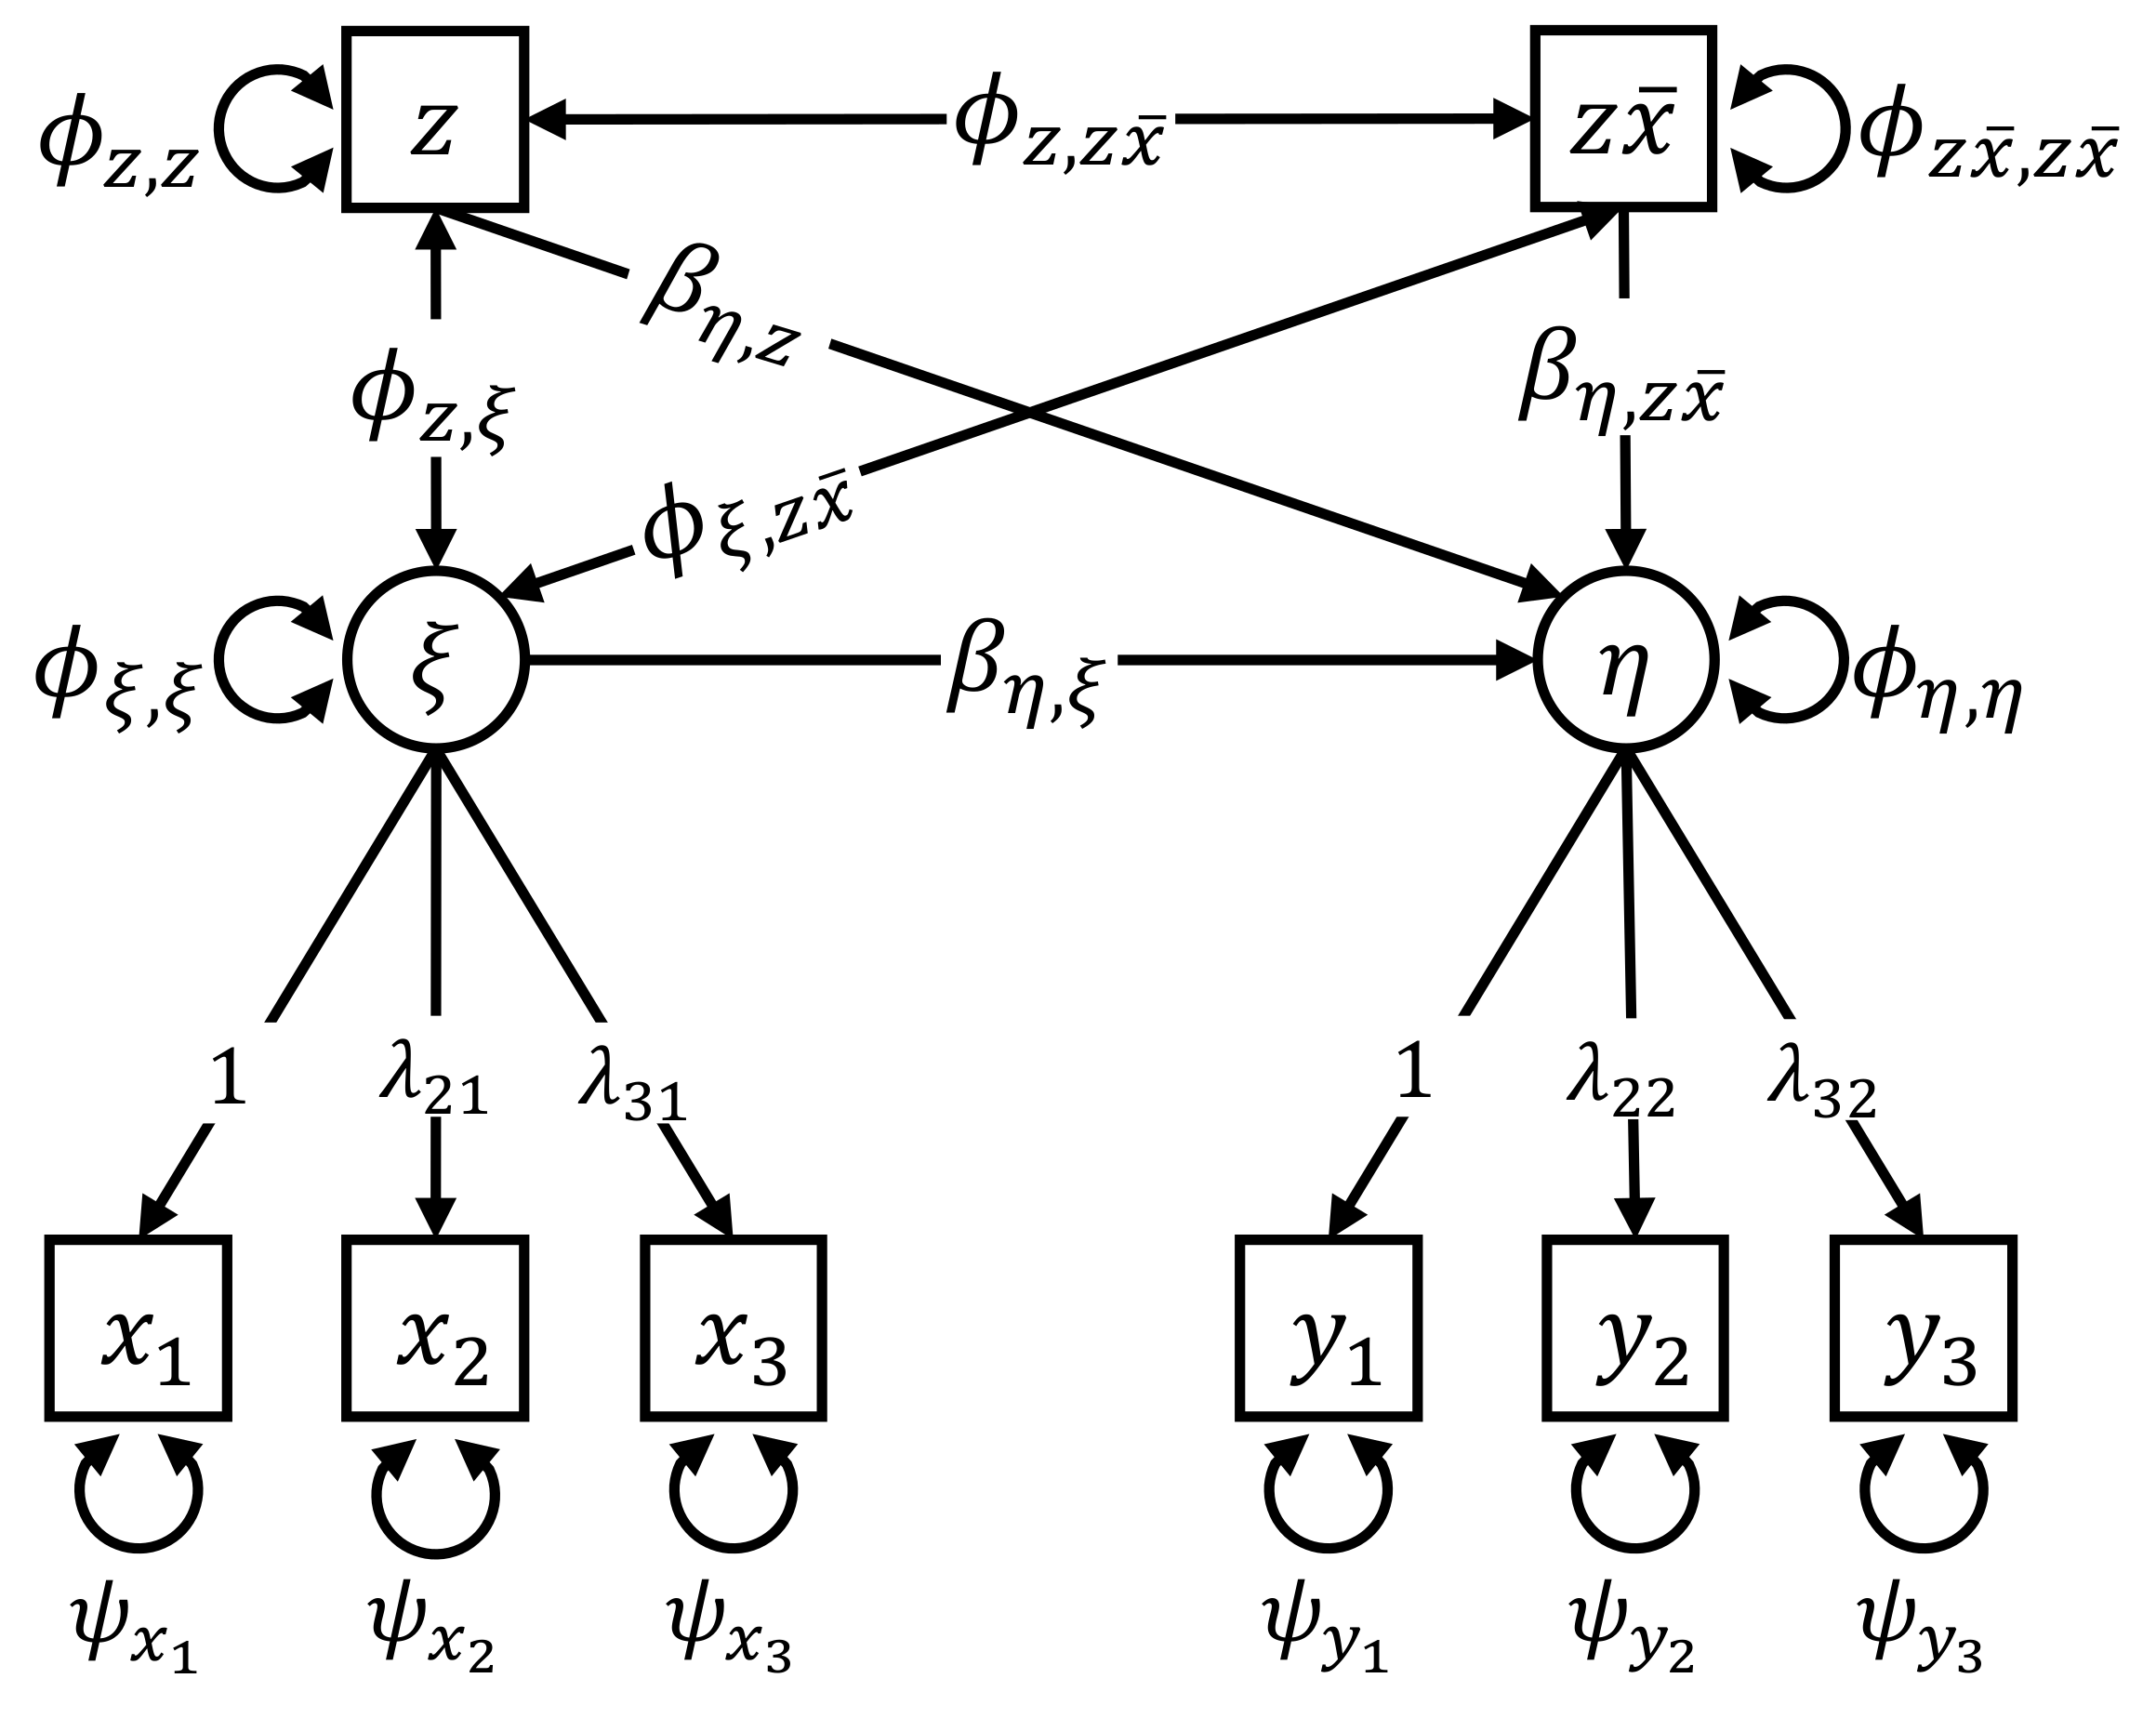
5.5. Non-Linear Effects and Interactions
5.6. Bias Correction
5.7. Regularization
6. Simulation Studies
6.1. Simulation I: Simple Linear Regression Model
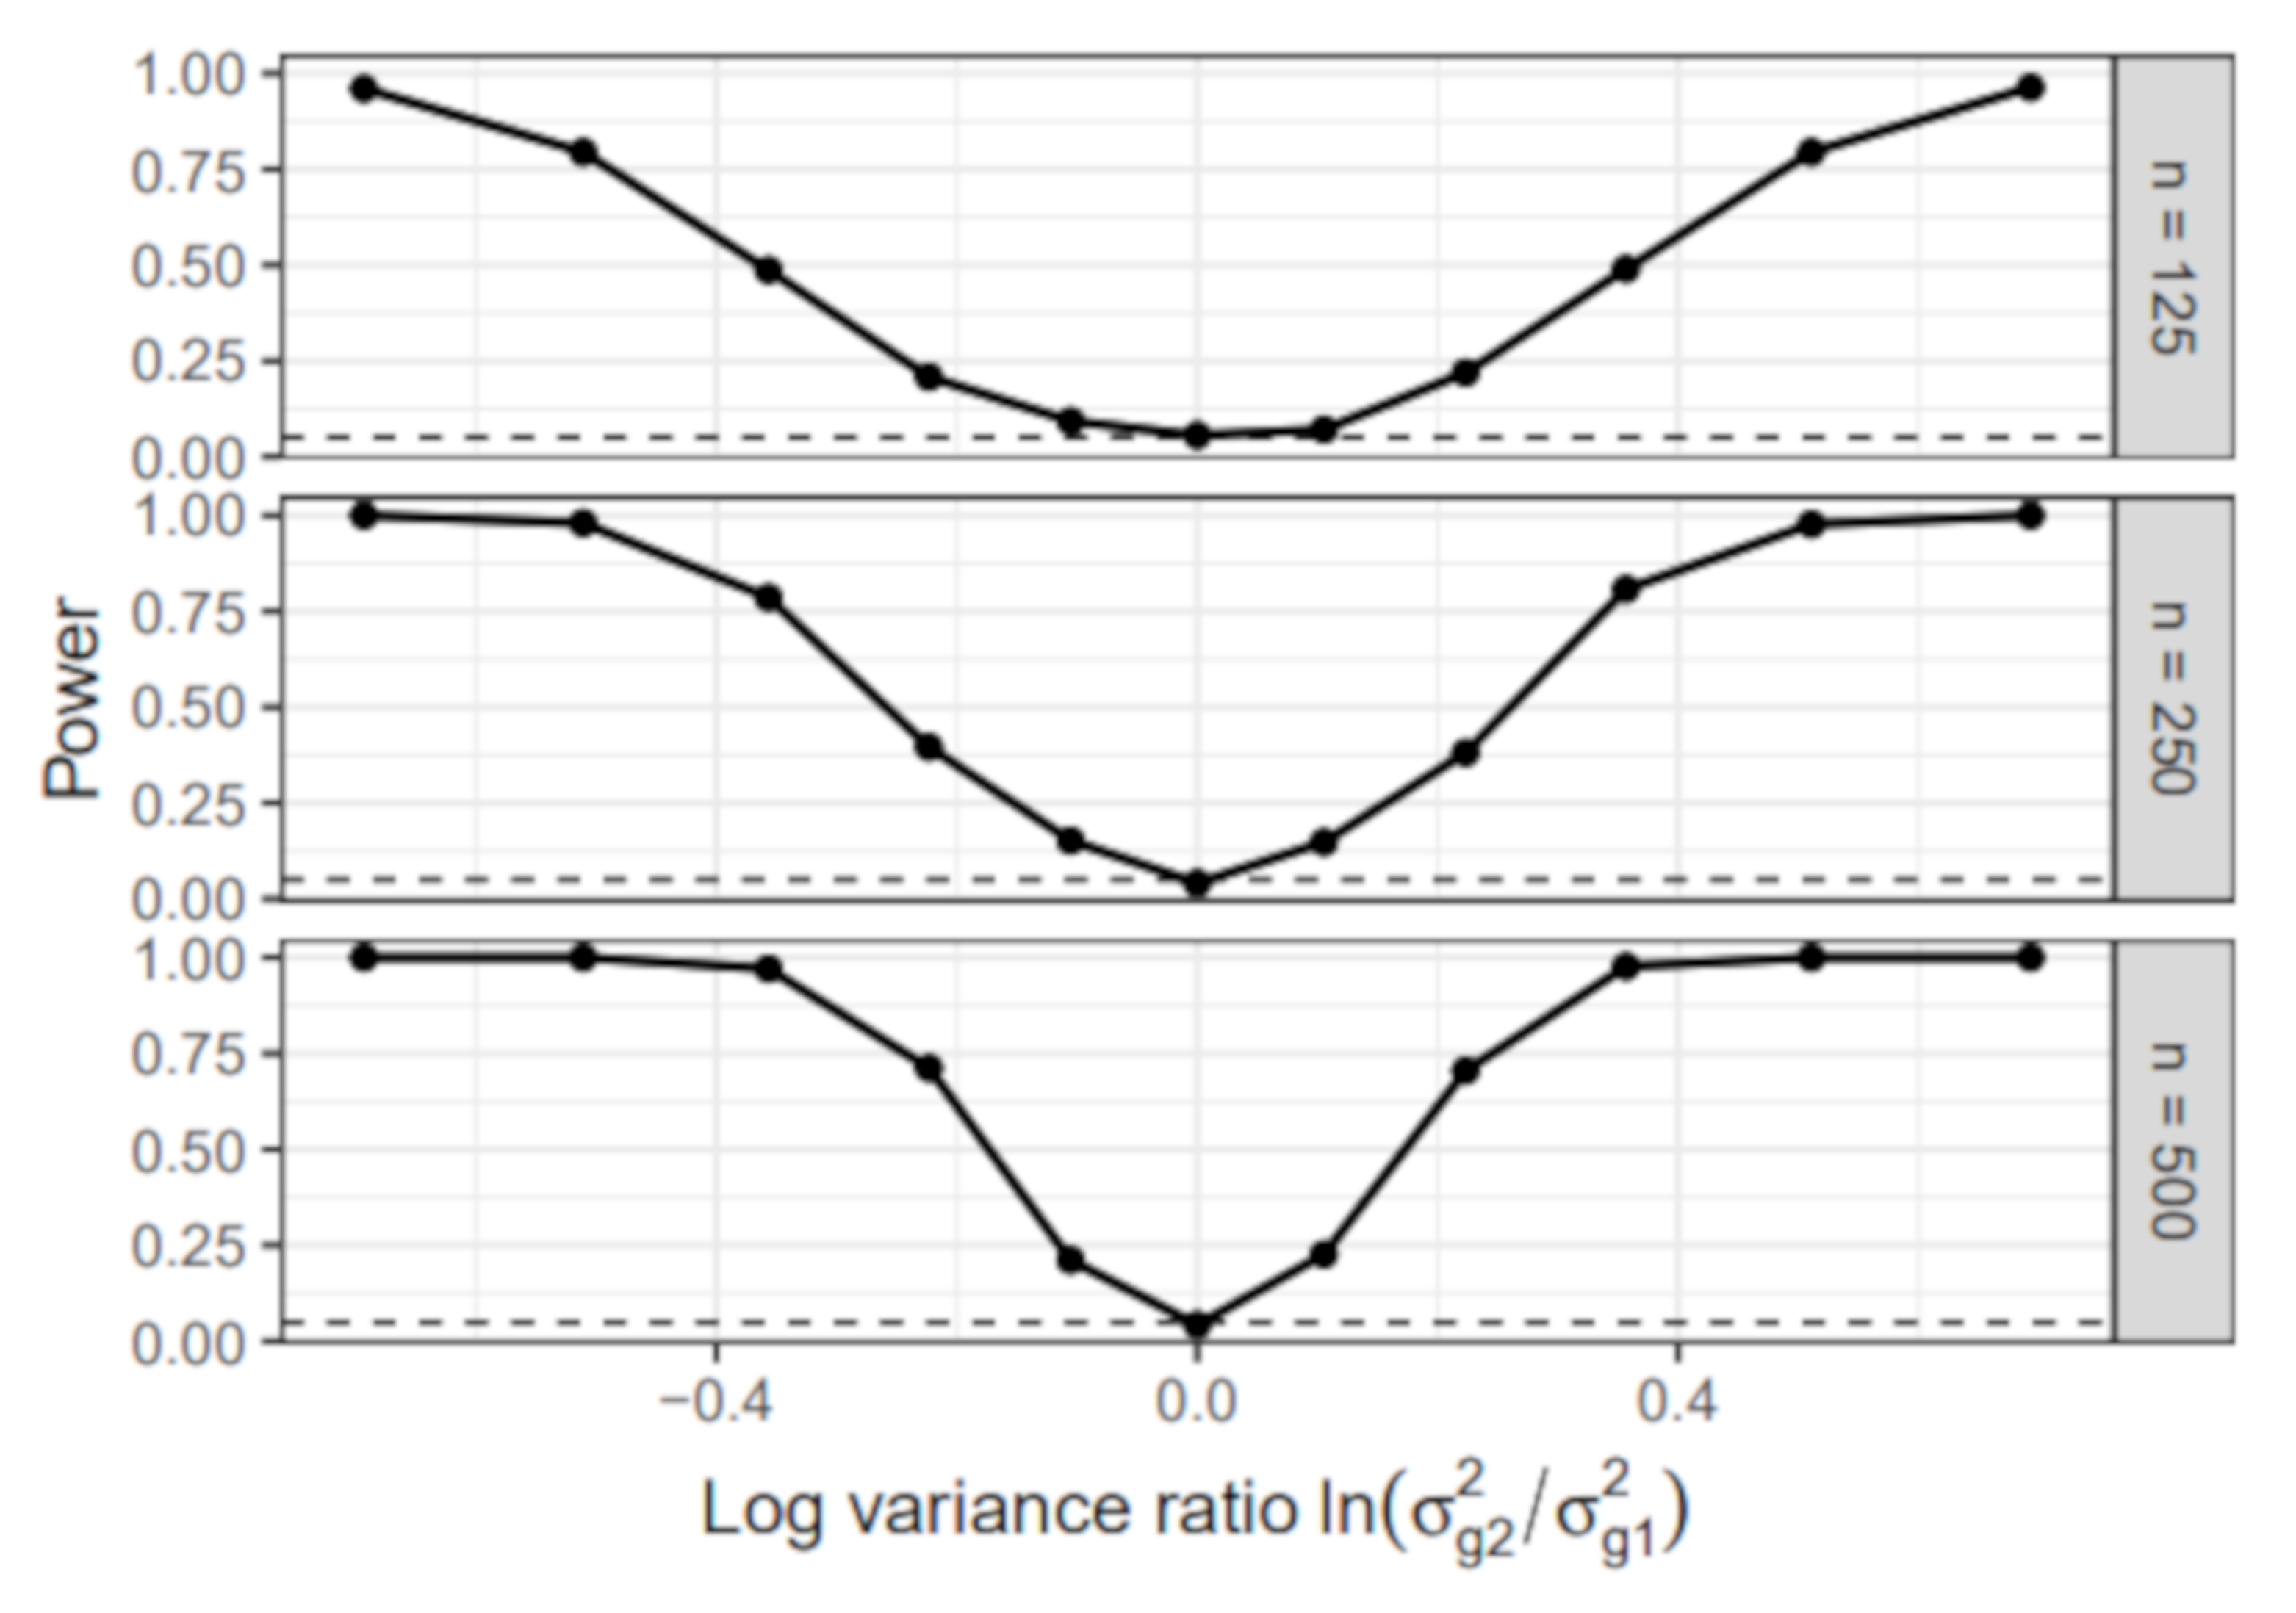
- Group-specific value of : The error variance of the first group was set to 1 in all simulation conditions. In the second group, the error variance varied across the following values: , , , , , , , , , , . We chose the values so that the absolute value of the log-variance ratio was the same for the most extreme conditions and . Note that the condition resulted in a homogeneous sample without group differences.
- Sample size: The sample size per group n was either 125, 250, or 500. The total sample size N, therefore, equaled 250, 500, or 1000.
6.1.1. Power
6.1.2. Estimated Group Difference
6.2. Simulation II: Type I Error Rate
- Number of covariates: The IPC regression algorithm was provided either with 1, 2, or 3 covariates. These covariates did not predict any parameter differences.
- Type of covariates: The covariates were either dummy or standard normally distributed variables.
- Sample size (N): The simulated samples contained either 250, 500, or 1000 individuals.
Type I Error Rate
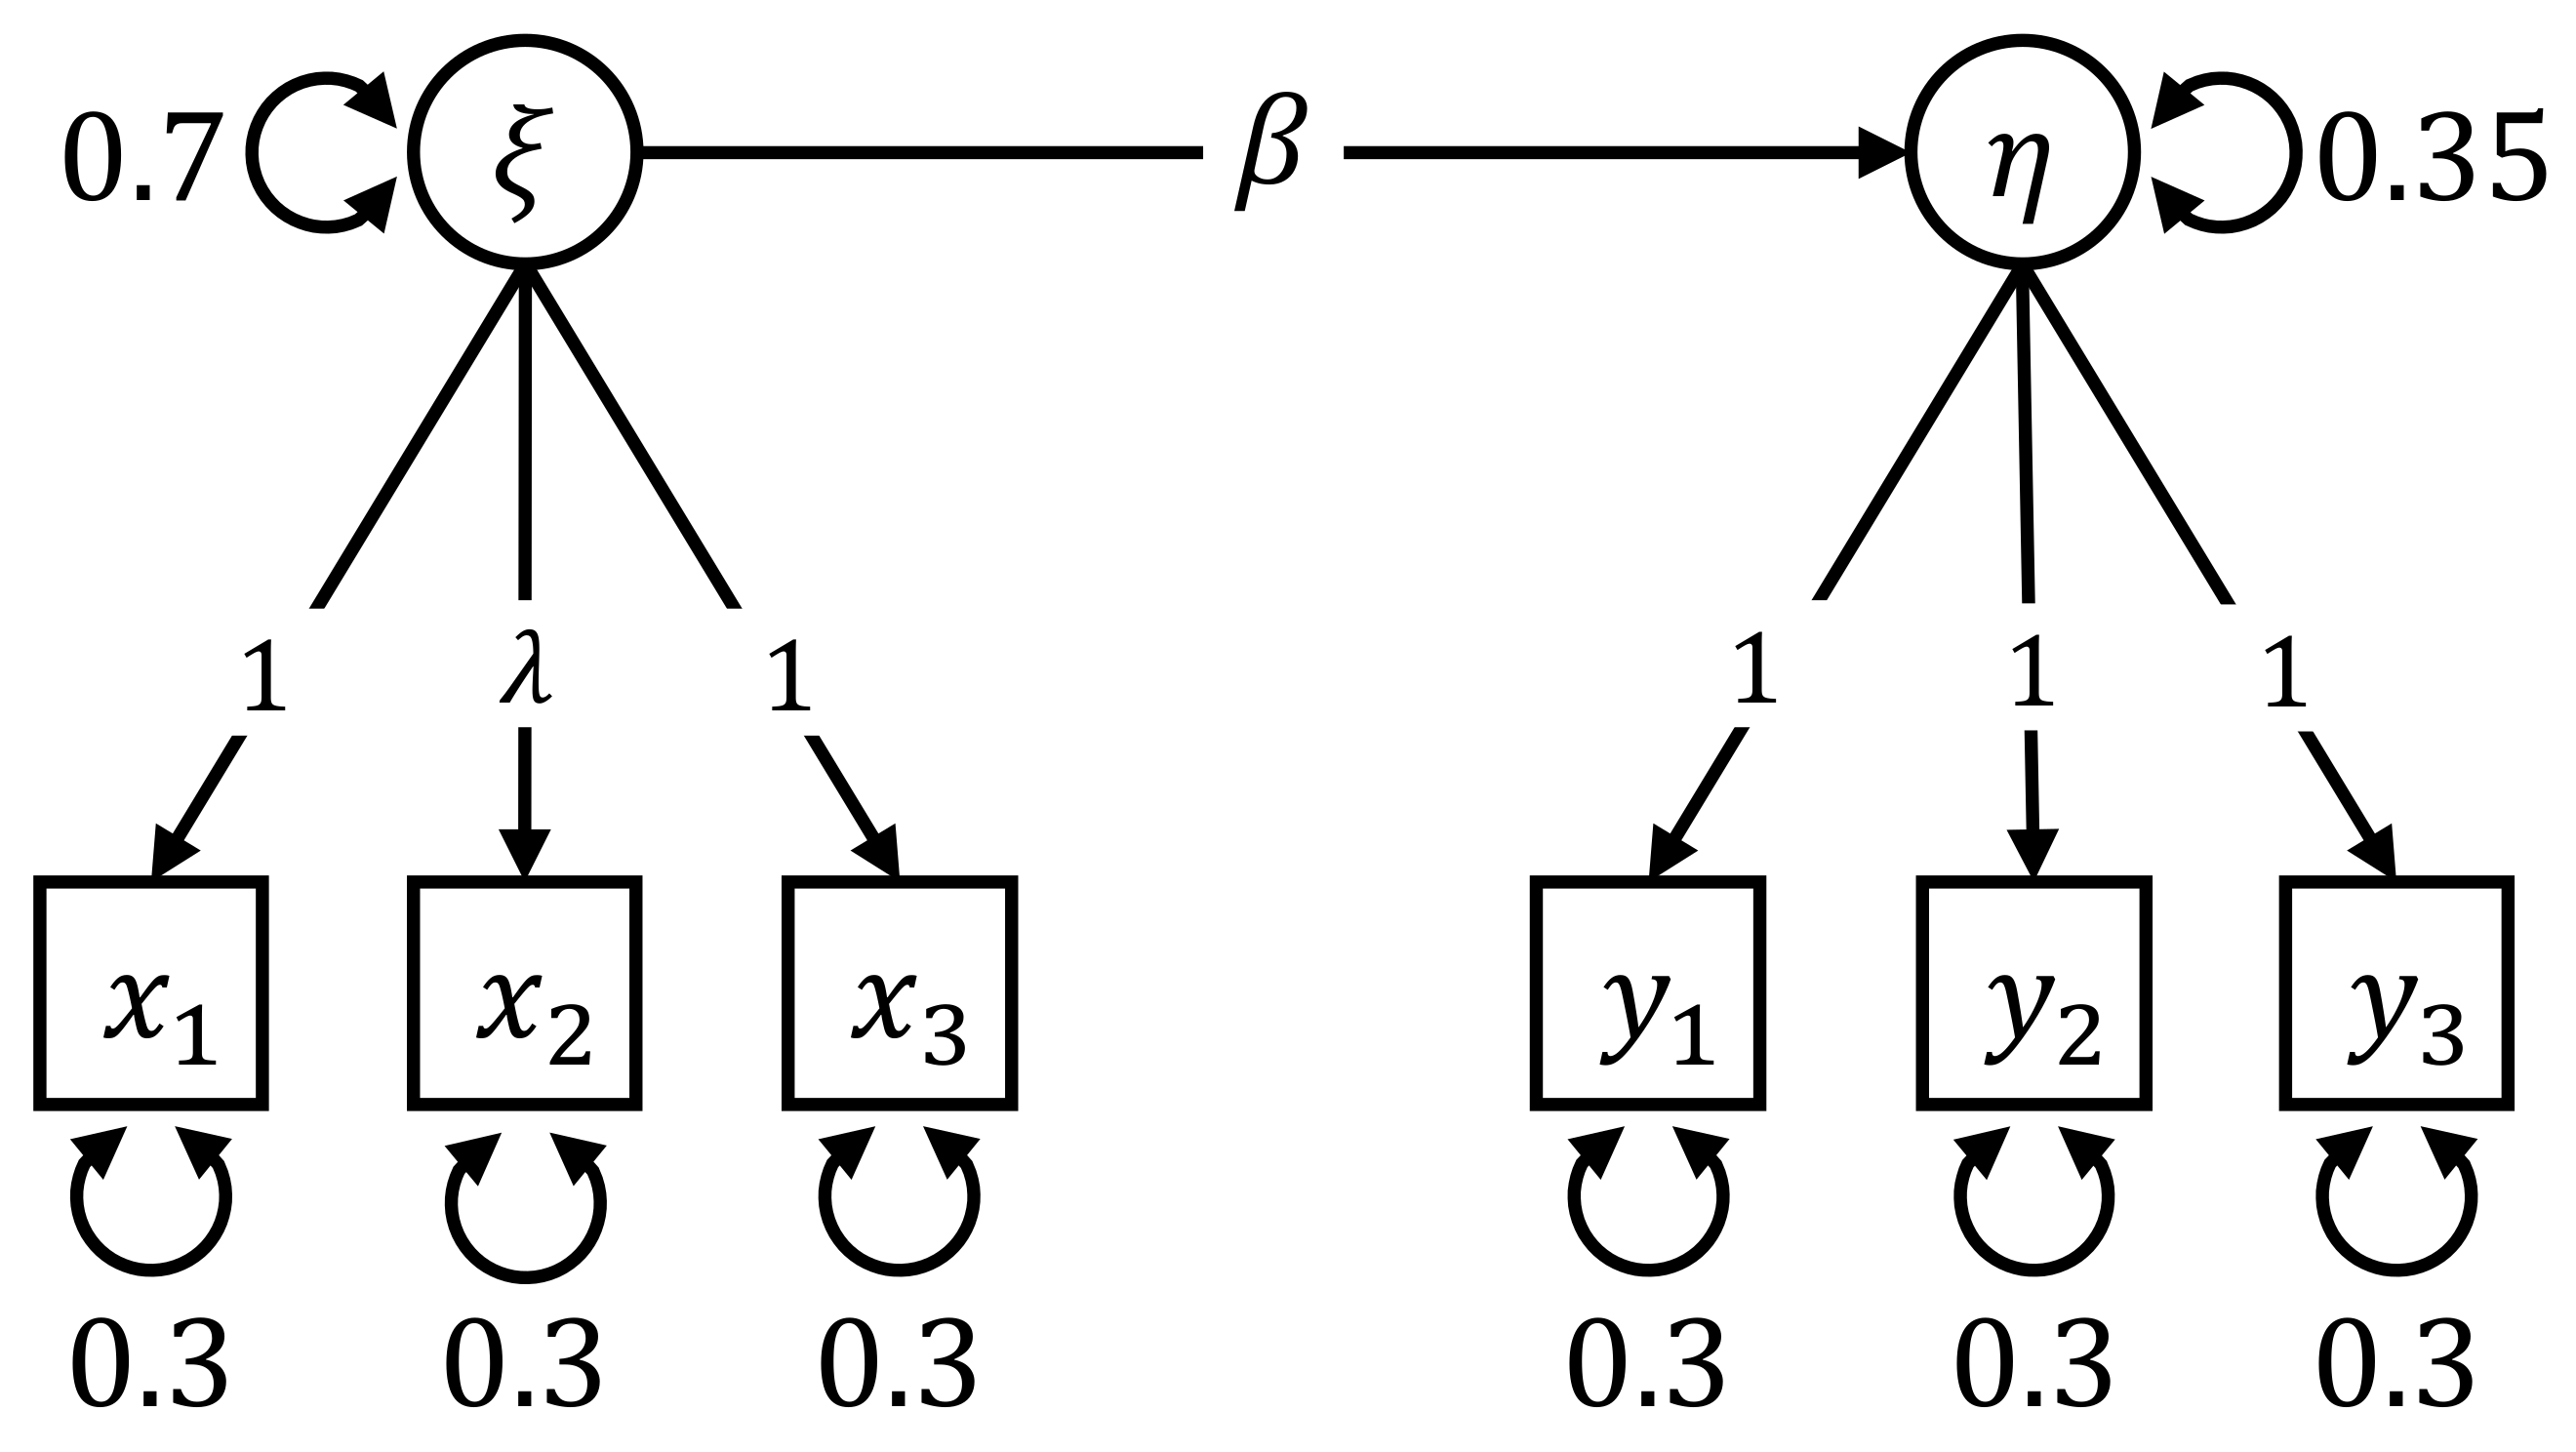
6.3. Simulation III: Group Difference in the Measurement Part
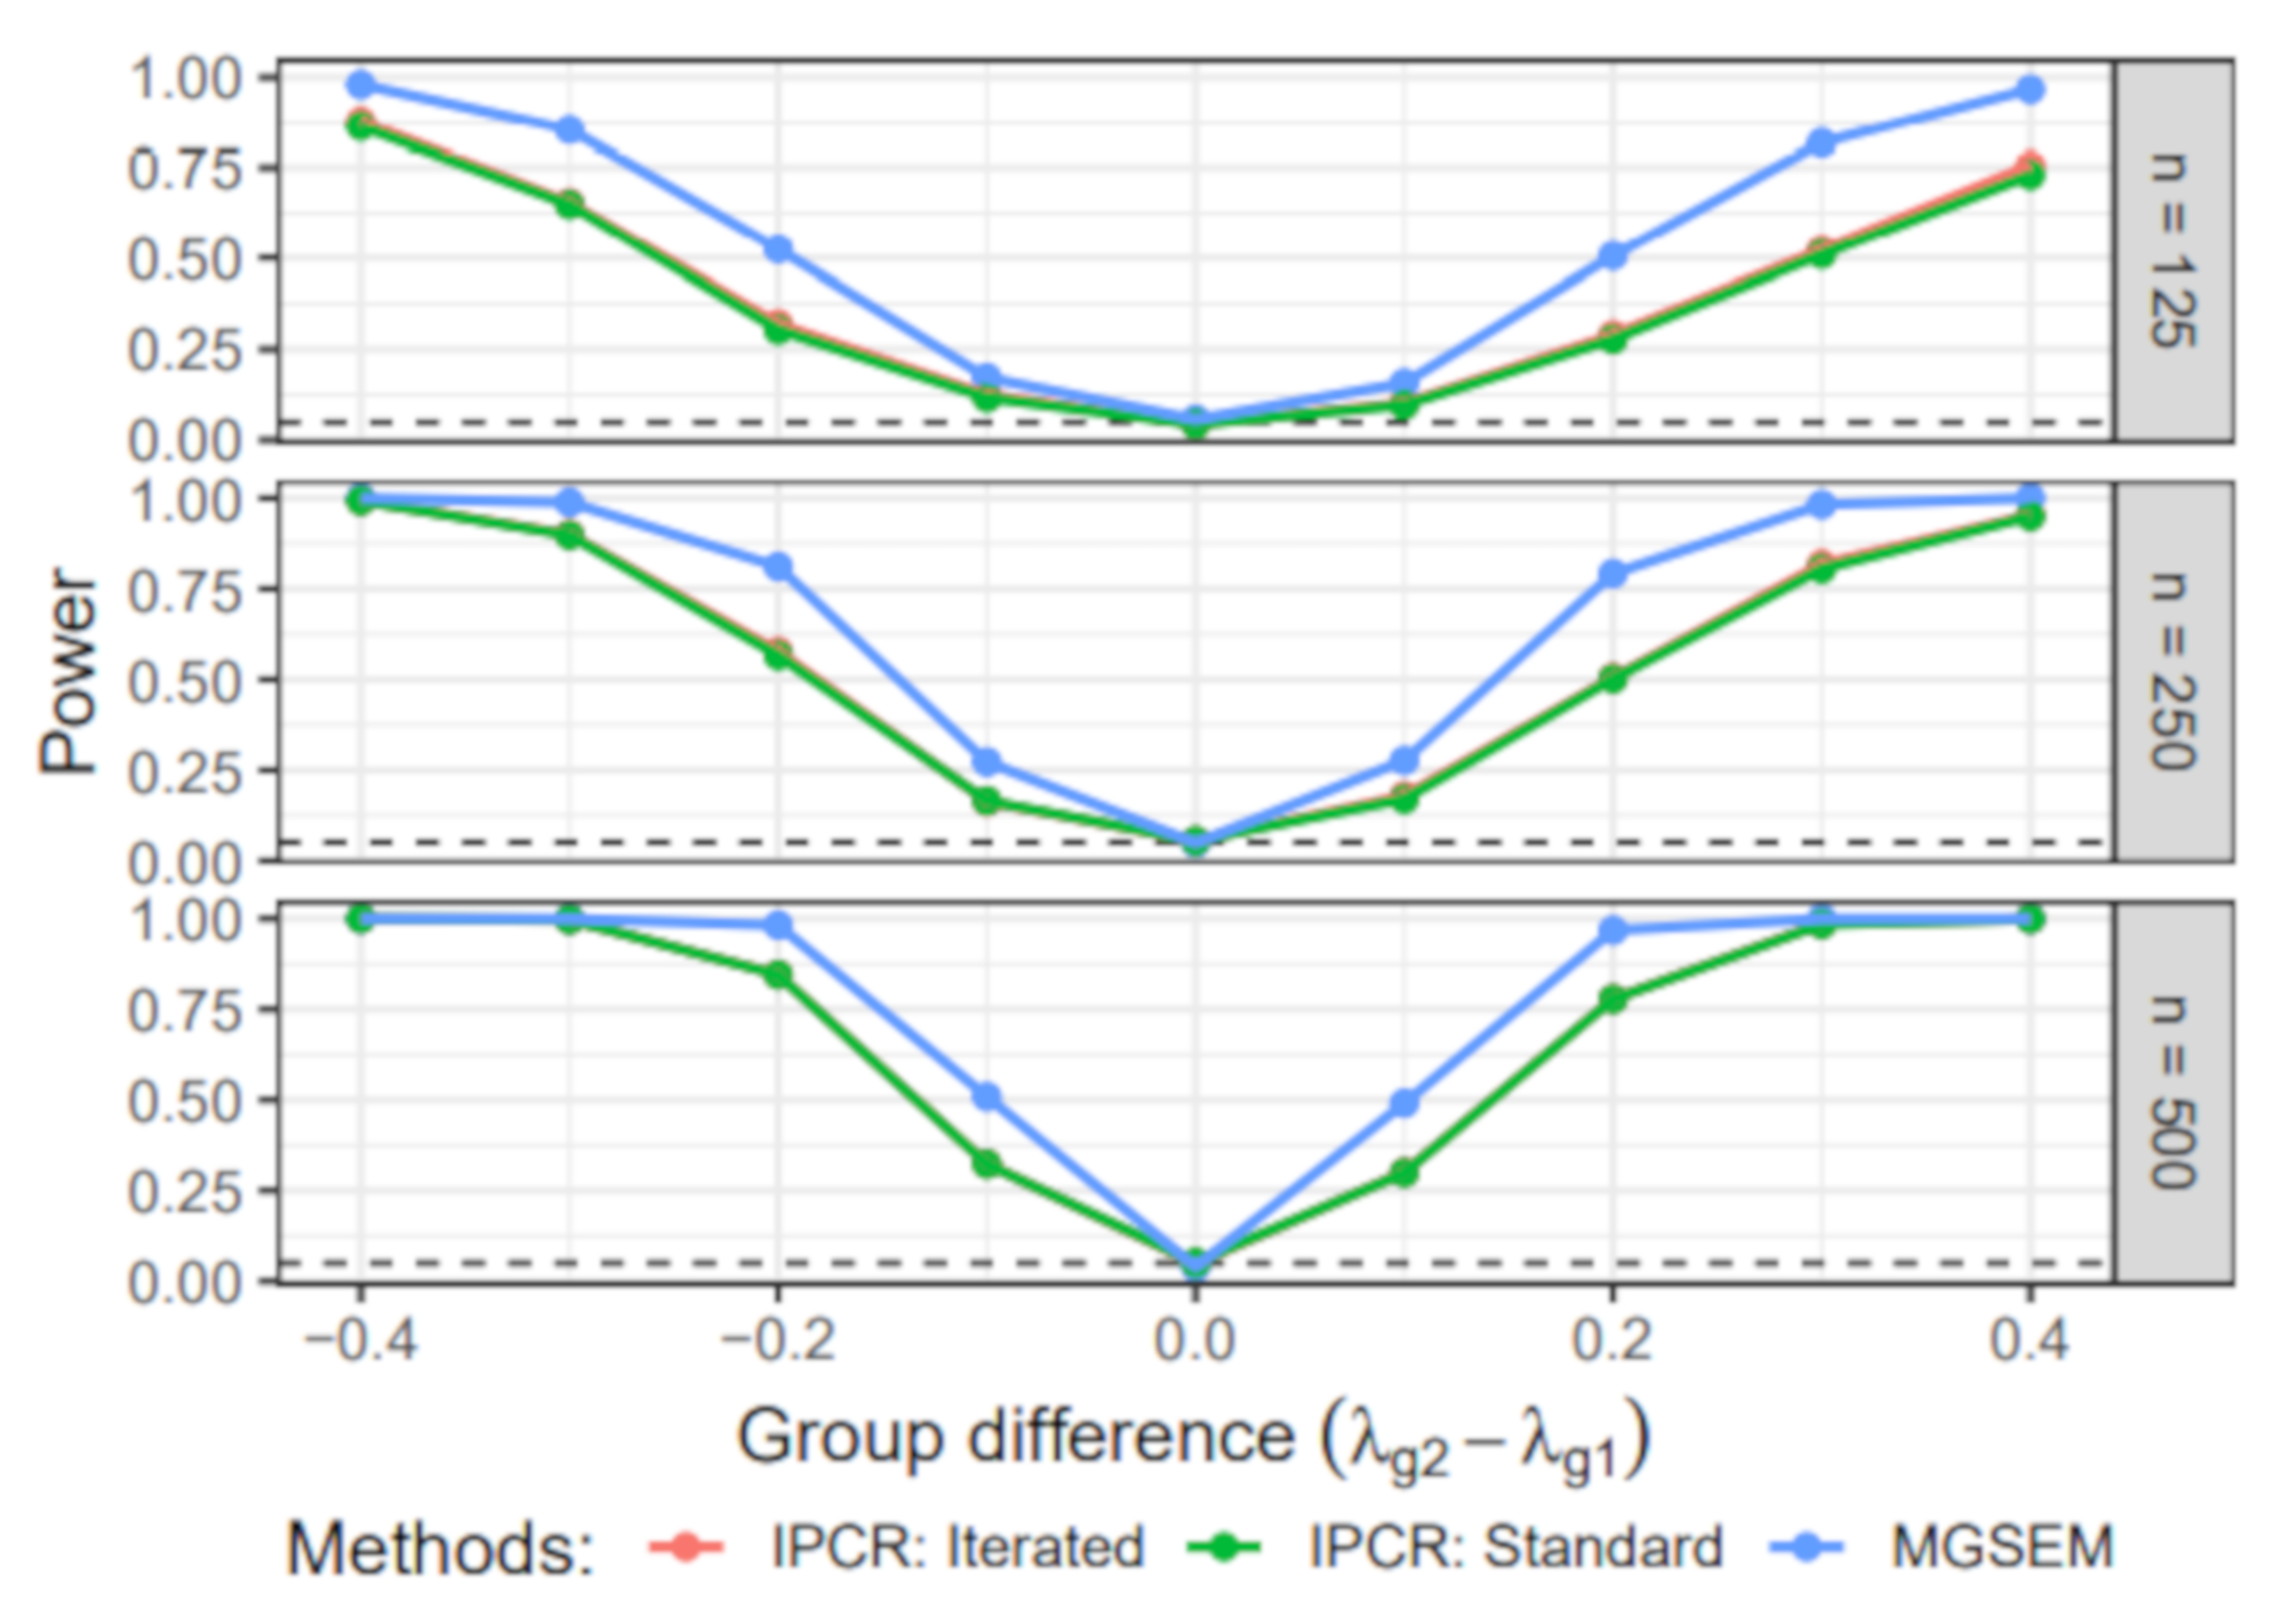
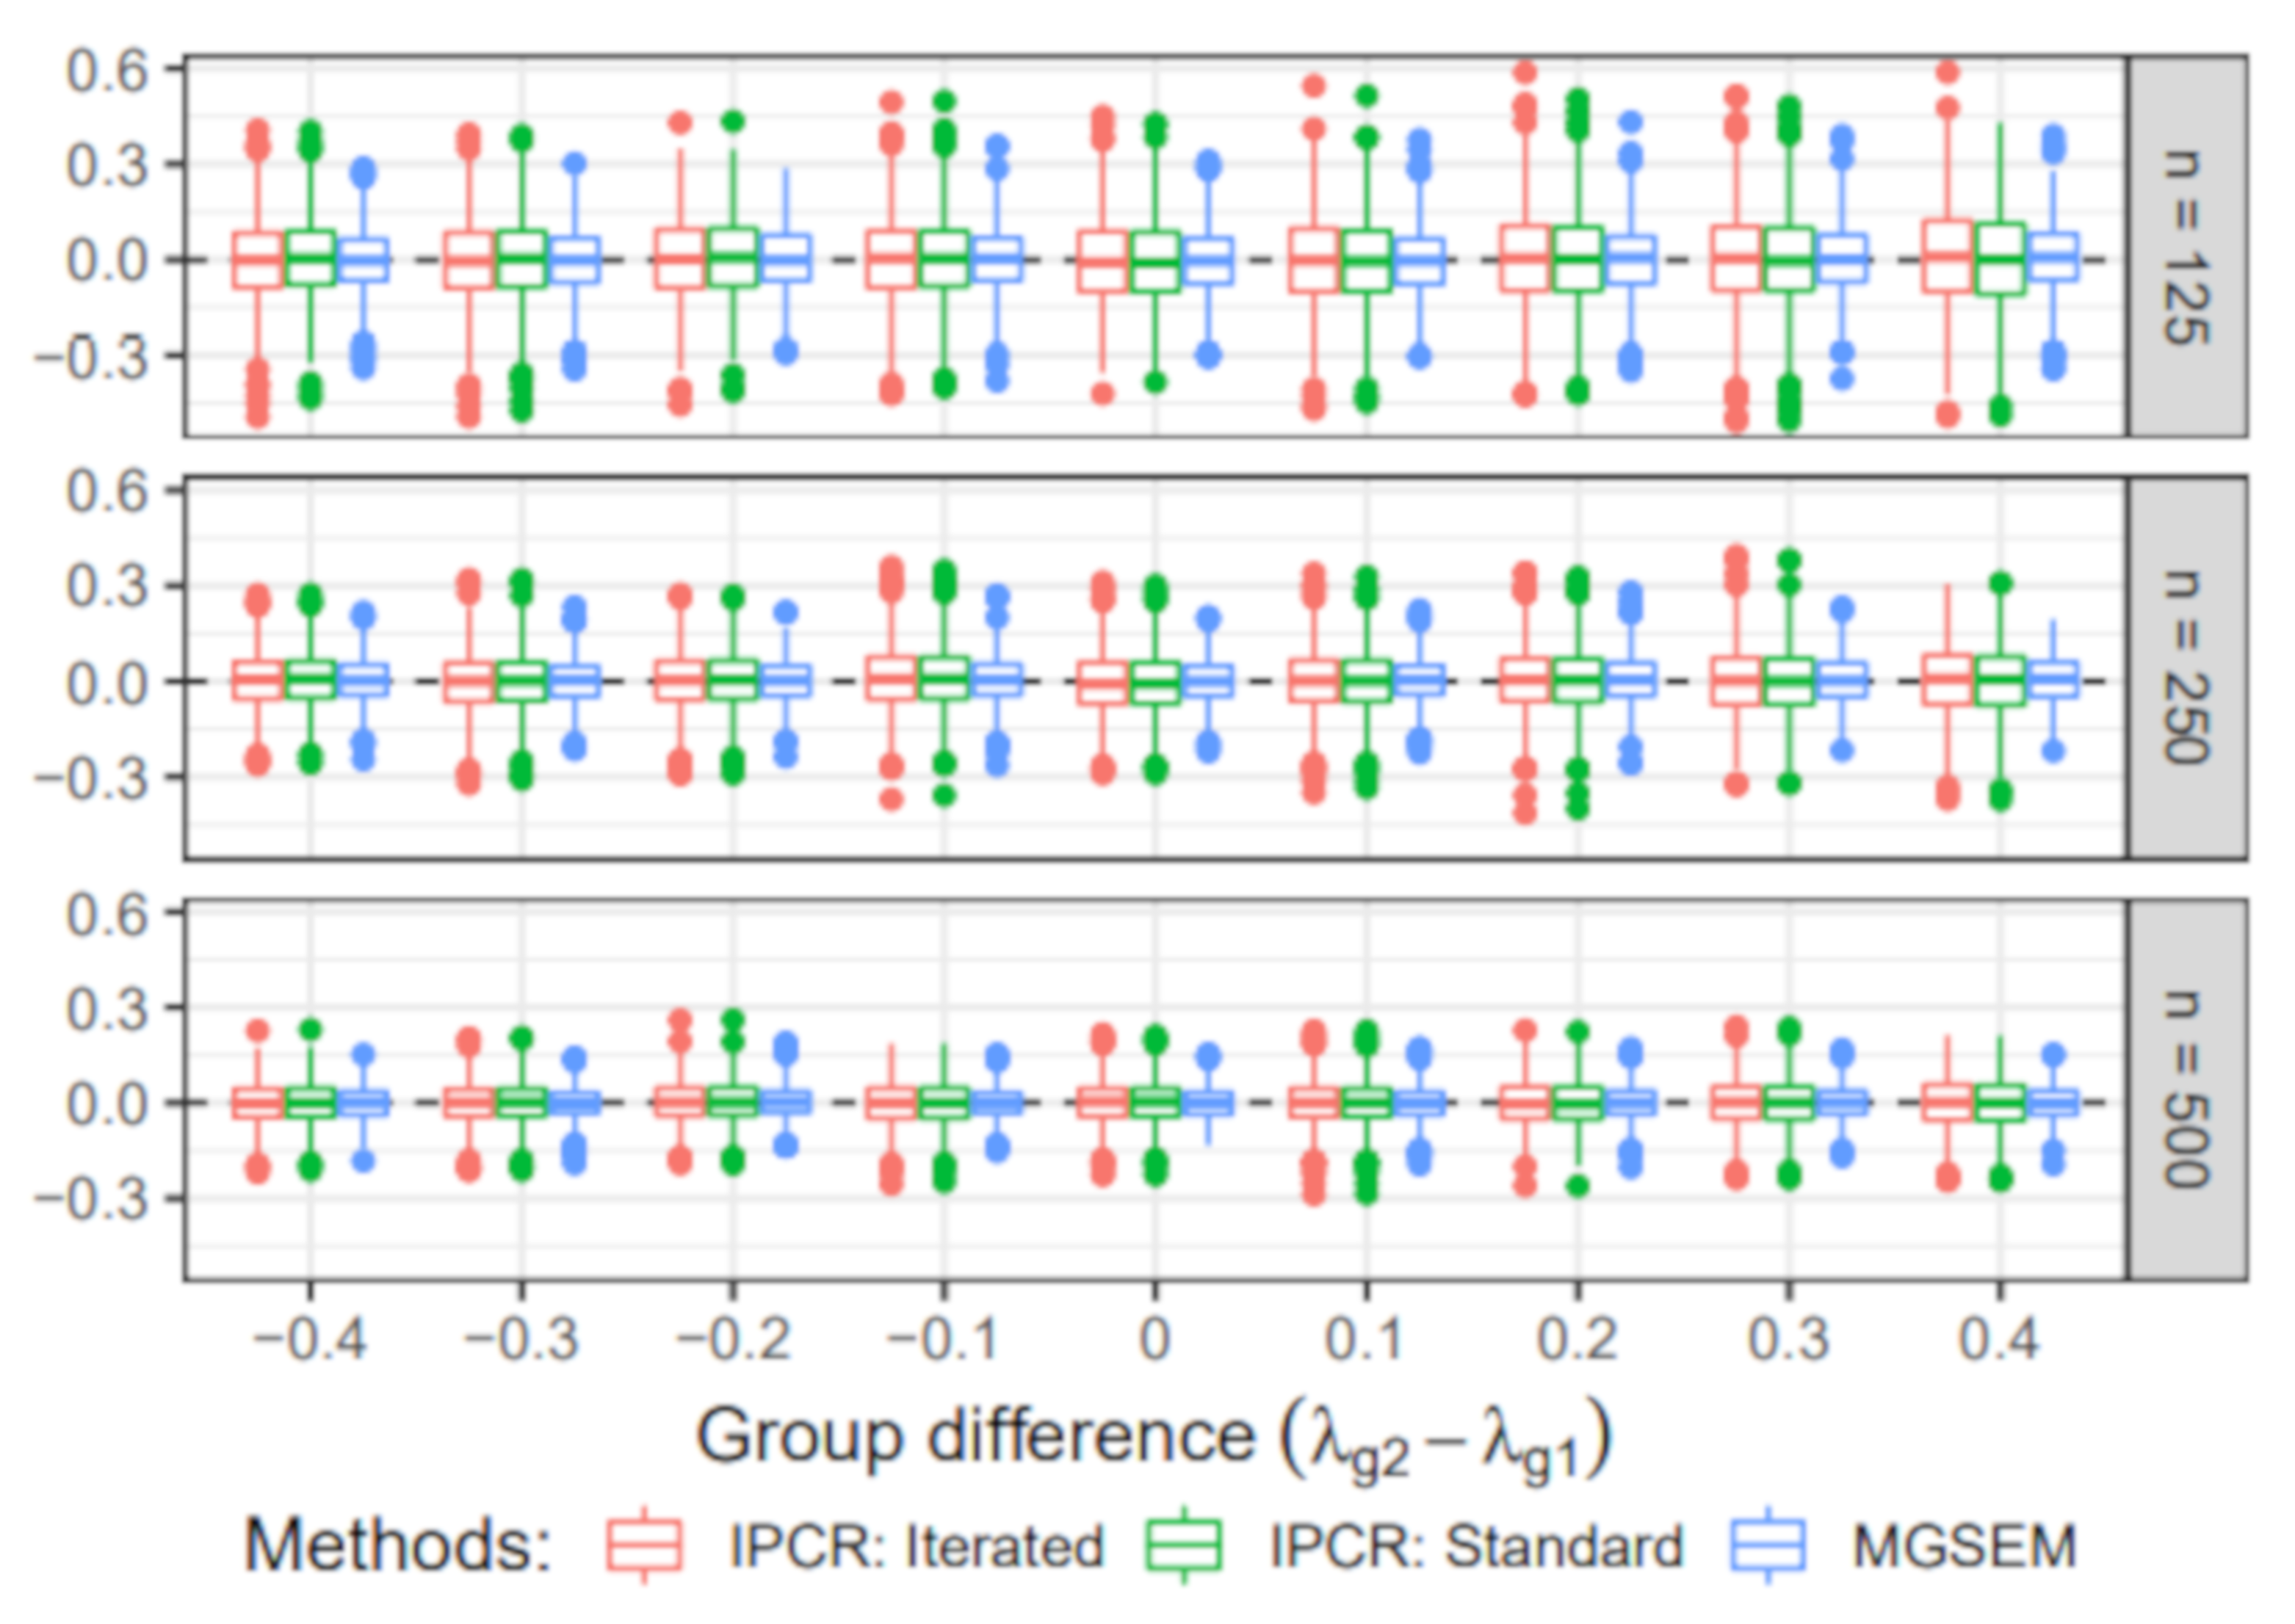
- Group-specific value of λ: The value of the factor loading in the first group was set to 1. For the second group, the value of varied across 0.6, 0.7, 0.8, 0.9, 1, 1.1, 1.2, 1.3, and 1.4.
- Sample size: The sample size per group n was either 125, 250, 500. Therefore, the total sample size N was 250, 500, or 1000.
6.3.1. Power
6.3.2. Estimated Group Difference
6.4. Simulation IV: Individual Differences in the Structural Part
- Value of γ: The dependency of the individual regression parameter values on the covariate was either −0.2, −0.15, −0.1, −0.05, 0, 0.05, 0.1, 0.15, or 0.2. Note that the zero condition corresponds to a homogeneous sample with a constant regression parameter .
- Sample size (N): The simulated samples contained either 250, 500, or 1000 individuals.
6.4.1. Power
6.4.2. Estimated Interaction
7. Discussion
Supplementary Materials
Author Contributions
Funding
Institutional Review Board Statement
Informed Consent Statement
Data Availability Statement
Conflicts of Interest
Appendix A. Convergence of Iterated IPC Regression
Appendix A.1. Simulation II
| N | Number of Covariates | NC |
|---|---|---|
| 250 | 1 | 3.10 |
| 500 | 1 | 0.20 |
| 1000 | 1 | 0.00 |
| 250 | 2 | 9.90 |
| 500 | 2 | 0.60 |
| 1000 | 2 | 0.00 |
| 250 | 3 | 24.40 |
| 500 | 3 | 3.20 |
| 1000 | 3 | 0.00 |
Appendix A.2. Simulation IV
| N | NC |
|---|---|
| 250 | 4.2 |
| 500 | 0.3 |
| 1000 | 0 |
References
- Lindenberger, U. Human cognitive aging: Corriger la fortune? Science 2014, 346, 572–578. [Google Scholar] [CrossRef]
- Kuehner, C. Why is depression more common among women than among men? Lancet Psychiatry 2017, 4, 146–158. [Google Scholar] [CrossRef]
- Jedidi, K.; Jagpal, H.S.; DeSarbo, W.S. Finite-Mixture Structural Equation Models for Response-Based Segmentation and Unobserved Heterogeneity. Mark. Sci. 1997, 16, 39–59. [Google Scholar] [CrossRef]
- Becker, J.M.; Rai, A.; Ringle, C.M.; Völckner, F. Discovering Unobserved Heterogeneity in Structural Equation Models to Avert Validity Threats. MIS Q. 2013, 37, 665–694. [Google Scholar] [CrossRef] [Green Version]
- R Core Team. R: A Language and Environment for Statistical Computing; R Foundation for Statistical Computing: Vienna, Austria, 2020. [Google Scholar]
- Bates, D.; Mächler, M.; Bolker, B.; Walker, S. Fitting Linear Mixed-Effects Models Using lme4. J. Stat. Softw. 2015, 67. [Google Scholar] [CrossRef]
- Bollen, K.A. Structural Equations with Latent Variables; John Wiley & Sons, Inc.: Hoboken, NJ, USA, 1989. [Google Scholar] [CrossRef]
- Kline, R.B. Principles and Practice of Structural Equation Modeling, 4th ed.; Methodology in the Social Sciences; The Guilford Press: New York, NY, USA; London, UK, 2016. [Google Scholar]
- Sörbom, D. A general method for studying differences in factor means and factor structure between groups. Br. J. Math. Stat. Psychol. 1974, 27, 229–239. [Google Scholar] [CrossRef]
- Marsh, H.W.; Wen, Z.; Nagengast, B.; Hau, K.-T. Structural equation models of latent interaction. In Handbook of Structural Equation Modeling; Hoyle, R.H., Ed.; Guilford Press: New York, NY, USA, 2012; pp. 436–458. [Google Scholar]
- Oberski, D.L. A Flexible Method to Explain Differences in Structural Equation Model Parameters over Subgroups. Available online: http://daob.nl/wp-content/uploads/2013/06/SEM-IPC-manuscript-new.pdf (accessed on 5 August 2021).
- Arnold, M.; Oberski, D.L.; Brandmaier, A.M.; Voelkle, M.C. Identifying Heterogeneity in Dynamic Panel Models with Individual Parameter Contribution Regression. Struct. Equ. Model. Multidiscip. J. 2020, 27, 613–628. [Google Scholar] [CrossRef] [Green Version]
- Sörbom, D. Model modification. Psychometrika 1989, 54, 371–384. [Google Scholar] [CrossRef]
- Saris, W.E.; Satorra, A.; Sorbom, D. The Detection and Correction of Specification Errors in Structural Equation Models. Sociol. Methodol. 1987, 17, 105. [Google Scholar] [CrossRef]
- Saris, W.E.; Satorra, A.; van der Veld, W.M. Testing Structural Equation Models or Detection of Misspecifications? Struct. Equ. Model. Multidiscip. J. 2009, 16, 561–582. [Google Scholar] [CrossRef]
- Hjort, N.L.; Koning, A. Tests For Constancy Of Model Parameters Over Time. J. Nonparametric Stat. 2002, 14, 113–132. [Google Scholar] [CrossRef]
- Zeileis, A.; Hornik, K. Generalized M-fluctuation tests for parameter instability. Stat. Neerl. 2007, 61, 488–508. [Google Scholar] [CrossRef]
- Andrews, D.W.K. Tests for Parameter Instability and Structural Change With Unknown Change Point. Econometrica 1993, 61, 821. [Google Scholar] [CrossRef] [Green Version]
- Merkle, E.C.; Zeileis, A. Tests of measurement invariance without subgroups: A generalization of classical methods. Psychometrika 2013, 78, 59–82. [Google Scholar] [CrossRef]
- Merkle, E.C.; Fan, J.; Zeileis, A. Testing for measurement invariance with respect to an ordinal variable. Psychometrika 2014, 79, 569–584. [Google Scholar] [CrossRef] [Green Version]
- Rosseel, Y. Lavaan: An R Package for Structural Equation Modeling. J. Stat. Softw. 2012, 48, 1–36. [Google Scholar] [CrossRef] [Green Version]
- Stefanski, L.A.; Boos, D.D. The Calculus of M-Estimation. Am. Stat. 2002, 56, 29–38. [Google Scholar] [CrossRef]
- Zeileis, A.; Köll, S.; Graham, N. Various Versatile Variances: An Object-Oriented Implementation of Clustered Covariances in R. J. Stat. Softw. 2020, 95, 1–36. [Google Scholar] [CrossRef]
- Neale, M.C.; Hunter, M.D.; Pritikin, J.N.; Zahery, M.; Brick, T.R.; Kirkpatrick, R.M.; Estabrook, R.; Bates, T.C.; Maes, H.H.; Boker, S.M. OpenMx 2.0: Extended Structural Equation and Statistical Modeling. Psychometrika 2016, 81, 535–549. [Google Scholar] [CrossRef] [PubMed]
- Wang, T.; Strobl, C.; Zeileis, A.; Merkle, E.C. Score-Based Tests of Differential Item Functioning via Pairwise Maximum Likelihood Estimation. Psychometrika 2018, 83, 132–155. [Google Scholar] [CrossRef]
- Wickham, H.; Hester, J.; Chang, W. Devtools: Tools to Make Devoloping R Packages Easier. [Computer software manual]. (R package version 2.3.2). 2020. Available online: https://cran.r-project.org/web/packages/devtools/ (accessed on 6 August 2021).
- Van Buuren, S. Flexible Imputation of Missing Data, 2nd ed.; CRC Press: Boca Raton, FL, USA; London, UK; New York, NY, USA, 2018. [Google Scholar]
- Meinfelder, F. Multiple Imputation: An attempt to retell the evolutionary process. AStA Wirtsch. Sozialstat. Arch. 2014, 8, 249–267. [Google Scholar] [CrossRef] [Green Version]
- Cohen, J.; Cohen, P.; West, S.G.; Aiken, L.S. Applied Multiple Regression/Correlation Analysis for the Behavioral Sciences, 3rd ed.; Routledge Taylor & Francis Group: New York, NY, USA; London, UK; Mahwah, NJ, USA, 2003. [Google Scholar]
- Tibshirani, R. Regression Shrinkage and Selection Via the Lasso. J. R. Stat. Soc. Ser. B 1996, 58, 267–288. [Google Scholar] [CrossRef]
- Tibshirani, R. Regression shrinkage and selection via the lasso: A retrospective. J. R. Stat. Soc. Ser. B 2011, 73, 273–282. [Google Scholar] [CrossRef]
- Shmueli, G. To Explain or to Predict? Stat. Sci. 2010, 25, 289–310. [Google Scholar] [CrossRef]
- Friedman, J.; Hastie, T.; Tibshirani, R. Regularization Paths for Generalized Linear Models via Coordinate Descent. J. Stat. Softw. 2010, 33, 1. [Google Scholar] [CrossRef] [Green Version]
- Boynton, P.M.; Wood, G.W.; Greenhalgh, T. Reaching beyond the white middle classes. BMJ 2004, 328, 1433–1436. [Google Scholar] [CrossRef] [Green Version]
- Marsh, H.W.; Wen, Z.; Hau, K.T. Structural equation models of latent interactions: Evaluation of alternative estimation strategies and indicator construction. Psychol. Methods 2004, 9, 275–300. [Google Scholar] [CrossRef]
- Lin, G.C.; Wen, Z.; Marsh, H.; Lin, H.S. Structural Equation Models of Latent Interactions: Clarification of Orthogonalizing and Double-Mean-Centering Strategies. Struct. Equ. Model. Multidiscip. J. 2010, 17, 374–391. [Google Scholar] [CrossRef]
- MacCallum, R.C.; Roznowski, M.; Necowitz, L.B. Model modifications in covariance structure analysis: The problem of capitalization on chance. Psychol. Bull. 1992, 111, 490–504. [Google Scholar] [CrossRef]
- Yarkoni, T.; Westfall, J. Choosing Prediction Over Explanation in Psychology: Lessons From Machine Learning. Perspect. Psychol. Sci. J. Assoc. Psychol. Sci. 2017, 12, 1100–1122. [Google Scholar] [CrossRef]
- Raudenbush, S.W.; Bryk, A.S. Hierarchical linear models: Applications and data analysis methods. In Advanced Quantitative Techniques in the Social Sciences, 2nd ed.; SAGE Publications: Thousand Oaks, CA, USA, 2002; Volume 1. [Google Scholar]
- Singer, J.D.; Willett, J.B. Applied Longitudinal Data Analysis: Modeling Change and Event Occurrence; Oxford University Press: Oxford, UK, 2003. [Google Scholar]
- Zeileis, A.; Hothorn, T.; Hornik, K. Model-Based Recursive Partitioning. J. Comput. Graph. Stat. 2008, 17, 492–514. [Google Scholar] [CrossRef] [Green Version]
- Strobl, C.; Malley, J.; Tutz, G. An introduction to recursive partitioning: Rationale, application, and characteristics of classification and regression trees, bagging, and random forests. Psychol. Methods 2009, 14, 323–348. [Google Scholar] [CrossRef] [Green Version]
- Brandmaier, A.M.; von Oertzen, T.; McArdle, J.J.; Lindenberger, U. Structural equation model trees. Psychol. Methods 2013, 18, 71–86. [Google Scholar] [CrossRef] [Green Version]
- Brandmaier, A.M.; Prindle, J.J.; McArdle, J.J.; Lindenberger, U. Theory-guided exploration with structural equation model forests. Psychol. Methods 2016, 21, 566–582. [Google Scholar] [CrossRef] [PubMed] [Green Version]
- Arnold, M.; Voelkle, M.C.; Brandmaier, A.M. Score-Guided Structural Equation Model Trees. Front. Psychol. 2021, 11, 3913. [Google Scholar] [CrossRef] [PubMed]
- Lubke, G.H.; Muthén, B. Investigating population heterogeneity with factor mixture models. Psychol. Methods 2005, 10, 21–39. [Google Scholar] [CrossRef] [Green Version]
- Muthén, B.; Shedden, K. Finite mixture modeling with mixture outcomes using the EM algorithm. Biometrics 1999, 55, 463–469. [Google Scholar] [CrossRef]
- McLachlan, G.J.; Peel, D. Finite Mixture Models; Wiley Series in Probability and Statistics Applied Probability and Statistics Section; Wiley: New York, NY, USA, 2000. [Google Scholar]



| Variable Name | Description | Level of Measurement |
|---|---|---|
| Model data: | ||
| x1 | Visual perception | Interval (, ) |
| x2 | Cubes | Interval (, ) |
| x3 | Lozenges | Interval (, ) |
| Covariates: | ||
| sex | Gender | Nominal (48.3% female, 51.7% male) |
| ageyr | Age, year part | Interval (, ) |
| agemo | Age, month part | Interval (, ) |
| school | School (Pasteur or Grant-White) | Nominal (52% Pasteur, 48% Grant-White) |
| grade | Grade | Ordinal (52.3% grade 7, 47.7% grade 8) |
Publisher’s Note: MDPI stays neutral with regard to jurisdictional claims in published maps and institutional affiliations. |
© 2021 by the authors. Licensee MDPI, Basel, Switzerland. This article is an open access article distributed under the terms and conditions of the Creative Commons Attribution (CC BY) license (https://creativecommons.org/licenses/by/4.0/).
Share and Cite
Arnold, M.; Brandmaier, A.M.; Voelkle, M.C. Predicting Differences in Model Parameters with Individual Parameter Contribution Regression Using the R Package ipcr. Psych 2021, 3, 360-385. https://doi.org/10.3390/psych3030027
Arnold M, Brandmaier AM, Voelkle MC. Predicting Differences in Model Parameters with Individual Parameter Contribution Regression Using the R Package ipcr. Psych. 2021; 3(3):360-385. https://doi.org/10.3390/psych3030027
Chicago/Turabian StyleArnold, Manuel, Andreas M. Brandmaier, and Manuel C. Voelkle. 2021. "Predicting Differences in Model Parameters with Individual Parameter Contribution Regression Using the R Package ipcr" Psych 3, no. 3: 360-385. https://doi.org/10.3390/psych3030027
APA StyleArnold, M., Brandmaier, A. M., & Voelkle, M. C. (2021). Predicting Differences in Model Parameters with Individual Parameter Contribution Regression Using the R Package ipcr. Psych, 3(3), 360-385. https://doi.org/10.3390/psych3030027


