Next Article in Journal
Intelligence and Religiosity among Dating Site Users
Next Article in Special Issue
Self-Reported Food Insecurity and Depression among the Older Population in South Africa
Previous Article in Journal / Special Issue
Intelligence, Income and Their Relation to Nutrition
 
 
Please note that, as of 22 March 2024, Psych has been renamed to Psychology International and is now published here.
Article

Dietary Patterns and Depression: First Results in a Cross-Sectional Study from the Brazilian Longitudinal Study of Adult Health (ELSA-Brasil)

1
Oswaldo Cruz Foundation, Rio de Janeiro 21040-900, Brazil
2
School of Medicine, University of São Paulo, São Paulo 05508-220, Brazil
3
School of Medicine, Federal University of Rio Grande do Sul, Porto Alegre 90040-060, Brazil
*
Author to whom correspondence should be addressed.
Psych 2020, 2(1), 11-24; https://doi.org/10.3390/psych2010002
Submission received: 5 November 2019 / Revised: 11 December 2019 / Accepted: 17 December 2019 / Published: 20 December 2019
(This article belongs to the Special Issue Advances in Health, Social Psychology and Psychiatry)

Abstract

:
Background: Relations between diet and mental health continue to be a subject for controversy and an increasing numbers of studies. Recent literature is represented by papers that examine overall diet by way of dietary patterns and its association with depression, replacing previous studies about nutrients. The aim of this cross-sectional study is to evaluate the relation between dietary patterns and depressive episode in the baseline (2008–2010) population of the Brazilian Longitudinal Study of Adult Health (ELSA-Brasil). We analyzed 14,798 participants of ELSA-Brasil. Methods: We constructed dietary patterns based on the Food Frequency Questionnaire using multiple correspondence and cluster analysis; to evaluate depressive episodes, we used the Clinical Interview Schedule-Revised (CIS-R). As an independent variable, we used the patterns: Traditional, Low-Sugar/Low-Fat, Fruit-Vegetables, and Bakery Products. We used multiple logistic regression models to evaluate relations between the dietary patterns and depressive episodes. Results: The Traditional pattern showed the highest percentages of consumption. After adjusting, the Bakery Products (OR = 1.33; 95%CI 1.05–1.70) was associated positively and significantly with depressive episodes only for women. Conclusions: International studies corroborated this finding, suggesting that the Bakery Products pattern could be a marker of a specific population group in which depressive episodes are frequent.

1. Introduction

Depression is one of the most prevalent common mental disorders worldwide. The World Health Organization (WHO) forecasts that by 2030, depression will be the main cause of disability-adjusted life years lost [1]. In 2013, depression ranked tenth in the global burden of disease (GBD), and depression appeared also among the ten most common causes in the GBD both for developed countries and Brazil [2]. The prevalence of depression depends on how it is assessed, the severity of the symptoms, and the criteria applied [3].
Relations between diet and mental health are controversial, and the number of studies on the subject has recently increased [4,5,6,7,8,9]. Mental disorders are multifactorial, and diet may be one of these factors because it modulates several related hormonal, immunological, and biochemical factors. Once that association is established, modifications can be proposed by way of strategies based on improvements and alterations to diet.
Certain mechanisms have been pointed out to explain how the intake of certain nutrients and foods relates to depression. Sánchez-Villegas et al. (2013) [7] suggested a link among increased proinflammatory cytokines and endothelial dysfunction and depression, given that this dysfunction is a low-grade inflammatory disorder. In that regard, endothelial dysfunction and a poor lipid profile (e.g., caused by complications connected with trans fat) may be responsible for depression [7]. Other authors have suggested that folate may have a protective effect against depression because of its regulatory role in neurotransmitter production, which may influence the risk of depression [10]. Some papers have demonstrated that the intake of certain nutrients (saturated fatty acids) and food (bakery products, such as muffins, doughnuts, croissants) is associated with depression [11,12].
The literature has also addressed overall diet in the form of dietary patterns and its association with depression [6,9,13,14,15,16,17,18,19,20,21,22,23,24,25]. Broadly, these studies’ findings have suggested that a healthy dietary pattern is positively associated with a decrease in depression risk. The Mediterranean dietary pattern, which is characterized by plant-based food; olive oil as the main source of fat; a moderate consumption of fish, poultry, dairy products, and eggs; small amounts of red meat, and moderate wine intake, has been associated with a low prevalence of depression. In contrast, the Western dietary pattern of consumption, generally characterized by high intake of red and processed meat, butter, fried foods, refined grains, potatoes, and high-sugar drinks, has been related to an increased risk of developing and aggravating this mental disorder [7,15,26,27]. A study of women from the Whitehall II survey observed that lower scores on the Alternative Healthy Eating Index (AHEI) were directly associated with recurring depressive symptoms, suggesting that a less-healthy diet may be a risk factor for depression [7].
Brazil is experiencing rapid, adverse changes in its population’s dietary patterns accompanied by an increasing prevalence of depression. Notably, in the literature review, we found only one study on the relation between dietary patterns and depression, and the sample was a cohort of approximately 250 pregnant women in Rio de Janeiro. In that study, consumption of a dietary pattern considered healthy (comprising dairy products, fruit and fruit juices, green vegetables and legumes, candy, fish, cakes and cookies/crackers, noodles, pasta, roots and tubers, and tea) prior to the pregnancy was inversely associated with depressive symptoms. In addition, a high adherence to a healthy dietary pattern prior to pregnancy was associated with lower scores on the Edinburgh Postnatal Depression Scale [22]. Although some cross-sectional studies in high income countries have been conducted analyzing the relationship between dietary patterns and depression, there is sparse evidence in Brazil. The country has a large variety of food and maintains traditional foods such as rice and beans in their diet. Also, 70% of the energy diet intake come from natural or minimally processed food [28], against 39% in Canada [29]. Because of this, a Brazilian study can add a valuable contribution in the field of dietary studies.
The aim of this study was to investigate the association between dietary patterns and depressive episode in the baseline (2008–2010) population of the Brazilian Longitudinal Study of Adult Health (ELSA-Brasil) study.

2. Materials and Methods

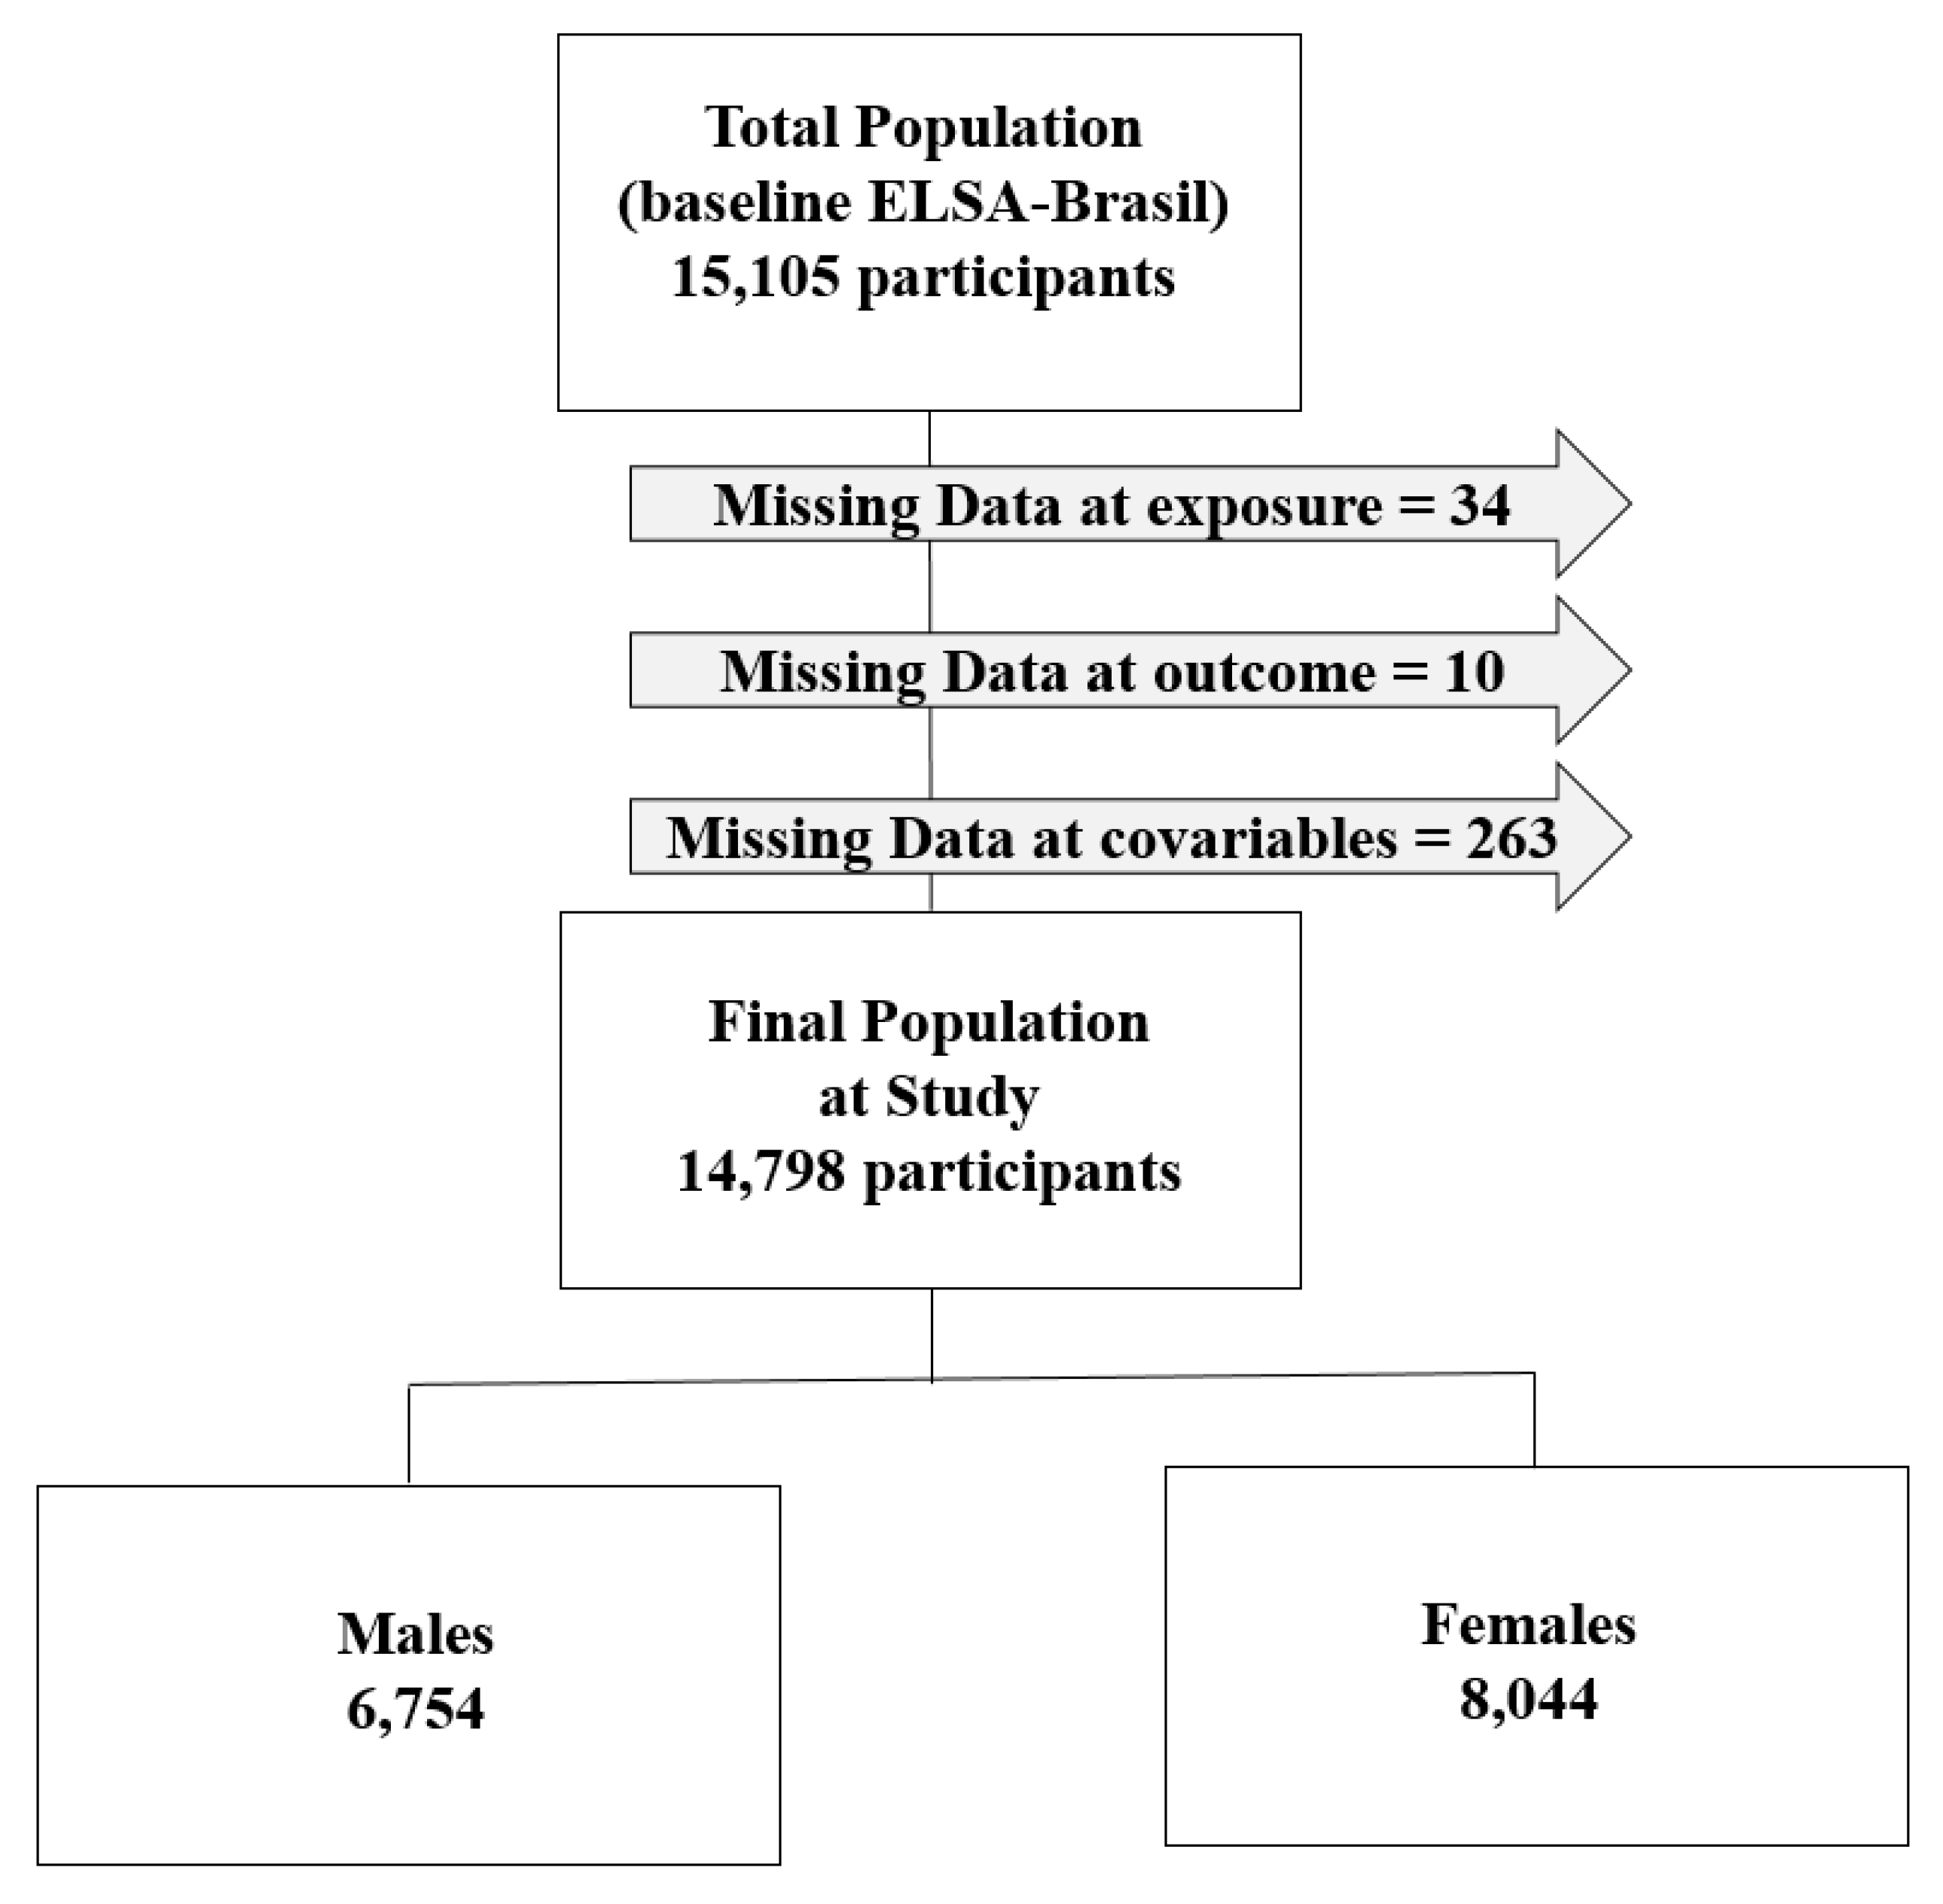
2.1. Study Population

The ELSA-Brasil study is a multicenter cohort whose baseline (2008–2010) participants were 15,105 civil servants, aged 34 to 75 years, from teaching and research institutions in six Brazilian cities (Belo Horizonte, Porto Alegre, Rio de Janeiro, Salvador, São Paulo, and Vitória). The study’s aim was to investigate the incidence and progression of cardiovascular diseases and diabetes and their social, occupational, environmental, psychological, and biological determinants [30,31]. The baseline assessment took approximately seven hours in two stages, included interviews and tests conducted by a trained team, and measurement quality control was performed by a team of supervisors [32]. The strategies and routines organization of clinical tests and interviews are described elsewhere [33,34].
The main outcomes of ELSA-Brasil (cardiovascular disease and diabetes) were estimated from a sample size of approximately 6400 participants. The ELSA-Brasil study pre-enrolled 15,821 participants who responded to an initial interview and were schedule for the baseline examination. The response rate at baseline was 95.5% after 716 of those pre-enrolled participants did not complete the baseline examination [30].
All measurements, examinations, and tests were obtained by the interviewers using standardized instruments and forms to ask all questions to the participants using previously standardized scripts. During the entire data collection period, measurement quality control was performed by a team of supervisors.
This cross-sectional study included 14,798 (97.9%) of the ELSA-Brasil participants because missing values in variables of final model were excluded (n = 307) (Figure 1).

2.2. Diet Assessment and Dietary Patterns Estimation

The Food Frequency Questionnaire (FFQ) comprises 114 food items and was developed to evaluate overall an individual’s food consumption, identify their dietary habits, and investigate this exposure and its association with cardiovascular health and non-communicable chronic diseases. On the basis of a previously validated questionnaire, we selected food items. We slightly adapted the FFQ based on a pilot study performed at the six ELSA-Brasil research centers using a 100 24-h dietary recalls (R24h). Then, we grouped some foods (e.g., zucchini, chayote, and eggplant) into single items. When different types of the same food displayed different nutritional features (e.g., white or whole rice; full-cream, semi-skimmed, or skimmed milk), participants were asked to indicate which type they consumed most often, and only that one was recorded. FFQ was applied by trained interviewers to evaluate participants’ typical consumption in the previous 12 months. It was structured as follows: (1) foods/preparation; (2) number of portions, expressed in household measures or reference units; and (3) consumption frequencies (i.e., “once a day”, “2–3 times a day”, “more than 3 times a day”, “5–6 times a week”, “2–4 times a week”, “once a week”, “1–3 times a month”, and “never/almost never”). Participants were asked about their consumption of each food item in the 12 months preceding the interview. To facilitate the participants’ choices, they were shown a response card with the consumption frequency options, eliminating the need to memorize them. The results of the FFQ quality evaluation demonstrated a satisfactory reliability for all nutrients and an acceptable relative validity for energy, macronutrients, calcium, potassium, and vitamins E and C [35].
To identify dietary patterns, the 114 food items were assembled into ten food groups. Multiple correspondence analysis (MCA) [36] was used initially to aggregate the frequency categories in each group. In statistics, MCA is a data analysis technique for nominal categorical data, used to detect and represent underlying structures in a data set. It does this by representing data as points in a low-dimensional Euclidean space. The procedure thus appears to be the counterpart of principal component analysis for categorical data.
Thus, the items were reassembled into two or three categories based on the type of clustering of frequency category coordinates observed on the graphs extracted from MCA, instead of the eight frequencies categories, which generated new subgroups inside the original groups. For example, four subgroups were identified from the fruit group: (a) Fruit consumed daily (i.e., Brazil’s more-popular fruit: papaya, apple, orange, and banana); (b) All types of fruit consumed weekly; (c) Less-popular fruit and fruit salad without a complement consumed daily; (d) Fruit not consumed. After identifying the number of possible subgroups from the MCA graphs, the vectors of the first two axes, corresponding with the coordinates of the food frequency categories, were extracted. That procedure made defining the number of subgroups by cluster partition analysis (partitioning around medoids -PAM) possible. At this stage, the cluster graphs were examined to ascertain intragroup homogeneity and intergroup heterogeneity, and the silhouette graphs were used to assist in an analysis of the cluster quality of the previously established k groups. Silhouette refers to a method of interpretation and validation of consistency within clusters of data. The graph represents how well each object lies within its cluster. The silhouette value is a measure of how similar an object is to its own cluster (cohesion) when compared to other clusters (separation)—the closer the silhouette value is to 1, the better placed those items are in the group [37].
Next, four dietary patterns, Traditional, Low-Sugar/Low-Fat, Fruit and Vegetables, and Bakery Products, were identified from the FFQ. The number of dietary patterns was established based on the best separation into clusters, best silhouette chart, and largest mean silhouette statistic. The silhouette statistics for each variable and whole process of dietary patterns estimation are described elsewhere [38].
As complementary measures, the means and standard deviations were estimated for the intake of nutrients related to the mechanisms by which depression presents [39], such as vitamin A (iu), vitamin E (mg), soluble fiber (g), folate (mcg), trans fats (g), and saturated fatty acids (g), based on the Nutrition Data System for Research schedule [40], by the dietary pattern classification above.

2.3. Evaluation of Episodes of Depression

A depressive episode (without psychotic symptoms) included in group F32.xx, but not F32.8 and F32.9 codes, of the International Classification of Diseases (ICD-10) was computed after the application of the Clinical Interview Schedule-Revised (CIS-R) by trained interviewers. This instrument was developed by Lewis et al. (1992) [41] and was culturally adapted to Brazil and translated into Portuguese [42]. The CIS-R is a structured interview for evaluating common mental disorders by ascertaining symptoms and diagnostic screening for non-psychotic mental disorders in communities or primary health care facilities. The reliability and standardization of the CIS-R are described elsewhere. Correlation coefficient of agreement between interviewers was 0.91 (SE 2.89) in the British population. Sensitivity and specificity when compared with the GHQ-12 (General Healthy Questionnaire–12) were 71% and 76%, respectively, and in a Brazilian university hospital sample [41,43].
Somatic symptoms, fatigue, concentration and forgetfulness, sleep problems, irritability, worry about physical health, depression, depressive ideas, worry, anxiety, phobias, panic, compulsions, and obsessions represent the sections of the CIS-R. Through these sections, the questions assess frequency, duration, severity, and onset time in the last seven days [44].
Lewis et al. (1992) [41] proposed a data consolidation algorithm that uses the ICD-10 diagnostic criteria for the research of depressive episode to classify respondents as positive or negative for a depressive episode. Besides depression, five other diagnostic categories can be obtained from this CIS-R algorithm, which examines the answers from 14 sections of the CIS-R: (1) generalized anxiety disorder, (2) mixed anxiety and depressive disorder, (3) depressive episode, (4) phobias, (5) obsessive–compulsive disorder and (6) panic disorder [44].
The five ICD-10 types of depressive episodes evaluated by the CIS-R include (a) mild depressive episode without somatic symptoms; (b) mild depressive episode with somatic symptoms; (c) moderate depressive episode without somatic symptoms; (d) moderate depressive episode with somatic symptoms; and (e) severe depressive episode without psychotic symptoms; the five types were aggregated into one dichotomous variable with status equivalent to 0 = presence or 1 = absence of a depressive episode. If any type of depressive episode is present, the dichotomous variable is classified as 1 (presence of depressive episode).
In the baseline data collection, introductory questions from the CIS-R about appetite and fluctuations in weight were not included in the ELSA-Brasil questionnaire. Although these questions do not contribute to the total score of the common mental disorders, they are considered when arriving at the diagnosis of a depressive episode. As a result, the prevalence of depressive episodes may have been slightly underestimated.

2.4. Covariates

The covariates are part of ELSA-Brasil database and, for this study, were selected to reflect sociodemographic variables and variables that may affect the association between dietary patterns and depressive episode. Body mass Index (BMI) was calculated from the anthropometric measurements of weight and height and standardized by the ELSA-Brasil data center. We used the Physical Activity Questionnaire (IPAQ), according to its guidelines for data processing and analysis, to collect the data on physical activity and to compute metabolic equivalent minutes (MET-minutes). MET-minutes were computed for walking, moderate-intensity activities, and vigorous-intensity activities using the following formulae: Walking MET-minutes/week = 3.3 * (amount of walking minutes) * (amount of walking days); Moderate MET-minutes/week = 4.0 * (amount of moderate-intensity activity minutes) * (amount of moderate-intensity days); Vigorous MET-minutes/week = 8.0 * (amount of vigorous-intensity activity minutes) * (amount of vigorous-intensity days). The total physical activity in MET-minutes/week was computed as the sum of Walking + Moderate + Vigorous METs/week scores [45].
These covariates were as follows: Sex (male or female), age (continuous), schooling (never attended school or did not complete elementary school—less than five years of schooling; complete elementary school or incomplete secondary school—less than 12 years of schooling; complete secondary school—12 years of schooling; university degree—more than 12 years of schooling), marital status (married/cohabiting, separated/divorced, single, widowed), BMI (underweight < 18.5 g/m2, normal weight = 18.50–24.99 g/m2, overweight = 25–29.99 g/m2, obese > 29.99 g/m2), and MET-minutes (continuous).

2.5. Statistical Analysis

To characterize the study population, the distribution of variables and covariates were calculated. Additionally, the prevalence of depressive episode was calculated by the category of these variables.
The associations between dietary patterns and depressive episodes were estimated using multiple logistic regression models. To evaluate the importance of each variable in the model and to choose the final model, we used deviance statistics and the Akaike information criterion (AIC) [46]. Lower values were considered a better fit.
In the ELSA-Brasil study, the Traditional dietary pattern is the best representation of the Brazilian dietary pattern. Because of this, and considering the representativeness of this dietary pattern into the sample size of this study (approximately 46%), this pattern was chosen as a reference category in analyses.
The results of an analysis of interaction between sex and dietary patterns proved statistically nonsignificant. However, the option to stratify the population by sex stemmed from the indication, according to the literature, that, in the age groups represented in the ELSA-Brasil study population, depressive episodes are more present among women than men [5,44,47,48,49,50].
All analyses were performed using R Software, version 2.15.3 [51] in the R Studio environment, version 0.97.551 [52].

2.6. Ethical Considerations

This study, given its multicenter nature, was approved by the research ethics committees of the six institutions involved and the National Research Ethics Council of Brazil (Conselho Nacional de Ética em Pesquisa, CONEP). Informed consent was obtained from all the participants included in the study.

2.7. Conflict of Interest and Responsibility for the Manuscript

The authors declare that there are no known conflicts of interest and certify their responsibility for the manuscript.

3. Results

The study’s participants were 54.4% (n = 8044) women, and the mean age was 52.1 years. More than half (50.7% of men and 54.5% of women) had a university degree. Most were married or cohabiting, although there was a conspicuous difference between men and women (81.9% and 53%, respectively). Regarding BMI, 65.8% of the men and 61% of the women were overweight or obese. Reflecting their level of physical activity, the mean values of MET among those who displayed depressive episodes were lower than those among the overall study population (575.2 and 294.2 MET, respectively, for men and women who displayed depressive episodes, compared with a mean of 803.6 and 563.8 MET for the overall male and female ELSA-Brasil populations, respectively). Participants were distributed in dietary patterns as Traditional (n = 6745; 45.6%), Low-Sugar/Low-Fat (n = 640; 4.3%), Fruit and Vegetables (n = 3793; 25.6%), and Bakery Products (n = 3620; 24.5%). The Traditional dietary pattern accounted for the highest percentages of participants (47.3% of the men and 44.1% of the women), whereas 31% of the women were classified in the Fruit and Vegetables pattern and 19.2% in the Bakery Products pattern. Inversely, 30.8% of men were classified in the Bakery Products pattern and 19.3% in the Fruit and Vegetables pattern, as seen in Table 1.
The prevalence of depressive episodes was 4.22%: higher among the women (5.8%) than men (2.3%). The mean age among the men and women who were depressed was slightly lower than among the participants who were not depressed (men = 50.7 versus 52.4 years and women = 52.0 versus 51.2 years). In terms of schooling, the highest prevalence of depression were found among the men and women with complete elementary school or incomplete secondary school schooling (3.9% and 8.4%, respectively). Among men, the prevalence of depression was highest in widowers (6.2%), among women; a prevalence of comparable magnitude (7.6%) was found in those classified as separated/divorced. Regarding BMI, the highest prevalence of depression was among underweight men (3.1%) and obese women (7.7%) (Table 1).
The highest mean values of the daily consumption of vitamin A, vitamin E, and soluble fiber were observed among the participants classified in the Low-Sugar/Low-Fat pattern (18,438.62 iu, 16.13 mg, and 11.69 g, respectively), whereas the lowest were in the Bakery Products pattern (11,089.73 iu, 10.70 mg, and 8.76 g, respectively). Mean daily intake of folate, which plays a protective role against depression [51], was highest in the individuals classified in either the Traditional (786.44 mcg) or Bakery Products pattern (754.26 mcg). Meanwhile, these patterns displayed the highest mean consumption of trans fats and saturated fatty acids.
As a complementary analysis, we used dietary patterns to check the nutrients that, according to the literature, are related to depression (Table S1, Supplementary Materials).
Table 2 presents the results of the crude and adjusted measures of association from the logistic models. Considering all participants, positive and statistically significant associations were observed between the Bakery Products dietary pattern and depressive episodes in the crude model [OR = 1.33 (95% CI 1.10–1.62)], but marginally significant in the adjusted model [OR = 1.20 (95% CI 0.98–1.47)]. Among the men, no significant associations were found between dietary patterns and depressive episodes. Among the women, positive and statistically significant associations were observed between the Bakery Products dietary pattern and depressive episodes, with OR = 1.63 (95% CI 1.29–2.05) in the crude model and OR = 1.33 (95% CI 1.05–1.70) in the adjusted model, taking the Traditional dietary pattern as a reference category. Accordingly, the odds that women who experienced a depressive episode would be classified in the Bakery Products dietary pattern were about 33% higher than for those who had not experienced such an episode when the Traditional dietary pattern was taken for reference (Table 2).
The sociodemographic characteristics of the women classified as fitting the Bakery Products dietary pattern demonstrate that they were married or cohabiting (50%), were overweight or obese (about 65%), and consumed a mean metabolic equivalent of around 279 MET. Notably, this group of women had the lowest percentage of having a university degree (30%, compared with 58%, 58%, and 86% for the Traditional, Fruit and Vegetables, and Low-Sugar/Low-Fat dietary patterns, respectively) and the highest percentage of obesity (30%) compared with the other groups (Traditional = 24%, Fruit and Vegetables = 25%, and Low-Sugar/Low-Fat = 17%) (Table S2, Supplementary Materials).

4. Discussion

This study investigated the associations between dietary patterns and depressive episodes in 14,798 participants of the ELSA-Brasil study. The Bakery Products dietary pattern (OR = 1.33—95%CI 1.05–1.70) was associated positively and significantly with depressive episodes in women. This finding is corroborated by international studies that researched dietary patterns and depression in medium and high development countries.
Generally, the consumption of fruit and vegetables is related to a healthy dietary pattern. In this study, the Bakery Products dietary pattern excluded these food types, and its findings are corroborated by a series of Brazilian and international studies that have investigated the association between diet quality and depression, either by grouping nutrients or evaluating dietary patterns under the generic headings of healthy and unhealthy [6,9,15,16,18,19,20,21,22,23,24,25,39].
In addition, the Bakery Products dietary pattern was the most consistent and robust of all the profiles (silhouette = 0.60). The individuals in this group do not consume foods protective of health, such as fruit, vegetables, and other legumes. This group comprises lower-cost foods and ultra-processed items consumed in snacks, and an upward trend is observed in such consumption in Brazil. Unexpectedly, the Fruit and Vegetables dietary pattern (the only one characterized by daily consumption of these food groups) includes fast food consumed daily or weekly. We consider that the presence of fast food removes this pattern’s potential to attribute to a healthy pattern (or protective dietary pattern to depression) in this study. However, the presence of fast food in this group reinforces a theory, according to which, apparently, “inconsistent” food choices are common and reflect dietary practices influenced by a complex web of factors caused by the macro to micro level of everyday life.
Interestingly, in the literature, the findings from each of the studies remain consistent despite major variations in populations, methods of measurement, groupings of categories used to classify and identify dietary patterns, and the diversity of instruments used to evaluate symptoms of depression or to screen diagnoses of depressive episodes—applying diagnostic criteria from the Diagnostic and Statistical Manual of Mental Disorders or the International Classification of Diseases. Li et al., 2017 [53], performed a meta-analysis on dietary patterns and depression and concluded that the results from the studies included in their paper suggest that healthy dietary patterns may decrease the risk of depression when compared with an unhealthy pattern.
The findings of the Whitehall II, a British study of a population of civil servants, are striking in that respect. That study examined the participants’ adherence to a healthy dietary pattern, evaluated by the AHEI, and argued that, prospectively, this type of behavior was positively and significantly associated with a lower risk of showing the symptoms of depression, measured by the Center for Epidemiologic Studies Depression Scale (CES-D) or by self-reported use of antidepressant drugs in women (p-trend, 0.001; for 1 SD in AHEI score; OR: 0.59; CI 95%: 0.47–0.75) but not men [9]. Despite this study using a priori methods to evaluate dietary patterns, their results are in the same direction as the findings of our study.
In this study, the Bakery Products dietary pattern returned the lowest means for consumption of antioxidants, such as vitamins A and E. Notably, the deficit of vitamins A and E, which act as anti-inflammatories, has been associated with the incidence of depression. The hypothesis is that inflammation possibly plays a role in depression by way of mechanisms such as activation of the hypothalamic–pituitary–adrenal axis, tryptophan depletion, and reduced availability of brain-derived neurotrophic factors [54,55].
Sánchez-Villegas et al. (2012) [12] monitored 8964 participants in Spain to study the association between depression and a diet rich in bakery products and/or fast food (a profile similar to the Bakery Products pattern in this study). Their diet was evaluated by means of the FFQ, and depression was measured from the self-reported use of antidepressants or self-reported diagnosis of depression. After a follow-up period of more than six years, 493 cases of depression were reported, and the results indicate that depression was positively associated with consumption of fast food and bakery products.
The Bakery Products pattern in this study included ultra-processed foods rich in fat, sugar, and salt. Experimental studies in animals have shown that different combinations of these nutrients produced sensations of pleasure and addiction in individuals [56]. The findings of this study seem to indicate that the positive association found between the Bakery Products pattern and depressive episodes ratifies the findings of other studies that have associated depression with sugar and fat intake [39].
Another aspect that should be considered in our work, in the face of cross-sectional design, is the craving (characterized by an intense and conscious desire, usually to consume a specific drug or food) [57,58,59,60]. The craving, when it comes to food, includes the consumption of sweets, chips, and pastries, which are high in fats and carbohydrates [61]. The studies indicate that, in depression, low levels of serotonin may lead to the search for foods high in carbohydrates [59]. In our study, it may be that depression is motivating the consumption of foods that are part of the Bakery Products dietary pattern. However, Knüppel et al. (2017) [62], in a study conducted with data from the Whitehall II study, analyzed longitudinal data and concluded that low sugar intake may be associated with better mental health, but that the presence of common mental disorders or depression did not predict food intake changes over a period of about ten years.
These findings are part of the ELSA-Brasil study, a multicenter cohort with 15,105 baseline participants that was meticulous about validating its questionnaires (including the FFQ) and monitoring the application of its research protocols with the goal of evaluating the quality of the study. The use of the CIS-R, which enabled the diagnoses of depressive episode to be screened based on the ICD-10, goes beyond the usual measurement applied to evaluate the symptoms of depression in many of the studies that evaluate common mental disorders. Largely, the instruments used to assess common mental disorders are a type of quick screener that obtain results by a sum of “zeros” and “ones” attributed to the questions, generating a score with a single cut-off [63,64,65].
One possible limitation is the possibility of misclassifications in the patterns, given that this technique classifies individuals into mutually exclusive patterns. However, our objective was to identify typical behaviors, characterizing the main aspects of behaviors typified in individuals, which is a potential use of the analysis employed [36].
Although the design of our study does not guarantee the precedence of the Bakery Products pattern in the causal chain for the onset of depressive episode, other studies have pointed in the same direction as our findings [53,66]. Notably, the CIS-R assesses depressive episodes in the last seven days (very recent episodes), whereas dietary patterns could be considered as habits or lifestyles that require much more time to be studied because they are derived from a variety of environmental factors and culture or ethnic heritage. Thus, the possibility that dietary patterns precede depressive episode is more plausible than the inverse (depressive episode preceding dietary patterns). However, the relationships between dietary patterns and depression are extremely complex, either because of the complexity of the assessment and composition of dietary patterns or the multiplicity of factors involved in the emergence of depression [53,67,68]. Jacka et al. (2015) [69], reinforce the idea that current depression is associated with poorer dietary habits, in a study about reverse causality in diet and depression. By contrast, dietary patterns do reveal participants’ eating habits; participants classified in one dietary pattern do not eat exclusively the ingredients it comprises, and participants may be borderline cases between one dietary pattern and another. Additionally, it is possible that FFQ has introduced some recall bias: if participants are worried about diet restrictions, they could dedicate extra attention to their food ingestion quality. On the other hand, is worth mentioning that evaluation of FFQ results are reliable and valid at ELSA-Brasil.
We consider that the assessment of depressive episodes during the last seven days without a clinical evaluation about depression history or information about previous depressive episodes could be a limitation to understanding lifelong depression. However, we are studying depression at baseline of ELSA-Brasil as our first results in association with diet patterns and using the CIS-R, which is a robust screening instrument used around the world. This consideration and the sectional study design suggest the need of new investigations using longitudinal data.
In this study, the prevalence of depressive episodes may have been slightly underestimated since the baseline data collection introductory questions from the CIS-R about appetite and fluctuations in weight were not included in the ELSA-Brasil questionnaire. Thus, the associations found could have higher magnitude than was expressed.
There is always some residual confound in the analyses of most studies. Thus, in this paper, we tested other variables but did not include them as confounders or effect modifiers variables (e.g., ethnicity, comorbid mental disorders, medication, smoking or alcohol consumption) because we tried to limit the potential of overadjustment in these preliminary analyses. In addition, the use of antidepressant drugs and the sociodemographic characteristics of the participants classified into the Bakery Products dietary pattern may possibly reveal lifestyle habits entangled with the risk factors involved in the relation between dietary patterns and depression and, accordingly, indicate causal relationships.
In this study, the sociodemographic characteristics of the women classified as fitting the Bakery Products dietary pattern point to a population with a lower level of schooling than the participants classified in the other dietary patterns; additionally, a higher percentage were obese. Those findings suggest that this group is more socially vulnerable and has more limited access to healthy foods. Thus, the Bakery Products pattern is possibly a marker of a specific population group in which depressive episodes are recurrent.
Another noteworthy datum is the age range of this study’s population (adults over 34 years old), making it difficult to compare with the many other studies that have used populations over 18 years old. By contrast, this study included participants over 65 years old (up to 75 years of age), making it possible to observe the prevalence of depressive episodes and their association with dietary patterns in an elderly population [70].
This study intended to contribute to the literature by considering new aspects of the factors relevant to the relationship between diet and depression. These include the indication that, going beyond studies of causality, some attention should be given to the multiplicity of contextual factors that form part of the individual’s subjectivity.

5. Conclusions

In this study, depressive episode were associated positively and significantly, only for women, with the Bakery Products dietary pattern. This study on dietary patterns and depression indicates that dietary patterns are associated with the occurrence of depressive episodes in women. This finding is corroborated by international studies, suggesting that the Bakery Products pattern could be a marker of a specific population group in which depressive episodes are frequent.

Supplementary Materials

The following is available online at https://www.mdpi.com/2624-8611/2/1/2/s1, Table S1: Dietary patterns, by daily nutrient intake (n = 14,798, ELSA-Brasil, 2008–2010). Table S2: Distribution of women, by dietary pattern and study variables (n = 8044, ELSA-Brasil, 2008–2010).

Author Contributions

Conceptualization, A.B.M. and L.O.C.; Methodology, A.B.M. and L.O.C.; Formal analysis, A.B.M.; Investigation, A.B.M.; Resources, D.C., I.M.B., R.H.G.; Data curation, D.C., I.M.B., R.H.G.; Writing—original draft preparation, A.B.M.; Writing—review and editing, D.C., I.M.B., M.A.N., R.H.G., L.O.C. Project administration, A.B.M.; Funding acquisition, D.C., I.M.B., R.H.G. All authors read and approved final version to be published. All authors have read and agreed to the published version of the manuscript.

Funding

The Estudo Longitudinal de Saúde do Adulto (ELSA-Brasil) was funded by Brazil’s Ministry of Health (Departamento de Ciência e Tecnologia, Decit) and Ministry of Science and Technology (Financiadora de Estudos e Projetos, Finep, and Conselho Nacional de Desenvolvimento Científico e Tecnológico, CNPq), under Processes Nos. 01 06 0010.00 RS, 01 06 0212.00 BA, 01 06 0300.00 ES, 01 06 0278.00 MG, 01 06 0115.00 SP, and 01 06 0071.00 RJ.

Acknowledgments

The authors are grateful to the 15,105 participants recruited for this study, without whom this paper and others based on the ELSA-Brasil cohort could never have come about.

Conflicts of Interest

The authors declare no conflict of interest. The funders had no role in the design of the study; in the collection, analyses, or interpretation of data; in the writing of the manuscript, or in the decision to publish the results.

Data Availability Statement

The data that support the findings of this study are available on request from the corresponding author. The data are not publicly available due to privacy or ethical restrictions.

References

  1. World Health Organization. WHO: The Global Burden of Disease, 2004; World Health Organization: Geneva, Switzerland, 2008. [Google Scholar]
  2. Murray, C.J.L.; Barber, R.M.; Foreman, K.J.; Abbasoglu Ozgoren, A.; Abd-Allah, F.; Abera, S.F.; Aboyans, V.; Abraham, J.P.; Abubakar, I.; Abu-Raddad, L.J.; et al. Global, regional, and national disability-adjusted life years (DALYs) for 306 diseases and injuries and healthy life expectancy (HALE) for 188 countries, 1990–2013: Quantifying the epidemiological transition. Lancet 2015, 386, 2145–2191. [Google Scholar] [CrossRef]
  3. Mello, M.F.; Mello, A.A.; Kohn, R. Epidemiologia da Saúde Mental no Brasil; Artmed: Porto Alegre, Brazil, 2007. [Google Scholar]
  4. Melanson, K.J. Nutrition review: Relationships of nutrition with depression and anxiety. Am. J. Lifestyle Med. 2007, 1, 171–174. [Google Scholar] [CrossRef]
  5. Payne, M.E. Nutrition and late-life depression: Etiological considerations. Aging Health 2010, 6, 133–143. [Google Scholar] [CrossRef] [PubMed] [Green Version]
  6. Le Port, A.; Gueguen, A.; Kesse-Guyot, E.; Melchior, M.; Lemogne, C.; Nabi, H.; Goldberg, M.; Zins, M.; Czernichow, S. Association between dietary patterns and depressive symptoms over time: A 10-year follow-up study of the GAZEL cohort. PLoS ONE 2012, 7, e51593. [Google Scholar] [CrossRef] [PubMed] [Green Version]
  7. Sánchez-Villegas, A.; Martinez-Gonzales, M. Diet, a new target to prevent depression? BMC Med. 2013, 11, 3. [Google Scholar] [CrossRef] [PubMed] [Green Version]
  8. Sanhueza, C.; Ryan, L.; Foxcroft, D.R. Diet and the risk of unipolar depression in adults: Systematic review of cohort studies. J. Hum. Nutr. Diet. 2012, 26, 56–70. [Google Scholar] [CrossRef]
  9. Akbaraly, T.N.; Sabia, S.; Shipley, M.J.; Batty, G.D.; Kivimaki, M. Adherence to healthy dietary guidelines and future depressive symptoms: Evidence for sex differentials in the Whitehall II study. Am. J. Clin. Nutr. 2013, 97, 419–427. [Google Scholar] [CrossRef]
  10. Gilbody, S.; Lightfoot, T.; Sheldon, T. Is low folate a risk factor for depression? A meta-analysis and exploration of heterogeneity. J. Epidemiol. Community Health 2007, 61, 631–637. [Google Scholar] [CrossRef] [Green Version]
  11. Sánchez-Villegas, A.; Verberne, L.; De Irala, J.; Ruíz-Canela, M.; Toledo, E.; Serra-Majem, L.; Martínez-González, M.A. Dietary fat intake and the risk of depression: The SUN Project. PLoS ONE 2011, 6, e16268. [Google Scholar] [CrossRef] [Green Version]
  12. Sánchez-Villegas, A.; Toledo, E.; de Irala, J.; Ruiz-Canela, M.; Pla-Vidal, J.; Martínez-González, M.A. Fast-food and commercial baked goods consumption and the risk of depression. Public Health Nutr. 2012, 15, 424–432. [Google Scholar] [CrossRef] [Green Version]
  13. Oddy, W.H.; Robinson, M.; Ambrosini, G.L.; O’Sullivan, T.A.; de Klerk, N.H.; Beilin, L.J.; Silburn, S.R.; Zubrick, S.R.; Stanley, F.J. The association between dietary patterns and mental health in early adolescence. Prev. Med. 2009, 49, 39–44. [Google Scholar] [CrossRef] [PubMed] [Green Version]
  14. Nanri, A.; Kimura, Y.; Matsushita, Y.; Ohta, M.; Sato, M.; Mishima, N.; Sasaki, S.; Mizoue, T. Dietary patterns and depressive symptoms among Japanese men and women. Eur. J. Clin. Nutr. 2010, 64, 832–839. [Google Scholar] [CrossRef] [PubMed] [Green Version]
  15. Popa, T.A.; Ladea, M. Nutrition and depression at the forefront of progress. J. Med. Life 2012, 5, 414–419. [Google Scholar] [PubMed]
  16. Chocano-Bedoya, P.O.; O’Reilly, E.J.; Lucas, M.; Mirzaei, F.; Okereke, O.I.; Fung, T.T.; Hu, F.B.; Ascherio, A. Prospective study on long-term dietary patterns and incident depression in middle-aged and older women. Am. J. Clin. Nutr. 2013, 98, 813–820. [Google Scholar] [CrossRef] [PubMed] [Green Version]
  17. Rienks, J.; Dobson, A.J.; Mishra, G.D. Mediterranean dietary pattern and prevalence and incidence of depressive symptoms in mid-aged women: Results from a large community-based prospective study. Eur. J. Clin. Nutr. 2013, 67, 75–82. [Google Scholar] [CrossRef] [PubMed] [Green Version]
  18. Chan, R.; Chan, D.; Woo, J. A prospective cohort study to examine the association between dietary patterns and depressive symptoms in older Chinese people in Hong Kong. PLoS ONE 2014, 9, e105760. [Google Scholar] [CrossRef] [PubMed]
  19. Lai, J.S.; Hiles, S.; Bisquera, A.; Hure, A.J.; McEvoy, M.; Attia, J. A systematic review and meta-analysis of dietary patterns and depression in community-dwelling adults. Am. J. Clin. Nutr. 2014, 99, 181–197. [Google Scholar] [CrossRef] [Green Version]
  20. Rahe, C.; Unrath, M.; Berger, K. Dietary patterns and the risk of depression in adults: A systematic review of observational studies. Eur. J. Clin. Nutr. 2014, 53, 997–1013. [Google Scholar] [CrossRef]
  21. Ruusunen, A.; Lehto, S.M.; Mursu, J.; Tolmunen, T.; Tuomainen, T.P.; Kauhanen, J.; Voutilainen, S. Dietary patterns are associated with the prevalence of elevated depressive symptoms and the risk of getting a hospital discharge diagnosis of depression in middle-aged or older Finnish men. J. Affect. Disord. 2014, 159, 1–6. [Google Scholar] [CrossRef]
  22. Vilela, A.A.; Farias, D.R.; Eshriqui, I.; Vaz Jdos, S.; Franco-Sena, A.B.; Castro, M.B.; Olinto, M.T.; Machado, S.P.; Moura da Silva, A.A.; Kac, G. Pre-pregnancy healthy dietary pattern is inversely associated with depressive symptoms among pregnant Brazilian women. J. Nutr. 2014, 144, 1612–1618. [Google Scholar] [CrossRef] [Green Version]
  23. Khosravi, M.; Sotoudeh, G.; Majdzadeh, R.; Nejati, S.; Darabi, S.; Raisi, F.; Esmaillzadeh, A.; Sorayani, M. Healthy and unhealthy dietary patterns are related to depression: A case-control study. Psychiatry Investig. 2015, 12, 434–442. [Google Scholar] [CrossRef] [PubMed] [Green Version]
  24. Kim, T.H.; Choi, J.Y.; Lee, H.H.; Park, Y. Associations between dietary pattern and depression in Korean adolescent girls. J. Pediatr. Adolesc. Gynecol. 2015, 28, 533–537. [Google Scholar] [CrossRef] [PubMed]
  25. Miki, T.; Kochi, T.; Kuwahara, K.; Eguchi, M.; Kurotani, K.; Tsuruoka, H.; Ito, R.; Kabe, I.; Kawakami, N.; Mizoue, T.; et al. Dietary patterns derived by reduced rank regression (RRR) and depressive symptoms in Japanese employees: The Furukawa nutrition and health study. Psychiatry Res. 2015, 229, 214–219. [Google Scholar] [CrossRef] [PubMed]
  26. Sánchez-Villegas, A.; Delgado-Rodríguez, M.; Alonso, A.; Schlatter, J.; Lahortiga, F.; Serra Majem, L.; Martínez-González, M.A. Association of the Mediterranean dietary pattern with the incidence of depression: The Seguimiento Universidad de Navarra/University of Navarra follow-up (SUN) cohort. Arch. Gen. Psychiatry 2009, 66, 1090–1098. [Google Scholar] [CrossRef]
  27. Park, S.J.; Kim, M.S.; Lee, H.J. The association between dietary pattern and depression in middle-aged Korean adults. Nutr. Res Pract. 2019, 13, 316–322. [Google Scholar] [CrossRef]
  28. Louzada, M.L.C.; Martins, A.P.B.; Canella, D.S.; Baraldi, L.G.; Levy, R.B.; Claro, R.M.; Moubarac, J.C.; Cannon, G.; Monteiro, C.A. Ultra-processed foods and the nutritional dietary profile in Brazil. Rev. Saúde Pública 2015, 49. [Google Scholar] [CrossRef]
  29. Moubarac, J.C. Ultra-processed Foods in Canada: Consumption, Impact on Diet Quality and Policy Implications; TRANSNUT, University of Montreal: Montréal, QC, Canada, 2017; Available online: https://mma.prnewswire.com/media/615057/Heart_and_Stroke_Foundation_Time_to_curb_our_appetite_for_ultra_.pdf (accessed on 24 October 2019).
  30. Aquino, E.M.L.; Barreto, S.M.; Bensenor, I.M.; Carvalho, M.S.; Chor, D.; Duncan, B.B.; Lotufo, P.A.; Mill, J.G.; Molina, M.C.; Mota, E.L.; et al. Brazilian Longitudinal Study of Adult Health (ELSA-Brasil): Objectives and design. Am. J. Epidemiol. 2012, 175, 315–324. [Google Scholar] [CrossRef] [Green Version]
  31. Schmidt, M.I.; Duncan, B.B.; Mill, J.G.; Lotufo, P.A.; Chor, D.; Barreto, S.M.; Aquino, E.M.; Passos, V.M.; Matos, S.M.; Molina, M.C.; et al. Cohort profile: Longitudinal Study of Adult Health (ELSA-Brasil). Int. J. Epidemiol. 2015, 44, 68–75. [Google Scholar] [CrossRef] [Green Version]
  32. Schmidt, M.I.; Schmidt, M.I.; Griep, R.H.; Passos, V.M.; Luft, V.C.; Goulart, A.C.; Menezes, G.M.S.; Molina, M.C.; Bisi, V.A.; Nunes, M.A. Strategies and development of quality assurance and control in the ELSA-Brasil. Rev. Saúde Pública 2013, 47, 105–112. [Google Scholar] [CrossRef] [Green Version]
  33. Bensenor, I.M.; Griep, R.H.; Pinto, K.A.; Faria, C.P.; Felisbino-Mendes, M.; Caetano, E.I.; Albuquerque, L.S.; Schmidt, M.I. Routines of organization of clinical tests and interviews in the ELSA-Brasil investigation center. Rev. Saúde Pública 2013, 47 (Suppl. 2), 37–47. [Google Scholar] [CrossRef] [Green Version]
  34. Chor, D.; Alves, M.G.; Giatti, L.; Cade, N.V.; Nunes, M.A.; Molina, M.C.; Benseñor, I.M.; Aquino, E.M.; Passos, V.; Santos, S.M.; et al. Questionnaire development in ELSA-Brasil: Challenges of a multidimensional instrument. Rev.Saúde Pública 2013, 47 (Suppl. 2), 27–36. [Google Scholar] [CrossRef] [PubMed] [Green Version]
  35. Molina, M.C.B.; Benseñor, I.M.; Cardoso, L.O.; Velasquez-Melendez, G.; Drehmer, M.; Pereira, T.S.S.; Faria, C.P.; Melere, C.; Manato, L.; Gomes, A.L.C.; et al. Reprodutibilidade e validade relativa do Questionário de Frequência Alimentar do ELSA-Brasil. Cad. Saúde Pública 2013, 29, 379–389. [Google Scholar] [CrossRef]
  36. Hair, J.F. Multivariate Data Analysis; Prentice Hall: Upper Saddle River, NJ, USA, 2010. [Google Scholar]
  37. Rousseeuw, P.J. Silhouettes: A graphical aid to the interpretation and validation of cluster analysis. J. Comput. Appl. Math. 1987, 20, 53–65. [Google Scholar] [CrossRef] [Green Version]
  38. Cardoso, L.O.; Carvalho, M.S.; Cruz, O.G.; Melere, C.; Luft, V.C.; Molina, M.C.; Faria, C.P.; Benseñor, I.M.; Matos, S.M.; Fonseca, M.J.; et al. Eating patterns in the Brazilian Longitudinal Study of Adult Health (ELSA-Brasil): An exploratory analysis. Cad. Saúde Pública 2016, 32, e00066215. [Google Scholar] [CrossRef] [Green Version]
  39. Lang, U.E.; Beglinger, C.; Schweinfurth, N.; Walter, M.; Borgwardt, S. Nutritional aspects of depression. Cell. Physiol. Biochem. 2015, 37, 1029–1043. [Google Scholar] [CrossRef] [PubMed]
  40. Schakel, S.F. Maintaining a nutrient database in a changing marketplace: Keeping pace with changing food products—A research perspective. J. Food Compos. Anal. 2001, 14, 315–322. [Google Scholar] [CrossRef]
  41. Lewis, G.; Pelosi, A.J.; Araya, R.; Dunn, G. Measuring psychiatric disorder in the community: A standardized assessment for use by lay interviewers. Psychol. Med. 1992, 22, 465–486. [Google Scholar] [CrossRef]
  42. Nunes, M.A.; Alves, M.G.M.; Chor, D.; Schmidt, M.I.; Duncan, B.B. Adaptação transcultural do CIS-R (Clinical Interview Schedule–Revised Version) para o português no estudo longitudinal de saúde do adulto (ELSA). Clin. Biomed. Res. 2011, 31, 487–490. [Google Scholar]
  43. Botega, N.J.; Pereira, W.A.; Bio, M.R.; Garcia Júnior, C.; Zomignani, M.A. Psychiatric morbidity among medical in patients: A standardized assessment (GHQ-12 and CIS-R) using lay interview in a Brazilian hospital. Soc. Psychiatry Psychiatr. Epidemiol. 1995, 30, 127–131. [Google Scholar] [CrossRef]
  44. McManus, S.; Bebbington, P.; Jenkins, R.; Brugha, T. (Eds.) Mental Health and Wellbeing in England: Adult Psychiatric Morbidity Survey 2014; NHS Digital: Leeds, UK, 2016. [Google Scholar]
  45. Vieira, B.A.; Luft, V.C.; Schmidt, M.I.; Chambless, L.E.; Chor, D.; Barreto, S.M.; Duncan, B.B. Timing and Type of Alcohol Consumption and the Metabolic Syndrome—ELSA-Brasil. PLoS ONE 2016. [Google Scholar] [CrossRef]
  46. Akaike, H. New Look at the Statistical Model Identification. IEEE Trans. Autom. Control 1974, 19, 716–723. [Google Scholar] [CrossRef]
  47. Kaplan, H.I.; Sadock, B.J.; Grebb, J.A. Compêndio de Psiquiatria. Ciências do Comportamento e Psiquiatria Clínica; Artmed: Porto Alegre, Brazil, 1997. [Google Scholar]
  48. Quevedo, J.; Silva, A.G. Depressão Teoria e Clínica; Artmed: Porto Alegre, Brazil, 2013. [Google Scholar]
  49. Nunes, M.A.; Pinheiro, A.P.; Bessel, M.; Brunoni, A.R.; Kemp, A.H.; Benseñor, I.M.; Chor, D.; Barreto, S.; Schmidt, M.I. Common mental disorders and sociodemographic characteristics: Baseline findings of the Brazilian Longitudinal Study of Adult Health (ELSA-Brasil). Rev. Bras. Psiquiatr. 2016, 38, 91–97. [Google Scholar] [CrossRef] [Green Version]
  50. Hart, M.J.; Milte, C.M.; Torres, S.J.; Thorpe, M.G.; McNaughton, S.A. Dietary patterns are associated with depressive symptoms in older Australian women but not men. Br. J. Nutr. 2019, 25, 1–20. [Google Scholar] [CrossRef] [PubMed]
  51. Team, R.C. R: A language and Environment for Statistical Computing; R Foundation for Statistical Computing: Vienna, Austria, 2015. [Google Scholar]
  52. Team, R.S. R Studio: Integrated Development for R; R Studio, Inc.: Boston, MA, USA, 2015. [Google Scholar]
  53. Li, Y.; Lv, M.R.; Wei, Y.J.; Sun, L.; Zhang, J.X.; Zhang, H.G.; Li, B. Dietary patterns and depression risk: A meta-analysis. Psychiatry Res. 2017, 253, 373–382. [Google Scholar] [CrossRef] [PubMed]
  54. Sánchez-Villegas, A.; Ruíz-Canela, M.; de la Fuente-Arrillaga, C.; Gea, A.; Shivappa, N.; Hébert, J.R.; Martínez-González, M.A. Dietary inflammatory index, cardiometabolic conditions and depression in the Seguimiento Universidad de Navarra cohort study. Br. J. Nutr. 2015, 114, 1471–1479. [Google Scholar] [CrossRef] [Green Version]
  55. Huang, Q.; Liu, H.; Suzuki, K.; Ma, S.; Liu, C. Linking What We Eat to Our Mood: A Review of Diet, Dietary Antioxidants, and Depression. Antioxidants 2019, 8, 376. [Google Scholar] [CrossRef] [Green Version]
  56. Brownell, K.D.; Gold, M.S. Food and Addiction. A Comprehensive Handbook; Oxford University Press: New York, NY, USA, 2012. [Google Scholar]
  57. Drummond, D.C. Theories of drug craving, ancient and modern. Addiction 2001, 96, 33–46. [Google Scholar] [CrossRef]
  58. May, J.; Kavanagh, D.J.; Andrade, J. The elaborated intrusion theory of desire: A 10-year retrospective and implications for addiction treatments. Addict. Behav. 2015, 44, 29–34. [Google Scholar] [CrossRef]
  59. Pelchat, M.L. Of human bondage: Food craving, obsession, compulsion, and addiction. Physiol. Behav. 2002, 76, 347–352. [Google Scholar] [CrossRef]
  60. Tiffany, S.T.; Wray, J.M. The clinical significance of drug craving. Ann. N. Y. Acad. Sci. 2012, 1248, 1–17. [Google Scholar] [CrossRef]
  61. Wurtman, R.J.; Wurtman, J.J. Brain Serotonin, Carbohydrate-Craving, Obesity and Depression. Obes. Res. 1995, 3 (Suppl. 4), 477–480. [Google Scholar] [CrossRef] [PubMed]
  62. Knüppel, A.; Shipley, M.J.; Llewellyn, C.H.; Brunner, E.J. Sugar intake from sweet food and beverages, common mental disorder and depression: Prospective findings from the Whitehall II study. Sci. Rep. 2017, 7. [Google Scholar] [CrossRef] [PubMed] [Green Version]
  63. Goldberg, D.P.; Williams, P.A. User’s Guide to the General Health Questionnaire; NFER-Nelson: Windsor, UK, 1988. [Google Scholar]
  64. Beck, A.T.; Steer, R.A.; Brown, G.K. BDI-II: Beck Depression Inventory Manual; Psychological Corporation: San Antonio, TX, USA, 1996. [Google Scholar]
  65. Cameron, I.M.; Crawford, J.R.; Reid, I.C. Psychometric comparison of PHQ-9 and HADS for measuring depression severity in primary care. Br. J. Gen. Pract. 2008, 58, 32–36. [Google Scholar] [CrossRef] [PubMed] [Green Version]
  66. Jacka, F.N.; Cherbuin, N.; Anstey, K.J.; Butterworth, P. Dietary patterns and depressive symptoms over time: Examining the relationships with socioeconomic position, health behaviours and cardiovascular risk. PLoS ONE 2014, 9, e87657. [Google Scholar] [CrossRef] [PubMed]
  67. Jacques, P.F.; Tucker, K.L. Are dietary patterns useful for understanding the role of diet in chronic disease? Am. J. Clin. Nutr. 2001, 73, 1–2. [Google Scholar] [CrossRef] [PubMed] [Green Version]
  68. Canale, A.; Furlan, M.M.D.P. Depressão. Arq. MUDI 2006, 10, 23–31. [Google Scholar]
  69. Jacka, F.N.; Cherbuin, N.; Anstey, K.J.; Butterworth, P. Does reverse causality explain the relationship between diet and depression? J. Affect. Disord. 2015, 175, 248–250. [Google Scholar] [CrossRef]
  70. Brunoni, A.R.; Nunes, M.A.; Figueiredo, R.; Barreto, S.M.; da Fonseca, M.J.; Lotufo, P.A.; Benseñor, I.M. Patterns of benzodiazepine and antidepressant use among middle-aged adults. The Brazilian longitudinal study of adult health (ELSA-Brasil). J. Affect. Disord. 2013, 151, 71–77. [Google Scholar] [CrossRef]
Figure 1. Final Study Population (n = 14,798, ELSA-Brasil, 2008–2010).
Psych 02 00002 g001
Table 1. Distribution of participants and prevalence of depressive episode by sex and study variables (n = 14,798, ELSA-Brasil, 2008–2010).
Men (n = 6754)Women (n = 8044)
Total Men%Depressive EpisodePrev. %Total Women%Depressive EpisodePrev. %
Dietary Pattern *
Traditional319647.32732.28354944.121905.35
Fruit and Vegetables130419.31251.92248930.941335.34
Low-Sugar/Low-Fat1752.5931.714655.78153.23
Bakery Products207930.78562.69154119.161308.44
Age—Years (SD)
Mean Values52.24
(9.33)
50.68
(9.46)
52.05
(8.86)
51.20
(8.23)
Schooling *
Never Attended School or Incomplete Elementary School (<5 Years of Schooling)5558.22152.703213.99257.79
Complete Elementary School or Incomplete Secondary School (<12 Years of Schooling)5678.40223.884405.47378.41
Complete Secondary School (12 Years of Schooling)221032.72632.85290136.062227.65
University Degree (>12 Years of Schooling)342250.67571.67438254.481844.20
Marital Status *
Married/Cohabiting552881.851081.95426252.982315.42
Separated/Divorced79411.76334.16208925.971597.61
Single3525.21113.13115614.37494.24
Widowed801.1856.255376.68295.40
BMI *
Underweight640.9523.13740.9222.70
Normal Weight224533.24532.36306338.081334.34
Overweight305145.17591.93290836.151796.16
Obese139420.64433.08199924.851547.70
MET-Minutes—Metabolic Equivalent Minutes (SD)
Mean Values803.60 (1197.13) 575.20 (1007.78) 563.80 (955.61) 294.20 (683.28)
* Chi-square test p < 0.05.
Table 2. Odds Ratios for the association between dietary patterns and depressive episodes—crude and adjusted models (n = 14,798, ELSA-Brasil, 2008–2010).
Dietary PatternAll ParticipantsMenWomen
(n = 14,798)(n = 6754)(n = 8044)
OR95% CI Pr (>|Z|)OR95% CI Pr (>|Z|)OR95% CIPr (>|Z|)
Crude Model
Traditional1.00--1.00--1.00--
Low-Sugar/Low-Fat0.71(0.44–1.16)0.1720.75(0.23–2.39)0.6220.59(0.34–1.01)0.053
Fruit and Vegetables1.07(0.87–1.31)0.5030.84(0.53–1.32)0.4451.00(0.79–1.25)0.986
Bakery Products1.33(1.10–1.62)0.0031.18(0.83–1.68)0.3471.63(1.29–2.05)0.000
Adjusted Model a
Traditional1.00--1.00--1.00- -
Low-Sugar/Low-Fat0.90(0.55–1.47)0.6651.08(0.33–3.53)0.8960.90(0.52–1.56)0.708
Fruit and Vegetables1.09(0.88–1.34)0.4350.93(0.58–1.50)0.7841.15(0.91–1.46)0.246
Bakery Products1.20(0.98–1.47)0.0720.94(0.65–1.36)0.7451.33(1.05–1.70)0.019
a Model adjusted for age, schooling, marital status, BMI, and MET—Metabolic Equivalent (minutes).

