Spearman’s Hypothesis Tested Comparing 47 Regions of Japan Using a Sample of 18 Million Children


1
Faculty of Foreign Studies, Gifu Shotoku Gakuen University, Gifu 501-6194, Japan
2
Work and Organizational Psychology, University of Amsterdam, 1012 WX Amsterdam, The Netherlands
3
Ulster Institute for Social Research, 117 Purves Road, London NW10 5TH, UK
*
Author to whom correspondence should be addressed.
Psych 2019, 1(1), 26-34; https://doi.org/10.3390/psych1010002
Submission received: 20 December 2018
/
Revised: 18 January 2019
/
Accepted: 1 February 2019
/
Published: 11 February 2019
(This article belongs to the Special Issue Beyond Thirty Years of Research on Race Differences in Cognitive Ability)
Abstract
:Many groups differ in their mean intelligence score. Spearman’s hypothesis states that the differences are a function of cognitive complexity. There tend to be large differences on subtests of high cognitive complexity and small differences on subtests of low cognitive complexity. Spearman’s hypothesis has been supported by a large number of studies. Can Spearman’s hypothesis be generalized to regions of a country, where these regions differ in mean intelligence? We utilized data from 86 different cognitive tests from all 47 Japanese prefectures and correlated the g loadings of 86 subtests with standardized differences on the same subtests. Spearman’s hypothesis was clearly supported: the biggest differences between the regions were on the tests that were of the greatest complexity, meaning that Spearman’s hypothesis may be generalizable from groups to regions. In Japan, g loadings offer a better explanation of group differences in intelligence than cultural differences. Future research should explore whether Spearman’s hypothesis is also supported for differences between regions of other countries.
1. Introduction
Charles Spearman was the first to postulate that there exists a single general factor of human intelligence, something that reflects positive correlations among different cognitive tasks. Spearman coined the term “g factor” [1]. He hypothesized g as something like mental energy which enables various cognitive activities, such as memory, deduction, induction, grasping abstract relationships, rule inference, and finding similarities and dissimilarities. Following this lead, Jensen maintained that g should be treated as a distilled entity obtainable by factor analysis from all mental tasks because, argued Jensen, it stems from individuals’ neural and physiological substrates [2].
Some researchers have been doubtful of the existence of g, claiming that it is a statistical artifact, or that all intelligence tests are measuring a similar or single construct of various mental processes [3,4]. However, Jensen pointed out that there have been reports that g is correlated with widely different sets of variables, such as stature, head and brain size, reaction time, and myopia; as for the EEG (electroencephalogram) experiments, frequency of alpha wave, latency, and amplitude of evoked brain potentials; physiologically, cerebral glucose metabolism, brain and peripheral nerve conduction velocity, and brain pH [2,5]. It would be hard to imagine that an artificial characteristic limited to intelligence tests and their construction can be somehow correlated with so many human variables.
Moreover, Jensen proposed a method to use the concept of g in order to examine the cause of group differences in mean intelligence test scores between Blacks and Whites in the United States. Although it had been known for a long time that there are large racial differences in intelligence test scores [6], many attempts have been made to explain these differences using cultural factors [7]. Instead, Jensen looked at a fundamentally different source, namely differences in g loadings between tests, reflecting differences in cognitive complexity between tests [8], and formulated what he called “Spearman’s hypothesis” as follows:
The varying magnitude of the mental difference between Black and White populations on a variety of mental tests is directly related to the size of test’s loading on g, the general factor, common to all complex tests of mental ability.
Jensen devised the method of correlated vectors (MCV) to formally test this idea and supported it with previous reports on Black/White differences on a total of 171 diverse psychometric tests from 17 independent data sets totaling 45,000 Black and 245,000 White subjects [8,9], as summarized in Jensen [2]. Spearman’s hypothesis was further supported using the Armed Forces Qualification Test [10]. The estimate of the correlation coefficient between the Black/White difference and g, based on various studies, is approximately r = 0.60.
Spearman’s hypothesis has been extended from its original focus on Black/White comparisons to all kinds of comparisons between racial groups, and many empirical tests have been conducted, including various meta-analyses. In the US, the relationship has been ascertained for Chinese-Americans and Whites [11], Amerindians and Whites [12], and Jews and non-Jewish Whites [13]. The relationship has also been ascertained for Black/White difference in South Africa [14,15], and Zimbabwe [16], and Dutch natives and non-Western immigrants [17,18,19]. There are some exceptions, such as the study of East Asians in the United States [20,21]. te Nijenhuis et al. suggest that when groups have a profile of being relatively better on performance subtests (lower g) than on verbal subtests (higher g), generally leading to a lack of support for Spearman’s hypothesis. In these cases, analyzing only the verbal subtests or only the performance subtests leads to a confirmation of Spearman’s hypothesis in approximately half of the comparisons [22].
More specifically, a study by Helms-Lorenz, van de Vijver, and Poortinga, which claims that the intelligence test performance of non-Western immigrants is more strongly correlated with cultural factors than with their cognitive complexity [23]. However, te Nijenhuis and van der Flier argue that Helms-Lorenz et al. use an unbalanced collection of tests, leading to atypical outcomes [24]. It was also shown with a meta-analysis that having a highly balanced collection of tests leads to substantially stronger support of Spearman’s hypothesis [15]. So, the general trend is seemingly clear: a strong validation of Spearman’s hypothesis.
Why have so many papers been written on Spearman’s hypothesis? Jensen supplies the answer [2]:
Why is Spearman’s hypothesis so important? Because, if proven true, not only would it answer the question, at least in part, of why the magnitude of the W–B differences varies across different tests, but, of greater general importance, it would tell us that the main source of the W–B difference across various cognitive tests is essentially the same as the main source of differences between individuals with each racial group, namely g. This proposition would imply that a scientific understanding of the nature of the W–B difference in fact depends on understanding the nature of g.
There has been criticism of Jensen’s test of Spearman’s hypothesis [25,26,27,28], and detailed replies to these critics can be found in various articles [29,30,31], to which we refer the reader. Woodley et al. conclude that if one combines MCV with psychometric meta-analysis then one is able to correct for statistical artifacts. This process, they demonstrate, leads to reliable outcomes [32].
So, Spearman’s hypothesis appears to be generalizable from Black/White differences to all kinds of other group differences, but the key question is: How strongly does Spearman’s hypothesis generalize? In attempting to answer this question all kinds of groups could be compared. However, in this study we will test the generalizability of Spearman’s hypothesis using average IQ score differences between regions within a country. Even if, within a country, there do not exist such distinct gene pools as for Blacks and Whites in the United States, the populations of many countries consist of one or multiple genetic gradients. To date, a variety of studies have found average differences in IQ score between the regions of countries. Lynn [33,34] examined the well-known gap in development between the north and south of Italy, showed that there were substantially lower IQ scores in the south and suggested a causal influence on regional differences in income and education. However, Lynn’s position has also been criticized [35,36]. Kura reported mean IQ scores for the different regions of Japan and showed a large difference between the highest-scoring region and the lowest-scoring region [37]. Similarly, regional differences in IQ, often correlating in the expected direction with measures such as wealth and educational level, have been reported between, for example, the different regions of the UK [38,39], Spain [40], Germany [41], Turkey [42], and between northern and southern Egypt [43], though they do not test Spearman’s hypothesis.
In this study we test whether Spearman’s hypothesis can be generalized to differences between regions in Japan. When Spearman’s hypothesis is not supported, this suggests that cultural factors play an important role in explaining differences in intelligence scores between regions. In fact, IQ differences that are caused by purely environmental differences do not support Spearman’s hypothesis [44].
Using published achievement test results from all 47 Japanese prefectures taken between 2007 and 2018 as proxies of IQ tests, we estimated the g loadings of these tests. Tests’ g loadings were correlated with the gaps between regions for these achievement tests to examine whether or not there was a clear relationship. It should be noted that, in Western countries, results of school achievement tests have been found to correlate with IQ at around 0.7 [45,46], so these are excellent proxies for IQ tests. We also note that Warne [21] used Advanced Placement academic achievement scores to test Spearman’s hypothesis and reports support for it.
2. Methods
2.1. Sample
Samples consisted of all students in the sixth and ninth grades between the years 2007–2009, 2012–2015, and 2017–2018 in Japan. In 2010 and 2012, a representative 30–40% of students were included. The total number of test takers was about 18 million; we estimate that many students took the tests on two occasions, specifically when they were 11 and 14 years old, and 12 million took the test at least once. The number in the four prefectures directly compared in this article (Akita, Fukui, Kochi, and Okinawa) was 0.7 million.
2.2. Tests
We used the National Achievement Tests conducted by the Japanese Ministry of Education, Culture, Sports, Science, and Technology [47]. The test has been uniformly administered nationwide to 11-and 14-year-old students from 2007 to 2018. It consists of four subtests: basic verbal, advanced verbal, basic mathematics, and advanced mathematics. In the official statement from the Ministry, the basic tests “Japanese A” and “Mathematics A” consist of “questions mainly concerning knowledge”, whereas the advanced tests “Japanese B” and “Mathematics B” consist of “questions mainly concerning applications”. A “Science” test was also conducted in addition to these four tests, but in the years 2012, 2015, and 2018.
Tests were administered to all students who went to public schools at the beginning of their sixth and ninth academic years (April in the Japanese system). The tests in 2010 and 2012 were administered to a representative 30–40% of students. The average test scores for these 2 years were reported as 95% confidence intervals, and we treated the mean values of these intervals as the average scores. Due to earthquakes, test administration was cancelled in 2011 and 2016. In summary, eight test scores were obtained for each of the year ranges 2007–2010, 2013–2014, and 2017, and ten scores were obtained for each of 2012, 2015, and 2018, producing 86 test scores in total for 47 prefectural populations.
2.3. Statistical Analyses
All statistical analyses were carried out with the statistical package R [48]. Principal axis factoring, using the maximum likelihood method, was employed for factor analyses.
2.3.1. Computing g Loadings
There were 86 test scores for 47 prefectural populations. We simply used a factor analysis to estimate g loadings as a principal component of these test scores.
2.3.2. Computing ds
Akita and Okinawa showed the highest and the lowest g-factor scores of all the 47 prefectures. For each of the 86 tests, we calculated the difference score between these two prefectures (Cohen’s d), by subtracting the Okinawa score from the Akita score and dividing this difference by the value of the SD. To obtain SDs of test scores for this mixed sample (i.e., students in Akita and Okinawa aggregated), the reported SDs of these samples were weighted by their respective number of test takers [3,5].
We also calculated the differences between Fukui and Kochi, which showed the second highest and the second lowest g-factor scores, respectively. Differences between Fukui and Kochi were not as pronounced in magnitude as those of Akita and Okinawa: the average effect size d was 0.55 SD for Akita and Okinawa, whereas it was 0.35 SD for Fukui and Kochi.
2.3.3. Average Distance D
To utilize the full information from 47 prefectural test scores, we calculated the average distance D between randomly-selected pairs as follows. First, 47 prefectures were sorted according to their g-factor scores. Second, all possible prefectural differences were calculated by subtracting lower-ranked prefectural scores from higher-ranked prefectural scores. This operation produced (46 + 45 +… + 2 + 1) = 1081 prefectural differences. Third, these differences were averaged. Fourth, the average difference obtained via this method was divided by the standard deviation of the test score. This procedure yielded the average effective difference D of a specific test.
Since this measure averaged all possible differences among prefectures, this value should be regarded as the most general form of prefectural performance differences of a test.
2.3.4. Testing Spearman’s Hypothesis
We examined Spearman’s hypothesis with the method of correlated vectors by computing the correlation between the vectors g and d for Akita and Okinawa and for Fukui and Kochi, and by computing the correlation between g and D for 86 achievement test scores. Supplementary Materials for this study contains test scores of 47 prefectures and nationwide standard deviations of these 86 tests.
3. Results
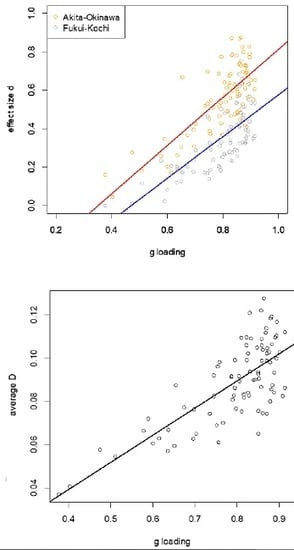
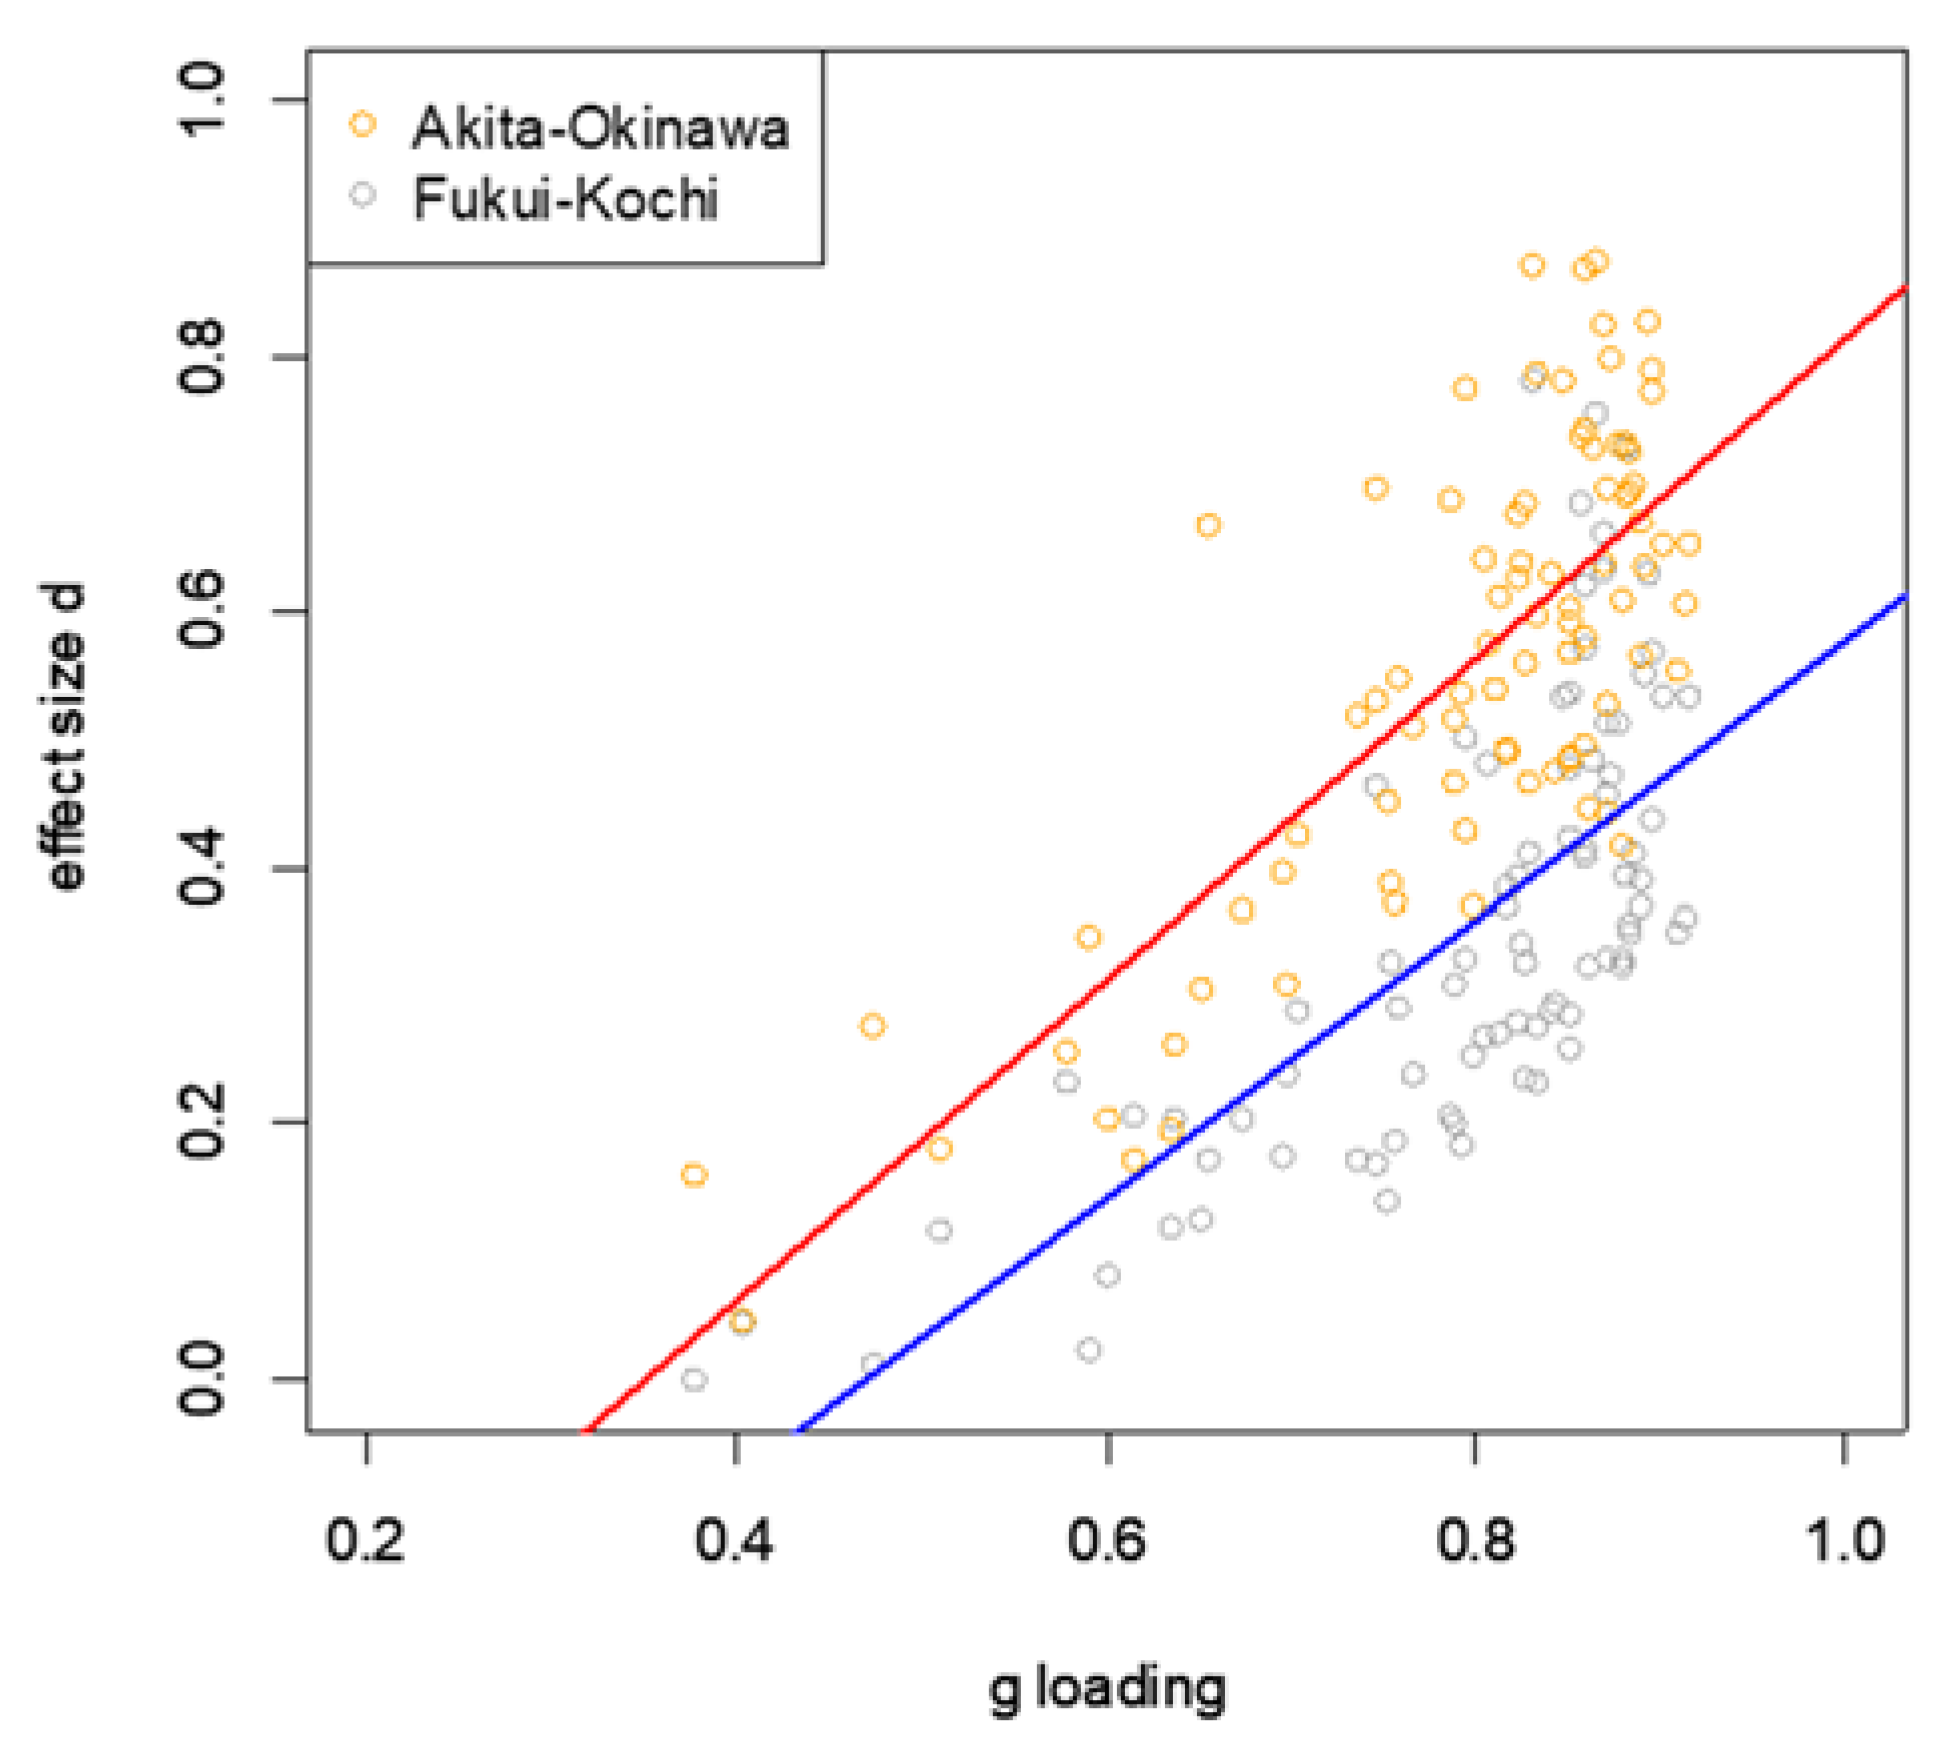
Figure 1 shows that positive relationships exist between the g loadings of achievement tests and the performance differences d between Akita and Okinawa (orange circles with their regression line in red), and also between Fukui and Kochi (dark gray circles with their regression line in blue). The results were strongly affirmative with the Pearson correlation coefficient r = 0.77 (p < 0.001) and the Spearman rank correlation ρ = 0.66 (p < 0.001) for Akita and Okinawa. For Fukui and Kochi, g and d vectors of these two prefectures showed similar correlations: r = 0.77 and ρ = 0.74 (Table 1).
The difference between Akita and Okinawa is on average 0.55 SD and extending the regression line shows that a perfectly g-saturated test (i.e., g loading is unity) would produce a 0.80 SD difference. This is equivalent to an IQ difference of 12 points, which is close to the estimated IQ difference between these two prefectures of 11 points [37]. Furthermore, not surprisingly, we found that average g loadings of 43 tests for 14-year-olds (0.86) was higher than that for 11-year-olds (0.73).
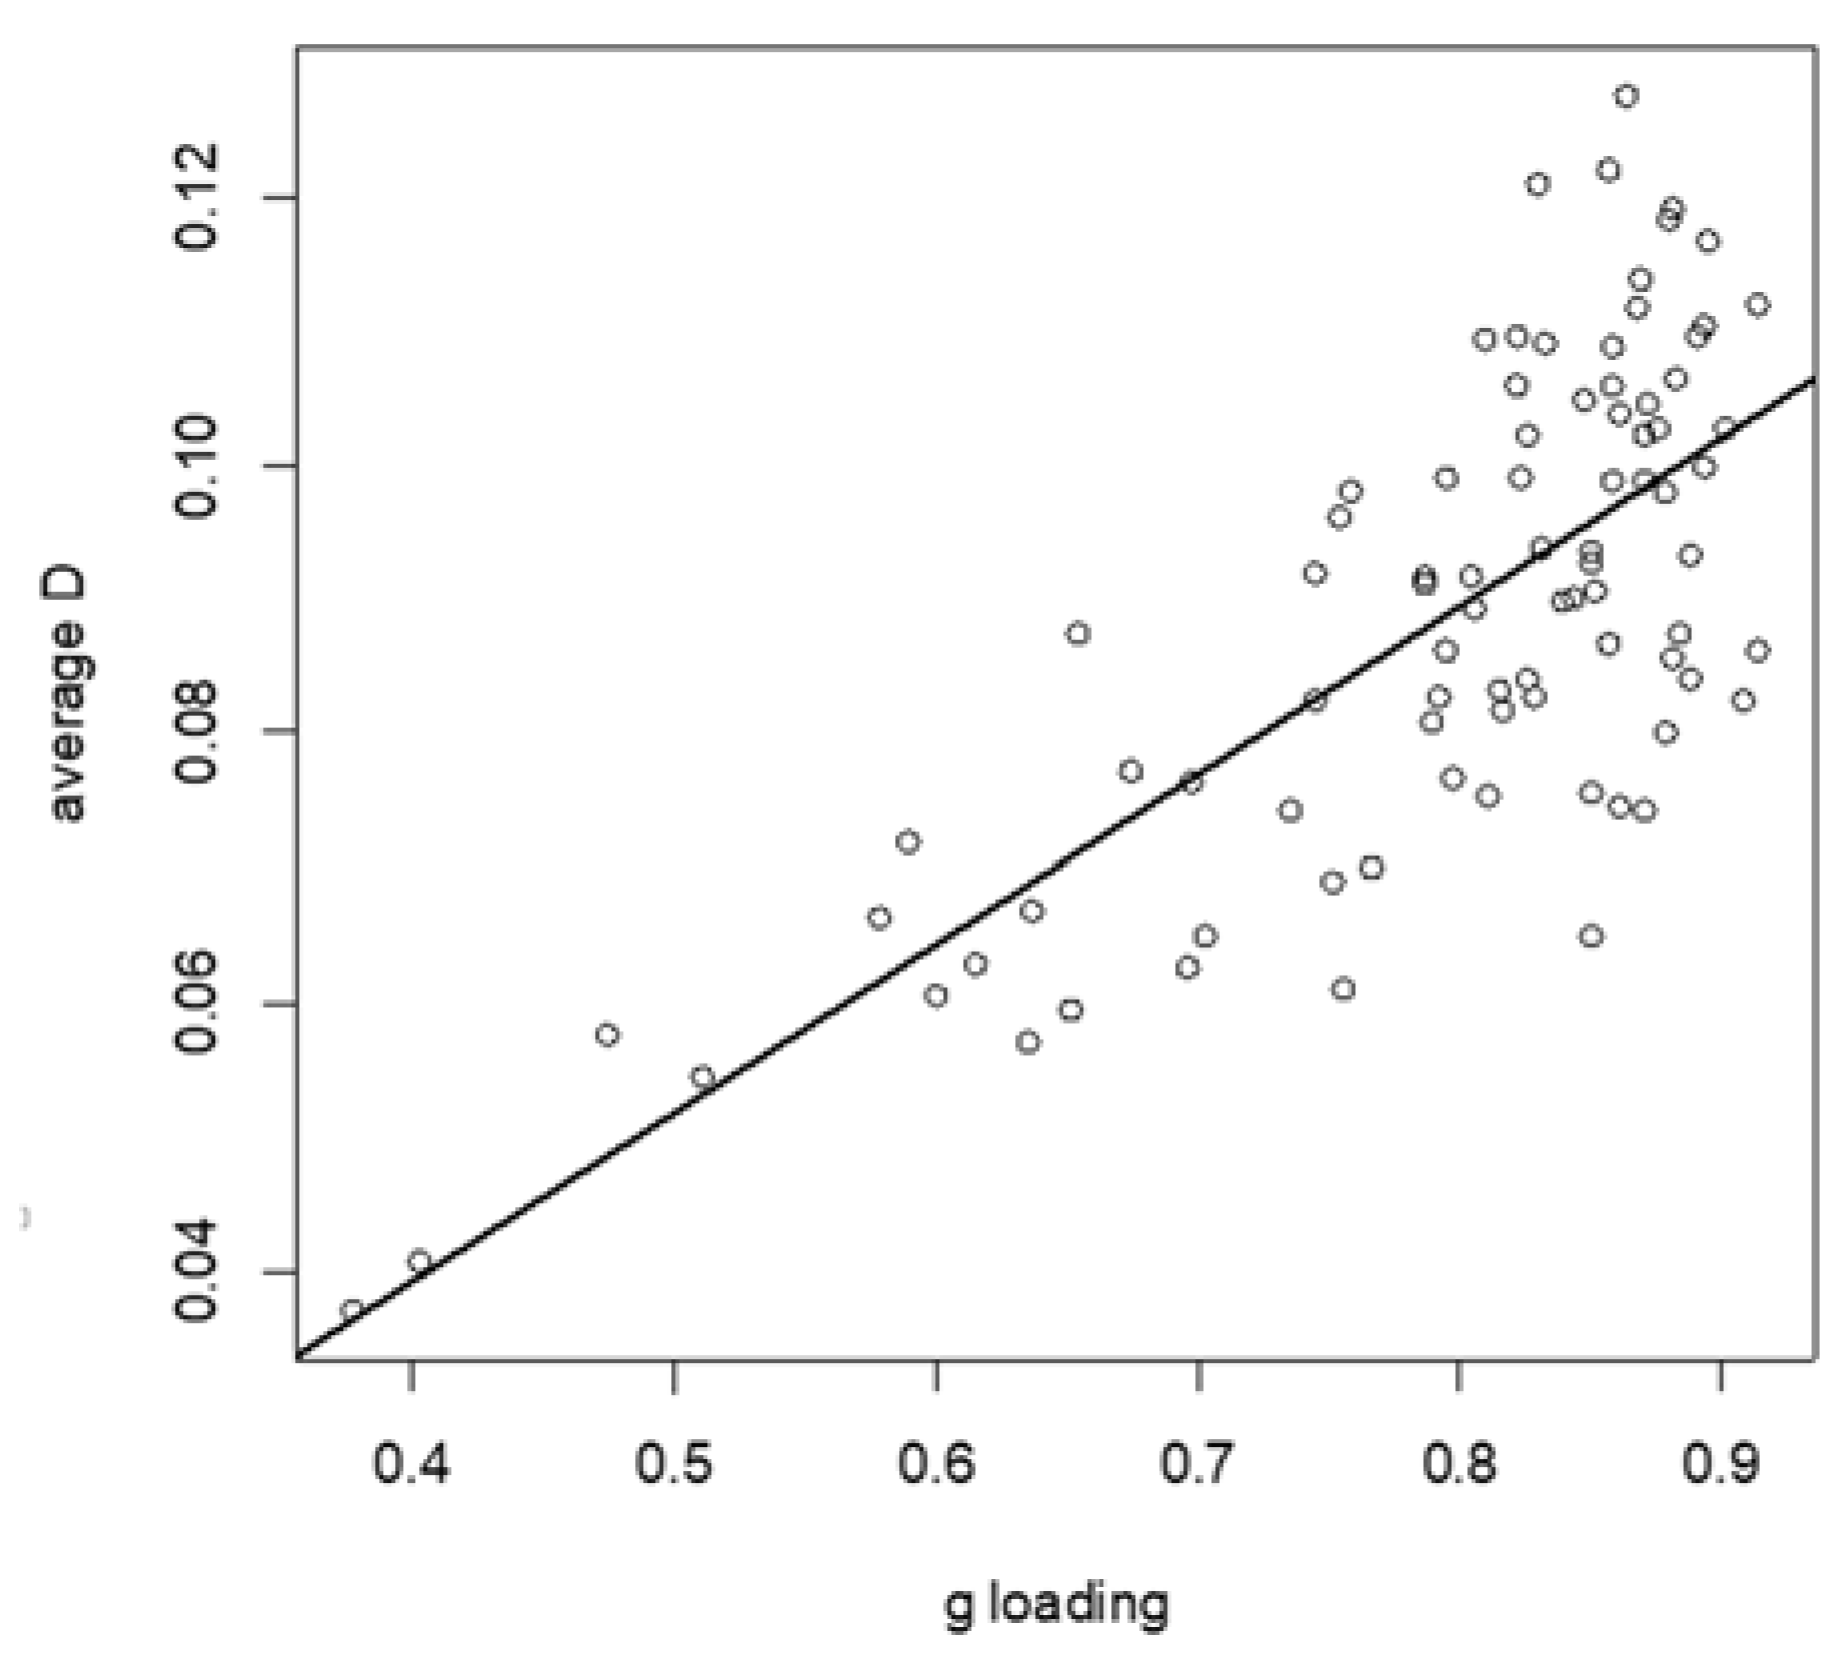
As for the average performance differences between prefectures, Figure 2 shows the same high correlation between the average distance D and g loadings of test scores (r = 0.75 and ρ = 0.64, p < 0.001) as was found in the previous analyses using only comparisons between two prefectures.
4. Discussion
Spearman’s hypothesis states that Black/White differences on IQ test scores are a function of how well these tests measure g, instead of a manifestation of cultural differences between Blacks and Whites. The hypothesis has been extended to comparisons between other racial groups and is supported in the large majority of studies. In this study we have explored how far Spearman’s hypothesis can be generalized, focusing on differences in mean IQ scores between regions of countries, in this case differences between the prefectures of Japan.
We used 86 subtests of the National Achievement Test from 2007 to 2018 as proxies of IQ test batteries for 47 prefectural populations. The effect size of the prefectural performance difference was highly correlated with the test’s g loading at r = 0.75 for the average distance D. In other words, a test with a lower g loading tended to show a narrower gap between prefectures and a test with a higher g loading tended to show a larger gap between prefectures. We conclude that the Spearman–Jensen hypothesis is strongly supported with Japanese prefectural data.
In fact, there is a genetic gradient in Japan, which dates to about 2000 years ago [49]. The aboriginal Jomon people (which contribute around 30% genetically to the modern Japanese population) were gradually dominated by an influx of migrants, namely the Yayoi people who were from regions of modern-day China and Korea. Around 70% of genes in the modern Japanese population were contributed by the Yayoi. However, the two populations merged to such an extent to render the present culture highly homogenous and, thus, a single ethnic group. These results indicate Spearman’s hypothesis also functions within this racial group—not just between racial groups. This means that differences between prefectures can be parsimoniously explained with g loadings and less parsimoniously with cultural differences between the prefectures.
Compared with the reported Black/White racial difference of 1 SD in the United States, even the largest performance difference between Japanese prefectures is much smaller. Average ds between Akita and Okinawa for 86 achievement tests was 0.55. Although the differences within Japan are clearly smaller than the Black/White differences in the US, Spearman’s hypothesis is supported more strongly for comparisons between regions in Japan: the values of 0.64 and 0.75 are higher than the value of 0.62 reported for B/W differences [2]. One of the reasons for this stronger correlation could be the reliability of the data due to the sheer number of subjects involved. To calculate the g loadings of the subtests and d between the highest and lowest performing prefectures, the data were obtained from more than 18 million and 0.7 million students, respectively. This is an extremely large dataset, using the largest number of subtests to date, which yielded a high-quality test of Spearman’s hypothesis.
Our results, however, should be considered in light of some limitations. The most important limitation is that the scores on the achievement tests were not reported at the individual level, but only at the prefectural level, which is not in line with Jensen’s requirements of testing Spearman’s hypothesis. Although we cannot assume that the structures of mental ability are distinct for Japanese subpopulations, questions relating to this problem were not examined in this study. However, it is possible that Spearman’s hypothesis is such a powerful phenomenon that a positive correlation between g and d will occur whether using scores of individuals or scores of groups. Note that the default assumption should be that group differences are nothing more than aggregated individual differences and an a priori assumption is that these results should generally apply to individuals (though probably with weaker factor loadings). Our findings of support for Spearman’s hypothesis when comparing regions of a country may or may not generalize to differences in IQ scores between regions of other countries. Additional empirical research will shed light on this question.
In conclusion, the Japanese National Achievement Test shows clear support for Spearman’s hypothesis. The more a test is g loaded, the larger the performance difference between higher- and lower-performing prefectures. It appears that Spearman’s hypothesis may be generalizable from groups to regions; in Japan, g loadings again offer a better explanation of group differences in intelligence than cultural differences as insisted by Rushton and Jensen [50].
Supplementary Materials
The following are available online at https://www.mdpi.com/2624-8611/1/1/2/s1.
Author Contributions
conceptualization, J.t.N.; methodology, K.K.; software, K.K.; validation, K.K., J.t.N.; formal analysis, K.K.; investigation, K.K.; resources, K.K.; data curation, K.K.; writing—original draft preparation, K.K., J.t.N., and E.D.; writing—review and editing, K.K., J.t.N., and E.D.; visualization, K.K.; supervision, J.t.N.; project administration, K.K. and J.t.N.; funding acquisition, na.
Funding
This research received no external funding.
Acknowledgments
We would like to thank the two anonymous reviewers for their invaluable comments and suggestions, which especially improved the presentation and methods of this paper.
Conflicts of Interest
The authors declare no conflict of interest.
References
- Spearman, C. General intelligence, objectively determined and measured. Am. J. Psychol. 1904, 15, 201–293. [Google Scholar] [CrossRef]
- Jensen, A.R. The g Factor: The Science of Mental Ability; Praeger: Westport, CT, USA, 1998. [Google Scholar]
- Thomson, G.H. A hierarchy without a general factor. Br. J. Psychol. 1916, 8, 271–281. [Google Scholar] [CrossRef]
- Thomson, G.H. On the cause of hierarchical order among the correlation coefficients of a number of variates taken in pairs. Proc. R. Soc. Lond. Ser. A 1919, 95, 400–408. [Google Scholar] [CrossRef]
- Jensen, A.R.; Shinha, S.N. Physical correlates of human intelligence. In Biological Approaches to the Study of Human Intelligence; Vernon, P.A., Ed.; Ablex: Norwood, NJ, USA, 1993; pp. 139–242. [Google Scholar]
- Shuey, A.M. The Testing of Negro Intelligence, 2nd ed.; Social Science Press: New York, NY, USA, 1966. [Google Scholar]
- Jensen, A.R. Bias in Mental Testing; The Free Press: New York, NY, USA, 1980. [Google Scholar]
- Jensen, A.R. The nature of the black-white difference on various psychometric tests: Spearman’s hypothesis. Behav. Brain Sci. 1985, 8, 193–263. [Google Scholar] [CrossRef]
- Jensen, A.R. Further evidence for Spearman’s hypothesis concerning the black-white differences on psychometric tests. Behav. Brain Sci. 1987, 10, 512–519. [Google Scholar] [CrossRef]
- Nyborg, H.; Jensen, A.R. Black-White differences on various psychometric tests: Spearman’s hypothesis tested on American armed services veterans. Personal. Individ. Differ. 2000, 28, 593–599. [Google Scholar] [CrossRef]
- Jensen, A.R.; Whang, P.A. Speed of accessing arithmetic facts in long-term memory: A comparison of Chinese-American and Anglo American children. Contemp. Educ. Psychol. 1994, 19, 1–12. [Google Scholar] [CrossRef]
- Te Nijenhuis, J.; van den Hoek, M.; Armstrong, E. LSpearman’s hypothesis and Amerindians: A meta-analysis. Intelligence 2015, 50, 87–92. [Google Scholar] [CrossRef]
- Te Nijenhuis, J.; David, H.; Metzen, D.; Armstrong, E.L. Spearman’s hypothesis tested on European Jews vs non-Jewish Whites and vs Oriental Jews: Two meta-analyses. Intelligence 2014, 44, 15–18. [Google Scholar] [CrossRef]
- Lynn, R.; Owen, K. Spearman’s hypothesis and test score differences between Whites, Indians, and Blacks in South Africa. J. Gen. Psychol. 1994, 121, 27–36. [Google Scholar] [CrossRef] [PubMed]
- Rushton, J.P.; Skuy, M. Performance on Raven’s Matrices by African and White university students in South Africa. Intelligence 2000, 28, 251–265. [Google Scholar] [CrossRef]
- Rushton, J.P.; Jensen, A.R. African-White IQ differences from Zimbabwe on the Wechsler Intelligence Scale for Children-Revised are mainly on the g factor. Personal. Individ. Differ. 2003, 34, 177–183. [Google Scholar] [CrossRef]
- Te Nijenhuis, J.; van der Flier, H. Comparability of GATB scores for immigrants and majority group members: Some Dutch findings. J. Appl. Psychol. 1997, 82, 675–687. [Google Scholar] [CrossRef]
- Te Nijenhuis, J.; van der Flier, H. Bias research in the Netherlands: Review and implications. Eur. J. Psychol. Assess. 1999, 15, 165–175. [Google Scholar] [CrossRef]
- Te Nijenhuis, J.; Willigers, D.; Dragt, J.; van der Flier, H. The effects of language bias and cultural bias estimated using the method of correlated vectors on a large database of IQ comparisons between native Dutch and ethnic minority immigrants from non-Western countries. Intelligence 2016, 54, 117–135. [Google Scholar] [CrossRef]
- Fuerst, J. Ethnic/Race Differences in Aptitude by Generation in the United States: An Exploratory Meta-analysis. Open Differ. Psychol. 2014. [Google Scholar] [CrossRef]
- Warne, R.T. Testing Spearman’s hypothesis with advance placement examination data. Intelligence 2016, 57, 87–95. [Google Scholar] [CrossRef]
- Te Nijenhuis, J.; van den Hoek, M.; Metzen, D.; David, H. Spearman’s hypothesis not supported? Three meta-analyses of Black and White prisoners, Northeast Asians, and Arabs and Jews. Personal. Individ. Differ. 2017, 117, 52–59. [Google Scholar] [CrossRef]
- Helms-Lorenz, M.; Van de Vijver, F.J.R.; Poortinga, Y.H. Cross-cultural differences in cognitive performance and Spearman’s hypothesis: g or c? Intelligence 2003, 31, 9–29. [Google Scholar] [CrossRef]
- Te Nijenhuis, J.; van der Flier, H. Immigrant-majority group difference in cognitive performance: Jensen effects, cultural effects, or both? Intelligence 2003, 31, 443–459. [Google Scholar] [CrossRef]
- Dolan, C.V. Investigating Spearman’s hypothesis by means of multi-group confirmatory factor analysis. Multivar. Behav. Res. 2000, 35, 21–50. [Google Scholar] [CrossRef] [PubMed]
- Lubke, G.H.; Dolan, C.V.; Kelderman, H. Investigating group differences on cognitive tests using Spearman’s Hypothesis: An evaluation of Jensen’s method. Multivar. Behav. Res. 2001, 36, 299–324. [Google Scholar] [CrossRef] [PubMed]
- Ashton, M.C.; Lee, K. Problems with the method of correlated vectors. Intelligence 2005, 33, 431–444. [Google Scholar] [CrossRef]
- Van Der Maas, H.L.J.; Dolan, C.V.; Grasman, R.P.P.P.; Wicherts, J.M.; Huizenga, H.M.; Raijmakers, M.E.J. A dynamical model of general intelligence: The positive manifold of intelligence by mutualism. Psychol. Rev. 2006, 113, 842–861. [Google Scholar] [CrossRef] [PubMed]
- Te Nijenhuis, J.; Batterjee, A.A.; van den Hoek, M.; Allik, J.; Sukhanovskiy, V. Spearman’s hypothesis tested comparing Saudi Arabian children and adolescents with various other groups of children and adolescents on the items of the Standard Progressive Matrices. J. Biosoc. Sci. 2017, 49, 634–647. [Google Scholar] [CrossRef] [PubMed]
- Te Nijenhuis, J.; van den Hoek, M. Spearman’s hypothesis tested on Black adults: A meta-analysis. J. Intell. 2016, 4, 6. [Google Scholar] [CrossRef]
- Te Nijenhuis, J.; Choi, Y.Y.; van den Hoek, M.; Valueva, E.; Lee, K.H. Spearman’s hypothesis tested comparing Korean young adults with various other groups of young adults on the items of the Advanced Progressive Matrices. J. Biosoc. Sci. 2018. forthcoming. [Google Scholar]
- Woodley, M.A.; te Nijenhuis, J.; Must, O.; Must, A. Controlling for increased guessing enhances the independence of the Flynn effect from g: The return of the Brand effect. Intelligence 2014, 42, 27–34. [Google Scholar] [CrossRef]
- Lynn, R. In Italy, north-south differences in IQ predict differences in income, education, infant mortality, stature, and literacy. Intelligence 2010, 38, 93–100. [Google Scholar] [CrossRef]
- Lynn, R. IQ differences between the north and the south of Italy: A reply to Beraldo and Cornoldi, Belacchi, Giofre, Martini, and Tressoldi. Intelligence 2010, 38, 451–455. [Google Scholar] [CrossRef]
- Beraldo, S. Do differences in IQ predict Italian north-south differences in income? A methodological critique to Lynn. Intelligence 2010, 38, 456–461. [Google Scholar] [CrossRef]
- Cornoldi, C.; Belacchi, C.; Giofrè, D.; Martini, A.; Tressoldi, P. The mean Southern Italian children IQ is not particularly low: A reply to R. Lynn. Intelligence 2010, 38, 462–470. [Google Scholar] [CrossRef]
- Kura, K. Japanese north-south gradient in IQ predicts differences in stature, skin color, income, and homicide rate. Intelligence 2013, 41, 512–516. [Google Scholar] [CrossRef]
- Carl, N. IQ and Socioeconomic development across the regions of the UK. J. Biosoc. Sci. 2016, 48, 406–417. [Google Scholar] [CrossRef] [PubMed]
- Carl, N. IQ and socio-economic development across local authorities of the UK. Intelligence 2016, 55, 90–94. [Google Scholar] [CrossRef]
- Lynn, R. North–south differences in Spain in IQ, educational attainment, per capita income, literacy, life expectancy and employment. Mank. Q. 2012, 52, 265–291. [Google Scholar]
- Roivainen, E. Economic, educational, and IQ gains in eastern Germany 1990–2006. Intelligence 2012, 40, 571–575. [Google Scholar] [CrossRef]
- Lynn, R.; Sakar, C.; Cheng, H. Regional differences in intelligence, income and other socio-economic variables in Turkey. Intelligence 2015, 50, 144–149. [Google Scholar] [CrossRef]
- Dutton, E.; Bakhiet, S.; Ziada, K.; Essa, Y.; Ali, H.; Alqafari, S. Regional difference in intelligence in Egypt: A country where upper is lower. J. Biosoc. Sci. 2018, 1, 9. [Google Scholar] [CrossRef]
- Flynn, J.R.; te Nijenhuis, J.; Metzen, D. The g beyond Spearman’s g: Flynn’s paradoxes resolved using four exploratory meta-analyses. Intelligence 2014, 44, 1–10. [Google Scholar] [CrossRef]
- Frey, M.C.; Detterman, D.K. Scholastic assessment or g?: The relationship between the scholastic assessment test and general cognitive ability. Psychol. Sci. 2004, 15, 373–378. [Google Scholar] [CrossRef] [PubMed]
- Koenig, K.A.; Frey, M.C.; Detterman, D.K. ACT and general cognitive ability. Intelligence 2008, 36, 153–160. [Google Scholar] [CrossRef]
- NIER, National Institute for Educational Policy Research, Japan. The Result of the National Achievement Tests. 2018. Available online: https://www.nier.go.jp/kaihatsu/zenkokugakuryoku.html (accessed on 3 February 2019).
- R Core Team. R: A language and environment for statistical computing. R Foundation for Statistical Computing: Vienna, Austria, 2018. ISBN3-900051-09-7. Available online: https://www.r-project.org/ (accessed on 3 February 2019).
- Hammer, M.F.; Karafet, T.M.; Park, H.; Omoto, K.; Hirihara, S.; Stoneking, M.; Horai, S. Dual origins of the Japanese: Common ground for hunter-gatherer and farmer Y chromosomes. J. Hum. Genet. 2006, 51, 47–58. [Google Scholar] [CrossRef] [PubMed]
- Rushton, J.P.; Jensen, A.R. Thirty years of research on race differences in cognitive ability. Psychol. Public Policy Law 2005, 11, 235–294. [Google Scholar] [CrossRef]
Figure 1.
The g loadings and the mean differences (effect size d) between Akita and Okinawa, and Fukui and Kochi on 86 achievement test scores from 2007 to 2018 (r = 0.77, r =0. 71, respectively).
Figure 1.
The g loadings and the mean differences (effect size d) between Akita and Okinawa, and Fukui and Kochi on 86 achievement test scores from 2007 to 2018 (r = 0.77, r =0. 71, respectively).

Figure 2.
g loadings and average distance D for 86 achievement tests from 2007–2018 (r = 0. 75, ρ = 0.64).
Figure 2.
g loadings and average distance D for 86 achievement tests from 2007–2018 (r = 0. 75, ρ = 0.64).

Table 1.
The correlations between g loadings and d (mean difference) for test scores from year 2007–2018.
Table 1.
The correlations between g loadings and d (mean difference) for test scores from year 2007–2018.
| Method | N of Test Scores | Prefectures | r | ρ |
|---|---|---|---|---|
| Year 2007–2018 | 86 | Akita–Okinawa | 0.77 *** | 0.66 *** |
| Fukui–Kochi | 0.71 *** | 0.74 *** |
*** p < 0.001.
© 2019 by the authors. Licensee MDPI, Basel, Switzerland. This article is an open access article distributed under the terms and conditions of the Creative Commons Attribution (CC BY) license (http://creativecommons.org/licenses/by/4.0/).
Share and Cite
MDPI and ACS Style
Kura, K.; te Nijenhuis, J.; Dutton, E. Spearman’s Hypothesis Tested Comparing 47 Regions of Japan Using a Sample of 18 Million Children. Psych 2019, 1, 26-34. https://doi.org/10.3390/psych1010002
AMA Style
Kura K, te Nijenhuis J, Dutton E. Spearman’s Hypothesis Tested Comparing 47 Regions of Japan Using a Sample of 18 Million Children. Psych. 2019; 1(1):26-34. https://doi.org/10.3390/psych1010002
Chicago/Turabian StyleKura, Kenya, Jan te Nijenhuis, and Edward Dutton. 2019. "Spearman’s Hypothesis Tested Comparing 47 Regions of Japan Using a Sample of 18 Million Children" Psych 1, no. 1: 26-34. https://doi.org/10.3390/psych1010002