Next Article in Journal / Special Issue
Spearman’s Hypothesis Tested Comparing 47 Regions of Japan Using a Sample of 18 Million Children
 
 
Please note that, as of 22 March 2024, Psych has been renamed to Psychology International and is now published here.
Article

Biogeographic Ancestry, Cognitive Ability and Socioeconomic Outcomes

by
Emil O. W. Kirkegaard
1,*,
Michael A. Woodley of Menie
2,
Robert L. Williams
3,
John Fuerst
1 and
Gerhard Meisenberg
1
1
Ulster Institute for Social Research, London AL2 1AB, UK
2
Center Leo Apostel for Interdisciplinary Studies, Vrije Universiteit Brussel, Krijgskundestraat 33, B-1160, Brussels, Belgium
3
Independent researcher
*
Author to whom correspondence should be addressed.
Psych 2019, 1(1), 1-25; https://doi.org/10.3390/psych1010001
Submission received: 12 November 2018 / Revised: 20 December 2018 / Accepted: 20 December 2018 / Published: 10 January 2019

Abstract

:
The cause(s) of ubiquitous cognitive differences between American self-identified racial/ethnic groups (SIREs) is uncertain. Evolutionary-genetic models posit that ancestral genetic selection pressures are the ultimate source of these differences. Conversely, sociological models posit that these differences result from racial discrimination. To examine predictions based on these models, we conducted a global admixture analysis using data from the Pediatric Imaging, Neurocognition, and Genetics Study (PING; N = 1,369 American children). Specifically, we employed a standard methodology of genetic epidemiology to determine whether genetic ancestry significantly predicts cognitive ability, independent of SIRE. In regression models using four different codings for SIRE as a covariate, we found incremental relationships between genetic ancestry and both general cognitive ability and parental socioeconomic status (SES). The relationships between global ancestry and cognitive ability were partially attenuated when parental SES was added as a predictor and when cognitive ability was the outcome. Moreover, these associations generally held when subgroups were analyzed separately. Our results are congruent with evolutionary-genetic models of group differences and with certain environmental models that mimic the predictions of evolutionary-genetic ones. Implications for research on race/ethnic differences in the Americas are discussed, as are methods for further exploring the matter.

1. Introduction

Cognitive ability, whether measured by IQ tests, Piagetian tests, educational/scholastic tests (e.g., PISA, TIMSS, etc.), or other indices of cognitive functioning, differs on average between biogeographic ancestry groups (BGAs). (We use the term “cognitive ability” instead of “general intelligence” or “general cognitive ability” to make clear that we are not committing to a claim about the psychometric nature of the underlying construct. For the purpose of this study, the distinctions between cognitive ability in general and general cognitive ability are not important.) According to Shriver and Kittles [1], biogeographic ancestry is the personal genetic history, indexed by ancestrally informative autosomal markers, which reflects an individual’s overall ancestry with respect to “population groups” (also referred to as “clusters,” “ancestral groups,” and “ancestral populations”). These reference biogeographic ancestry groups differ owing to the effects of evolutionary factors, such as “isolation by distance,” and barriers that “have all affected human migration and mating patterns in the past.” Biogeographic ancestry groups have commonly been called “races” (see [2,3]). Examples of these groups include East Asians, Europeans, sub-Saharan Africans, and Amerindians (see [4]). Cognitive ability differences appear both between nations (e.g., in predominantly European versus predominantly African national populations), and between self-identified racial and ethnic (SIRE) groups within nations (e.g., Whites versus African Americans in the USA [5,6,7]). The cause(s) of inter- and intra-national cognitive ability gaps is highly uncertain and hotly debated, with some researchers arguing that genetic differences are substantially or even predominantly responsible for at least some of these gaps (e.g., [8]) and others maintaining that non-genetic environmental factors fully account for the gaps (e.g., [9,10]).
Nevertheless, in the most recent survey of intelligence researchers, “genes were rated as the most important cause (17%) [of international differences], followed by educational quality (11.44%), health (10.88%), and educational quantity (10.20%)” [11]. Further, 90% of the surveyed experts believed that international differences were at least in part genetic in origin. Rindermann, Coyle, and Becker [12] also reported that 83% of survey respondents believed that the Black-White cognitive gap in the USA is partially due to genetic differences between the relevant populations. While there certainly is no general consensus among researchers, a substantial number of them believe that both international and certain intra-national SIRE differences in cognitive ability have a partial genetic basis [11,13].
Although racial and ethnic groups within a country can differ behaviorally for a variety of reasons (e.g., selective self-identification or local selective migration), possible genetic bases of these differences are typically analyzed in an evolutionary framework. When discussing evolved human diversity, one can conceptualize groups in a number of different ways, e.g., as subspecies (taxonomically significant subdivisions of a species), ecotypes (environmentally adapted types), clines (character gradients), and morphs (alternative phenotypes in a population). Following the work of Charles Darwin, communities are frequently delineated by propinquity descent since descent is understood as inductively potent. The preferable term to describe descent-based groups (e.g., variety, genetic population, race, genetic cluster, ancestry group, etc.) is a matter of ongoing semantic dispute. Here we call them “biogeographic ancestry groups” (again, BGAs), as is frequently done in genetic epidemiology. There are phenotypic and genetic differences between these groups, with evolutionary forces acting over relatively short spans of time likely having caused this divergence [14]. Importantly, these ancestry groups are delimitable using genomic data.
The cause(s) of inter-BGA differences in cognitive ability specifically is the subject of several evolutionary theories, which decompose broadly into two categories: (1) Pleistocene-selection models and (2) Holocene-selection models. The former posit the action of evolutionarily novel factors that differed systematically in the regions to which human groups migrated after leaving Africa around 60 to 100 kya (thousand years ago), and which specifically selected for increased cognitive ability as a mechanism for enhancing survival [15]. Salient evolutionarily novel challenges likely included the presence of seasonality, specifically cold winters during the main Würm glaciation event 60 kya, when temperatures in Europe and (especially) Northeast Asia were considerably lower on average than they are today. Extreme cold, coupled with the challenge of provisioning for the future such as to anticipate seasonality (e.g., food storage) have been proposed as sources of selection for higher cognitive ability and other somatic traits related to innovation and productivity [16,17]. These climatic models predict that North East Asian and European BGA groups will have higher levels of cognitive ability than Pacific Islanders, sub-Saharan Africans, and Amerindians (at least from the tropical and subtropical regions of the Americas).
Research in comparative zoology supports climatic models of this kind. A large body of research has investigated the climatic correlates of cognitive ability—usually measured with brain size as a proxy variable—in non-human animals. Non-migratory birds have been a primary choice of study [18,19,20,21] given their range of habitat and the ease of studying them. Studies have revealed the expected patterns, namely that birds that live further north and in more seasonally affected areas have larger brains (controlling for body size), more flexible behavior, and more innovative behavior [18,20,22].
Holocene-selection models stress the observation that the rate of adaptive evolution during the Holocene (beginning roughly 12 kya) was on the order of 100 times that experienced by humans during the preceding Pleistocene epoch, thus the evolutionary factors crucial to the origin of these differences may have arisen relatively recently [14]. Culture-gene co-evolution theory posits that cognitive ability and cultural complexity arose in tandem via a feedback process. Eurasian populations’ transition into sedentarism during the late Pleistocene and early Holocene would have been associated with a substantial increase in cognitive challenges, such as those related to competition over settled land, management of agriculture, and sustainment of higher standing population densities [14,23]. Innovations in modes of production and social organization (such as intensified division of labor) would have led to hierarchical societies involving strong individual-level competition for finite resources, which may have been a major source of social selection favoring higher levels of cognitive ability. Clark [24,25] documents the persistence of downward social mobility among the descendants of elites who competed for limited economic and social resources, with the less competitive sinking into lower-status occupational niches. The end result of this process was a persistent “bootstrapping” of the population, as cognitive ability (and other salient “bourgeois” traits) rose across all levels of the social hierarchy, leading to greater degrees of industriousness and innovativeness. This may in turn have boosted the competitiveness of certain European, and perhaps Northeast Asian, BGAs, permitting group-level expansion (or colonialism), which likely enhanced the biocultural “corporate” fitness of these populations—a process that may only have ceased in the West in the mid-19th century. Around this time, the advent of milder climates and concomitantly reduced ecological stress (corresponding to the end of the Maunder Minimum), coupled with both social and technological innovations that allowed those with relatively high cognitive ability to control their fertility, potentially reversed the fitness advantage of those with relatively high cognitive ability compared to those with relatively low cognitive ability [26]). Given that these Holocene-selection models posit that Eurasian populations had the greatest exposure to environmental challenges favoring the fitness of those with relatively high cognitive ability, they predict that selection for cognitive ability was stronger in Eurasian populations than non-Eurasian ones, such as Pacific Islanders, sub-Saharan Africans, and Amerindians.
A further evolutionary theory of inter-BGA cognitive differences is the disease-stress model. This has assumed forms that posit [27] and do not posit [28] genetic differences to explain inter-BGA disparities in cognitive ability. Models of the latter type propose that in the Pleistocene environment of evolutionary adaptedness, humans were repeatedly exposed to periods of high and low parasite stress. They further maintain that this exposure to variable levels of parasite stress favored the evolution of epigenetic adaptations that dynamically regulate tradeoffs of bioenergetic investments into brain/cognitive development or immune system functioning in response to environmental challenges, with greater investments into the latter over the former occurring in high-parasite-stress contexts. Therefore, when humans radiated into novel, more northerly and easterly low-parasite-stress ecologies, they came pre-adapted with the capacity to developmentally trade immune system functioning for higher cognitive ability, which is reflected in very strong inverse ecological correlations between national IQ and parasite-burden indices [28]. Given the global distribution of parasite burdens, this model predicts, as do the other evolutionary theories, that the populations of Europe and North East Asia have higher cognitive ability relative to those of the Pacific Islands and the tropical and subtropical regions of the Americas, as well as the populations of sub-Saharan Africa. But this version of the disease-stress model is clearly inadequate to account for the total global pattern of inter-BGA cognitive ability variation, since it seemingly cannot explain BGA cognitive ability gaps found within nations, where BGA groups do not differ substantially in their exposure to parasites (since they inhabit the same general environments that the nations encompass). Therefore, our statistical analyses do not endeavor to test predictions of this disease-stress model.
Conversely, genetic disease-stress models posit that globally variable geographical factors covary with disease burdens, and that genetic adaptations to local disease burdens have partially generated inter-BGA differences in social outcomes and related phenotypes, including cognitive ability [27]. While our data do not permit any direct test of this, or any other, particular evolutionary account of the emergence of inter-BGA cognitive ability variation, global admixture analytic findings indicative of a genetic etiology of such variability would be consistent with all the evolutionary theories reviewed here, apart from the epigenetic disease-stress model.

1.1. Genomic Studies of Selection in Humans

There are several fairly well-documented cases of recent simple selection in humans. Examples include skin tone and high-altitude adaptations. The study of highly polygenic selection via changes in frequencies of many alleles (soft sweeps) in humans has advanced recently due to the availability of large-scale, powerful computer clusters and large genomic datasets. A number of recent studies based on genomic data have found evidence of recent polygenic selection in humans over time [29,30] and space [31,32,33,34]. These findings indicate selection for, e.g., height [31], body mass [32], cognitive ability [33], educational attainment [34,35], and schizophrenia [36].
One significant concern with genomic studies that compare polygenic score (PGS) frequencies between major ancestry groups is the “transethnic validity” of PGS [37]. Most genome-wide association studies (GWASs) are done solely on people of European ancestry (to avoid population-stratification confounding). These studies unfortunately yield predictive models that are less useful in non-Europeans, particularly Africans [38,39]. This problem results from two factors. First, the genetic variants discovered in GWASs are typically not causal (with respect to the trait of interest) but are so-called “tag variants.” These are variants that are close enough on the genome to the causal variants such that their presence in the population is statistically linked (known as linkage disequilibrium; LD). Second, the degree to which two variants on the genome are in LD partly depends on the populations studied and their genetic distance; this is because random genetic patterns can arise over time (i.e., genetic drift in LD).
The effect is that a given variant which tags a causal variant in Europeans may not do so, or not very well, in other populations, thus reducing the validity of European-derived estimates of the true PGS. As a result, the predictive validity of associated variants in one major BGA group frequently does not transfer to others. While a number of methods have been employed to control for drift-related effects [33,36], and while robust or partially robust inter-BGA differences in educational attainment and intelligence PGS have been found, until causal variants that are not affected by LD [38] are identified, PGS-based results will continue to carry a degree of uncertainty.

1.2. Admixture Analysis

Admixture analysis—analysis of genetic ancestry in previously isolated but recently interbred populations, which relates genetic ancestry to outcomes—is a potent tool used by medical geneticists for the exploration of the source of trait differences and disease disparities in and among admixed populations. The relationships between genomic ancestry and phenotype are treated as indirect evidence of genetic causation, especially when confounds are controlled in regression analysis (e.g., [40,41,42]). Admixture analysis includes global admixture analysis and admixture mapping. When ancestral BGA groups vary in the frequency of genetic variants underlying a trait, in admixed populations the phenotype of interest will be correlated with BGA in genomic regions near the causal genetic variants. This situation allows for the identification of associated loci, a process called admixture mapping [43,44]. When the trait has a complex genetic architecture, one where thousands of loci are assumed to contribute to the phenotype, an appropriate first step is global admixture analysis. This process seeks to identify associations between global BGA and phenotype, without attempting to identify local regions of a genome associated with a phenotype. One advantage to global admixture analysis is that it requires much smaller sample sizes compared to admixture mapping.
Templeton [45] has intricately detailed the logic of global admixture analysis as applied to evolutionary-genetic models. Generally, global admixture analysis within ethnic groups can be viewed as a Mendelian “common garden” experiment, since members of the same ethnic groups experience similar cultures and environments. Factors affecting SIRE groups in general (e.g., stereotype threat, race-based discrimination, segregation, cultural norms, dialect, language, etc.) are either controlled for or attenuated. This basic logic has been adopted by genetic epidemiologists e.g., [40,41,42,46] who frequently examine the association between global genetic ancestry and traits either within ethnic groups or after controlling for SIRE. Admixture analysis has been applied to study the etiology of inter-BGA differences in, among other traits, height [47], sleep behaviors [48], and brain morphology [49]. The quantitative predictions and theoretical basis of global admixture analysis have often not been explicated. Doing so requires employment of a series of simulations that incrementally increase in model complexity and realism. We do this in Appendix 1 of Supplementary File 1, which contains the simulations and explanations.
Before the advent of genomic ancestry testing, attempts were made to test evolutionary predictions with respect to inter-BGA cognitive ability differences using other methods (for reviews, see [50]). Ancestry was estimated using traits such as skin color, blood groups, and reported genealogy. In other words, these studies relied on various proxies or poor measures of genomic ancestry, and further the samples were usually small; moreover, no one has systematically meta-analyzed the data to settle the interpretive dispute. More recent studies have utilized nation-level data on the frequencies of Y-chromosomal haplogroups [23,51], estimates of between-country genetic distance [52], and estimates of regional and national-level ancestry percentages [5] as predictors of national variation in cognitive ability. These recent studies have been restricted to the national level of analysis, which necessarily reduces sample resolution. As a result of these problems and others, there has been disagreement about whether past studies employing these techniques show, in admixed populations, the expected relations between BGA and cognitive ability [8,53,54].
Thus far, no published study has examined genomic ancestry, assessed using genomic era methods, in a large sample and related the findings to cognitive ability, while taking into account the confounding effect of racial/ethnic identity. One study [55], using the same sample presently examined, reported ANOVA results for genetic ancestry and test scores. The authors, however, did not report coefficients for specific ancestries, did not use general factor scores, and did not examine the effect of ancestry within SIRE groups. The last of these is a critical aspect of the so-called “common garden” experiment.
A large meta-analysis of pan-American epidemiological studies found that European genetic ancestry was robustly associated with better socioeconomic outcomes relative to African and Amerindian ancestry in admixed populations (European: r = 0.18, k = 28, N = 35,476.5; [56]). Amerindian and African ancestry were related to poorer socioeconomic outcomes: r = −0.14, k = 31, N = 28,937.5 and r = −0.11, k = 28, N = 32,710.5, respectively. Consistent with evolutionary models, these associations were found within admixed ethnic groups, and when the effect of SIRE was statistically controlled for. Given these associations between genetic ancestry and SES, and the moderate-to-strong relationship between cognitive ability and SES [57], it is likely that BGA is also associated with higher cognitive ability at least partially independent of SIRE. A related finding is that BGA is a strong predictor of regional cognitive and general socioeconomic outcomes across the Americas [5,6,58] both at the country- and first-order division (e.g., province, state, district) level. This provides ecological support for the expectation that individual BGA will be robustly associated with cognitive ability.
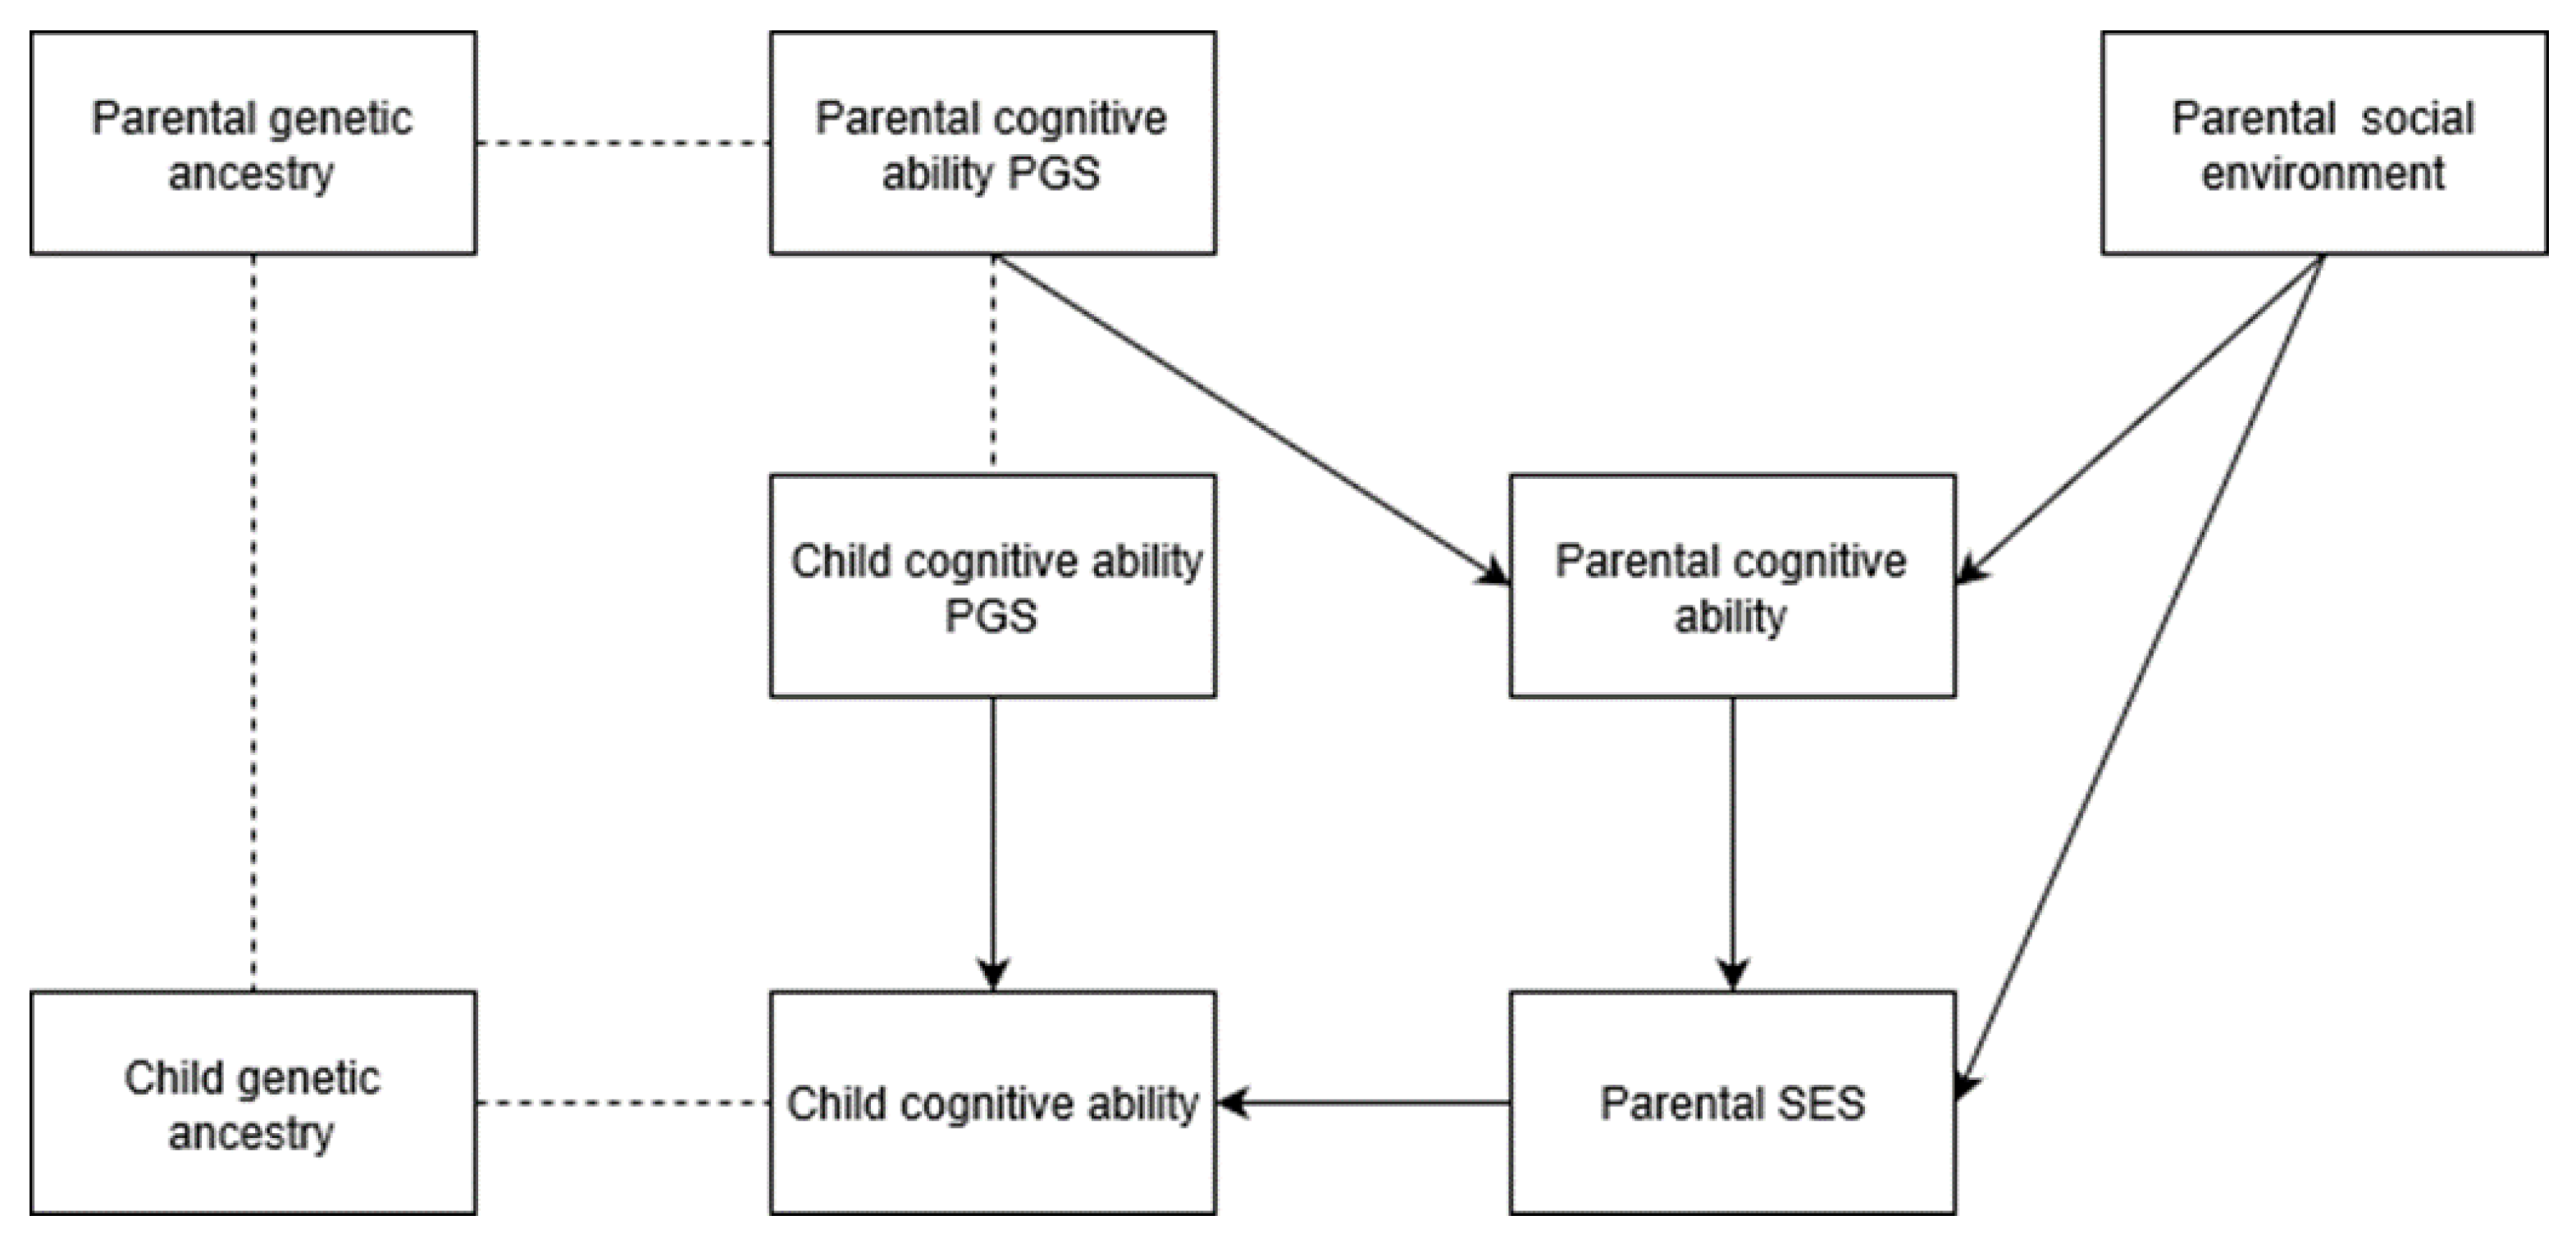
The purpose of the current study is to test the prediction that BGA is associated with cognitive ability after statistically controlling SIRE (which indexes a number of factors commonly invoked to explain cognitive gaps between BGAs, such as racial discrimination), and to quantify the magnitudes of the individual-level associations. More generally, we sought to apply global admixture analysis, via genomic data, on American samples. We aimed to determine if associations between genetic ancestry and IQ are more consistent with commonly proposed evolutionary-genetic or social environment-based explanations for mean cognitive ability differences observed between European and East Asian descent groups relative to African, Amerindian, and Oceanian ones. Based on convergent results from pre-genomic-era studies, national-level analyses of ancestral markers, genomic PGS research, individual-level SES-admixture results, and regional-level SES/cognitive ability-admixture results, we expect that results similar to those found for SES-admixture will be found for cognitive ability.

2. Material and Methods

Data used in this study were obtained from the Pediatric Imaging, Neurocognition, and Genetics (PING) database (http://ping.chd.ucsd.edu/). The primary aim of PING was to create a well-standardized and carefully organized resource of magnetic resonance imaging (MRI) data, comprehensive genotyping data, and developmental and neuropsychological assessments for a large cohort of developing children. The PING data were based on a large sample (N = 1,391 with genetic ancestry data) of healthy American children of diverse ancestries [55]. Participants were not nationally representative, but were rather recruited from the greater metropolitan areas of Baltimore, Boston, Honolulu, Los Angeles, New Haven, New York, Sacramento, and San Diego. Individuals who had medical conditions that could affect their development were excluded from the recruitment process.

2.1. Cognitive Ability

Participants were given the National Institute of Health toolbox cognitive tests. These tests have previously been validated [59]. The cognitive sub-domain assessed by each test, along with the subtests’ psychometric characteristics, are detailed by Akshoomoff et al. [55]. The seven cognitive tests were as follows: Dimensional Change Card Sort Test (Card Sort); Flanker Inhibitory Control and Attention Test (Flanker); Picture Sequence Memory Test (Picture Sequence); Pattern Comparison Processing Speed Test (Pattern Recognition); Oral Reading Recognition Test (Pattern Recognition); List Sorting Working Memory Test (List Sort); and Picture Vocabulary Test (Vocabulary).
Some data were missing (4% of cells, 14% of cases, had at least 1 missing data point). We imputed values for cases that were missing less than half of their data points rounded down (three or fewer). Imputation was performed using IRMI [60,61]. After this, there were 1,369 cases with complete cognitive data and genetic ancestry (with 1,370 cases for some subtests).
Next, the effects of age was regressed out by first fitting a local regression model (LOESS; see [62]) with age as the predictor and then saving the residuals. LOESS was used for age because this approach is able to capture complex non-linear patterns in the data. For this regression, we used age at neuropsychological testing as the primary variable and we filled in missing data (n = 3) with age at MRI (total = 1,369 cases with g scores). The mean age was 11.75 (SD = 4.88; range = 3–21). Supplementary Figure S1 shows the distribution.
These residuals were then residualized again for sex using a standard linear model (OLS). As shown in Table 1, the age/sex corrected scores exhibited a positive manifold. The factor loadings of the subtests are shown in Table 1.
Finally, we factor analyzed (minimal residual factor analysis/PAF) the adjusted data for the seven tests and extracted a general cognitive ability (g) factor [63], using the psych 1.6.9 package [64]. The pattern of factor loadings looked normal and the g factor explained 26 percent of the variance. Using this method, g scores for 1,369 individuals were derived. Scores on this factor were saved and standardized (M = 0, SD = 1) for further analysis. We were then faced with the choice of whether to standardize the scores to the White subsample or whether to use the entire sample. We chose to use the full sample because this would counterbalance the likely cognitive ability/social status selection of the sample due to urban sampling. Sample sizes and descriptive statistics for the factor analysis are provided in Tables S13–S16 of Supplementary File 2.
The intercorrelations and g loadings were low compared to those found with standard IQ batteries; for example, the fourteen Woodcock–Johnson-III subtests showed an average g loading of 0.60 [65], while our seven subtests showed an average of 0.50 (0.37 to 0.57). These results, though, were comparable to those found in some adult datasets, such as the Human Connectome Project, which used similar subtests [66]. As the g scores for this sample predict parental SES no less well than typical IQ scores, and as they exhibit more or less the same magnitudes of ethnic differences as found using standard IQ batteries, there is no strong reason to suspect that these scores are particularly unreliable.
It is possible that there may be measurement invariance (MI) issues between SIRE groups. We do not attempt to explore this issue here, as it is not directly relevant to the hypothesis we test. The question we investigate is whether socioeconomic and cognitive differences between SIRE groups are, to some degree, statistically explainable by genetic ancestry, not whether the differences have the same sociological and psychometric meaning as differences between individuals within SIRE groups. More generally, we conceptualize our g scores as statistical constructs which represent summaries of observed subtest scores. We do not imply that these score differences index differences in a causal latent general factor (“biological g”; [67]). The same consideration applies with respect to our general SES scores. As such, more detailed analyses regarding the relation between observed scores, latent factors, and SIRE/genetic ancestry are unnecessary for testing the hypothesis (Dolan, pers. comm., 1 January 2018).
Nonetheless, to assess factorial invariance, we computed Tucker’s congruence coefficients for standard SIRE groups with sample sizes greater than 100. The congruent coefficient matrix is shown in Table 2. The congruence coefficient is a measure of factor similarity, with 0.95 or greater indicating virtually identical to identical factors and 0.85 to 0.94 indicating fair factor similarity [68]. For only two comparisons, Asian-African American and Asian-Hispanic, were the coefficients below 0.95. Note, these results do not directly address the issue of factor invariance with respect to genetic ancestry.

2.2. Parental Socioeconomic Status

The following SES variables were available: household income, guardian 1 educational level, guardian 2 educational level, guardian 1 occupational level, and guardian 2 occupational level. For 95% of the participants for which relationship data were available, guardian 1 was either a biological mother or father (missing data: 2%; self: 1%) and for 92% of the participants for which relationship data were available, guardian 2 was either a biological mother or father (missing data: 32%). Since most often guardians were parents, SES is referred to as parental SES. As before, some data were missing. To maximize the available sample size, data with at least one data point were imputed. Finally, variables were factor analyzed to extract a general SES factor. Scores (1380; 1363 with g scores also) were saved (M = 0, SD = 1) for further analysis. As before, the standardization was done the full sample, rather than the White subset. Intercorrelations and descriptive statistics for the factor analysis are provided in Tables S17 and S18 of Supplementary File 2.

2.3. SIRE and Genetic Ancestry Percentages

Genetic ancestry percentages were available in the PING data files (see [55] for details). These were calculated using over 15,000 single-nucleotide polymorphisms or SNPs (i.e., single DNA base pair variations). To access ancestry percentages, supervised clustering analysis with the ADMIXTURE algorithm was used. Ancestry was assigned to six major biogeographic clusters corresponding to indigenous Europeans, Africans, Americans, East Asians, Oceanians, and Central Asians. Ancestry percentages for a given individual summed to one with each individual being assigned a percentage with respect to each component. A total of 1391 individuals in the sample had genetic ancestry data. In addition to genetic ancestry percentages, multiple-option, dichotomous SIRE variables were available. These were based on the five major SIRE racial categories in the United States (White, African American, American Indian, Asian, and Pacific Islander) and the one US SIRE ethnic category (Hispanic). Some cases had missing SIRE data (1% of the cells); and these were imputed as “false.” A dummy variable, “Other,” was also created and set to “true” for participants who selected no SIRE.
Owing to the multiple-response nature of the SIRE categories, there were a number of different methods for defining them (for discussion, see [69]). Since concern has been raised about the impact of a researcher’s “degree of freedom” [70] and about assigning people to SIRE categories [69], we coded SIRE groups in four different ways. We did this to assess how coding decisions affected outcomes. The codings were: standard coding (for which separate categories are created for Hispanic and non-Hispanic multi-racial individuals along with each of the five racial identities), common combination coding (for which a category is created for each of the unique combinations of SIRE identities), continuous or interval coding (for which individuals are assigned a percentage of each SIRE category based on the number of responses chosen), and dummy coding (for which each of the six ethnic and racial categories is used as a dichotomous categorical predictor). The methods are discussed in more detail in Supplementary File 2.
Table 3 shows the sample characteristics for the full sample (which had g scores) and by Standard SIRE groups. A one way ANOVA indicated a significant effect of SIRE on age at the p < 0.01 level for the eight SIRE categories [F(7, 1,361) = 7.42, p < 0.01]. A Chi-Square test also indicated a significant effect of SIRE on sex [(Χ2(7, N = 1,369) = 21.372, p < 0.01)]. As the effect of sex and age was regressed out of cognitive ability, and as sex and age have no direct effect on genomic ancestry or Parental SES, no further steps were taken.

2.4. English as First Language

For 11% of the sample, English was not the participant’s first language. As cognitive tests could be biased against non-native speakers, a dichotomous English as First Language (EFL) variable was also included as a variable.

3. Preliminary Analyses

3.1. SIRE and Genomic Ancestry

It is known that genetic ancestry varies substantially within some US SIRE groups but not others [71]. To examine the distribution of genetic ancestry by SIRE in the current dataset, means and standard deviations of genetic ancestries were calculated by standard SIRE. The results are shown in Table 4 (Table S12 of Supplementary File 2 reports more descriptive statistics for the genetic ancestries). As expected, Whites were almost entirely genomically European (97%), as has been found in previous studies of US citizens (e.g., [71]). Other groups showed more admixture. For these, there were substantial discrepancies between SIRE and genetic ancestry. These discrepancies allow for the admixture analyses.
The correlations between continuous SIRE coding [for description, see Section 2.3 above] and genetic ancestry are shown in Table 5. It can be seen that continuous SIRE coding is a reasonably good index of genetic ancestry. Since US SIRE groups are fairly non-admixed, much of the variance is explained by recent patterns of exogamy which can be captured by this type of coding.

3.2. Bivariate Relationship between Genetic Ancestry, Cognitive Ability, and Parental SES

The correlations between CA, parental SES, and each of the genetic ancestries are shown in Table 6. The correlations were roughly as would be expected given the well-documented cognitive and socioeconomic differences between US SIRE groups. European ancestry had a moderate positive correlation with both cognitive ability and SES (r = 0.23 and 0.32, respectively), while negative relationships were seen for African (r = −0.33 and −0.30), Amerindian (r = −0.15 and −0.24), and Oceanian (r = −0.08 and −0.20) ancestries. The Genomic ancestry × SES correlations are larger than those previously reported by Kirkegaard et al. [56], presumably because this sample is not decomposed by SIRE group, leading to reduced restriction of range and thus higher correlations. The remaining ancestries had very small or inconsistent relationships. Not much should be made of the bivariate analysis for ancestry and outcomes because these confound the effects of multiple ancestries, as well as the effects of non-genetic causes. In particular, the ancestry variables are necessarily negatively related in general because every individual’s ancestry must sum to one (see Tables S8–S11 of Supplementary File 2 for correlation matrices by subpopulation).
Previous research has found a modest relation between parental SES and cognitive ability [57]. In our sample, the relation (r = 0.42) was somewhat stronger than typically reported. This increased strength of association is probably in part due to the use of a general socioeconomic factor, which is a more reliable measure, as opposed to individual measures of parental socioeconomic status.

4. Main Analyses

The key question is whether the bivariate associations between genetic ancestry and outcomes follow ancestry or racial/ethnic identification. This question was explored in two ways. First, the full sample was examined with SIRE being statistically controlled (4.1). Second, subgroup analyses were conducted (4.3). The analyses complement one another. The full sample analysis provides more power. Additionally, it allows for a robust exploration of the relation between parental SES, cognitive ability, and genetic ancestry (4.2). The subsample analyses allow focus to be directed to specific groups to see if the full sample associations replicate in subsamples.

4.1. Relationship between Genetic Ancestry, Cognitive Ability, and Parental SES

The main regression analysis strategy consisted of fitting models with SIRE (Model 1) and SIRE and genetic ancestry (Model 2). As there were two outcomes (cognitive ability and parental SES) and four methods of coding for SIRE, there were eight tables. The results from the standard and continuous SIRE models are shown in Table 7, Table 8, Table 9 and Table 10. The results based on the common SIRE and the dummy SIRE methods were largely redundant with respect to those based on, respectively, the standard SIRE and the continuous SIRE methods, and so are presented in the Supplementary File 2 (Tables S1–S4). The unstandardized beta coefficients are shown with both White SIRE and European ancestry as the reference classes (and, thus, unstandardized betas of 0). Since cognitive ability and SES scores are already standardized, these unstandardized betas represent a change in a standard deviation of cognitive ability/SES over a change in percentage of a given ancestry. The adjusted coefficient of determination, denoted as r2-adj., is reported to facilitate model comparison. As individuals were assigned ancestry percentages for each genetic ancestry group, the sample sizes are the same for each component. Across genetic ancestries, the standard errors varied substantially as a function of variance in admixture. Since one of the objectives was to determine the relative utility of including genetic ancestries as a predictor, ancestry components with high standard errors were not dropped (we did this, however, for some subgroup analyses below, see: Section 4.3 for discussion).
In general, the results of the four models yielded consistent patterns (for computations, see Tables S1–S4 in Supplementary File 2). Across all four models (the two sets reported above and the two reported in the supplementary file), African ancestry is consistently associated with large negative betas (cognitive ability: mean −1.46, range −1.31 to −1.59; SES: mean −1.47, range −1.23 to −1.76). Amerindian ancestry is consistently associated with large negative betas (cognitive ability: mean −0.92, range −0.75 to −1.15; SES: mean −1.90, range −1.76 to −2.06). Oceanian ancestry is consistently associated with negative betas (cognitive ability: mean: −2.76, range −1.32 to −4.81; SES: mean −4.02, range −1.58 to −7.23), though the upper and lower confidence intervals overlapped with zero, as shown in the supplementary file, so nothing definitive can be inferred here. Central Asian ancestry is associated with positive betas (cognitive ability: mean 0.17, range 0.15 to 0.21; SES: mean 0.81, range 0.62 to 1.07). East Asian ancestry did not show any consistent patterns (cognitive ability: mean 0.03, range −0.01 to 0.06; SES: mean 0.02, range −0.24 to 0.33). English as a first language is associated with consistent but weakly positive betas in the genetic ancestry models (cognitive ability: mean 0.04, range 0.03 to 0.05; SES: mean 0.13, range 0.11 to 0.16). These latter findings might reflect small effects of language bias in the tests, as well as the effects of factors related to parental immigration status. Finally, consistent with other research, continuous SIRE coding was a better predictor of cognitive ability and SES than was standard SIRE coding. And, as expected given the covariance between continuous SIRE and genetic ancestry, the use of continuous SIRE reduced the incremental predictive ability of genetic ancestry.
As the SIRE effects had wide confidence intervals, interpretation warrants caution. That said, the African American SIRE betas are universally positive across codings in the genetic ancestry model (cognitive ability: mean 0.24, range 0.09 to 0.31; SES: mean 0.26, range 0.02 to 0.42), with the exception of the “Hispanic, African American” common combination group (cognitive ability: −0.38; SES: −0.40). For Hispanic SIRE groups, the situation was reversed in that these predictors were uniformly related to worse outcomes (cognitive ability: mean −0.31, range −0.46 to −0.17; SES: mean −0.20, range −0.28 to −0.11). Since these SIRE effects are independent of genetic ancestry, they may reflect the effects of social favoritism/discrimination, or of SIRE-related cultural factors. Alternatively, they could be the product of selective ethnic attrition (e.g., [72]) and genetic differences resulting from ethnic leakage (see, e.g., [73]).
The results were robust to controls for MRI scanner location, a proxy for geographic location, with each site entered as a dummy variable (results not shown).

4.2. Relationship between Genetic Ancestry, Cognitive Ability, and Parental SES

Parental SES is a potential confound in models where children’s cognitive ability is an outcome. This is particularly the case given the moderate heritability of cognitive ability in childhood/early adolescence. In this case, it could be argued that associations between genetic ancestry and cognitive ability are consequent of those between parental genetic ancestry and parental SES. Figure 1 shows a theoretical path model of the variables. (We did not run a path model for this diagram as we lack trans-ethnically valid cognitive ability PGS).
Accordingly, offspring ancestry is a function of parental ancestry and is correlated with offspring trait PGS. Likewise, (1) parental ancestry is correlated with parental trait PGS; (2) offspring PGS is a function of parental PGS; (3) parental trait is a function of parental PGS and social environment; (4) parental socioeconomic status is a function of both parental trait and social environment; and (5) offspring trait is a function of parental provided environment and parental provided genotype.
Without longitudinal data, disentangling causal pathways is impossible, since controlling for parental SES has the effect of controlling for an indeterminate portion of those behavioral traits directly transmitted by parents. It also controls for what is sometimes referred to as “genetic nurture” [74], which refers to genetic effects from parents on offspring that condition offspring traits by way of nurturing (e.g., the socioeconomic environment provided). This caveat noted, the regression results for standard SIRE are reported in Table 11 (Tables S5–S7 show the results for the common combination, dummy SIRE, and continuous method).
The betas for the genetic ancestries were reduced in size, especially in the case of Amerindian ancestry, but the directions were consistent with previous results.
For ease of summary, the relative importance of the predictors across ancestries and across the four models was quantified by calculating etas from ANOVA using sum of squares type II (following the methods detailed in Supplementary File 2, Appendix 1). Before the inclusion of parental SES, the mean total eta for the independent effect of genetic ancestry on cognitive ability was 0.18; after the inclusion of parental SES it was reduced to 0.11. However, it still outperformed SIRE in all models (means of 0.26, 0.11, 0.08, and 0.00 for parental SES, genetic ancestry, SIRE, and language, respectively). This is illustrated in Figure 2. (See Tables S19–S21 for complete results.)

4.3. Subgroup Analyses

A number of subgroup analyses were carried out to see whether the results hold when data are disaggregated by SIRE groups. For this purpose, three subgroups of interest were chosen: (1) non-Whites, (2) African Americans, and (3) Hispanics. Models for other subgroups were not fit as the samples were too small to allow for an analysis with sufficient power to detect differences given the predictions of tenable evolutionary hypotheses or because, in the case of non-Hispanic mono-SIRE Whites, there was little variance in admixture.

4.3.1. Non-Whites

For this analysis, everyone classified as standard coding White was excluded. This group corresponds to the sociological construct of “people of color.” Dummy coded SIRE predictors were used to avoid having to choose a new reference class, since doing so would make the betas less comparable with the regressions previously noted. A White SIRE predictor is included as some multiracial individuals identify as partially White. Table 12 shows the regression results. For Model 1 and Model 2 the dependents are cognitive ability and SES, respectively. The results are similar to those found previously, except that Oceanian ancestry was not a robust predictor here. Supplementary Table S8 shows the correlation matrix.

4.3.2. African Americans

For African Americans, two inclusion criteria were utilized, yielding a narrow and a broad subsample. For the narrow (standard SIRE) subsample, only those who self-identified as African Americans and no other SIRE were included. For this analysis, only one ancestry predictor, African, was included as there was low variance for the other non-European genetic ancestries, and since this model showed a relatively good fit.
For the broad coding (in which everyone who identified as “African American” was included), it was an open question as to which model to use. The general criterion for model selection was adjusted R2. In case of similar model fits, European ancestry was left out, the simplest models were used (in order to reduce standard errors of the predictors), and models which showed symmetry between the two outcomes were preferred (to ease comparison). Results for chosen models are shown in Table 13 and Table 14 (the remainder can be found in the study notebook).
The betas for African ancestry were consistently negative. Tables S9 and S10 (Supplementary File 2) show the correlation matrices for genetic ancestry, SES, and cognitive ability. Figure 3 below shows the plot of European ancestry × cognitive ability in the standard African American population (in turquoise) along with the distribution of ancestry in the standard White population (in red). The large circles represent population means.

4.3.3. Hispanics

For Hispanics, consistent with US research practices, every participant who self-identified as having Hispanic ethnicity was included. Four ancestry components showed sufficient variation to possibly warrant inclusion (African, Amerindian, East Asian, and European). European ancestry was dropped since it did not improve model fit (inclusion led to multicollinearity).
The regression results are shown in Table 15.
The betas for both African and Amerindian ancestry were strong for this subsample. Interestingly, first language had little predictive ability, even though it would be expected to have more for the Hispanic sample, which likely contains some children of recent immigrants. Table S11 shows the correlation matrix. Figure 4 replicates Figure 3 but with Hispanics instead of African Americans.

5. Discussion and Conclusions

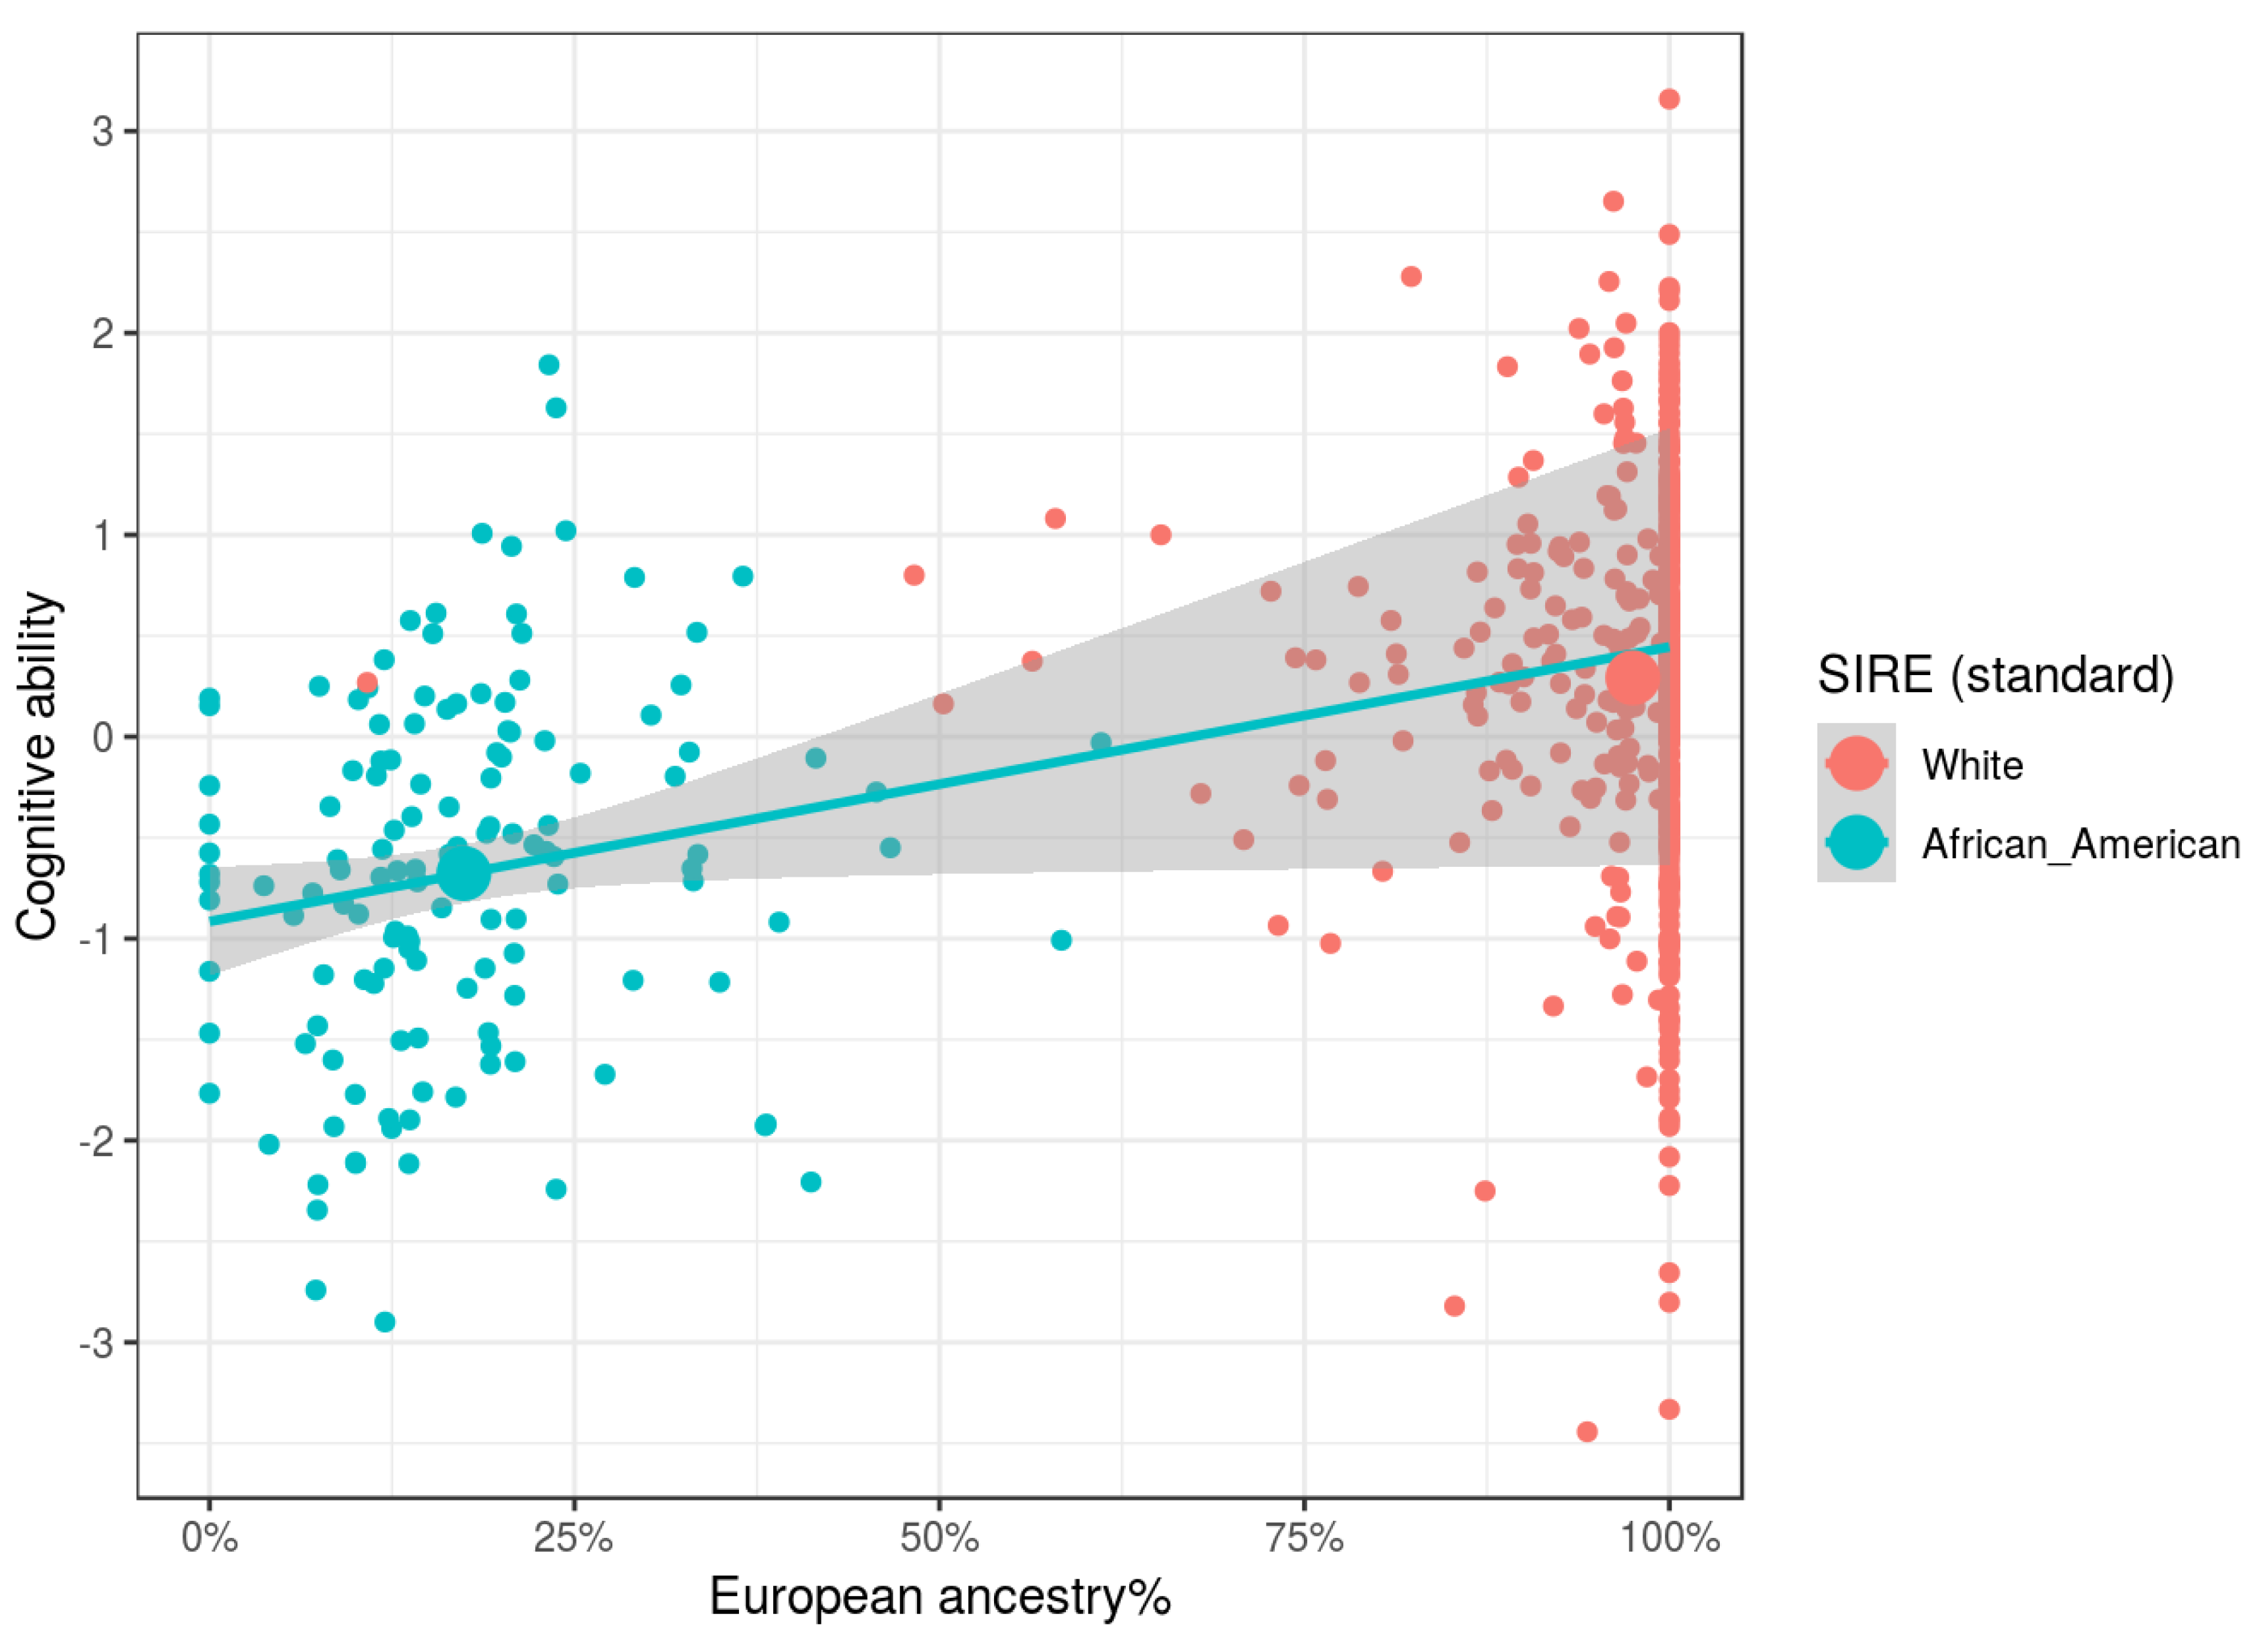
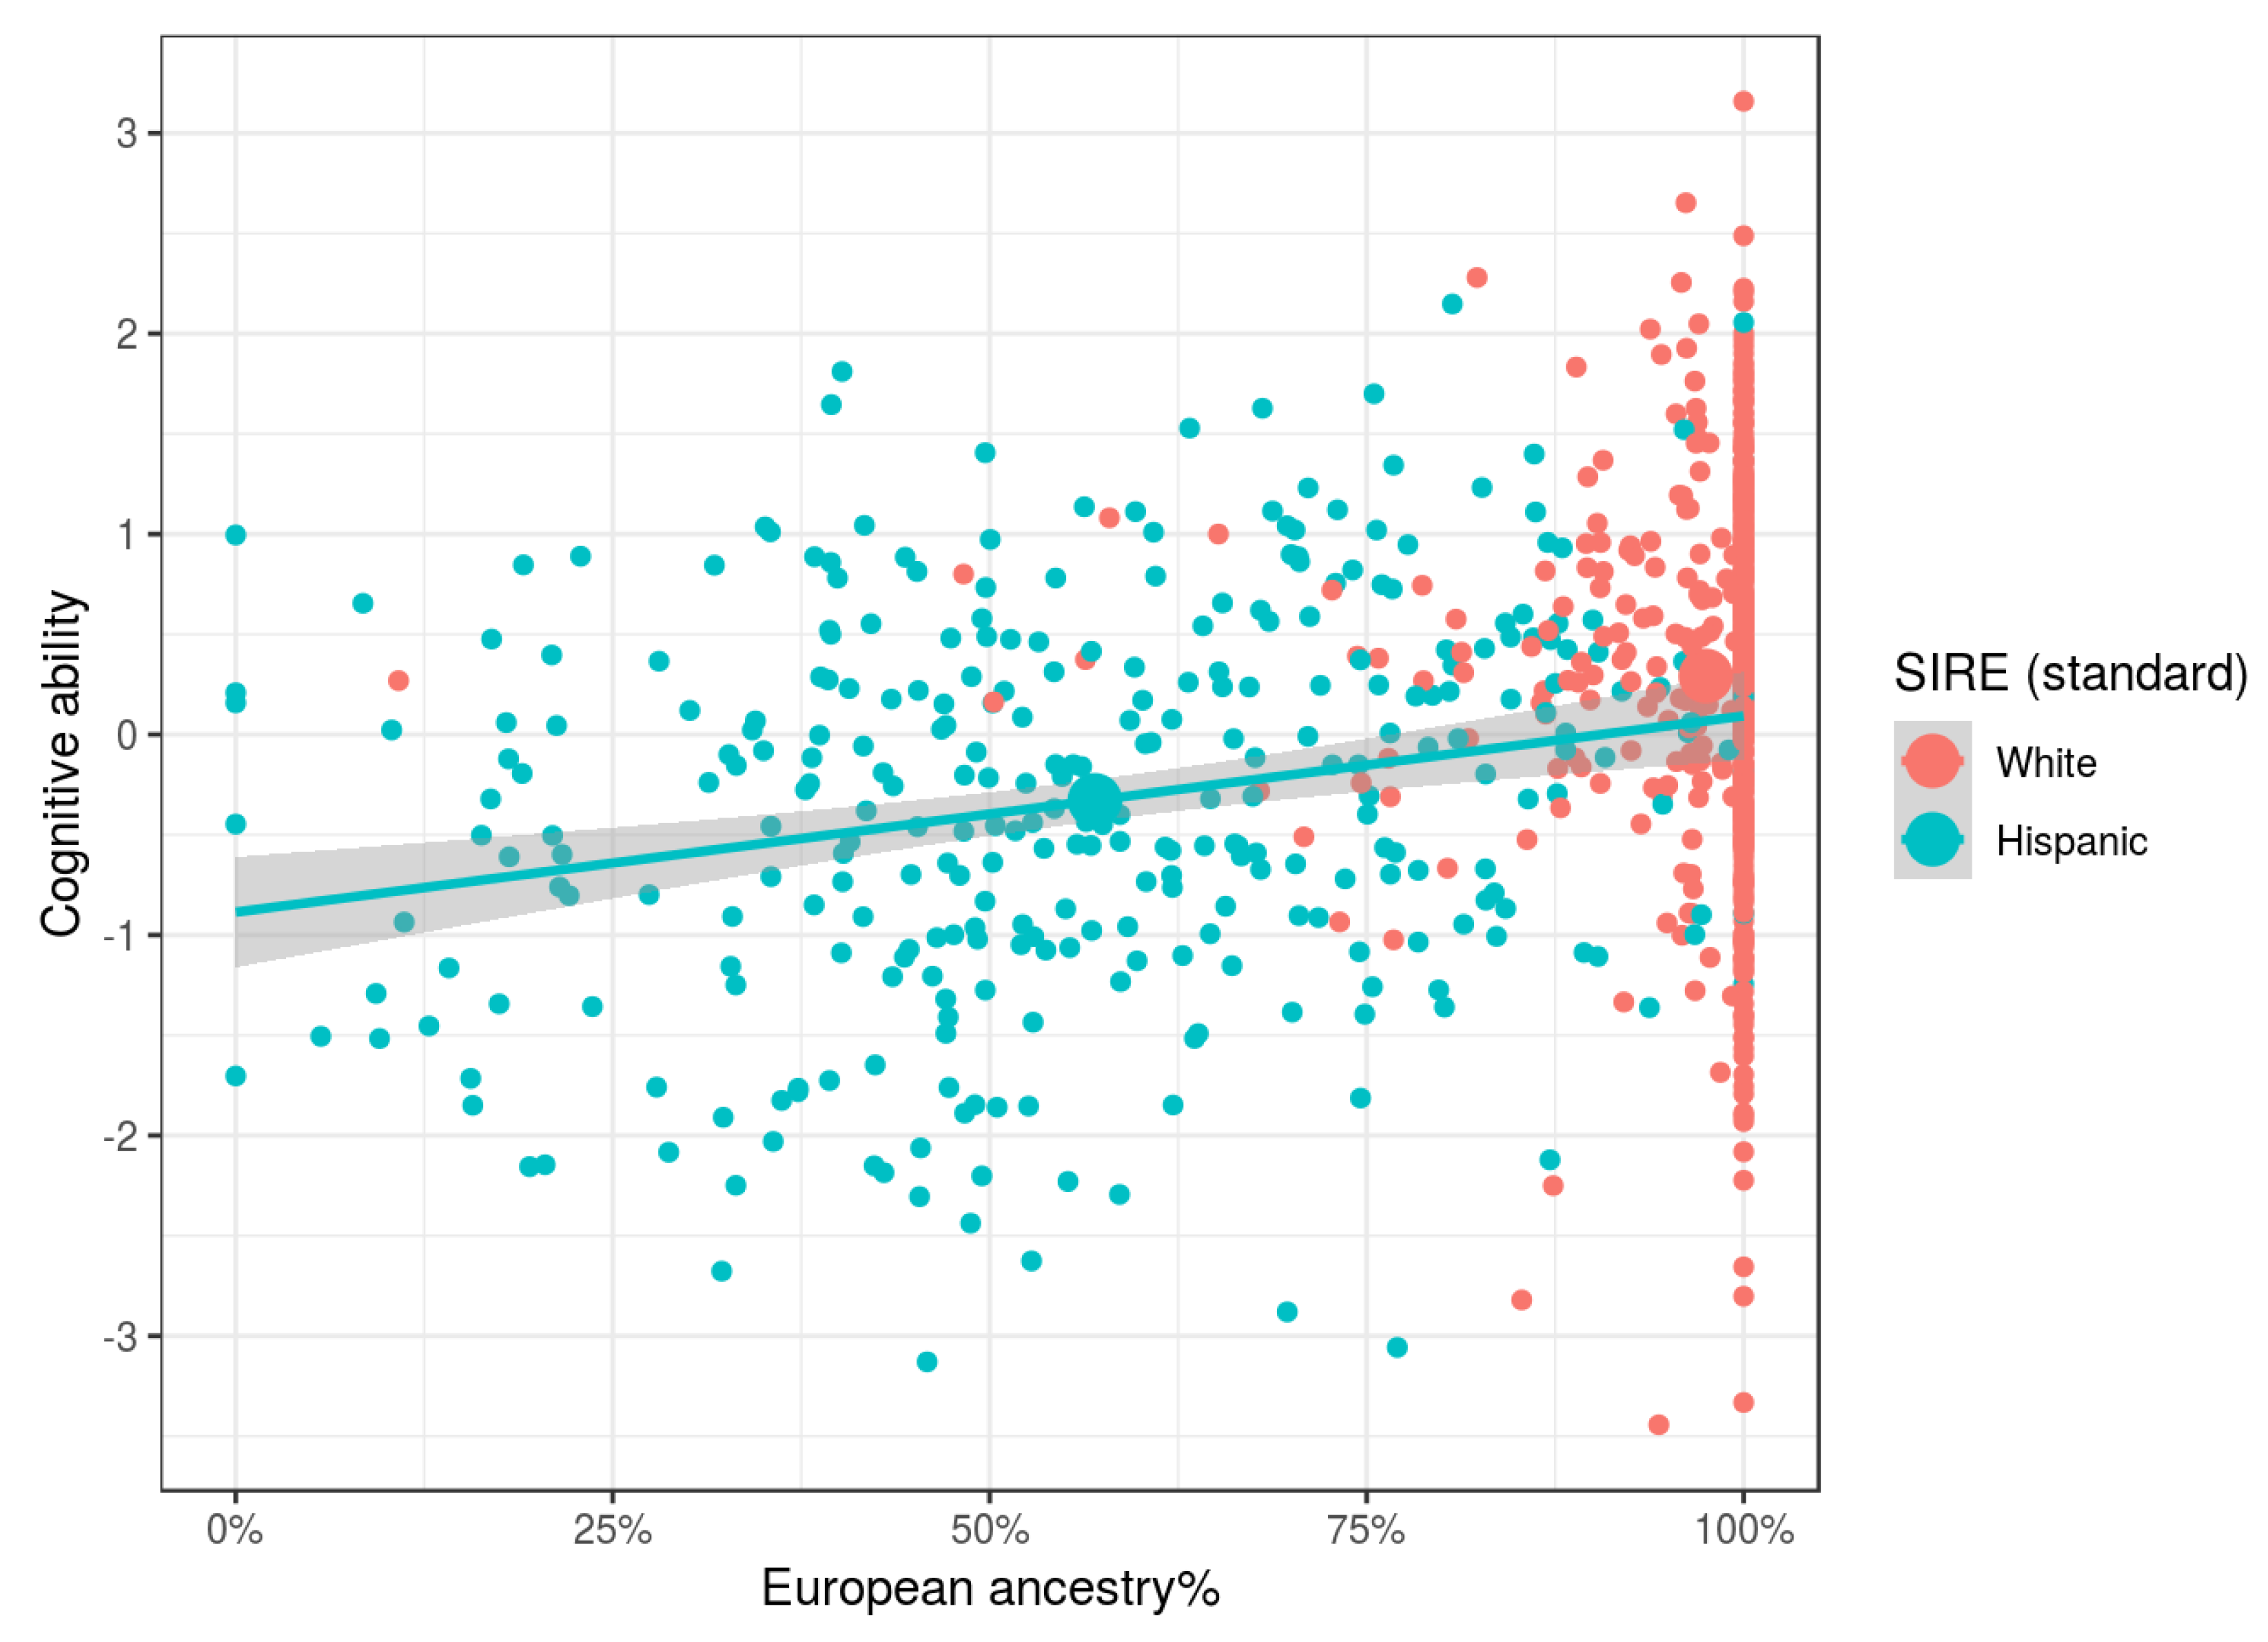
Our results show that independent of SIRE, African, Oceanian, and Amerindian ancestries, relative to Eurasian ones, were associated with lower cognitive ability and parental SES. Relative to European ancestry, there were no clear associations for East Asian ancestry. East Asians in the US are a heterogeneous group, comprised of both South East Asians (e.g., Filipinos and Vietnamese) and North East Asians (e.g., Chinese, Japanese, and Koreans). Since at the national level these groups have different cognitive ability levels [7], it is difficult to interpret these particular results in light of any global theory of cognitive differences.
Genetic ancestry was found to be related to both cognitive ability and parental socioeconomic status independent of SIRE, as predicted by evolutionary theory. These findings strongly disconfirm claims made by various researchers that there are no statistical relationships between genomic ancestry and cognitive ability when controlling for socially identified racial groups [9,53,54,75]. Although these findings are congruent with predictions from evolutionary-genetic models, it should be kept in mind that genomic ancestry may also be associated with a number of non-genetic variables that run in families for environmental reasons, some of which may be causal. As such, the apparent validity of genetic ancestry could be due to confounding with these non-genetic variables, or could reflect ancestry-induced social processes. Still, it is worth noting that our results are especially striking in light of the stronger effect of environmental influences on younger compared to older persons’ cognitive ability [76]. Given this fact, it would be reasonable to expect that at least some environmental factors related to SIRE have their largest potential effects on cognitive ability among young individuals. Yet, in our sample of children, genetic ancestry explained a very great deal of inter-BGA cognitive ability variation, net of SIRE, potentially indicating that environmental effects in general have a limited role in intra-national cognitive ability differences between BGAs.
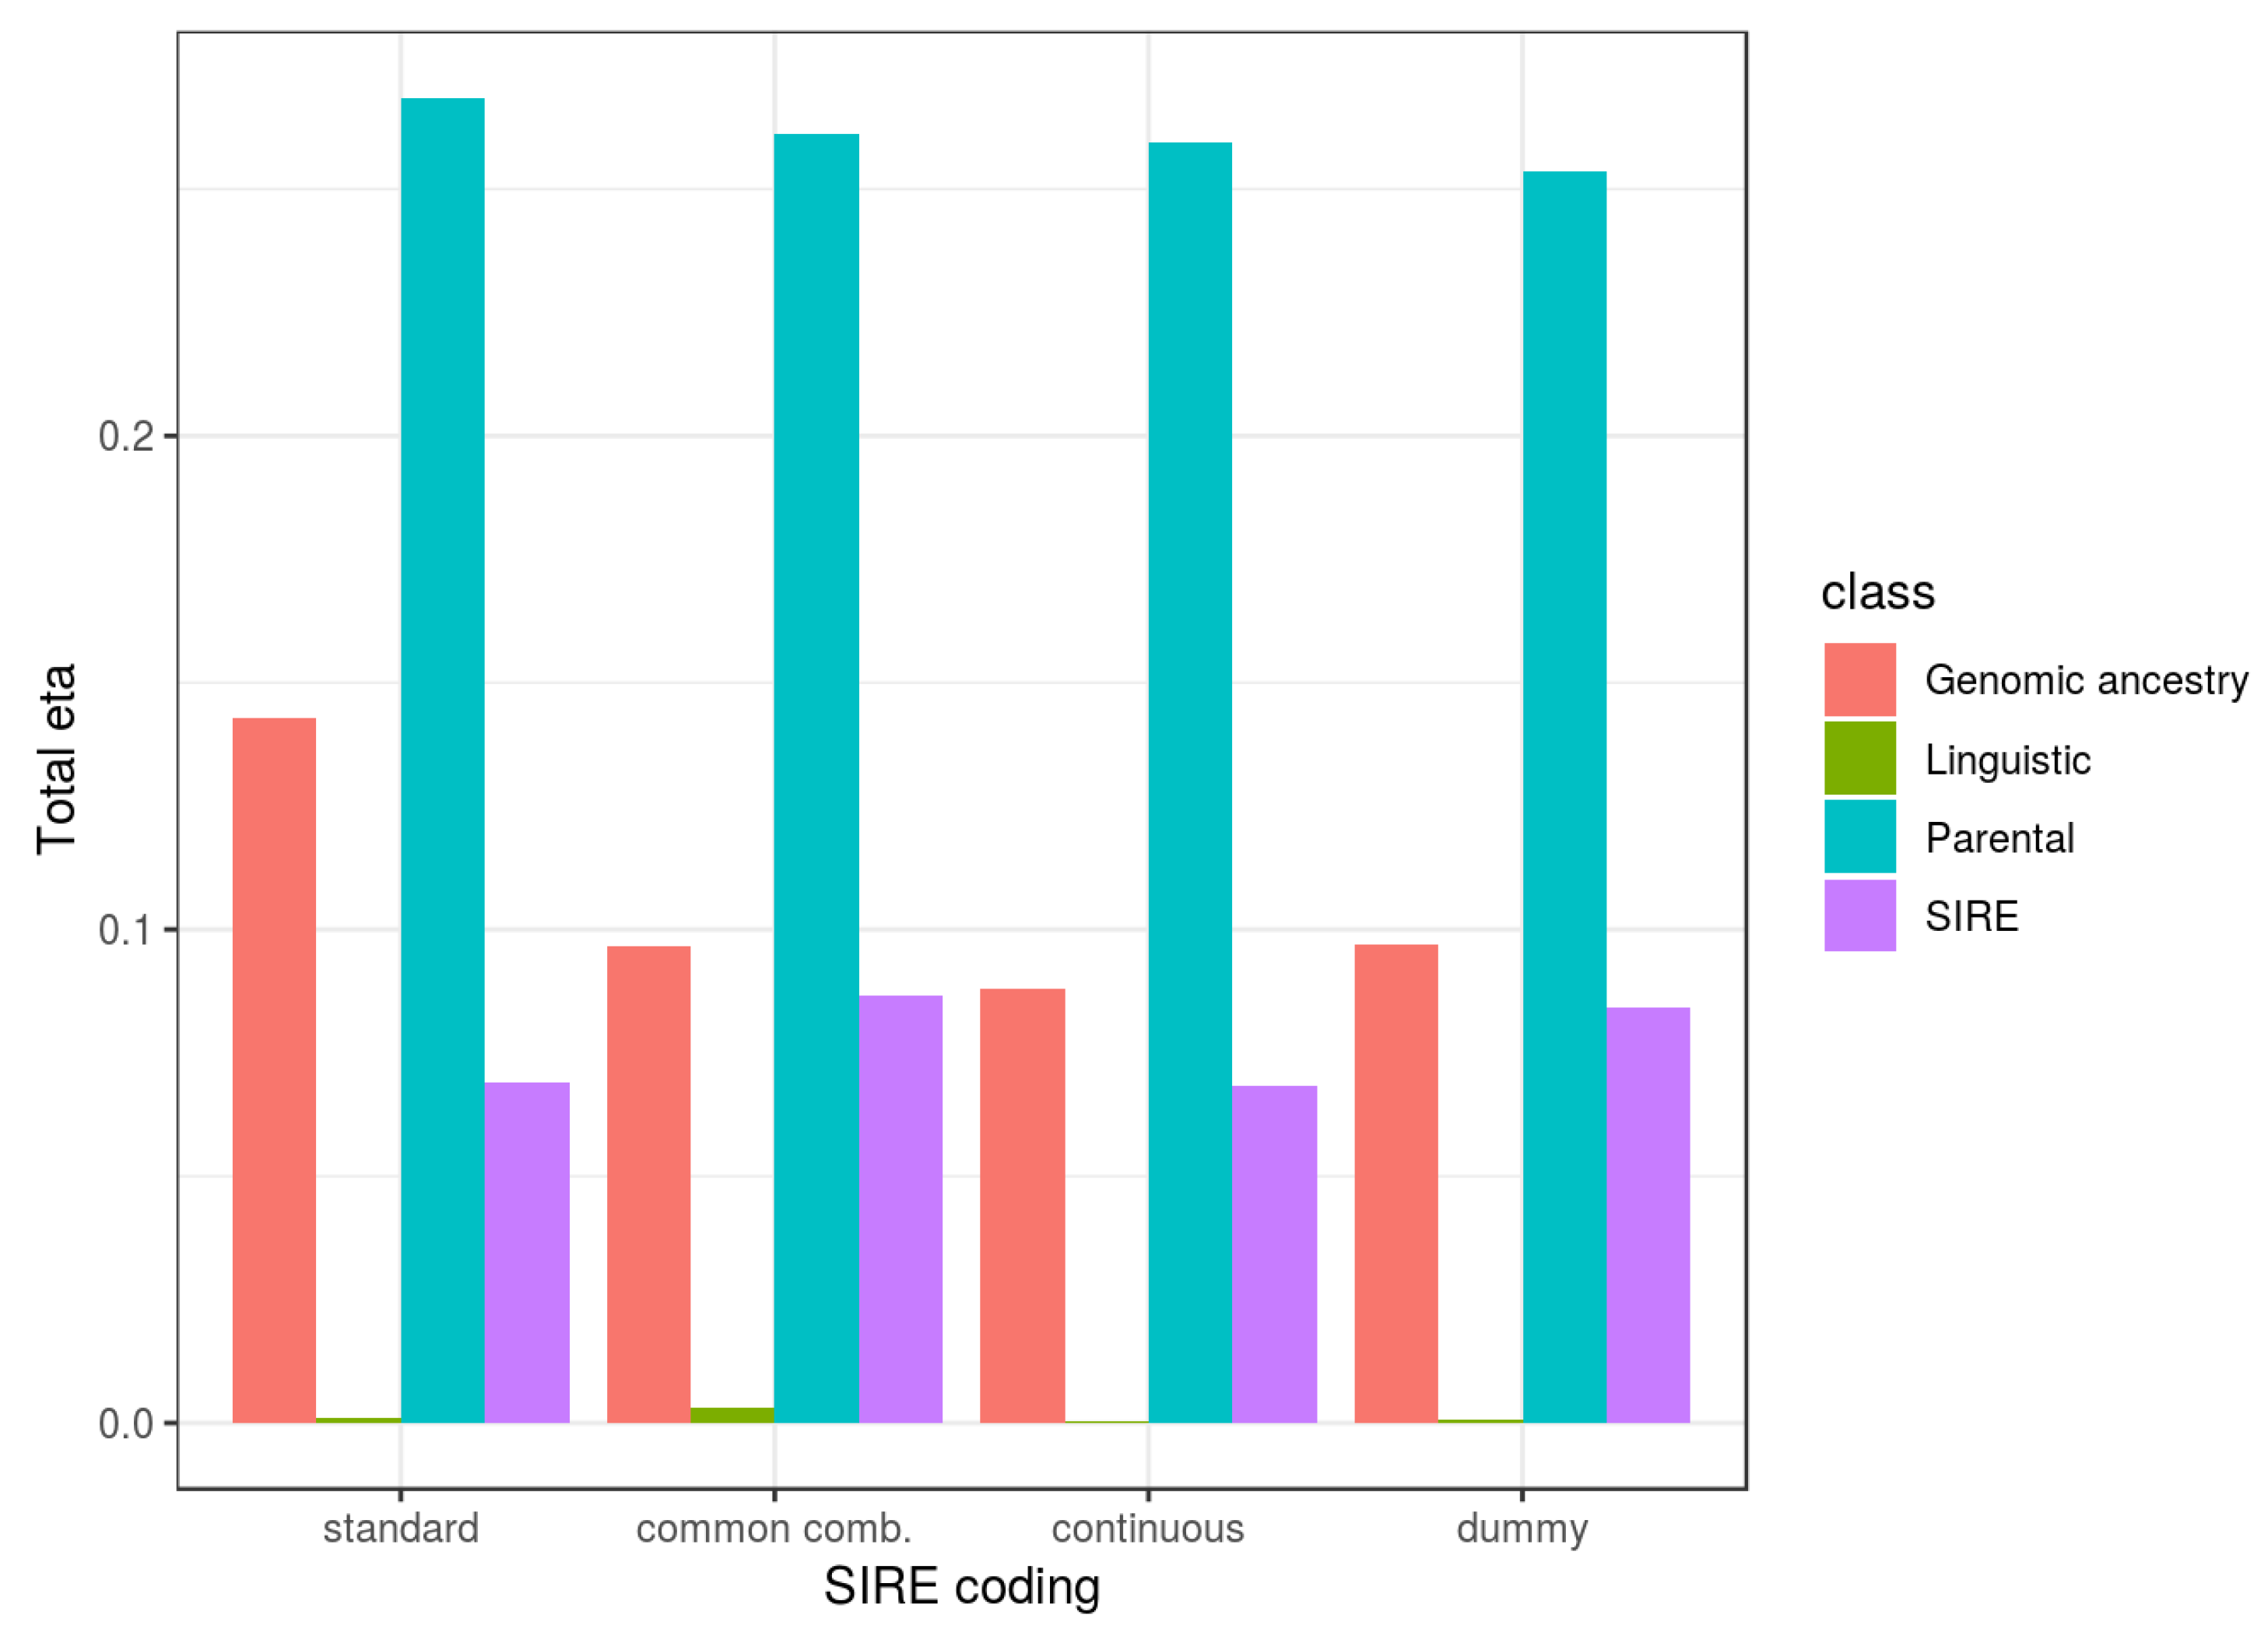
One set of the analyses included parental SES as a predictor of children’s cognitive ability, and it was found to be a useful predictor. Inclusion of this in the models reduced the validity of ancestry predictors by 36–48% (cf. Section 4.2). As discussed above, a reduction in the effect size is expected on both genetic and non-genetic models. This is because in genetic models, controlling for parental SES indirectly controls for parental cognitive ability, parental genetic influences on cognitive ability, and ultimately children’s genetic influences on cognitive ability, and thus the association between genomic ancestry and the relevant genetic factors is weakened.
Overall, genetic ancestry was a better predictor of outcomes than was SIRE membership. As the US population becomes more ancestrally heterogeneous (owing to admixture), and SIRE and genetic ancestry become less related, genetic ancestry may turn out to be an even better tool for studying race-related social differences. Research suggests this may be the case for very-admixed countries such as Brazil (e.g., [77]).

5.1. Non-Evolutionary Explanations

While the results we found are consistent with an evolutionary model, there are some potential alternative explanations, namely: phenotypic discrimination, confounding due to immigration status, confounding due to geographic location, and intergenerational environmental transmission.
Some have posited discrimination based on stereotypical race-phenotype, called colorism [78]. It has been argued that such discrimination could account for covariances between BGA, cognitive ability, and SES (e.g., [79]). Unfortunately, this dataset does not have appearance data (e.g., skin color), so we could not test whether the associations found are statistically mediated by phenotypic differences. With regard to this sample specifically, we find it unlikely that colorism could directly lead to the association between ancestry and cognitive ability given the ages of the participants. This is because most colorism models propose market-based discrimination (e.g., [80]). A theoretical possibility is that such discrimination induces associations between parental SES and BGA and that parental SES differences influence offspring cognitive ability. However, some of our associations were only partially reduced in strength when controlling for parental SES, downgrading the likelihood of this scenario.
More generally, it is not clear that colorism is actually a potent force, at least in the USA. Consider research based on sibling designs, which can distinguish between discriminatory and intergenerational effects. A number of studies in the economics literature have utilized sibling control designs in this fashion [81,82,83,84,85,86]. Unfortunately, they differ somewhat in design (e.g., raw vs. SES-controlled results for between-family regressions), and do not report standardized effect measures, so we were unable to quantitatively meta-analyze them. However, generally speaking, when family characteristics are controlled for, residual associations between racial appearance and social outcomes are small. In the words of one researcher who studied a large dataset from Brazil: “[T]he estimated coefficients are small in magnitude, implying that individual discrimination is not the primary determinant of interracial disparities. Instead, racial differences are largely explained by the family and community that one is born into” [81]. Mill and Stein [83] make statements to the same effect based on an analysis of a large dataset from the USA.
Another possibility is confounding due to immigration status. Some SIRE groups in our study (specifically East Asians and Hispanics) contain substantial numbers of new immigrants. For these, possible interactions between generational status and admixture complicate interpretations of associations between BGA and social outcomes. For example, the US Hispanic population is comprised of ongoing waves of migrants primarily from Central America and the Caribbean. Since there is an association between immigrants’ generational status and social outcomes (see [87]), if there is likewise an association between ancestry and generation status, this could lead to biases in parameter estimates. It is difficult to untangle these effects without detailed information about migrant status and specific population histories. That said, Kirkegaard et al. [56] showed that associations between SES and ancestry can be found across the Americas. It seems unlikely that Amerindian ancestry would be related to SES among native Mexicans, and that African ancestry would be related to SES among native Puerto Ricans, but that in the USA the associations within Latin-American-origin populations would only be due to migrant status confounding. And it also seems unlikely that the cause of the association between ancestry and cognitive ability would be radically different from the cause of the association between ancestry and SES. Furthermore, migrant status confounding cannot non-negligibly factor into associations with African ancestry found in our sample, indicating that non-genetic environmental explanations that rely on migrant status confounding would not be parsimonious.
Regarding geography, we were unable to directly control for the specific locations of the participants. However, when we ran the analyses adding controls for MRI scanner location, as a proxy for geographic location, there was no substantive effect. Overall, the three explanations just discussed seem unlikely to account for our findings. However, the potential confounds that they invoke warrant investigation in future research.

5.2. Related Research

While few studies have looked at the association between genetic ancestry and cognitive outcomes, a large number of older ones have examined the relationship between genealogical and phenotypic indexes of ancestry and cognitive performance. Summarizing research on the relationship between indexes of Amerindian ancestry and outcomes, Berry [88] notes:
Nevertheless, many other researchers have explored the relationship between academic achievement and certain indices of assimilation and have reached the same conclusion. Coombs (123:6) reports: “Amazingly consistent relationship between the degree of Indian blood and the pre-school language on the one hand and level of achievement on the other. These two characteristics are the best indices of the degree of acculturation.
Atkinson (22) tested students at Union High School, Roosevelt, Utah, and found whites superior, mixed-bloods second, and full-bloods third—a fact frequently encountered in the literature. As many writers have pointed out … such terms as full-blood and mixed-blood refer to social rather than biological groups.
Berry [88] and many of the researchers he cites interpret the apparent outcome-by-admixture associations as owing to cultural factors; notably, they also interpret the purported ancestry divisions as being delineated culturally, not genetically. Their view suggests that the factors relevant to performance differences can readily diffuse horizontally across cultural groups. Our results do not exclude this possibility but suggest that the relevant factors are being vertically transmitted along genealogical lines – the most plausible candidate being genes.
Loehlin, Lindzey, and Spuhler [50] summarized research on the relationship between phenotypic indexes of African ancestry and outcomes:
The majority of the studies with persons of mixed African-European ancestry found that groups of subjects judged to be of more African ancestry were on the average slightly inferior on the tests of intellectual functioning employed.
Because of the probability of complex and differential environmental response to physical differences and the likelihood of assortative mating complicating the genetic picture, in addition to the questionable reliability of the racial measures themselves, it is easy to decide that these findings lend themselves to no firm conclusions. One might go beyond this generalization and suggest that the observed findings provide little solace for extremes of either environmentalism or genetical determinism.
Our research design addresses many of the problems noted by Loehlin et al. [50]. First, we use a multilocus index of genetic ancestry, so cross-assortative mating for specific phenotypic characters (such as skin color) and cognitive ability is not a possible confound. Next, our index of ancestry is highly reliable, unlike the blood group studies that Loehlin et al. [50] discuss. Moreover, we show in our supplementary simulation that, owing to range restriction in ancestry, the typically small correlations are consistent with large between-group differences. Since there is disagreement about the interpretation of these pre-genomic studies, a systematic meta-analysis is warranted to confirm that indexes of ancestry are generally correlated with cognitive ability.
A number of studies have addressed the issue of the association between genetic ancestry and cognitive ability in more indirect ways (e.g., [8]). A popular approach involves testing Spearman’s hypothesis, which posits that the magnitude of measured cognitive ability gaps between BGAs is a function of the g loadings of the test instruments (studies generally support Spearman’s hypothesis; see [89,90,91]). The extent to which g moderates the magnitude of inter-BGA cognitive ability gaps may be relevant insofar as the g loadings of tests potentially correlate perfectly with their heritabilities [92]. Nonetheless, some argue that the truth of Spearman’s hypothesis does not exclude the possibility that inter-BGA cognitive ability gaps have non-genetic environmental origins (e.g., [93]). Future admixture analyses could resolve this debate over the implications of the truth of Spearman’s hypothesis. For example, if the present model were run for separate subtests, the resultant vector of model beta values could be correlated with the vector of subtest g loadings to determine whether more g-loaded subtests involve more strongly genetic inter-BGA ability gaps.

5.3. Evolutionary-Genetic Explanations versus Familial Environmental Models

In the context of admixture analyses of morphological and health-related traits, it is generally accepted (e.g., in genetic epidemiology) that the finding of a correlation between outcomes and genetic ancestry constitutes support for evolutionary-genetic models of inter-BGA differences, especially if potential environmental confounds are statistically controlled (see Introduction). Logically the same inference should apply to behavioral traits and also to outcomes under partial genetic influence, such as educational attainment. (Others make the same point: Nisbett [53] suggests that a relation between ancestry and IQ within SIRE groups would constitute “direct evidence” supporting hereditarian models of inter-BGA cognitive differences.) But many researchers are inconsistent in their treatment of these outcomes (see, e.g., [77]), falling for the so-called sociologist’s fallacy [94,95]. (Specifically, the sociologist’s fallacy refers to the hasty inference—made without considering the possible role of genetic factors—that a correlation between a social variable (such as SES) and a phenotype (such as cognitive ability) implies that the social variable is causal with respect to the phenotype.)
Support for evolutionary-genetic models provided by global admixture analysis is indirect because there are possible confounds, as discussed above. It is also possible that non-genetic familial models (as noted) make the same predictions. Evolutionary-genetic models, though, can be directly tested using admixture mapping [46], which in genetic epidemiology is usually the next step taken after consistent findings of an association between outcomes and global genetic ancestry.
The idea behind the method is fairly simple: though we may not know exactly where the causal variants are on the genome, we know roughly where they are located (i.e., in which genes), and they can plausibly be assumed to be the same loci across populations [39]. This means that if we take cases and controls (or high/low trait groups) from a given admixed population where one ancestry (A) has a higher polygenic score for a trait (e.g., higher disease risk), the cases will have an overall higher proportion of that A ancestry than the controls. However, this increase in ancestry will not be randomly distributed along the genome but will be concentrated in regions around the causal variants. Thus, the test for evolutionary-genetic models is whether such local ancestry enrichment can be found for variants identified via GWASs for cognitive ability. As cognitive ability is strongly polygenic, this test will likely require a large sample size. This method can also be used to test racial-phenotypic discrimination models, as these models predict that associations between genetic ancestry and both behavioral and social outcomes will be more pronounced on regions of the genome related to visible phenotypes. Such analyses have been conducted in relation to assortative mating [96].
Following methods in genetic epidemiology, we began with a preliminary global BGA analysis, and have shown that non-White (except East Asian) ancestry in the United States is correlated with lower cognitive ability and parental SES. Before drawing conclusions, however, it is important to replicate these results. A single dataset or study cannot settle a debate [97], owing to potentially unidentified confounds. However, if our results can be replicated, admixture mapping, which can discriminate between phenotypic discrimination, environmental familial, and evolutionary-genetic models, is the next warranted step.

5.4. Implications for Research on Differences

Insofar as there is interest in ameliorating ethnic and racial differences in important behavioral and social outcomes, it is important to understand their causation. Results in this paper are largely in agreement with a familial model of differences in the Americas. These results suggest that outcome differences are being passed on along family lines, and that they are not due to common ethno-cultural factors. This is consistent with an evolutionary-genetic model, but environmental familial models cannot be ruled out at this stage.
These results clearly indicate that using standard categorical SIRE classifications fails to capture the full extent of BGA-associated disadvantages. As for other general models of American race/ethnic differences, contra [98], these results suggest the possibility of non-trivial omitted variable bias in discrimination-based models. Proponents of such models should try to show that their associations are independent of genetic ancestry. It is not clear that this is generally the case. (For example, see the 1982 Pelotas-birth cohort results reported in Supplementary File 2 of [56], which show no consistent association between interviewer-reported color and social outcomes after genetic ancestry is statistically controlled.) Proponents of cultural identification models are also encouraged to take genetic ancestry into account.

Supplementary Materials

An online supplementary file for this paper is available through Open Science Framework: https://osf.io/tvb5n/.

Author Contributions

E.O.W.K. and J.F.: Conceptualization; Methodology; Formal Analysis; Writing – Original Draft Preparation; Writing – Review & Editing; Project Administration; Data Curation. G.M.: Obtained Data Access; Writing – Review & Editing. M.A.W.o.M., & R.L.W. – Original Draft Preparation; Writing – Review and Editing.

Funding

This research received no external funding.

Acknowledgments

The Pediatric Imaging, Neurocognition, and Genetics (PING) database (http://pingstudy.ucsd.edu) provided the data used in this study. Data collection and sharing were funded by NIH (National Institutes of Health) (grant RC2DA029475). PING data were provided by the PING Coordinating Center at the Center for Human Development, University of California, San Diego. PING is funded by the National Institute on Drug Abuse and the Eunice Kennedy Shriver National Institute of Child Health and Human Development. The manuscript “Biogeographic ancestry, cognitive ability, and socioeconomic outcomes” was approved by the PING consortium in the spring of 2017. Since then, the consortium head informed us that the PING dataset is no longer under PING consortium supervision and that the PING consortium no longer has the authority to review papers; he further noted that it is no longer necessary to list the PING as a co-author (6 September 2018). As such they are not listed. We contacted NIMH (National Institute of Mental Health), who now supervises the data, and they notified us that since we did not download the data through NIMH we were not bound by the NIMH user agreement nor did we need NIMH approval (7 September 2018). We notified them that we were planning on submitting the paper as approved by the PING consortium (14 September 2018), a notification they acknowledged (2 October 2018).

Conflicts of Interest

The authors declare no conflict of interest.

References

  1. Shriver, M.D.; Kittles, R.A. Genetic ancestry and the search for personalized genetic histories. Nat. Rev. Genet. 2004, 5, 611. [Google Scholar] [CrossRef] [PubMed]
  2. Fuerst, J. Lineage Population: A Concept Needed by an Observer of Nature? Mank. Q. 2017, 57, 590–631. [Google Scholar]
  3. Woodley, M.A. Is Homo sapiens polytypic? Human taxonomic diversity and its implications. Med. Hypotheses 2010, 74, 195–201. [Google Scholar] [CrossRef] [PubMed]
  4. Christainsen, G.B. IQ and the wealth of nations: How much reverse causality? Intelligence 2013, 41, 688–698. [Google Scholar] [CrossRef]
  5. Fuerst, J.; Kirkegaard, E.O.W. Admixture in the Americas: Regional and national differences. Mank. Q. 2016, 56, 255–373. [Google Scholar]
  6. Fuerst, J.; Kirkegaard, E.O.W. The Genealogy of Differences in the Americas. Mank. Q. 2016, 56, 425–481. [Google Scholar]
  7. Lynn, R. Race Differences in Intelligence (Revised Edition); Washington Summit Publishers: Whitefish, MT, USA, 2015. [Google Scholar]
  8. Rushton, J.P.; Jensen, A.R. Thirty years of research on race differences in cognitive ability. Psychol. Public Policy Law 2005, 11, 235–294. [Google Scholar] [CrossRef]
  9. Nisbett, R.E.; Aronson, J.; Blair, C.; Dickens, W.; Flynn, J.; Halpern, D.F.; Turkheimer, E. Group differences in IQ are best understood as environmental in origin. Am. Psychol. 2012, 67, 503–504. [Google Scholar] [CrossRef]
  10. Cottrell, J.M.; Newman, D.A.; Roisman, G.I. Explaining the Black-White gap in cognitive test scores: Toward a theory of adverse impact. J. Appl. Psychol. 2015, 100, 1713–1736. [Google Scholar] [CrossRef]
  11. Rindermann, H.; Becker, D.; Coyle, T. Survey of Expert Opinion on Intelligence: Causes of International Differences in Cognitive Ability Tests. Educ. Psychol. 2016, 7, 399. [Google Scholar] [CrossRef]
  12. Rindermann, H.; Coyle, T.; Becker, D. 2013 survey of expert opinion on intelligence. Presented at the 14th Annual Meeting of the International Society for Intelligence Research, Melbourne, Australia, December 2013. [Google Scholar]
  13. Snyderman, M.; Rothman, S. The IQ Controversy, the Media and Public Policy; Transaction Publishers: Piscataway, NJ, USA, 1988. [Google Scholar]
  14. Cochran, G.; Harpending, H. The 10,000 Year Explosion: How Civilization Accelerated Human Evolution; Basic Books: New York, NY, USA, 2009. [Google Scholar]
  15. Kanazawa, S. The Intelligence Paradox: Why the Intelligent Choice Isn’t Always the Smart One; John Wiley: Hoboken, NJ, USA, 2012. [Google Scholar]
  16. Wallace, A.R. The Origin of Human Races and the Antiquity of Man Deduced from the Theory of “Natural Selection”. J. Anthropol. Soc. Lond. 1864, 2, clviii–clxxxvii. [Google Scholar] [CrossRef]
  17. Grall, L. Ice Age Climate, Somatic Capital, and the Timing of the Neolithic Transition (No. 44-2016). In MAGKS Joint Discussion Paper Series in Economics; Universität Marburg: Marburg, Hesse, Germany, 2016. [Google Scholar]
  18. Sayol, F.; Maspons, J.; Lapiedra, O.; Iwaniuk, A.N.; Székely, T.; Sol, D. Environmental variation and the evolution of large brains in birds. Nat. Commun. 2016, 7, 13971. [Google Scholar] [CrossRef] [PubMed]
  19. Sol, D.; Garcia, N.; Iwaniuk, A.; Davis, K.; Meade, A.; Boyle, W.A.; Székely, T. Evolutionary Divergence in Brain Size between Migratory and Resident Birds. PLoS ONE 2010, 1988, e9617. [Google Scholar] [CrossRef]
  20. Sol, D.; Lefebvre, L.; Rodríguez-Teijeiro, J.D. Brain size, innovative propensity and migratory behaviour in temperate Palaearctic birds. Proc. R. Soc. Lond. B Biol. Sci. 2005, 272, 1433–1441. [Google Scholar] [CrossRef] [PubMed]
  21. Sol, D.; Székely, T.; Liker, A.; Lefebvre, L. Big-brained birds survive better in nature. Proc. R. Soc. Lond. B Biol. Sci. 2007, 274, 763–769. [Google Scholar] [CrossRef] [PubMed]
  22. Roth, T.C.; Pravosudov, V.V. Hippocampal volumes and neuron numbers increase along a gradient of environmental harshness: A large-scale comparison. Proc. R. Soc. B Biol. Sci. 2009, 276, 401–405. [Google Scholar] [CrossRef]
  23. Rindermann, H.; Woodley, M.A.; Stratford, J. Haplogroups as evolutionary markers of cognitive ability. Intelligence 2012, 40, 362–375. [Google Scholar] [CrossRef]
  24. Clark, G. A Farewell to Alms: A Brief Economic History of the World; Princeton University Press: Princeton, NJ, USA, 2007. [Google Scholar]
  25. Clark, G. The Son also Rises: Surnames and the History of Social Mobility; Princeton University Press: Princeton, NJ, USA, 2014. [Google Scholar]
  26. Woodley of Menie, M.A.; Figueredo, A.J.; Sarraf, M.A.; Hertler, S.; Fernandes, H.B.F.; Peñaherrera-Aguirre, M. The Rhythm of the West: A Biohistory of the Modern Era AD 1600 to the Present. Journal of Social Political and Economic Studies, Monograph Series No. 37; Scott Townsend Press: Washington, DC, USA, 2017. [Google Scholar]
  27. Fedderke, J.W.; Klitgaard, R.E.; MacMurray, J.P.; Napolioni, V. Diagnosing Deep Roots of Development: Genetic, Disease and Environmental Factors; Economic Research Southern Africa: Cape Town, South Africa, 2014. [Google Scholar]
  28. Eppig, C.; Fincher, C.L.; Thornhill, R. Parasite prevalence and the worldwide distribution of cognitive ability. Proc. R. Soc. 2010, 277, 3801–3808. [Google Scholar] [CrossRef]
  29. Mathieson, I.; Lazaridis, I.; Rohland, N.; Mallick, S.; Patterson, N.; Roodenberg, S.A.; Reich, D. Genome-wide patterns of selection in 230 ancient Eurasians. Nature 2015, 528, 499–503. [Google Scholar] [CrossRef]
  30. Woodley of Menie, M.A.; Younuskunju, S.; Balan, B.; Piffer, D. Holocene selection for variants associated with general cognitive ability: Comparing ancient and modern genomes. Twin Res. Hum. Genet. 2017, 20, 271–280. [Google Scholar] [CrossRef]
  31. Turchin, M.C.; Chiang, C.W.; Palmer, C.D.; Sankararaman, S.; Reich, D. Genetic Investigation of ANthropometric Traits (GIANT) Consortium; Hirschhorn, J.N. Evidence of widespread selection on standing variation in Europe at height-associated SNPs. Nat. Genet. 2012, 44, 1015–1019. [Google Scholar] [CrossRef] [PubMed]
  32. Robinson, M.R.; Hemani, G.; Medina-Gomez, C.; Mezzavilla, M.; Esko, T.; Shakhbazov, K.; Visscher, P.M. Population genetic differentiation of height and body mass index across Europe. Nat. Genet. 2015, 47, 1357–1362. [Google Scholar] [CrossRef] [PubMed]
  33. Piffer, D. A review of intelligence GWAS hits: Their relationship to country IQ and the issue of spatial autocorrelation. Intelligence 2015, 53, 43–50. [Google Scholar] [CrossRef]
  34. Piffer, D. Factor analysis of population allele frequencies as a simple, novel method of detecting signals of recent polygenic selection: The example of educational attainment and IQ. Mank. Q. 2013, 54, 168–200. [Google Scholar]
  35. Racimo, F.; Berg, J.J.; Pickrell, J.K. Detecting polygenic adaptation in admixture graphs. Genetics 2018, 208, 1565–1584. [Google Scholar] [CrossRef] [PubMed]
  36. Guo, J.; Wu, Y.; Zhu, Z.; Zheng, Z.; Trzaskowski, M.; Zeng, J.; Yang, J. Global genetic differentiation of complex traits shaped by natural selection in humans. Nat. Commun. 2018, 9, 1865. [Google Scholar] [CrossRef] [PubMed]
  37. Ntzani, E.E.; Liberopoulos, G.; Manolio, T.A.; Ioannidis, J.P. Consistency of genome-wide associations across major ancestral groups. Hum. Genet. 2012, 131, 1057–1071. [Google Scholar] [CrossRef] [PubMed]
  38. Marigorta, U.M.; Navarro, A. High Trans-ethnic Replicability of GWAS Results Implies Common Causal Variants. PLoS Genet. 2013. [Google Scholar] [CrossRef]
  39. Zanetti, D.; Weale, M.E. True causal effect size heterogeneity is not required to explain trans-ethnic differences in GWAS signals. BioRxiv 2016, 085092. [Google Scholar] [CrossRef]
  40. Giri, A.; Edwards, T.L.; Hartmann, K.E.; Torstenson, E.S.; Wellons, M.; Schreiner, P.J.; Edwards, D.R.V. African genetic ancestry interacts with body mass index to modify risk for uterine fibroids. PLOS Genet. 2017, 13, e1006871. [Google Scholar] [CrossRef] [PubMed]
  41. Bidulescu, A.; Choudhry, S.; Musani, S.K.; Buxbaum, S.G.; Liu, J.; Rotimi, C.N.; Gibbons, G.H. Associations of adiponectin with individual European ancestry in African Americans: The Jackson Heart Study. Front. Genet. 2014, 5. [Google Scholar] [CrossRef] [PubMed]
  42. Meigs, J.B.; Grant, R.W.; Piccolo, R.; López, L.; Florez, J.C.; Porneala, B.; McKinlay, J.B. Association of African genetic ancestry with fasting glucose and HbA1c levels in non-diabetic individuals: The Boston Area Community Health (BACH) Prediabetes Study. Diabetologia 2014, 57, 1850–1858. [Google Scholar] [CrossRef] [PubMed]
  43. Shriner, D. Overview of Admixture Mapping. Curr. Protoc. Hum. Genet. 2013, 76, 1–23. [Google Scholar] [CrossRef] [PubMed]
  44. Winkler, C.A.; Nelson, G.W.; Smith, M.W. Admixture mapping comes of age. Annu. Rev. Genom. Hum. Genet. 2010, 11, 65–89. [Google Scholar] [CrossRef] [PubMed]
  45. Templeton, A.R. The Genetic and Evolutionary Significance or Human Races. In Race and Intelligence: Separating Science from Myth; Fish, J.M., Ed.; Routledge: Abingdon, UK, 2001. [Google Scholar]
  46. González Burchard, E.; Borrell, L.N.; Choudhry, S.; Naqvi, M.; Tsai, H.J.; Rodriguez-Santana, J.R.; Arena, J.F. Latino populations: A unique opportunity for the study of race, genetics, and social environment in epidemiological research. Am. J. Public Health 2005, 95, 2161–2168. [Google Scholar] [CrossRef] [PubMed]
  47. Becker, N.S.; Verdu, P.; Froment, A.; Le Bomin, S.; Pagezy, H.; Bahuchet, S.; Heyer, E. Indirect evidence for the genetic determination of short stature in African Pygmies. Am. J. Phys. Anthropol. 2011, 145, 390–401. [Google Scholar] [CrossRef] [PubMed]
  48. Halder, I.; Matthews, K.A.; Buysse, D.J.; Strollo, P.J.; Causer, V.; Reis, S.E.; Hall, M.H. African genetic ancestry is associated with sleep depth in older African Americans. Sleep 2015, 38, 1185–1193. [Google Scholar] [CrossRef]
  49. Fan, C.C.; Bartsch, H.; Schork, A.J.; Chen, C.H.; Wang, Y.; Lo, M.T.; Jernigan, T.L. Modeling the 2015, 3D geometry of the cortical surface with genetic ancestry. Curr. Biol. 2015, 25, 1988–1992. [Google Scholar] [CrossRef]
  50. Loehlin, J.C.; Lindzey, G.; Spuhler, J.N. Race Differences in Intelligence; Freeman: San Francisco, CA, USA, 1975. [Google Scholar]
  51. Rodriguez-Arana, A. Intelligence and the Wealth of Nations: Genetics Matter but there is Still Much Room to Reduce Inequalities preliminary. In Proceedings of the Dynamics, Economic Growth, and International Trade, Moscow, Rusia, 6–7 September 2010. [Google Scholar]
  52. Becker, D.; Rindermann, H. The relationship between cross-national genetic distances and IQ-differences. Personal. Indiv. Differ. 2016, 98, 300–310. [Google Scholar] [CrossRef]
  53. Nisbett, R.E. Intelligence and How to Get It: Why Schools and Cultures Count; W.W. Norton & Co.: New York, NY, USA, 2009. [Google Scholar]
  54. Sternberg, R.J. There are no public-policy implications: A reply to Rushton and Jensen (2005). Psychol. Public Policy Law 2005, 11, 295–301. [Google Scholar] [CrossRef]
  55. Akshoomoff, N.; Newman, E.; Thompson, W.K.; McCabe, C.; Bloss, C.S.; Chang, L.; Jernigan, T.L. The NIH Toolbox Cognition Battery: Results from a Large Normative Developmental Sample (PING). Neuropsychology 2014, 28, 1–10. [Google Scholar] [CrossRef] [PubMed]
  56. Kirkegaard, E.O.W.; Wang, M.; Fuerst, J. Biogeographic Ancestry and Socioeconomic Outcomes in the Americas: A Meta-Analysis. Mank. Q. 2017, 57, 398–427. [Google Scholar]
  57. Sirin, S.R. Socioeconomic status and academic achievement: A meta-analytic review of research. Rev. Educ. Res. 2005, 75, 417–453. [Google Scholar] [CrossRef]
  58. Kirkegaard, E.O.W.; Fuerst, J. Admixture in Argentina. Mank. Q. 2017, 57, 542–580. [Google Scholar]
  59. Weintraub, S.; Dikmen, S.S.; Heaton, R.K.; Tulsky, D.S.; Zelazo, P.D.; Slotkin, J.; Havlik, R. The cognition battery of the NIH toolbox for assessment of neurological and behavioral function: Validation in an adult sample. J. Int. Neuropsychol. Soc. 2014, 20, 567–578. [Google Scholar] [CrossRef] [PubMed]
  60. Templ, M.; Alfons, A.; Kowarik, A.; Prantner, B. VIM: Visualization and Imputation of Missing Values. CRAN. Available online: http://cran.r-project.org/web/packages/VIM/index.html (accessed on 19 February 2015).
  61. Templ, M.; Kowarik, A.; Filzmoser, P. Iterative stepwise regression imputation using standard and robust methods. Comput. Stat. Data Anal. 2011, 55, 2793–2806. [Google Scholar] [CrossRef]
  62. James, G.; Witten, D.; Hastie, T.; Tibshirani, R. (Eds.) An Introduction to Statistical Learning: With Applications in R; Springer: New York, NY, USA, 2013. [Google Scholar]
  63. Jensen, A.R. The g Factor: The Science of Mental Ability; Praeger: Westport, CT, USA, 1998. [Google Scholar]
  64. Revelle, W. Psych: Procedures for Personality and Psychological Research; Northwestern University: Evanston, IL, USA, 2017. [Google Scholar]
  65. Murray, C. The magnitude and components of change in the black–white IQ difference from 1920 to 1991: A birth cohort analysis of the Woodcock–Johnson standardizations. Intelligence 2007, 35, 305–318. [Google Scholar] [CrossRef]
  66. Van der Linden, D.; Dunkel, C.S.; Madison, G. Sex differences in brain size and general intelligence (g). Intelligence 2017, 63, 78–88. [Google Scholar] [CrossRef]
  67. Kan, K.J. The Nature of Nurture: The Role of Gene-Environment Interplay in the Development of Intelligence; Universiteit van Amsterdam: Amsterdam, The Netherlands, 2012. [Google Scholar]
  68. Lorenzo-Seva, U.; Ten Berge, J.M. Tucker’s congruence coefficient as a meaningful index of factor similarity. Methodology 2006, 2, 57–64. [Google Scholar] [CrossRef]
  69. Liebler, C.A.; Halpern-Manners, A. A practical approach to using multiple-race response data: A bridging method for public-use microdata. Demography 2008, 45, 143–155. [Google Scholar] [CrossRef]
  70. Wicherts, J.M.; Veldkamp, C.L.S.; Augusteijn, H.E.M.; Bakker, M.; van Aert, R.C.M.; van Assen, M.A.L.M. Degrees of freedom in planning, running, analyzing, and reporting psychological studies: A checklist to avoid p-hacking. Front. Psychol. 2016, 7, 1832. [Google Scholar] [CrossRef] [PubMed]
  71. Bryc, K.; Durand, E.Y.; Macpherson, J.M.; Reich, D.; Mountain, J.L. The genetic ancestry of African Americans, Latinos, and European Americans across the United States. Am. J. Hum. Genet. 2015, 96, 37–53. [Google Scholar] [CrossRef] [PubMed]
  72. Duncan, B.; Trejo, S.J. Identifying the Later-Generation Descendants of US Immigrants: Issues Arising from Selective Ethnic Attrition. Ann. Am. Acad. Political Soc. Sci. 2018, 677, 131–138. [Google Scholar] [CrossRef]
  73. Harpending, H.; Cochran, G. Assortative mating, class, and caste. In The Evolution of Sexuality; Zeigler-Hill, V., Welling, L.L.M., Shackelford, T.K., Eds.; Springer: Cham, Switzerlands, 2015; pp. 57–67. [Google Scholar]
  74. Kong, A.; Thorleifsson, G.; Frigge, M.L.; Vilhjalmsson, B.J.; Young, A.I.; Thorgeirsson, T.E.; Gudbjartsson, D.F. The nature of nurture: Effects of parental genotypes. Science 2018, 359, 424–428. [Google Scholar] [CrossRef] [PubMed]
  75. Colman, A.M. Race differences in IQ: Hans Eysenck’s contribution to the debate in the light of subsequent research. Personal. Indiv. Differ. 2016, 103, 182–189. [Google Scholar] [CrossRef]
  76. Bouchard, T.J., Jr. Hereditary ability: g is driven by experience-producing drives. In The Nature of Human Intelligence; Sternberg, R.J., Ed.; Cambridge University Press: New York, NY, USA, 2018; pp. 15–29. [Google Scholar]
  77. Da Silva, T.M.; Fiaccone, R.L.; Kehdy, F.S.; Tarazona-Santos, E.; Rodrigues, L.C.; Costa, G.N.; Barreto, M.L. Biogeographical ancestry is associated with socioenvironmental conditions and infections in a Latin American urban population. SSM-Popul. Health 2018, 4, 301–306. [Google Scholar] [CrossRef] [PubMed]
  78. Telles, E.E. Pigmentocracies: Ethnicity, Race, and Color in Latin America, 1st ed.; University of North Carolina Press: Chapel Hill, NC, USA, 2014. [Google Scholar]
  79. Conley, D.; Fletcher, J. The Genome Factor: What the Social Genomics Revolution Reveals about Ourselves, Our History, and the Future; Princeton University Press: Princeton, NJ, USA, 2017. [Google Scholar]
  80. Marira, T.D.; Mitra, P. Colorism: Ubiquitous yet understudied. Ind. Organ. Psychol. 2013, 6, 103–107. [Google Scholar] [CrossRef]
  81. Francis-Tan, A. Light and shadows: An analysis of racial differences between siblings in Brazil. Soc. Sci. Res. 2016, 58, 254–265. [Google Scholar] [CrossRef]
  82. Kizer, J. Skin Color Stratification and the Family: Sibling Differences and the Consequences for Inequality. UC Irvine. 2017. Available online: https://escholarship.org/uc/item/29n4r264 (accessed on July 28 2018).
  83. Mill, R.; Stein, L.C.D. Race, skin color, and economic outcomes in early twentieth-century America. SSRN 2016. Available online: https://papers.ssrn.com/sol3/papers.cfm?abstract_id=2741797 (accessed on June 9 2018). [CrossRef]
  84. Marteleto, L.J.; Dondero, M. Racial inequality in education in Brazil: A twins fixed-effects approach. Demography 2016, 53, 1185–1205. [Google Scholar] [CrossRef]
  85. Rangel, M.A. Is Parental Love Colorblind? Human Capital Accumulation within Mixed Families. Rev. Black Polit. Econ. 2014, 42, 57–86. [Google Scholar] [CrossRef]
  86. Telles, E.E. Race in Another America: The Significance of Skin Color in Brazil; Princeton University Press: Princeton, NJ, USA, 2006. [Google Scholar]
  87. Rindermann, H.; Thompson, J. The cognitive competences of immigrant and native students across the world: An analysis of gaps, possible causes and impact. J. Biosoc. Sci. 2014, 48, 66–93. [Google Scholar] [CrossRef] [PubMed]
  88. Berry, B. The Education of the American Indians: A Survey of the Literature. US Department of Health, Education, & Welfare, Office of Education. 1968. Available online: https://files.eric.ed.gov/fulltext/ED026545.pdf (accessed on May 17 2018).
  89. Frisby, C.L.; Beaujean, A.A. Testing Spearman’s hypotheses using a bi-factor model with WAIS-IV/WMS-IV standardization data. Intelligence 2015, 51, 79–97. [Google Scholar] [CrossRef]
  90. Te Nijenhuis, J.; Van den Hoek, M. Spearman’s hypothesis tested on black adults: A meta-analysis. J. Intell. 2016, 4, 6. [Google Scholar] [CrossRef]
  91. Warne, R.T. Testing Spearman’s hypothesis with advanced placement examination data. Intelligence 2016, 57, 87–95. [Google Scholar] [CrossRef]
  92. Van Bloois, R.M.; Geutjes, L.L.; te Nijenhuis, J.; de Pater, I.E. g Loadings and Their True Score Correlations with Heritability Coefficients, Giftedness, and Mental Retardation: Three Psychometric Meta-Analyses. Paper presented at the 10th Annual Meeting of the International Society for Intelligence Research, Madrid, Spain, 25 December 2009. [Google Scholar]
  93. Flynn, J.R. IQ gains, WISC subtests, and fluid g: G theory and the relevance of Spearman’s hypothesis to race. In The Nature of Intelligence; Bock, G.R., Goode, J.A., Webb, K., Eds.; Wiley: New York, NY, USA, 2000; pp. 202–227. [Google Scholar]
  94. Sesardić, N. Making Sense of Heritability; Cambridge University Press: Cambridge, UK; New York, NY, USA, 2005. [Google Scholar]
  95. Flynn, J.R. How to Improve Your Mind: 20 Keys to Unlock the Modern World; Wiley-Blackwell: New York, NY, USA, 2012. [Google Scholar]
  96. Zou, J.Y.; Park, D.S.; Burchard, E.G.; Torgerson, D.G.; Pino-Yanes, M.; Song, Y.S.; Zaitlen, N. Genetic and socioeconomic study of mate choice in Latinos reveals novel assortment patterns. Proc. Natl. Acad. Sci. USA 2015, 112, 13621–13626. [Google Scholar] [CrossRef] [PubMed]
  97. Schmidt, F.L.; Oh, I.-S. The crisis of confidence in research findings in psychology: Is lack of replication the real problem? Or is it something else? Arch. Sci. Psychol. 2016, 4, 32–37. [Google Scholar] [CrossRef]
  98. Goldsmith, A.H.; Hamilton, D.; Darity, W., Jr. Shades of discrimination: Skin tone and wages. Am. Econ. Rev. 2006, 96, 242–245. [Google Scholar] [CrossRef]
Figure 1. Theoretical path model for relationships between genomic ancestry, cognitive ability and parental SES.
Psych 01 00001 g001
Figure 2. The median total eta for the independent effect of genetic ancestry on cognitive ability compared to SIRE for all models after controls for parental SES, genetic ancestry, SIRE, and language.
Psych 01 00001 g002
Figure 3. Association between European ancestry and cognitive ability (z score) in the African American (Standard) SIRE Group.
Psych 01 00001 g003
Figure 4. Association between European ancestry and cognitive ability (z score) in the Hispanic American (Standard) SIRE group.
Psych 01 00001 g004
Table 1. The Pediatric Imaging, Neurocognition, and Genetics (PING) subtest factor loadings and pairwise intercorrelations (with age and sex controls).
g Factor LoadingPicture SequenceList SortPattern RecognitionVocabularyReadingFlankerCard Sort
Picture Sequence0.371.00
List Sort0.570.341.00
Pattern Recognition0.380.130.181.00
Vocabulary0.570.220.340.131.00
Reading0.550.200.310.130.561.00
Flanker0.490.100.220.290.170.171.00
Card Sort0.570.160.300.320.220.210.521.00
Note: N = 1,369–1,370.
Table 2. Congruence coefficients for g loadings across standard self-identified racial/ethnic (SIRE) groups with Ns > 100.
WhiteAfrican AmericanHispanicMulti-EthnicAsian
White 0.950.960.980.97
African American 0.990.960.87
Hispanic 0.980.91
Multi-ethnic 0.97
Asian
Table 3. Sample characteristics for the full sample (with g scores) and by standard SIRE groups.
NMean AgeSD AgePercent MaleMean Parental SESSD Parental SESMean g ScoreSD g Score
Full sample136911.754.8851.50.001.000.001.00
White56711.644.8052.90.410.770.290.89
African American13812.504.6955.8−0.560.96−0.680.88
American Indian411.623.49100−1.030.920.211.26
Asian12013.815.6734.20.201.040.270.88
Hispanic32311.384.8552.9−0.440.94−0.330.98
Multi-ethnic18210.955.0051.1−0.041.100.051.10
Other1914.454.2163.2−0.151.00−0.050.84
Pacific Islander167.102.7043.8−1.241.20−0.481.30
Note: N is the number of cases with g scores; the number additionally with socioeconomic status (SES) scores may be smaller. SD = standard deviation.
Table 4. Mean genetic ancestry by self-identified race/ethnicity (standard coding).
SIRENEuropeanAfricanAmerindianEast AsianOceanianCentral Asian
White5710.97 (0.07)0.00 (0.04)0.01 (0.02)0.00 (0.04)0.00 (0.00)0.01 (0.04)
African American1400.17 (0.11)0.81 (0.12)0.00 (0.01)0.00 (0.03)0.00 (0.01)0.01 (0.02)
American Indian40.66 (0.42)0.21 (0.42)0.13 (0.25)0.00 (0.00)0.01 (0.01)0.00 (0.00)
Asian1220.06 (0.17)0.00 (0.02)0.00 (0.01)0.80 (0.36)0.01 (0.01)0.13 (0.32)
Hispanic3280.57 (0.23)0.14 (0.20)0.19 (0.17)0.09 (0.20)0.01 (0.02)0.01 (0.03)
Multi-ethnic1860.45 (0.27)0.11 (0.21)0.01 (0.02)0.37 (0.29)0.03 (0.05)0.03 (0.12)
Other240.55 (0.36)0.26 (0.33)0.01 (0.03)0.01 (0.02)0.00 (0.01)0.18 (0.32)
Pacific Islander160.11 (0.15)0.01 (0.04)0.00 (0.00)0.70 (0.13)0.17 (0.06)0.00 (0.00)
Note: Standard deviations in parentheses.
Table 5. Correlations between genetic ancestry and self-identified race/ethnicity (SIRE, continuous coding).
EuropeanAfricanAmericanEast AsianOceanianCentral Asian
SIRE: White0.86−0.50−0.23−0.44−0.22−0.13
SIRE: African American−0.450.92−0.14−0.18−0.08−0.06
SIRE: Hispanic−0.080.000.75−0.15−0.06−0.08
SIRE: Asian−0.56−0.20−0.160.810.090.27
SIRE: Pacific Islander−0.28−0.10−0.070.390.81−0.03
SIRE: American Indian0.000.030.09−0.04−0.01−0.04
SIRE: Other−0.030.06−0.04−0.06−0.030.16
Note: Highest correlations for SIRE are in bold.
Table 6. Pairwise correlations between cognitive ability, parental socioeconomic status (SES), and genetic ancestries.
CognitiveSESEuropeanAfricanAmerindianEast AsianOceanianCentral Asian
Cognitive1.00
SES0.421.00
European0.230.321.00
African−0.33−0.30−0.501.00
Amerindian−0.15−0.24−0.10−0.081.00
East Asian0.05−0.06−0.62−0.22−0.161.00
Oceanian−0.08−0.20−0.31−0.10−0.090.421.00
Central Asian0.060.12−0.20−0.07−0.07−0.07−0.031.00
Note: Sample sizes for Cognitive ability, SES, and genetic ancestry are N = 1,369, N = 1,380, and N = 1,391, respectively.
Table 7. Regression model results for cognitive ability using standard SIRE.
Model 1Model 2
PredictorBetaSECI lowerCI upperBetaSECI LowerCI upper
SIRE: White0.00 0.00
SIRE: African American−0.970.09−1.15−0.800.310.18−0.060.67
SIRE: American Indian−0.090.47−1.020.840.410.46−0.501.32
SIRE: Asian−0.020.10−0.210.18−0.070.19−0.440.30
SIRE: Hispanic−0.620.07−0.75−0.48−0.170.10−0.360.03
SIRE: Multi ethnic−0.240.08−0.40−0.080.040.11−0.180.25
SIRE: Other−0.330.22−0.760.10−0.030.23−0.480.42
SIRE: Pacific Islander−0.760.24−1.23−0.290.020.31−0.580.63
African −1.580.20−1.98−1.19
Amerindian −1.150.31−1.76−0.55
East Asian 0.060.19−0.310.42
Oceanian −4.811.27−7.31−2.31
Central Asian 0.210.26−0.290.71
English as First Language0.040.09−0.130.210.030.09−0.140.20
Note: N = 1,369 for both models. Model 1: R2-adj. = 0.11; Model 2: R2-adj. = 0.16.
Table 8. Regression model results for parental SES using standard SIRE.
Model 1Model 2
PredictorBetaSECI lowerCI upperBetaSECI lowerCI upper
SIRE: White0.00 0.00
SIRE: African American−0.980.09−1.14−0.810.280.18−0.060.63
SIRE: American Indian−1.450.46−2.34−0.55−0.850.44−1.710.02
SIRE: Asian−0.170.09−0.360.01−0.030.18−0.380.32
SIRE: Hispanic−0.840.06−0.97−0.71−0.210.09−0.39−0.03
SIRE: Multi ethnic−0.460.08−0.61−0.31−0.030.10−0.230.18
SIRE: Other−0.520.24−0.99−0.05−0.390.24−0.850.08
SIRE: Pacific Islander−1.620.23−2.08−1.17−0.220.29−0.790.35
African −1.550.19−1.93−1.18
Amerindian −1.910.29−2.48−1.34
East Asian −0.240.18−0.590.11
Oceanian −7.231.20−9.59−4.87
Central Asian 0.620.250.141.11
English as First Language0.130.08−0.030.290.110.08−0.050.27
Note: N = 1,380 for both models. Model 1: r2-adj. = 0.17; Model 2: r2-adj. = 0.25.
Table 9. Regression model results for cognitive ability using continuous SIRE.
Model 1Model 2
PredictorBetaSECI lowerCI upperBetaSECI lowerCI upper
SIRE: White0.00 0.00
SIRE: Hispanic−0.920.10−1.11−0.72−0.460.15−0.76−0.16
SIRE: Pacific Islander−1.000.18−1.34−0.65−0.780.31−1.39−0.17
SIRE: Asian0.040.09−0.140.21−0.040.22−0.480.40
SIRE: African American−1.020.08−1.18−0.850.290.24−0.180.75
SIRE: American Indian−0.620.26−1.13−0.10−0.240.27−0.760.28
SIRE: Other−0.350.22−0.770.08−0.040.23−0.490.42
African −1.590.27−2.13−1.06
Amerindian −0.750.33−1.40−0.11
East Asian 0.060.23−0.400.52
Oceanian −1.571.50−4.501.37
Central Asian 0.180.28−0.370.72
English as First Language0.050.08−0.110.210.040.08−0.130.20
Note: N = 1,369 for both models. Model 1: r2-adj. = 0.15; Model 2: r2-adj. = 0.17.
Table 10. Regression model results for parental SES using continuous SIRE.
Model 1Model 2
PredictorBetaSECI lowerCI upperBetaSECI lowerCI upper
SIRE: White0.00 0.00
SIRE: Hispanic−1.120.09−1.31−0.94−0.280.14−0.560.00
SIRE: Pacific Islander−2.090.17−2.41−1.76−2.060.29−2.63−1.50
SIRE: Asian−0.160.08−0.320.01−0.560.21−0.97−0.15
SIRE: African American−1.000.08−1.16−0.850.420.23−0.030.87
SIRE: American Indian−1.140.25−1.62−0.66−0.630.25−1.11−0.15
SIRE: Other−0.530.23−0.98−0.08−0.460.24−0.920.01
African −1.760.26−2.27−1.24
Amerindian −1.880.31−2.48−1.28
East Asian 0.330.22−0.100.75
Oceanian −1.601.38−4.321.11
Central Asian 1.070.270.551.59
English as First Language0.140.08−0.010.300.120.08−0.030.28
Note: N = 1,380 for both models. Model 1: r2-adj. = 0.22; Model 2: r2-adj. = 0.27.
Table 11. Regression model results for cognitive ability using standard SIRE and including SES.
Model 1Model 2
PredictorBetaSECI lowerCI upperBetaSECI lowerCI upper
(Parental) SES0.350.030.290.400.310.030.260.36
SIRE: White0.00 0.00
SIRE: African American−0.620.09−0.80−0.450.190.18−0.160.54
SIRE: American Indian0.420.45−0.461.290.660.44−0.211.53
SIRE: Asian0.050.09−0.130.23−0.080.18−0.430.28
SIRE: Hispanic−0.320.07−0.45−0.19−0.110.10−0.300.08
SIRE: Multi ethnic−0.080.08−0.230.070.030.11−0.170.24
SIRE: Other−0.010.23−0.470.450.140.24−0.330.61
SIRE: Pacific Islander−0.200.23−0.640.250.090.29−0.490.66
African −1.050.20−1.44−0.66
Amerindian −0.530.30−1.120.05
East Asian 0.160.18−0.200.51
Oceanian −2.621.23−5.04−0.20
Central Asian 0.040.25−0.450.53
English as First Language0.000.08−0.160.150.000.08−0.160.15
Note: N = 1,363 for both models. Model 1: r2-adj. = 0.21; Model 2: r2-adj. = 0.23.
Table 12. Regression results for Non-Whites with cognitive ability (Model 1) and parental SES (Model 2) as dependents.
Model 1: Cognitive AbilityModel 2: SES
PredictorBetaSECI lowerCI upperBetaSECI lowerCI upper
SIRE: White0.200.090.020.380.280.090.110.45
SIRE: Hispanic−0.200.10−0.400.00−0.160.10−0.350.03
SIRE: Pacific Islander−0.450.14−0.72−0.18−1.000.13−1.25−0.74
SIRE: Asian0.200.13−0.060.460.040.13−0.210.29
SIRE: African American0.300.16−0.020.610.280.16−0.030.59
SIRE: American Indian−0.120.13−0.360.13−0.210.12−0.450.02
SIRE: Other0.160.25−0.330.64−0.170.26−0.690.34
African−1.470.26−1.98−0.96−1.400.26−1.91−0.90
Amerindian−0.810.34−1.48−0.15−1.680.33−2.32−1.04
East Asian0.000.21−0.410.410.020.20−0.380.42
Oceanian−1.341.37−4.021.34−1.531.31−4.101.04
Central Asian0.100.27−0.440.640.700.270.171.23
English as First Language0.090.10−0.100.290.280.090.100.46
Note: N = 802 for CA: r2-adj. = 0.18; N = 810 for SES: r2-adj. = 0.25.
Table 13. Regression results for African Americans (Standard Coding) with cognitive ability (Model 1) and parental SES (Model 2) as dependents.
Model 1: Cognitive AbilityModel 2: SES
PredictorBetaSECI lowerCI upperBetaSECI lowerCI upper
African−1.600.61−2.81−0.39−2.500.65−3.79−1.22
Note: N = 138 for CA: r2-adj. = 0.04; N = 139 for SES: r2-adj. = 0.09.
Table 14. Regression results for African Americans (Broad Coding) with cognitive ability (Model 1) and parental SES (Model 2) as dependents.
Model 1: Cognitive AbilityModel 2: SES
PredictorBetaSECI lowerCI upperBetaSECI lowerCI upper
African−1.240.27−1.77−0.71−0.770.27−1.30−0.24
Note: N = 225 for CA: r2-adj. = 0.08; N = 227 for SES: r2-adj. = 0.03.
Table 15. Regression results for Hispanics (standard coding) with cognitive ability (Model 1) and parental SES (Model 2) as dependents.
Model 1: Cognitive AbilityModel 2: SES
PredictorBetaSECI lowerCI upperBetaSECI lowerCI upper
African−1.620.30−2.22−1.03−2.000.26−2.52−1.48
Amerindian−1.160.34−1.84−0.49−2.090.30−2.69−1.49
East Asian−0.530.28−1.090.02−1.32 0.25 −1.81 −0.82
Note: N = 323 for CA: r2-adj. = 0.08; N = 328 for SES: r2-adj. = 0.19.

