1. Introduction
The release of dye-containing effluents into water resources from various industrial processes such as textile, paper and tanneries present a persistent challenge to environmental sustainability [
1,
2]. Crystal violet (CV) is a widely used dye which is highly soluble in aqueous solution and presents potential adverse impacts on aquatic lives and human health. CV is known to be carcinogenic, persistent, and bioaccumulative [
3,
4]. Its discharge into water bodies is usually accompanied by a decrease in the aesthetic properties of such water resource and interferes with light penetration to benthic organisms, thus reducing the amount of dissolved oxygen required for healthy life below water [
3,
4,
5].
There are no specific guideline values for CV discharge into the environment but because of its toxicity, it is not suitable to be discharged onto water sources without complete removal. Some regulatory bodies like the United States Environmental Protection Agency have 2.13 mg/L as the allowable concentration for toxic organics and the European Union have 300 pt-co for textile and dye industries, while the Department of Water and Sanitation of South Africa have 150 pt-co for total color in water [
6,
7,
8].
Although several methods have been developed for the sequestration of hazardous dyes from water resources, such as chemical precipitation, membrane filtration, oxidation and electrochemical methods, they are often economically prohibitive, while some generate other forms of secondary pollutants of concern [
9]. The use of physical methods such as adsorption is continuously being explored due to its low cost, operational simplicity, and efficiency [
3,
10].
There are ongoing research endeavors targeted at developing environmentally sustainable and low-cost adsorbent using industrial bye products and natural materials. Geopolymers are amorphous aluminosilicate materials synthesized by the alkaline activation of silica- and alumina-rich sources and have emerged as a good material for the sequestration of hazardous dyes [
5]. Their mechanical stability, ion exchange potential, and porous nature presents a material suitable for the retention of hazardous dyes [
10]. Several materials have been used to synthesize geopolymers, amongst which are clay-based ones such as vermiculite, coal fly ash, and a mixture of clays and organic materials such as moringa seed sawdust, rice husk, etc., [
1,
10,
11,
12]. Kaolin clay has been used for the removal of different classes of pollutants such as trace metals and some dyes [
13,
14]. Kaolin also has the potential to be synthesized into a geopolymer. Kaolin-based geopolymers (KBG), offer significant advantages owing to their abundance in South Africa and globally, low cost, and the aluminosilicate-rich composition of kaolin clay, which allows for efficient activation and framework formation under mild alkaline conditions [
15].
However, most studies to date have focused on the removal of inorganic contaminants or simpler organic compounds, with limited research addressing the adsorptive removal of complex cationic dyes such as CV [
16,
17]. To the best of our knowledge, KBG has not been used to remove CV from wastewater but there has been report of the use of Metakaolin-rice husk geopolymer, as well as Metakaolin-kaolin geopolymer [
16,
18]. Hence, in this study I report my findings on the synthesis of KBG as a low-cost sorbent for the removal of CV from aqueous solution. Additionally, a change in water chemistry, which is not often studied in sorption studies, was performed to examine the impact of CV removal both in laboratory solvent as well as river water with a more complex water chemistry. The data obtained were analyzed using kinetic and equilibrium models. This study aims to provide insight into the development of a low-cost, eco-friendly adsorbent material for practical water treatment applications.
2. Materials and Methods
2.1. Chemicals and Reagents
Kaolin clay was purchased from a clay manufacturing company in Germiston potteries, Johannesburg, Gauteng Province, South Africa. Analytical-grade reagents, including NaOH, HCl, and CV were used without further treatment. Distilled water was used to prepare all solutions. NaOH and HCl were used for pH adjustment in the solution.
2.2. Synthesis of Kaolin-Based Geopolymer (KBG)
A total of 50 g of kaolin was placed in a beaker and 200 mL of 5 M NaOH was added. The resulting solution was placed in a temperature-controlled magnetic stirrer for about 15 min. A total of 10 mL of hydrogen peroxide was subsequently added to the mixture in a fume hood and was dried in an oven at 80 °C for 2 days, after which the dried KBG was pulverized and stored for sorption studies (
Figure 1). The purpose of adding hydrogen peroxide is to enhance the porosity of the geopolymer. The addition of hydrogen peroxide also aids in the removal of other organic contaminant on the surface of the natural clay. It also improves reactivity for geo-polymerization to take place.
2.3. Preparation of Dye Solution
A stock solution (1000 mg/L) of CV was prepared. The wavelength of maximum adsorption was determined by scanning a diluted form in a UV-VIS spectrophotometer between 300 and 900 nm and was determined as 616 nm. Working solutions were prepared from the stock solution and were used to calibrate the instrument which recorded a linearized coefficient of 0.99.
2.4. Characterization of Adsorbent
The prepared sorbent was characterized using Fourier Transform Infrared (FT-IR), Scanning Electron Microscope and Energy dispersive X-ray spectrometry (SEM-EDS) and Brunauer–Emmett–Teller (BET). To understand the functional groups on the surface of the sorbent, 0.8 g of it was applied to cleaned crystal lenses of a Nicolet iS10 FT-IR spectrometer (Thermo Scientific, Madison, WI, USA) with a Diamond Attenuated Total Reflectance prior to applying pressure with the arm pressure attached to the FT-IR equipment. Thermo Scientific™ OMNIC™ spectra software (version 9.15) was used to record the samples’ infrared (IR) spectra and identify tiny particles. The spectra were acquired spanning the range of 4500 to 400 cm
−1 [
1].
The surface morphology and elemental content of KBG was examined using SEM (scanning electron microscope) and EDS (energy dispersive X-ray spectrometry) equipment. A Vega 3X MU (TESCAN, Cambridgeshire, PE28 9ET, UK) equipped with a filament of tungsten as an electron source (SEM) was used to study their structural surface. At a voltage of 20 kV, electrons from the backscatter and secondary detectors combined with atoms from 2 g of the oven-dried novel adsorbents to create the micrograph, which was subsequently processed with Vega 4 software. Simultaneously, INCA software (V 7.5), which was installed in conjunction with SEM Vega 3X MU, was used to obtain EDS data. Peaks corresponding to the element were observed at 20 kV from the beam [
1].
BET instrument, TriStar II Micromeritics (Norcross, GA, USA) analyzer was used to assess the surface area of KBG. The samples were vacuum degassed at 100 °C, overnight. The surface area, mean pore diameter, and overall pore volume were measured at 195 K with nitrogen gas (N
2). The Barrett–Joyner–Halenda (BJH) model [
19] was used to estimate the distribution of pore size and volume.
Approximately 1.8 g of each dried sample was finely ground using a porcelain mortar and pestle to obtain a homogeneous powder suitable for X-ray diffraction (XRD) analysis. The crystalline phases were identified using a Bruker D2 Phaser diffractometer equipped with a Cu Kα radiation source (λ = 1.5406 Å) and a LynxEye position-sensitive detector. The instrument was operated at an accelerating voltage of 30 kV and a current of 10 mA. Diffraction patterns were collected over a 2θ range of 3–80°, with a step size of 0.02° and a counting time of 0.25 s per step. Phase identification and semi-quantitative analysis were performed using the Diffract.EVA software (version 7), referencing the International Centre for Diffraction Data (ICDD) Powder Diffraction File (PDF-2) for mineral phase matching [
20].
Mineral analysis was performed with the bench-top Bruker S2 PUMA Energy Dispersive X-ray Fluorescence (ED-XRF) (Billerica, MA, USA, Bruker) spectrometer. A quality check was performed at the beginning of the analysis using a FLX-K04 glass standard to determine if a drift correction was required; however, no correction was required during the measurement. Spectra Elements 2.0 was utilized for acquisition and data processing, reporting the final oxide concentration.
2.5. Adsorption Studies
Several experimental drivers such as time, pH, change in water chemistry, dosage and initial concentration were assessed. The influence of time was investigated by varying it between 5 and 180 min. The time of optimum uptake of the sorbate was recorded and used for subsequent experiments. Furthermore, the influence of adsorbent dosage was investigated across 0.05–1.0 g. The influence of pH was investigated in the range of acidic to alkaline pH range (2–12). The pH of optimum uptake was identified and recorded. The influence of initial concentration was studied with the CV concentration in the range of 10–150 mg/L. The experiment was also conducted in river water samples to investigate the effects of change in water chemistry and the uptake recorded was compared to that performed in de-ionized water. The influence of temperature was investigated in the range of 30 to 50 degrees Celsius.
In all cases, the shaking speed was 200 rpm, time was the optimum time, and pH was the initial dye pH. In all cases after time expiration, the mixtures were removed and centrifuged at 3000 rpm. The supernatants were run in the UV-VIS spectrophotometer at 619 nm (Orion AquaMate 7000, Thermoscientific) (Waltham, MA, USA) [
21].
The dye percentage removal efficiency was computed using the following equation:
where
Ci represents the initial concentration and
Cf is the final concentration.
The quantity of the dye sorbed (adsorption capacity) at equilibrium time per gram of adsorbent (
Qe, mg·g
−1) was determined using Equation (2):
where
Co signifies the initial dye concentration expressed in (mg L
−1), and
Ce is the concentration at equilibrium of the dye, also expressed in (mg L
−1). V denotes volume of the solution, and m is the dosage in grams (g) of the adsorbent [
22].
To determine the point of zero charge, a 40 mL aliquot of 0.01 M NaCl solution was introduced into seven vials. The NaCl pH solution in each bottle was adjusted to initial pH (pH
i) of 2, 4, 6, 7, 8, 10 and 12 using 0.1 M HCl and 0.1 M NaOH. The pH was measured using the Themo Orion VersaStar pH meter (Thermoscientific, Waltham, MA, USA). Consequently, 0.15 g of the KBG was added to each vial. The solution mixture was then subjected to agitation for 24 h at room temperature. After time expiration, the samples were centrifuged at 3000 rpm for 5 min, and the solutions were decanted into beakers for the final determination of the pH. The difference between the initial and final pHs (pH = pH
i − pH
f) was plotted against the initial pH (pH
i). The point where pH = 0 was regarded as the point of zero charge [
9].
2.6. Adsorption Kinetics
The kinetic data produced on the adsorption studies for the influence of time were studied by the Lagergren pseudo-first-order [
23], pseudo-second-order [
24], and intra-particle kinetic [
25] models. The linearized forms of the models were employed as shown in Equations (3)–(5).
where k
1 represents the rate constant, q
e is the amount of dye adsorbed at equilibrium, and q
t signifies the dye adsorbed at time t. K
2 represents the pseudo-second-order rate constant, K
p is the rate constant of the intra-particle diffusion (mg/g min), and C is the intercept of the slope (mg/L) [
25].
2.7. Adsorption Isotherms
The equilibrium data obtained were subjected to Langmuir, Freundlich, and Temkin models [
26,
27,
28]. The linearized forms of the models were employed as shown in Equations (6)–(8).
where C
e (mg/L), indicates the dye concentration after the sorption process, q
e (mg/g), measures the quantity of dye absorbed by the adsorbent at equilibrium, q
max describes the maximum adsorption capacity, and k
L relates to the energy of adsorption. K
f is the adsorption capacity (L/mg) and
demonstrates the heterogeneity of the adsorbate site and the energy of dispersion through the intensity of adsorption. B
1 reflects the heat of adsorption, and K
T, denotes the binding constant at equilibrium, expressed as liters per milligram (L mg
−1).
2.8. Adsorption Thermodynamics
The Gibbs free energy change (∆G°), entropy change (∆S°), and enthalpy change (∆H°) were used to assess the spontaneity and viability of the adsorption process. The linearized Equations (9) and (10) and were used to compute the parameters of the adsorption processes.
K
o represents the equilibrium constant, R signifies the universal gas constant with a value of 8.314 J/mol/K, and T expresses the temperature [
29].
2.9. Desorption Studies
For this experiment, a known mass (1 g) of the sorbent was placed with 50 mg/L of CV solution after sorption under optimized condition. The spent sorbent was subjected to three desorbing agents to test which can recover CV already sorbed on it. A total of 50 mL each of the desorbing agents (deionized water, 0.1 M HCl, and 0.1 M NaOH) were added and agitated at optimum time. The percentage of CV desorbed was calculated using the relation in Equation (11).
3. Results
The SEM micrograph on the raw kaolin clay, as well as KBG, is shown in
Figure 2A,B. It is evident from
Figure 2B that the porosity of the material increased after modification. The KBG showed irregular, flaky and gel-like surfaces with several pores capable of adsorbing the sorbate molecule. After sorption, there was a great decrease in the available pore surfaces (
Figure 2C), which implies a reduction as a result of sorption. A similar result has been recorded by several scholars [
1,
2]. The EDX composition showed the oxygen atom as the most prevalent (59.19%), followed by sodium (25.06%), silicon (21.34%) and aluminum (3.43%).
The major chemical compositions of the raw kaolin and the synthesized kaolin-based geopolymer (KBG) are presented in
Table 1. Geopolymer formation typically involves the dissolution and reorganization of SiO
2 and Al
2O
3 species. In the resulting KBG, SiO
2 and Al
2O
3 remain the dominant oxide components, accompanied by K
2O.
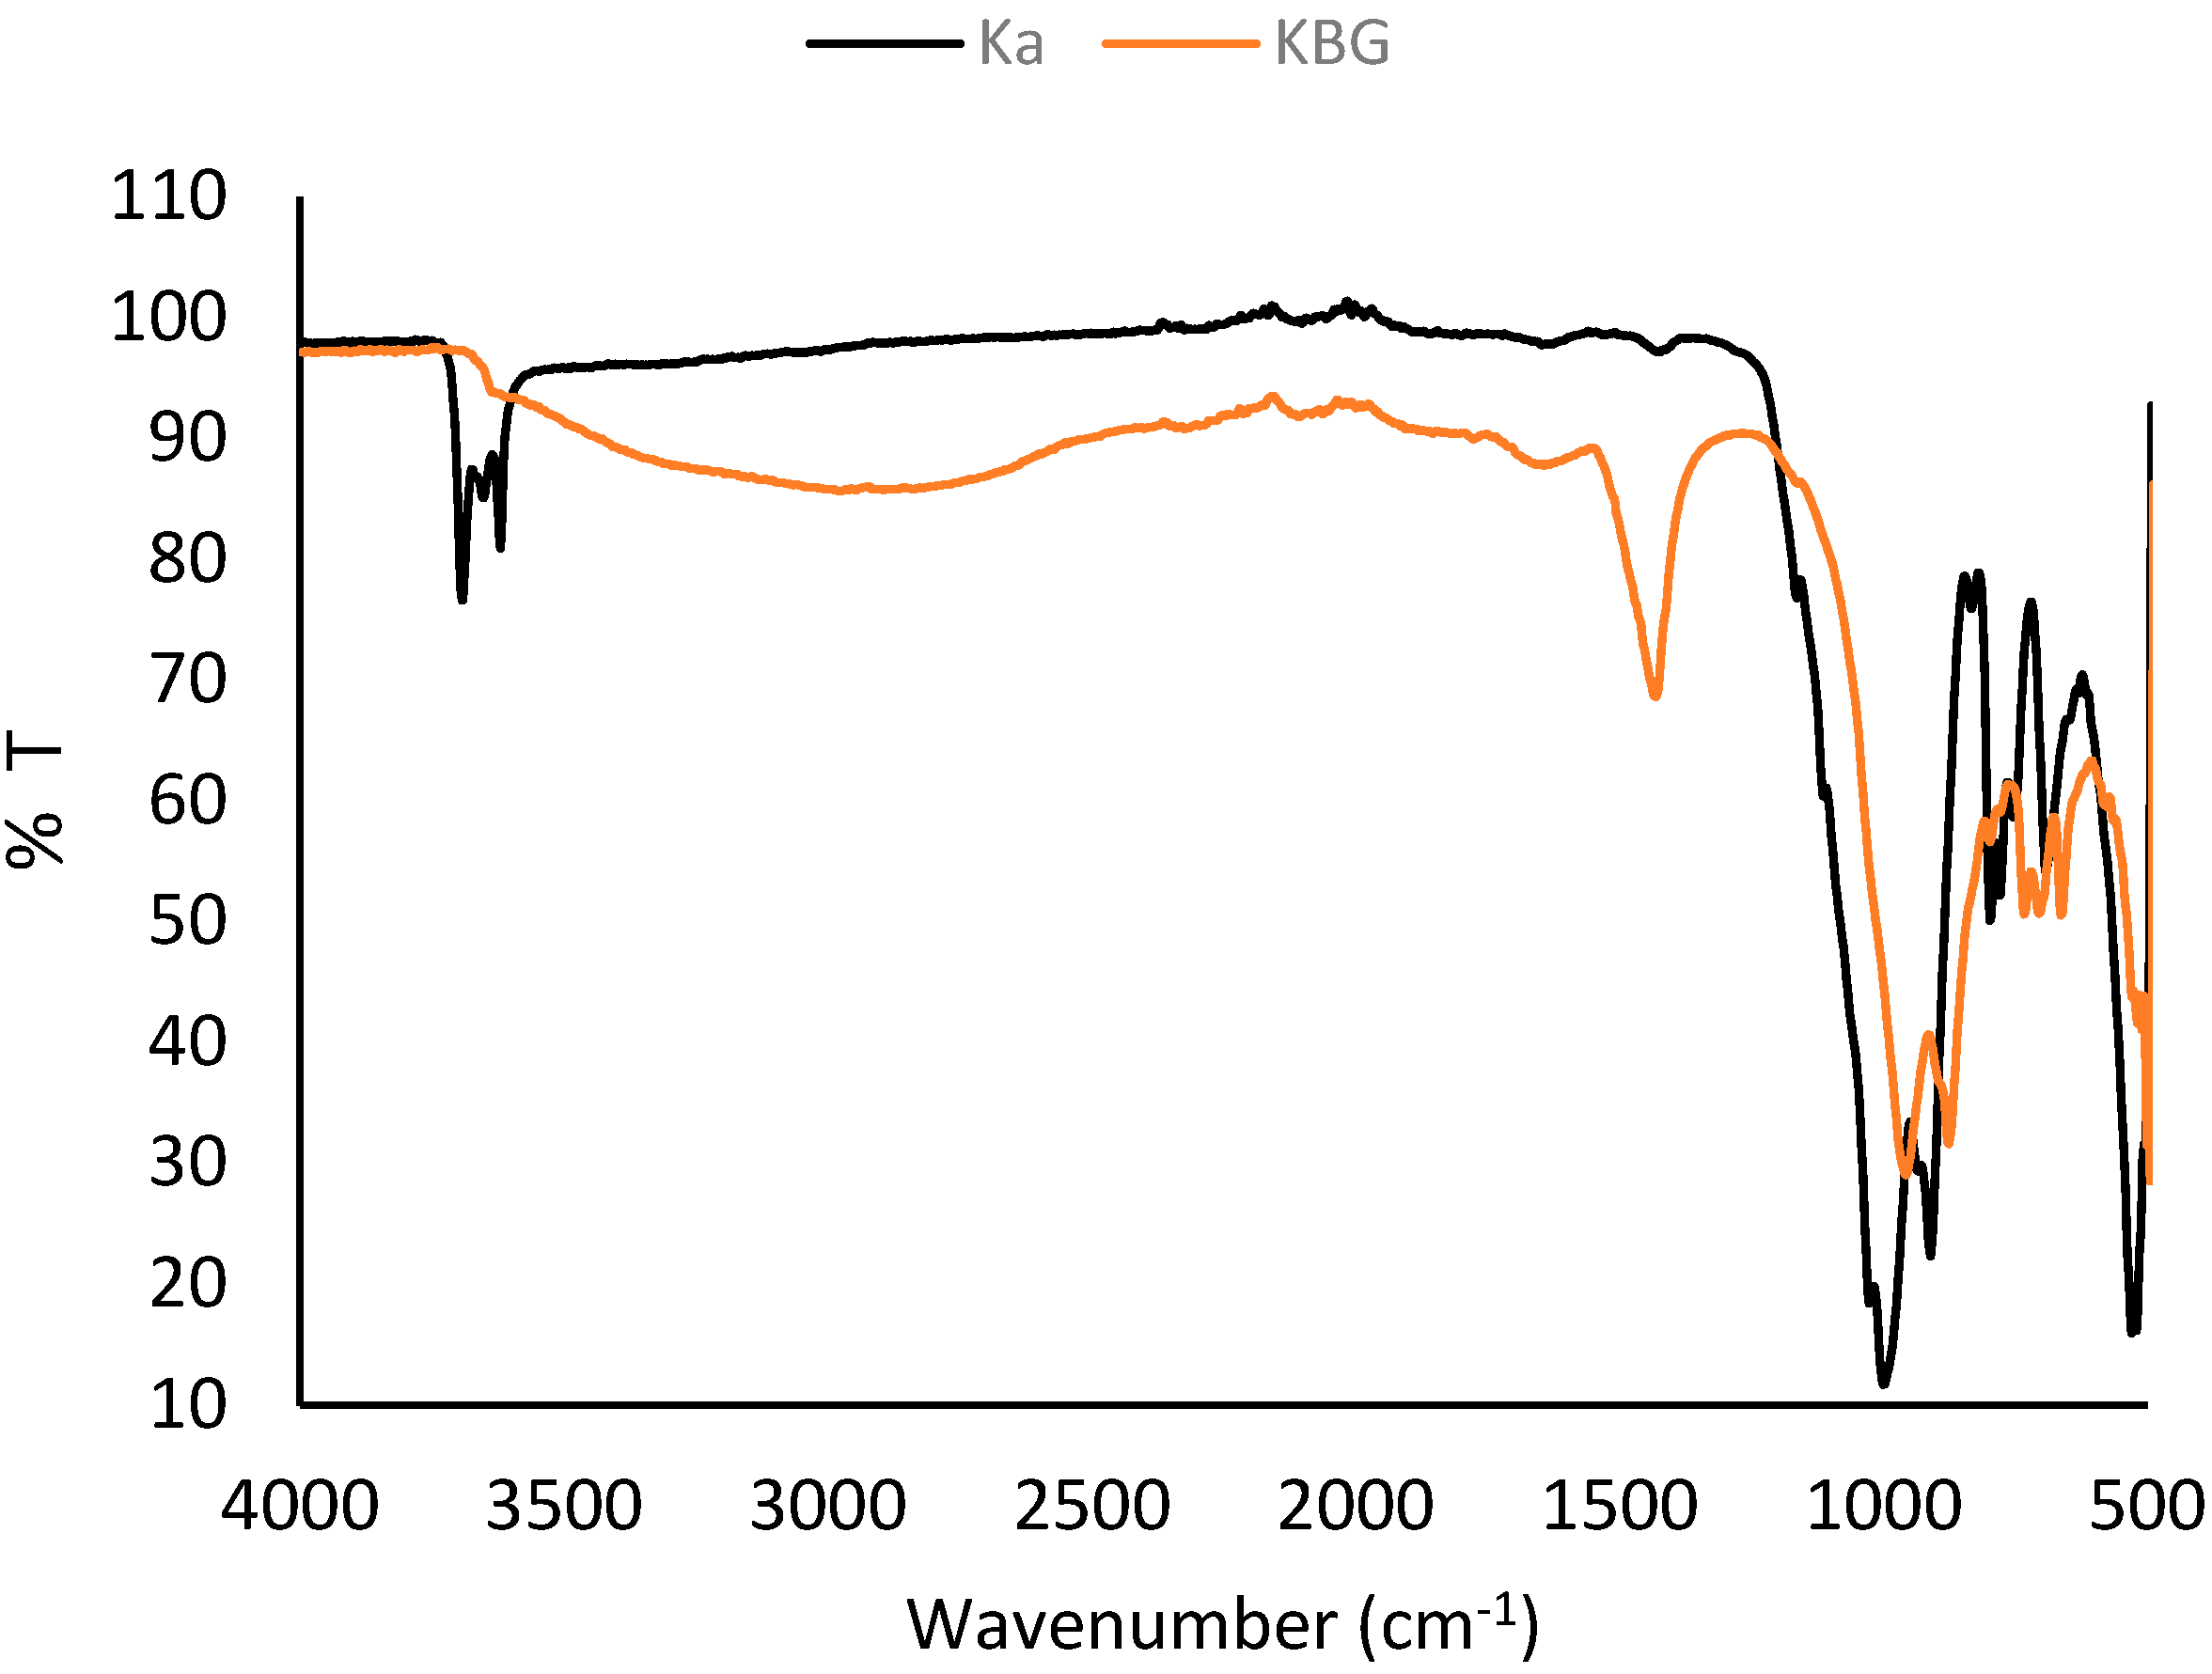
The FTIR spectra confirmed the functional groups present in both raw kaolin and the synthesized geopolymer (
Figure 3). In the raw kaolin, absorption bands at 3693 and 3619 cm
−1 correspond to the O–H stretching vibrations of structural hydroxyl groups, typically associated with Al–OH stretching [
30,
31]. These bands disappeared in the geopolymer, indicating dehydroxylation and structural reorganization during alkali activation. Bands at 1000 and 971 cm
−1 in the raw kaolin were assigned to Si–O–Si and Si–O–Al stretching, while those at 797–787 cm
−1 and 691–528 cm
−1 corresponded to Si–O bending and Al–O–Si vibrations, respectively [
32].
In the synthesized geopolymer, a new band at 1434 cm
−1 was attributed to C=O or COO
− asymmetric stretching [
30,
31], while the Si–O stretching at 963 cm
−1 became broader, suggesting enhanced polymerization of the aluminosilicate framework. Additional peaks at 875 cm
−1 (Al
2OH deformation), 736 cm
−1 (Si-O-Al bending), and 701–695 cm
−1 (Si–O vibrations from quartz) [
32,
33] further confirmed the formation of a geopolymeric network. The disappearance, shifting, and broadening of key bands verified the successful transformation of kaolin into a geopolymer structure.
The BET surface area of the raw kaolin was 18.58 m
2/g while that of the KBG was 11.18 m
2/g. This is unexpected, as most geopolymers usually have a higher surface area than their precursor. The reason for this could be due to the kind of kaolin used in this study, which is highly rich in quartz as observed from the XRD results. Also, quartz was present after geopolymerization, which implies an incomplete dissolution of the kaolinite. The formation of secondary minerals during curing such as illite and magnesite could occupy some space leading to a reduced surface area [
34]. However, the surface area recorded was higher than that of vermiculite-based geopolymer (6.05 m
2/g) and kaolin-metakaolin geopolymer (9.51 m
2/g) [
1,
35]. Fly ash geopolymer recorded a surface area of 15.58 m
2/g, while a porous fly ash geopolymer attained a BET surface area of 45.51 m
2/g [
36]. Although higher BET surface area could imply the presence of more active sites for sorption to take place, as well as enhancement in both monolayer and multi-layer coverage, BET surface area alone does not predict adsorption. Other factors such as the material’s pore size distribution, functional groups, and surface chemistry also play key roles [
37].
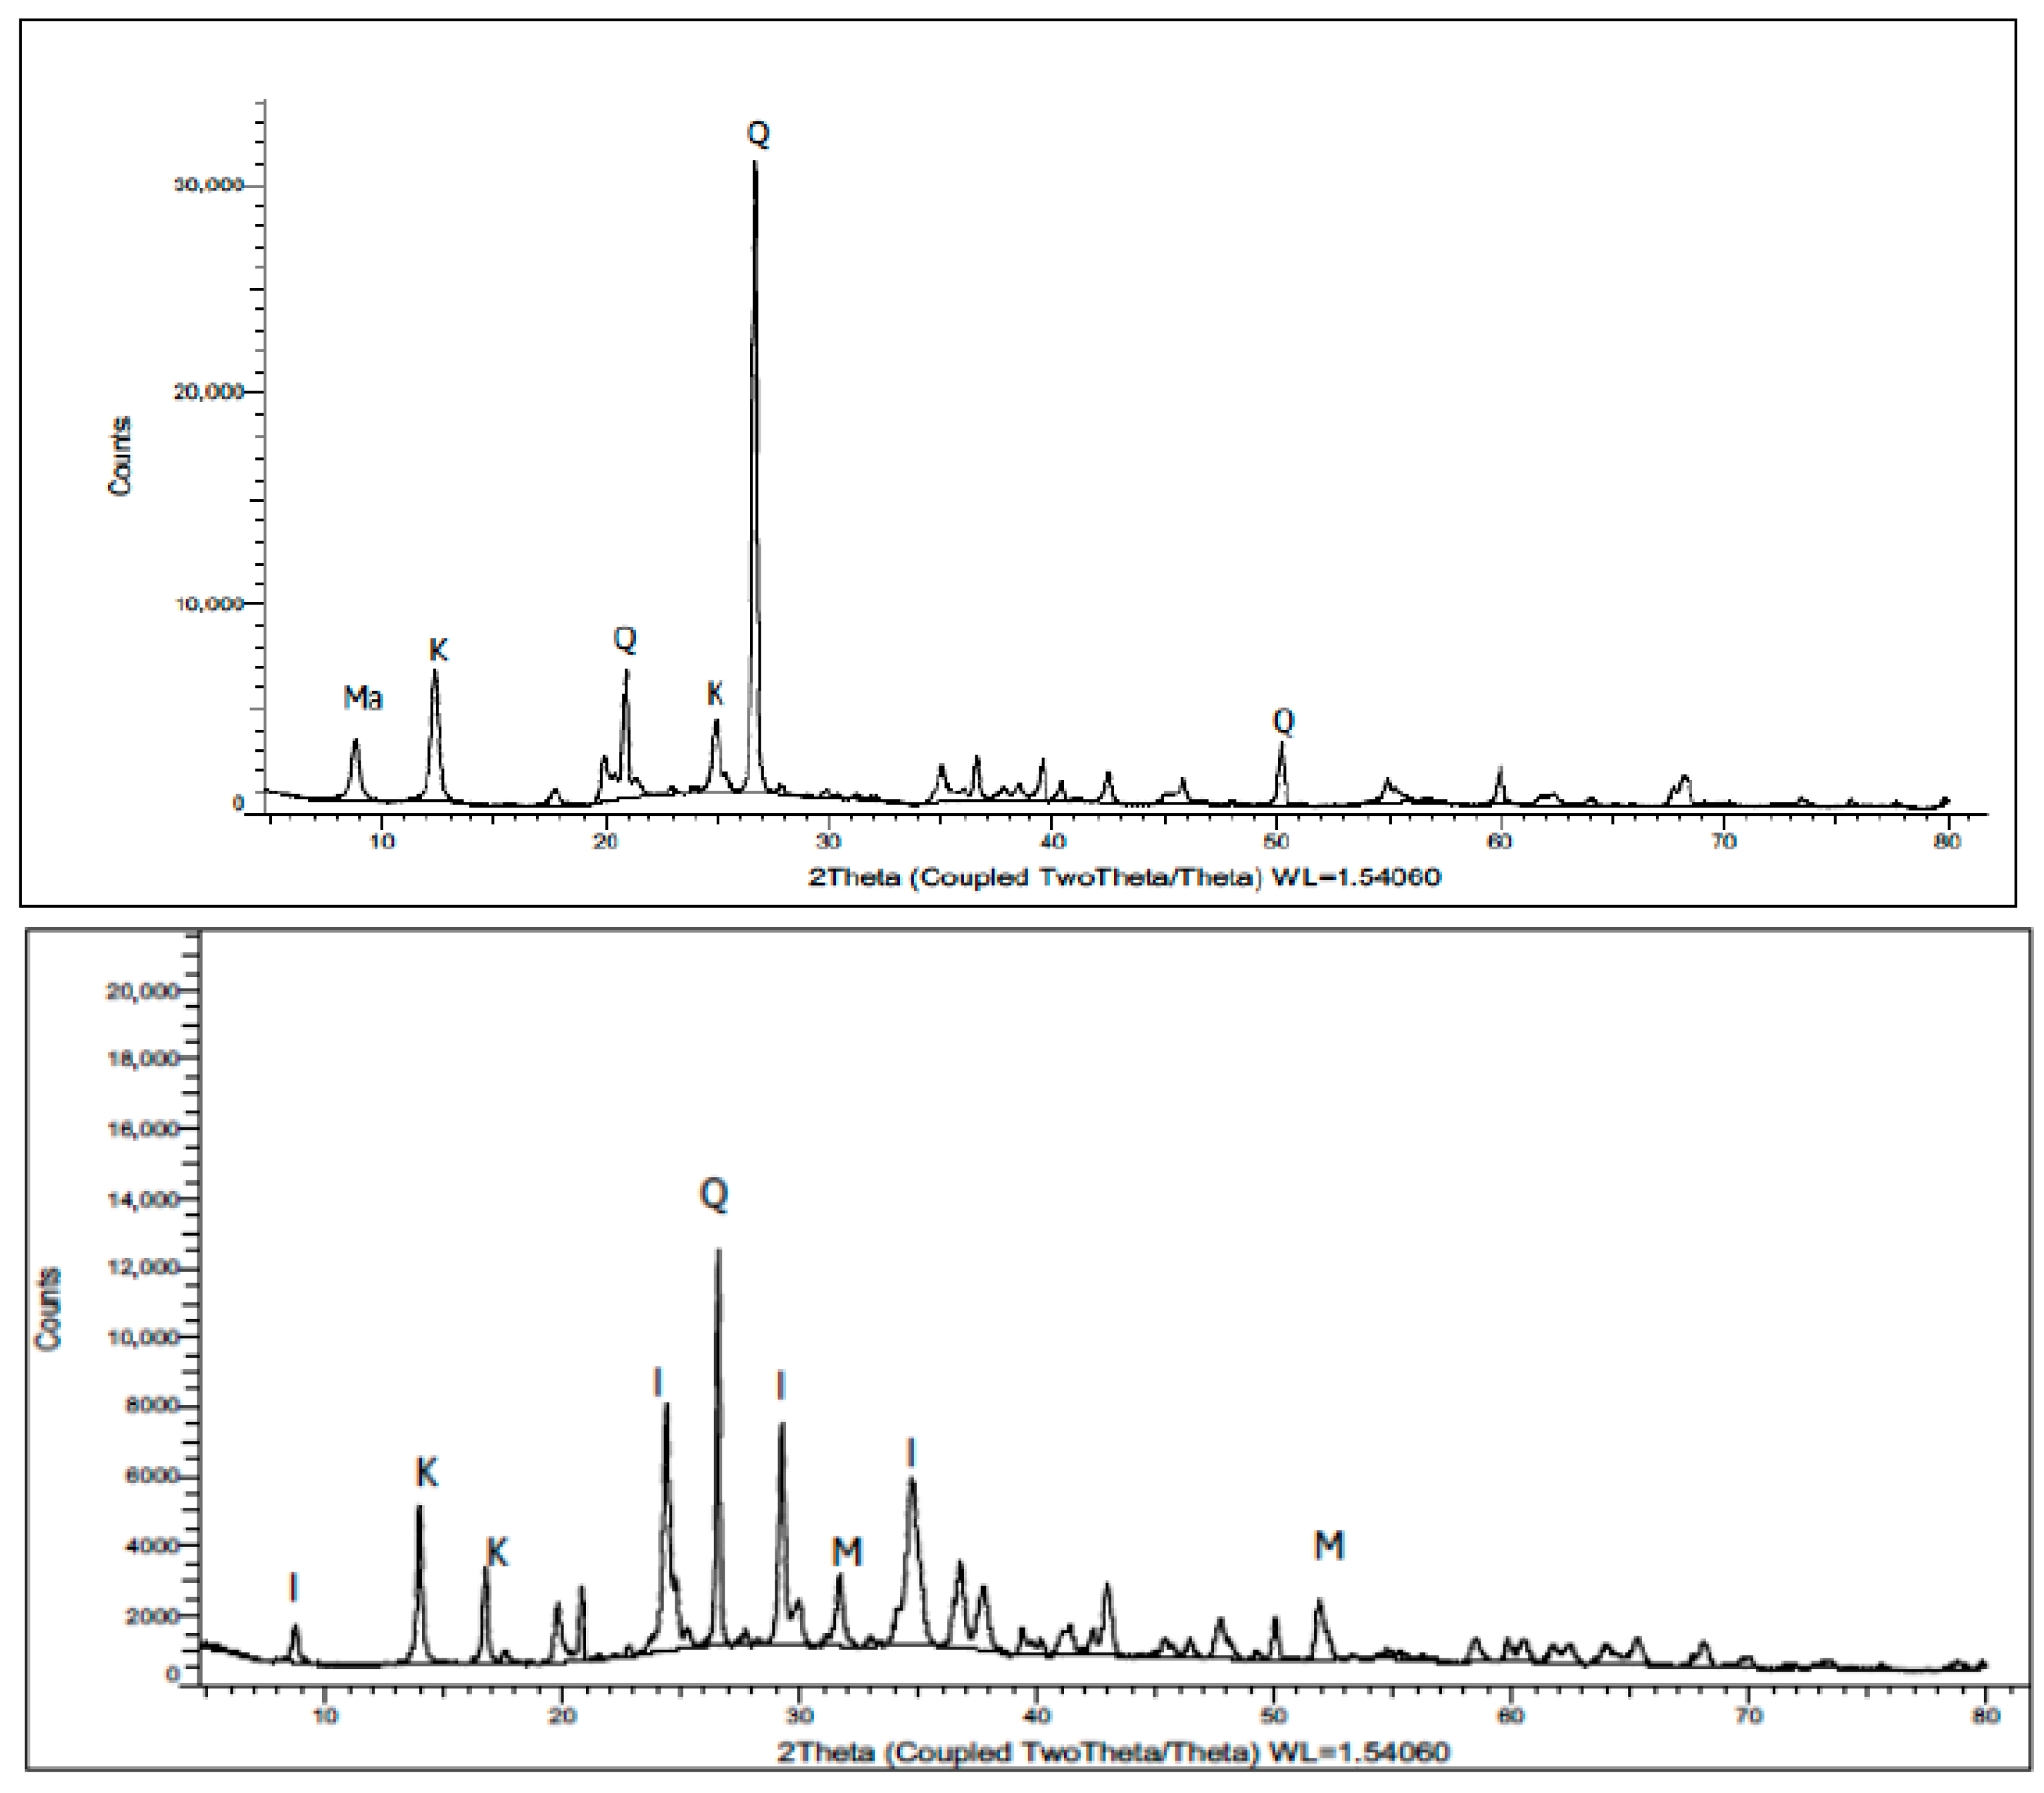
The XRD pattern of the raw kaolin revealed that the material was predominantly composed of quartz, kaolinite and muscovite, exhibiting sharp and well-defined reflections that indicate a high degree of crystallinity (
Figure 4). The characteristic peaks of kaolinite were observed at 2θ = 14° and 25°, corresponding to the (001) and (002) basal planes, respectively, while quartz was identified by its strong reflections at 2θ = 21°, 27°, and 50°. Minor muscovite peaks were also detected, confirming the presence of accessory phyllosilicate minerals, consistent with typical kaolinitic clay mineralogy reported in the literature [
38]. In contrast, the kaolin-based geopolymer (KBG) exhibited a marked reduction in the intensity of the kaolinite peaks and a broadening of several reflections, signifying a decrease in crystallinity and partial amorphization during geopolymerization.
The residual kaolinite reflection at 2θ = 14° persisted but was weakened, while the peak near 25° shifted toward 17°, suggesting structural reorganization within the aluminosilicate framework. A strong quartz reflection remained, alongside the emergence of new peaks corresponding to illite, magnesite, and traces of phengite, indicating the formation of new secondary phases. These changes confirm the distortion and dissolution of the original kaolinite structure and the formation of an amorphous aluminosilicate gel network typical of geopolymeric materials [
39]. The persistence of minor kaolinite and quartz peaks in the KBG sample suggests an incomplete dissolution of the original aluminosilicate phases, which is typical for moderate alkali activator concentrations or suboptimal curing conditions [
40]. Overall, the XRD evidence supports that kaolin underwent partial dehydroxylation and dissolution, followed by repolymerization into an amorphous three-dimensional aluminosilicate framework, confirming the successful geopolymerization process in the synthesized material.
3.1. Batch Sorption Studies
3.1.1. Effects of Time
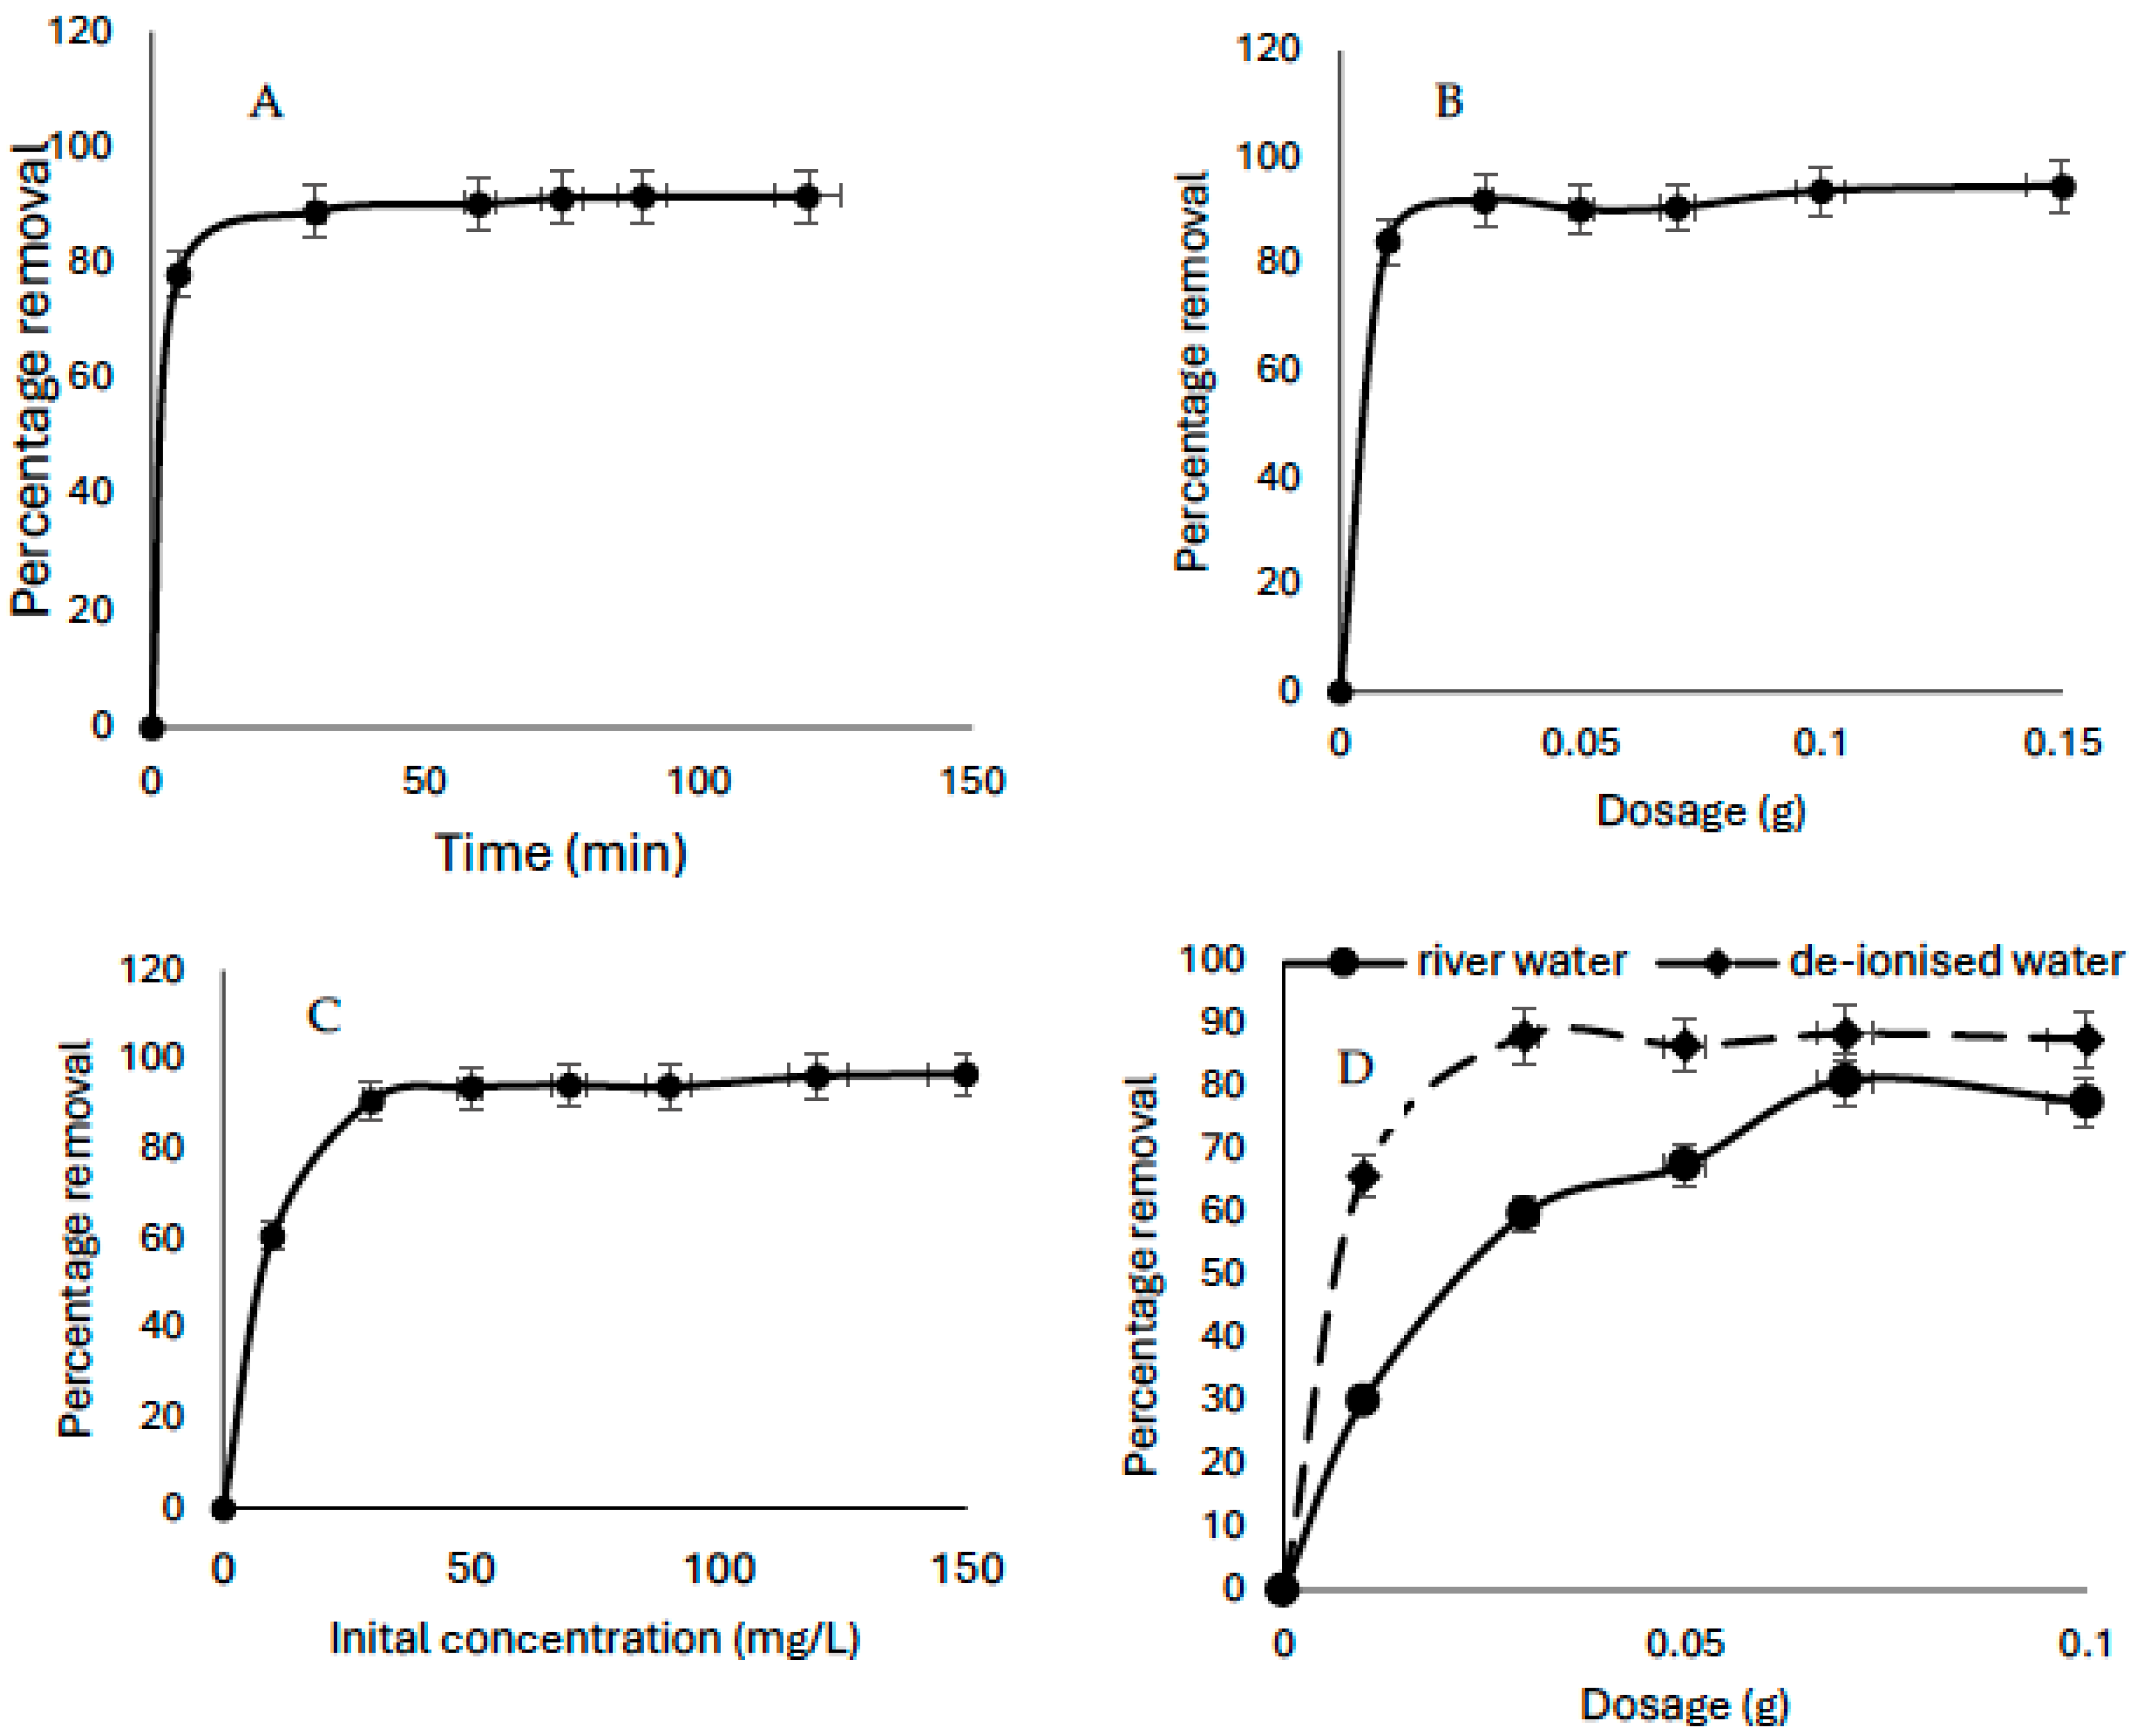
The influence of sorption time was investigated between 5 and 120 min. There was an initial rapid uptake of CV (80%) by KBG within 5 min of sorption time; this could be due to the availability of sorption sites on the sorbent (
Figure 5A). After 30 min, additional 9% uptake was recorded, after which very little uptake was recorded. The optimized sorption time was taken as 30 min and was used for subsequent studies. Such rapid uptake of sorbate molecules due to the availability of sites on the sorbent has been reported in previous studies [
1,
41].
3.1.2. Effects of Dosage
The effect of sorbent dosages was investigated between 0.01 and 0.16 g. Much sorption was recorded between 0.01 (84.34%)–0.03 g (91.96%) for an initial CV concentration of 50 mg/L (
Figure 5B). Insignificant removal was recorded after this point. The initial increase recorded as the sorbent dosage increases were due to increased active sites available for the uptake of the sorbate molecule but as the active sites became saturated, further uptake was restricted.
3.1.3. Effects of Initial Concentration
There was a continuous increase in sorption as the concentration increased. Such increased sorption could be due to increased number of molecules per unit value on the surface of the sorbent, which increase the possibility of sorption (
Figure 5C). Similarly, a lower sorbate concentration may lead to unsaturation of the sorbent active sites which can become saturated with the increased concentration of sorbate molecules as concentration increases. However, there was little uptake at an increasing sorbate concentration, possibly due to the complete filling of the surface area on the sorbent. Similar findings have been reported in the literature [
42,
43,
44].
3.1.4. Effects of Matrix
Change in water chemistry influenced the sorption capacity of the sorbate, as higher sorption capacity was recorded in distilled water, possibly due to the absence or low concentration of other interfering substances (
Figure 5D). However, the reduction in capacity when surface water was used could be likely due to the more complex chemistry of the ions present in lieu to deionized water. A previous study by Edokpayi et al. [
45] revealed that cations such as Mg
2+ and Ca
2+ could influence the rate of dye sorption. Factors such as pH, temperature, and the composition of the water can either accelerate or hinder the reaction rate [
46]. The major composition of the river water used is presented in
Table 2.
3.1.5. Effects of pH and the Plausible Mechanism of the Sorption Process
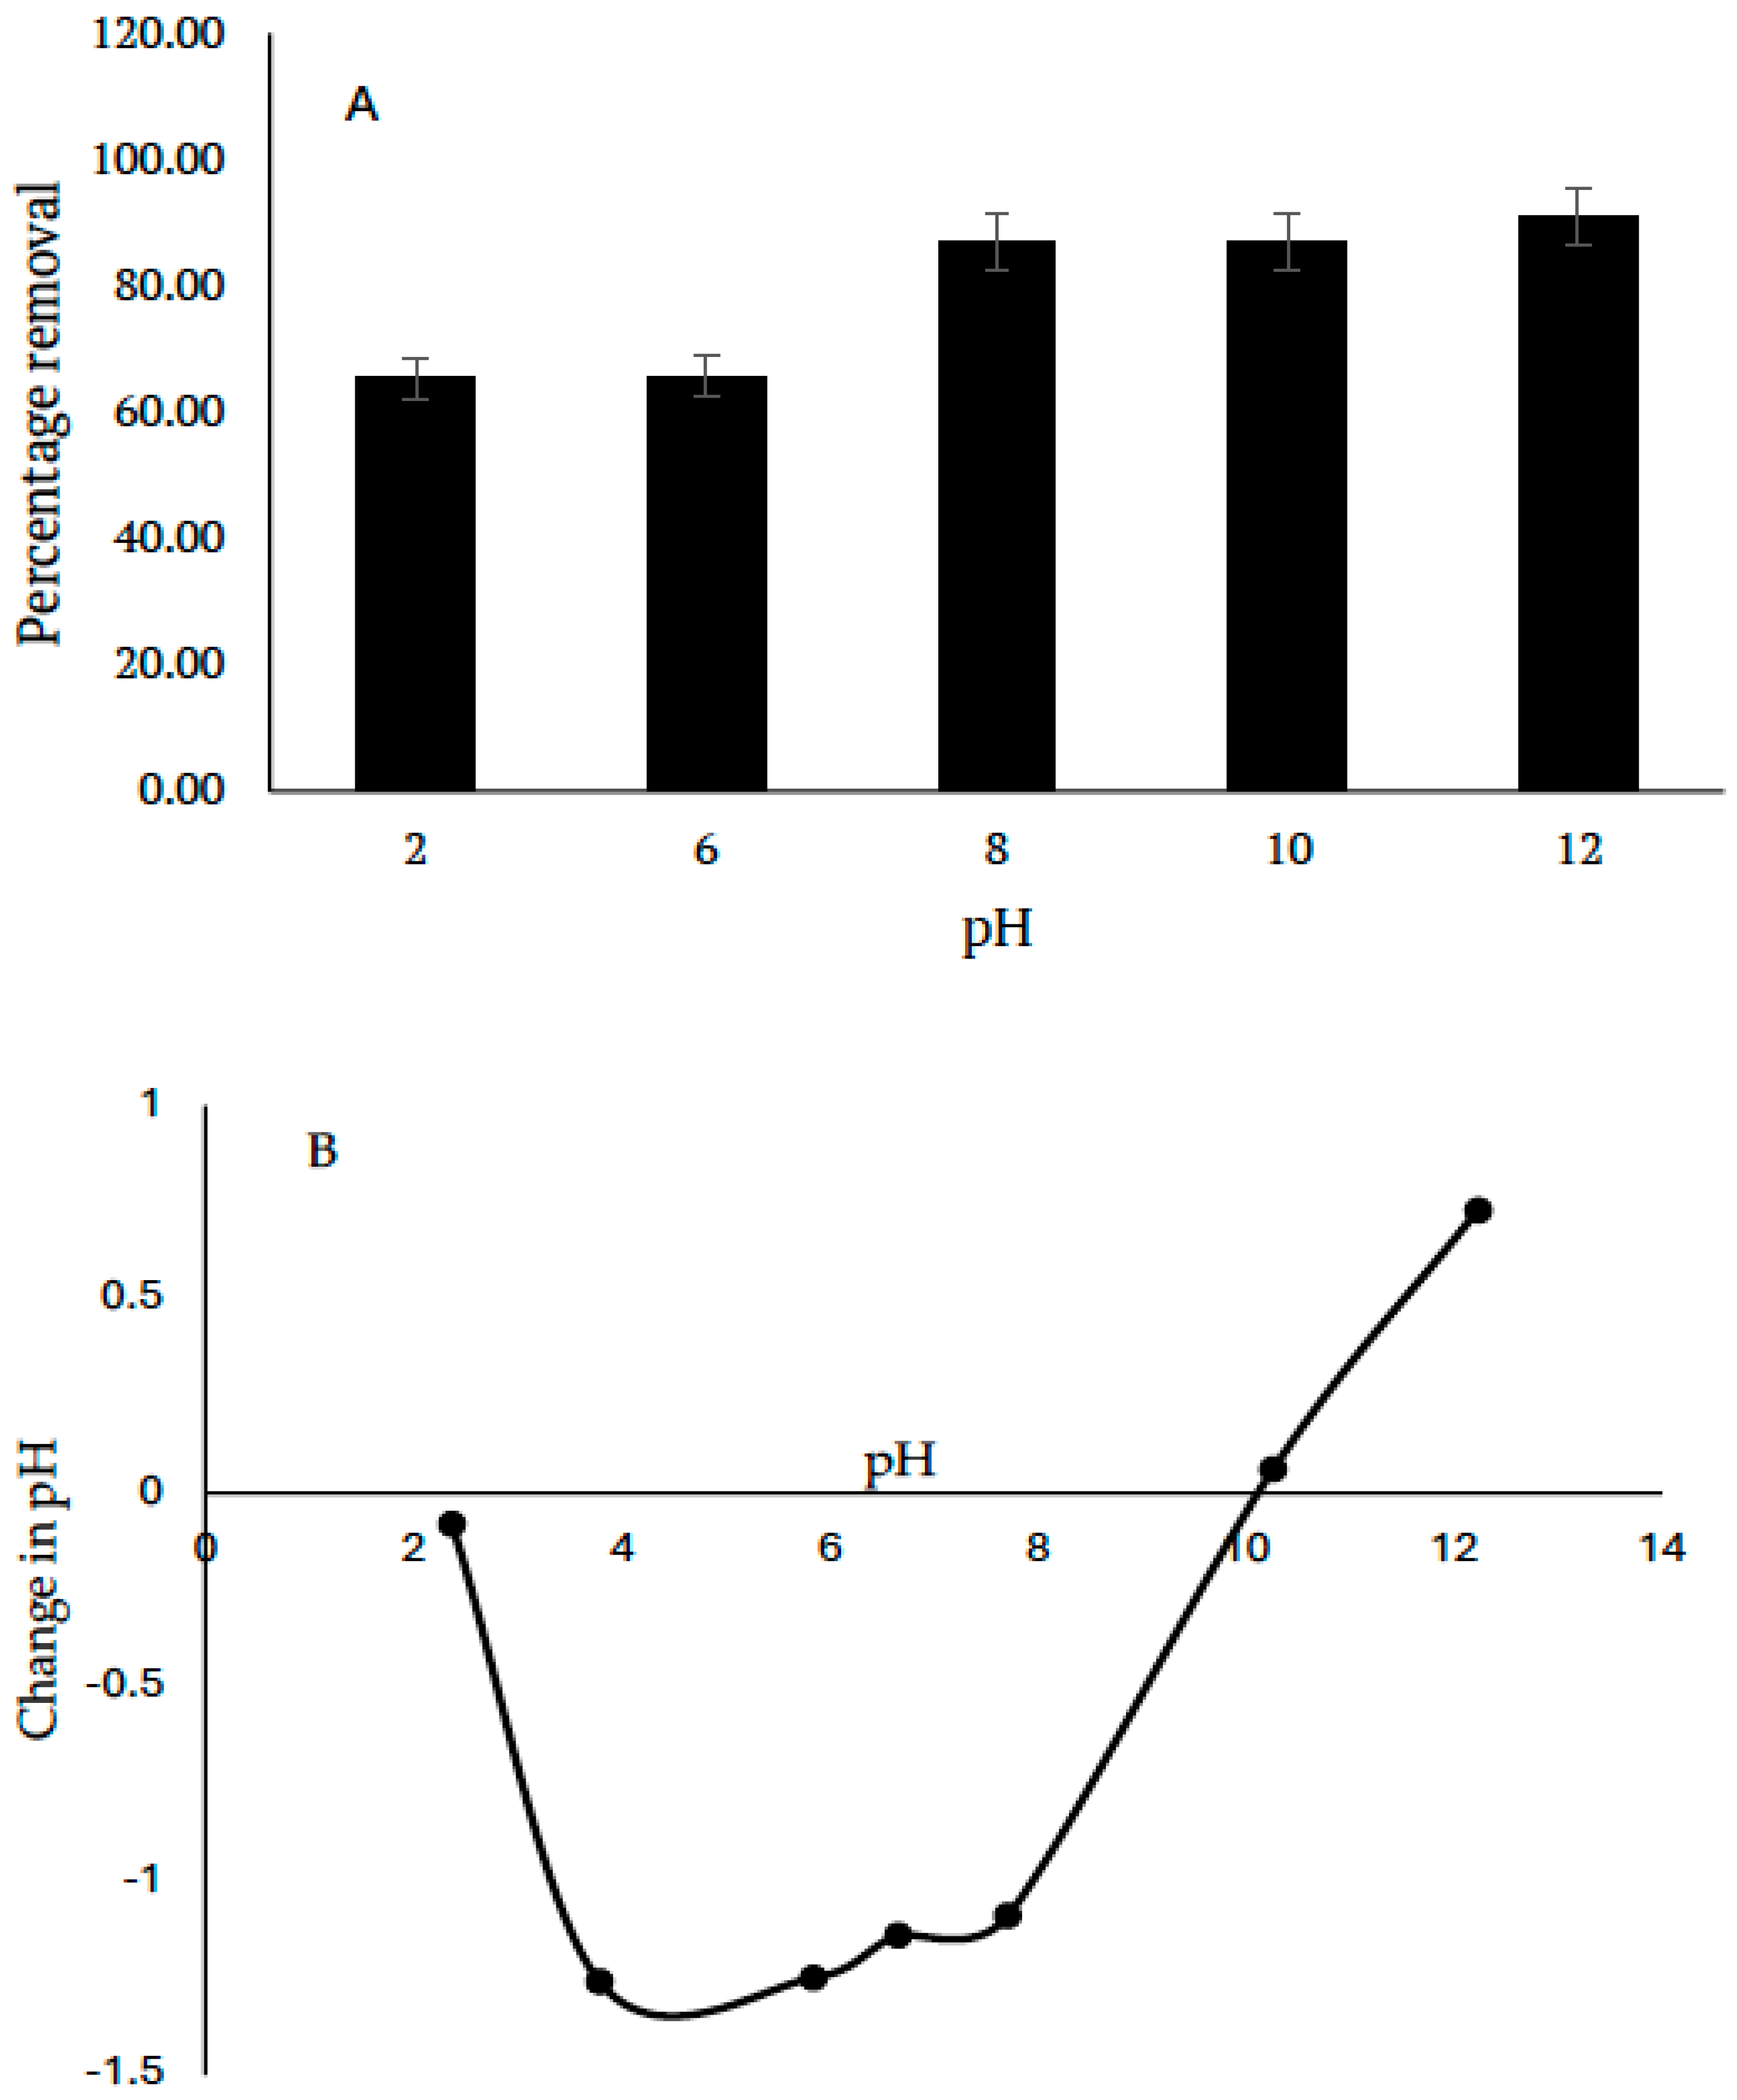
The pH of aqueous solutions usually plays a significant role in the sorption of sorbate onto sorbent. In this study, sorption was more favored in the alkaline pH range (
Figure 6A). Although CV is a cationic dye, the nature of the sorbent also contributes to its sorption. Results from the point of zero charge showed that the surface of the sorbent is positively charged up to the pH of 10.26, after which it becomes negatively charged (
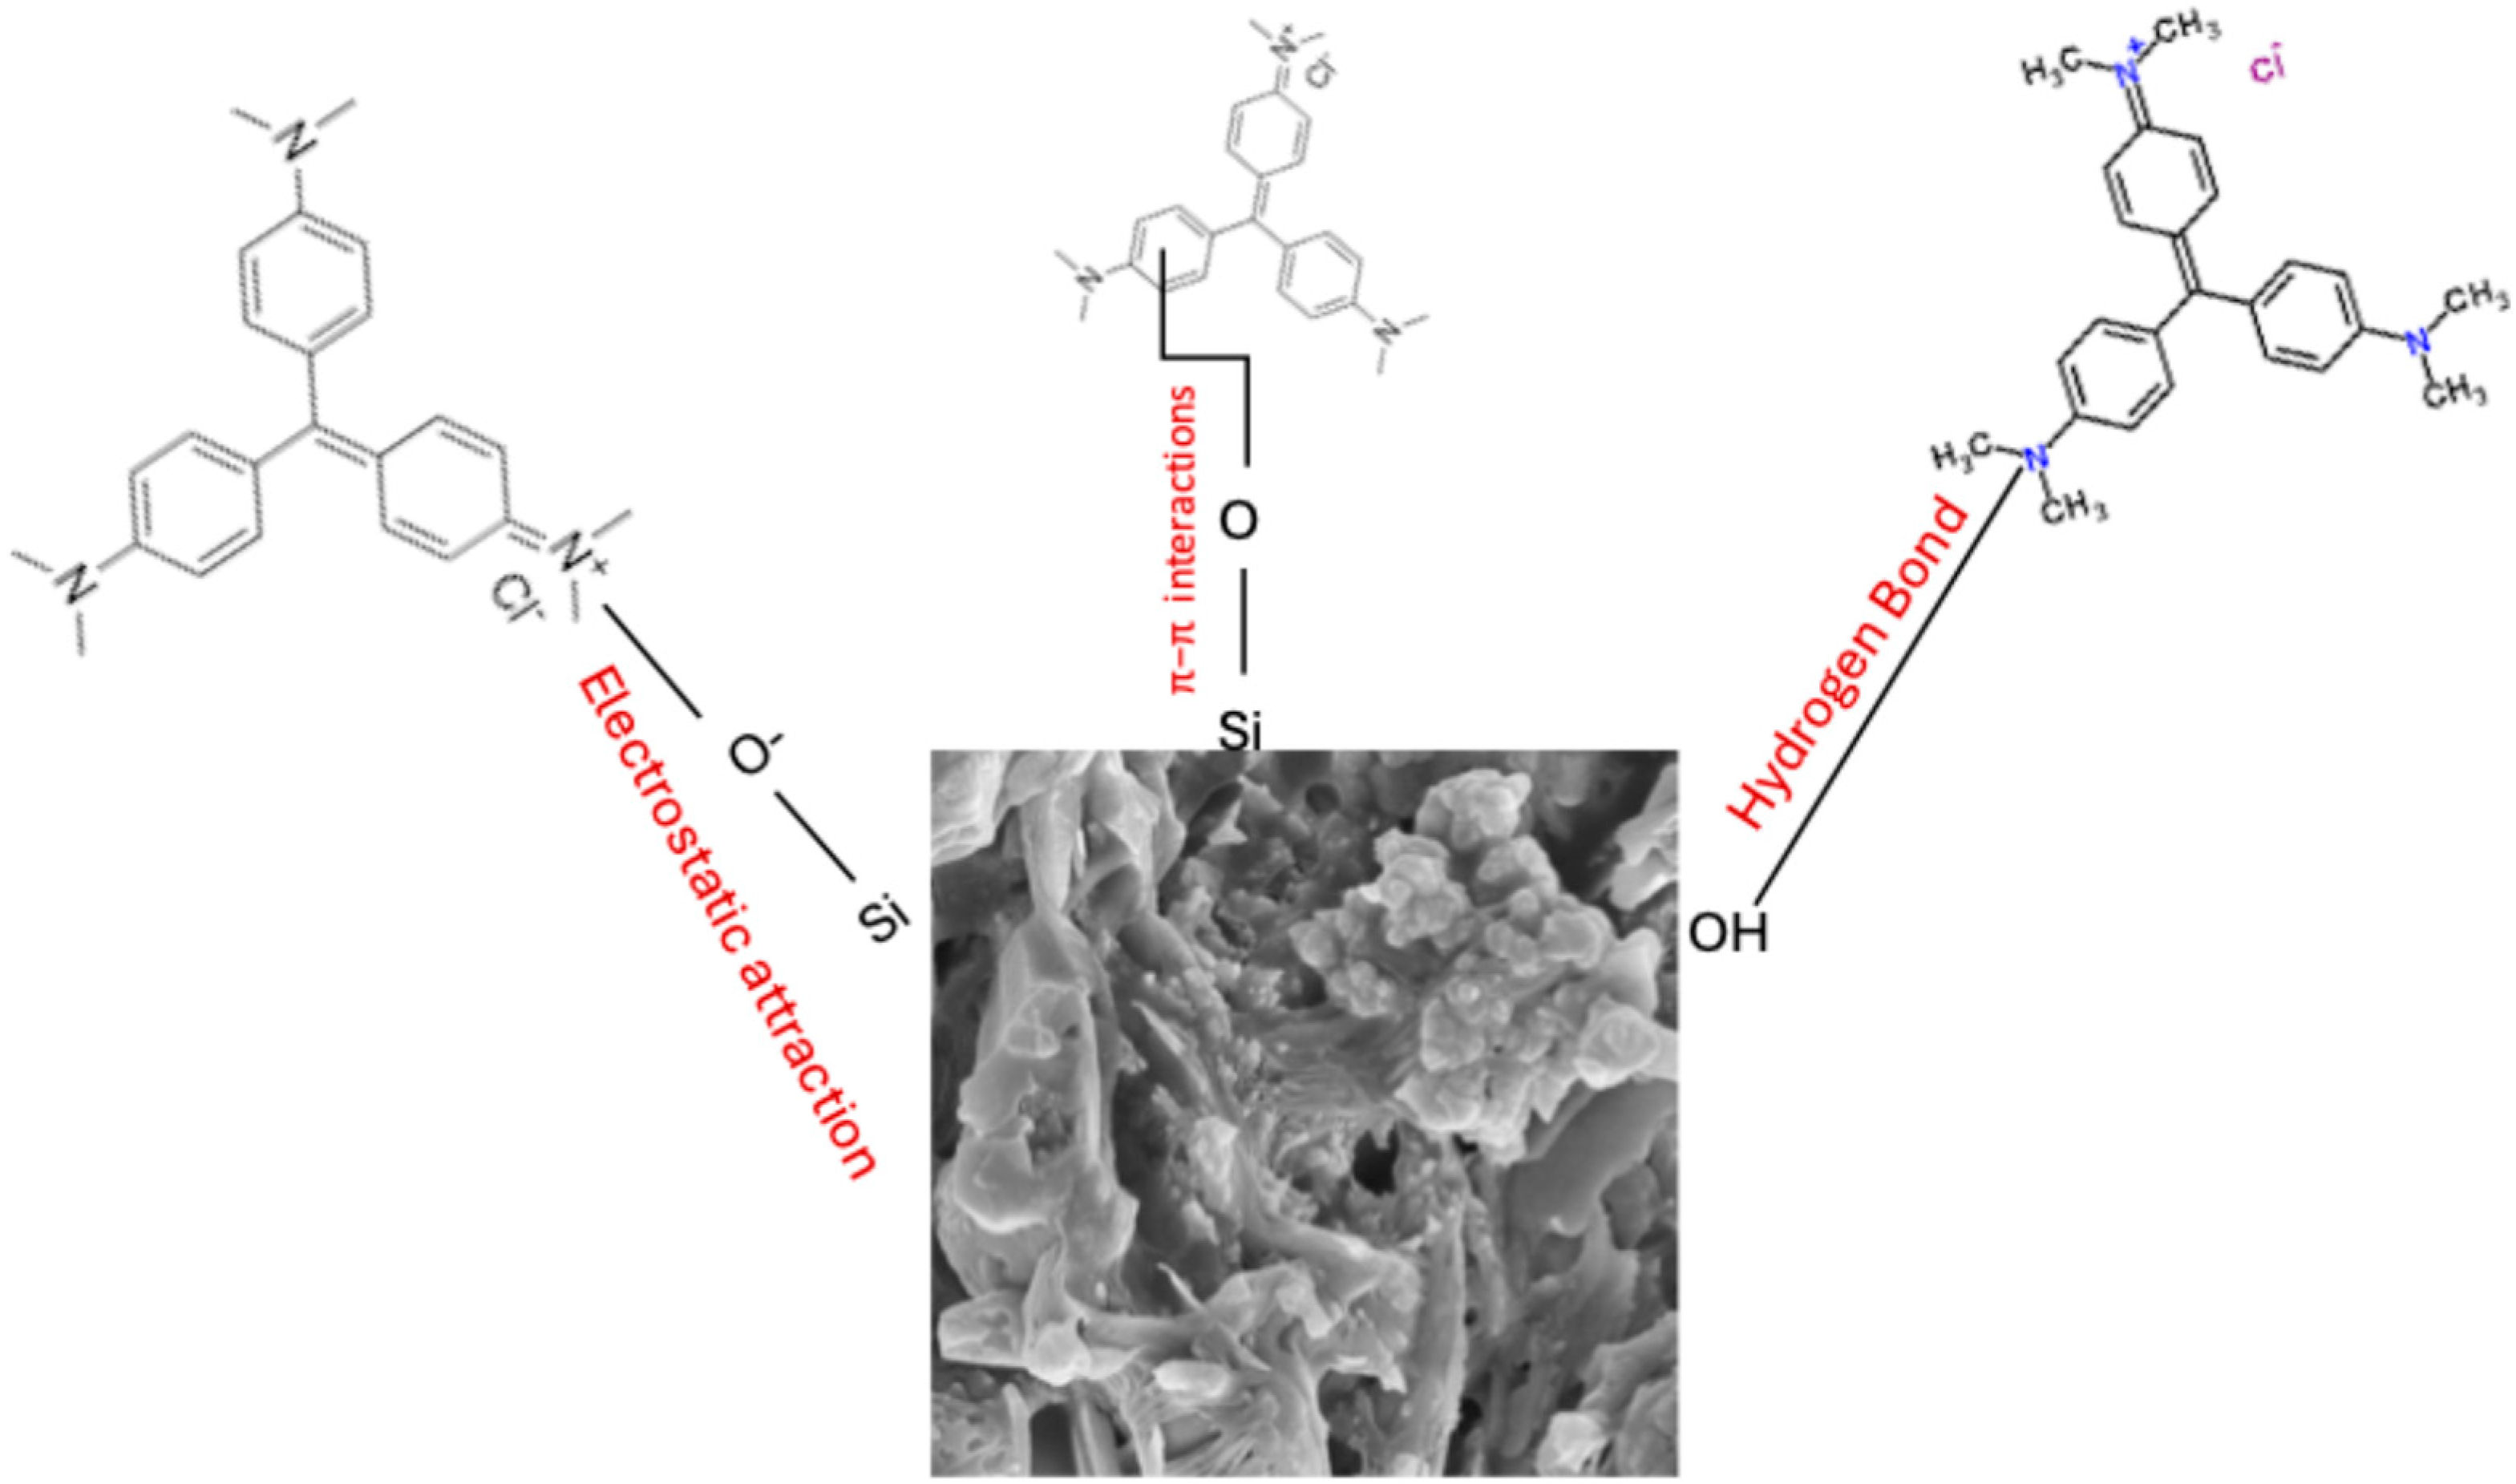
Figure 5B). This further explains why sorption was more favored in alkaline pH due to strong electrostatic attraction of the sorbent towards CV. Other forces of attraction such as hydrogen bonding and π–π stacking interactions could be responsible for the attraction of CV onto KBG at pH < PZC. It is believed that the Si–O, on the surface of the adsorbent and/or Al-OH groups may have formed hydrogen bonds with the CV molecule. CV contains several nitrogen atoms that can act as hydrogen bond acceptors, thus facilitating binding. Hence, the plausible mechanism is presented in
Figure 7.
3.1.6. Effects of Temperature
The sorption was slightly favored as the temperature increased (
Figure 8A). This could be due to the faster movements of CV as temperature increased, leading to increased diffusion onto the pores of KBG. Hence, additional energy was provided to overcome the activation barriers, leading to increased sorption. There is a possibility that the increase in temperature could have led to slight expansion of the pores of the sorbent, leading to increased capacity to accommodate the sorbate molecules. Similar findings have been largely reported for sorption studies [
1,
9,
21].
3.2. Desorption
To test for possible re-use of the sorbent, three desorbing agents were used to desorb the already adsorbed CV molecule from the surface of KBG. Hydrochloric acid was a better desorbing agent than sodium hydroxide and de-ionized water (
Figure 8B).
3.3. Kinetics of the Sorption Process
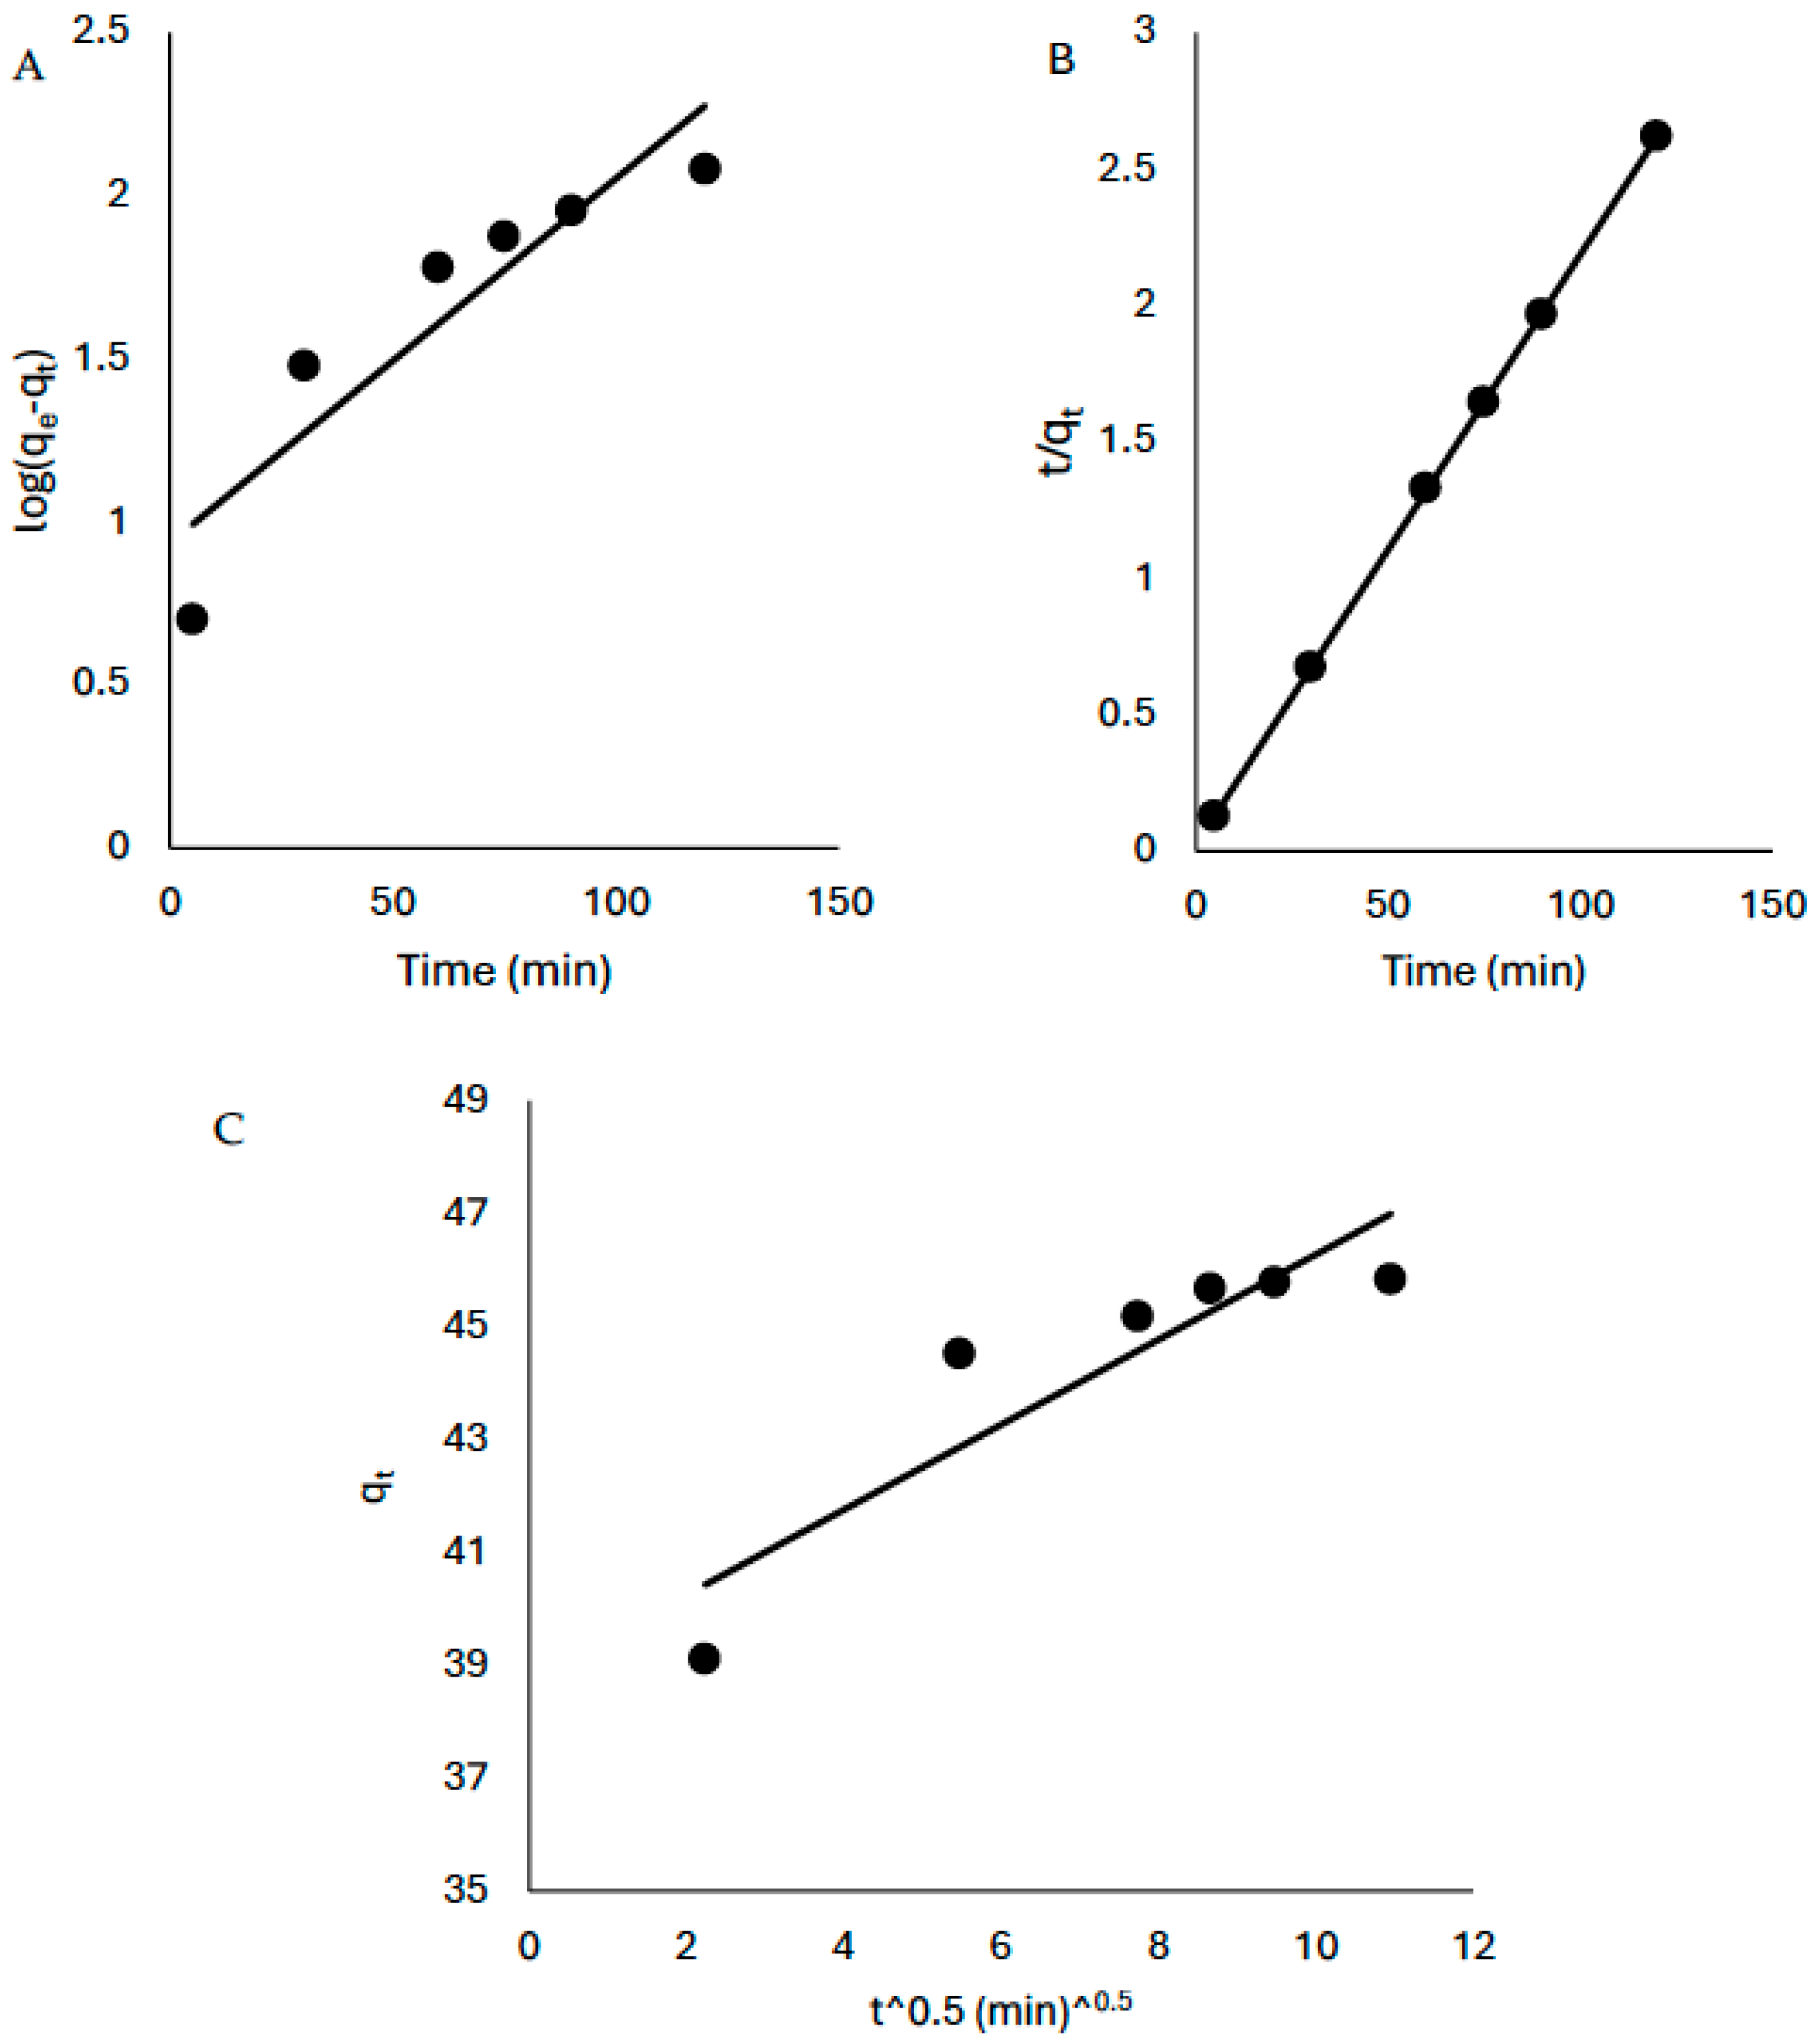
Although a positive linearized coefficient was obtained from the Lagergren plot (R
2 > 0.8), the pseudo-second-order kinetic model best described the rate of the reaction (R
2 = 1) (
Figure 9,
Table 3). Furthermore, the intra-particle diffusion plot (q
t versus t
0.5) was employed to gain insight into the mechanism of the sorption process and the rate determining step and the plot did not pass through the origin thus suggesting that the mechanisms of the sorption process is complex and the rate determining step is not based on intra-particle diffusion only.
3.4. Equilibrium
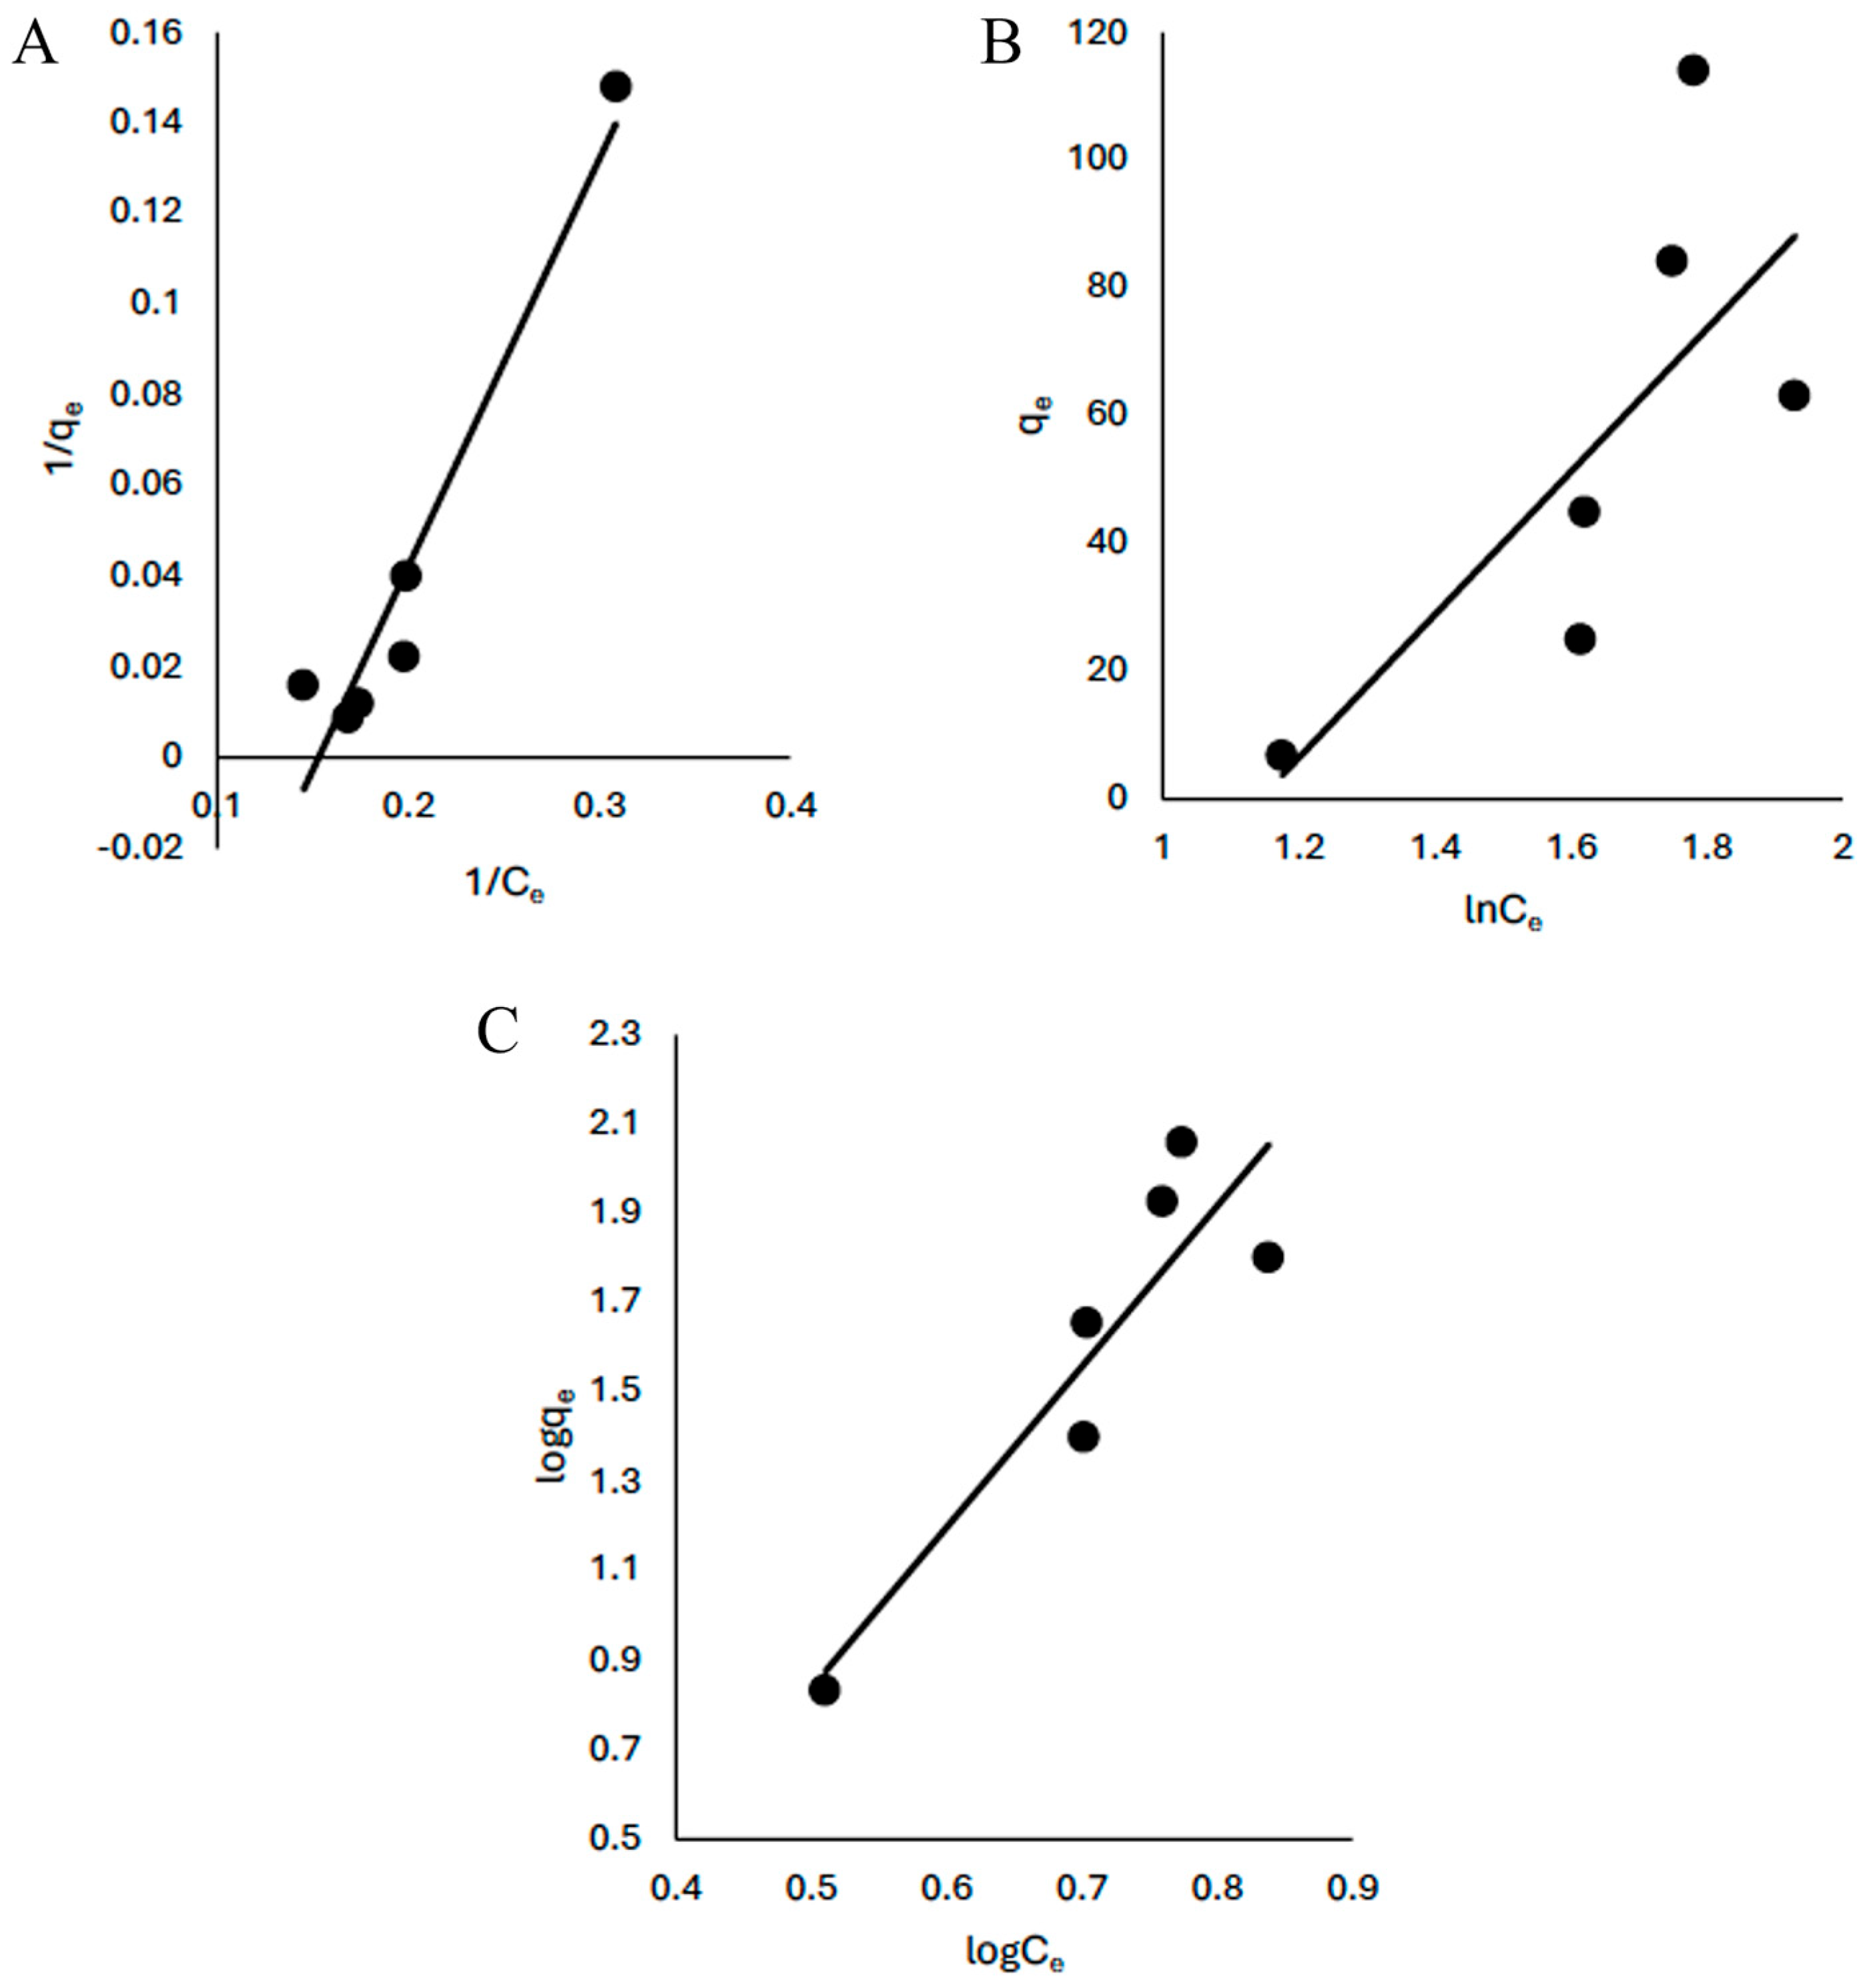
The sorption of CV onto KBG followed the Langmuir, Freundlich and Temkin models but based on the linearized coefficient, the Langmuir model (R
2 = 0.93) best described the process indicating a monolayer adsorption (
Figure 10,
Table 4). The maximum quantity of CV adsorbed was 9.72 (mg/g). This is higher than those reported by Umejuru et al. [
10] using coal fly ash geopolymer (6.0 mg/g) and Murubini et al. [
1] using vermiculite-based geopolymer (0.69 mg/g) but was lower than those reported by Hashishi et al. [
11] and Aouan et al. [
35]. The comparisons of the quantity absorbed with other closely related materials is shown in
Table 5.
3.5. Thermodynamics
The changes in Gibbs free energy (ΔG), enthalpy (ΔH), and entropy (ΔS) often describe the spontaneity of the sorption process, as well as the nature of disorderliness that occurs at the liquid–solid interface. The Van ‘t Hoff plot of ln Ko against (1/
T) gives a linear graph as shown in
Figure 11. From the values displayed in
Table 6, ∆G was negative which implies that the process is spontaneous and feasible. A positive ΔH was also recorded, supporting the results obtained for effects of time which showed an endothermic process (with ΔH = 4.70 kJ/mol). Positive ΔS was also recorded. This implies that there is increased randomness of the CV molecules onto the KBG. Similar findings have been reported from several studies in the literature [
1,
21].
4. Conclusions
Kaolin-based geopolymer (KBG) was successfully synthesized from raw kaolin and characterized using XRD, FT-IR, and SEM analyses. The results confirmed the formation of a geopolymeric network through dissolution and polycondensation reactions, leading to the transformation of crystalline kaolinite into an amorphous aluminosilicate structure. The disappearance and shifting of characteristic kaolinite peaks, together with the appearance of broad amorphous bands, confirmed a successful geopolymerization. The synthesized KBG exhibited significant potential for the adsorption of CV from aqueous solutions. Although adsorption occurred effectively at neutral pH, the optimum removal was achieved at an alkaline pH of 10.26 due to enhanced electrostatic attraction between the negatively charged geopolymer surface and the cationic dye molecules. The adsorption mechanism involved a combination of electrostatic forces, hydrogen bonding, and π–π stacking interactions. Variations in water chemistry, such as the presence of competing ions, influenced the adsorption performance, highlighting the system’s environmental sensitivity. Thermodynamic evaluations indicated that the adsorption process was spontaneous and endothermic, implying a better dye uptake at higher temperatures. Overall, the study demonstrates that KBG, due to its local abundance, low production cost, and environmental sustainability, represents a viable and efficient material for removing CV and other related organic dyes from wastewater.


