Abstract
In this work, we report the one-pot synthesis and characterization of four water-soluble 2-hydroxybenzo[e][1,2]oxaphosphinine 2-oxides. The compounds were obtained by cascade reactions of (2-ethoxyvinyl)phosphonic dichloride with phenol or naphthol derivatives, and their acid–base, structural, and photophysical properties were investigated using a combination of experimental and computational methods. These compounds exhibit UV–vis absorption maxima at 209–341 nm and fluorescence maxima at 300–394 nm. Notably, these cyclic phosphonic acids exhibit unusually strong acidity with pKa values from −1.3 to 0, comparable to mineral acids; complete protonation is not achieved even in concentrated HCl. The acidity trends and spectra were further analyzed by DFT using both explicit and implicit solvation models.
1. Introduction
Organophosphorus compounds are a large family of phosphorus-containing compounds that exhibit properties of catalysts, optical materials, chelating and extraction agents, and biologically active chemicals [1,2]. The phosphonic acid RP(O)(OH)2 has two acidic OH groups. When R is an aromatic group, the first pKa ranges from ca 1.1 to 1.7, rendering these compounds moderately acidic [3]. Because the organic group can be changed in a modular and systematic way, such compounds have been widely used to design Brönsted acid catalysts. Besides the well-known Akiyama-Terada catalysts, novel classes of phosphorus-acid-based catalysts continue to emerge, highlighting ongoing interest in the application of phosphonic acid derivatives in this area [4,5,6].
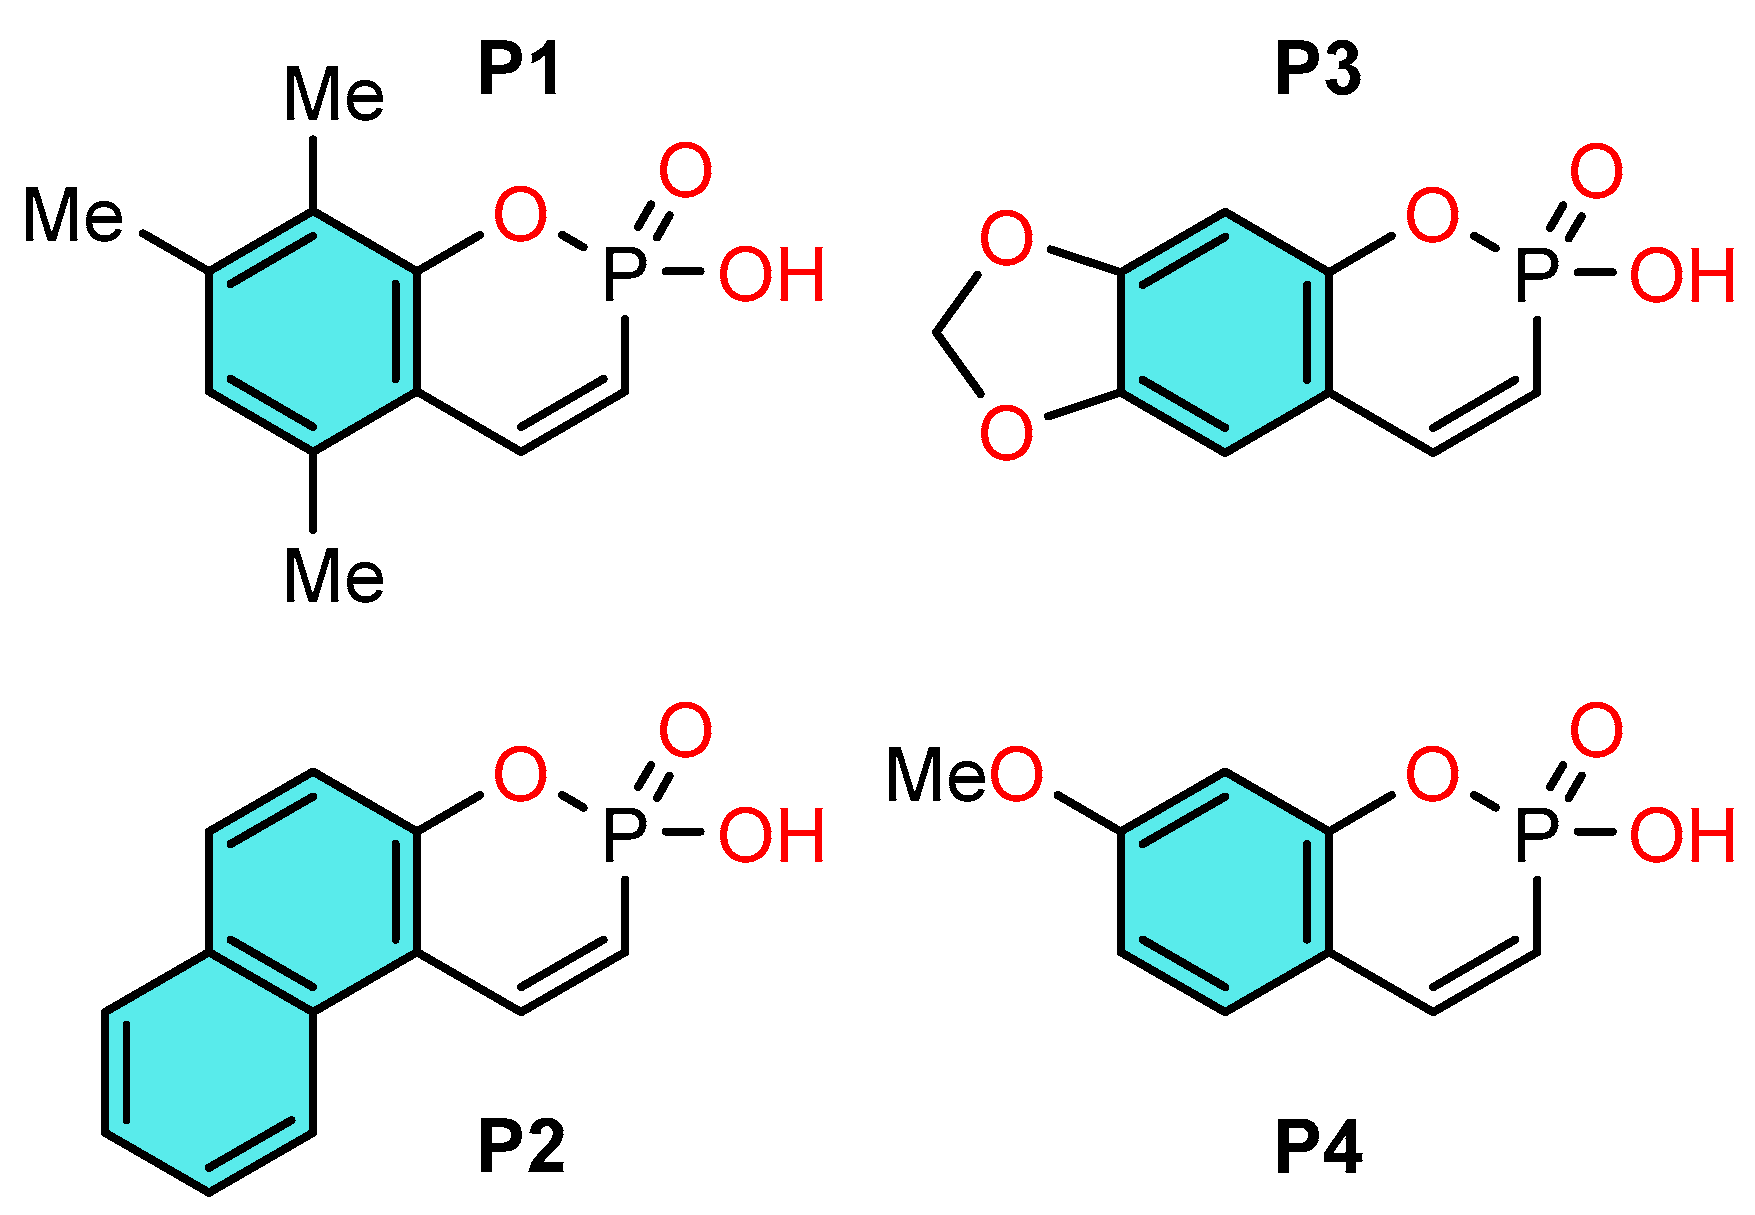
We have previously developed a one-pot synthesis of some phosphocoumarins [7,8], a promising class of condensed cyclic phosphonic acids characterized by unique reactivity and promising biological properties: inhibition of cholesterol esterase [9], of protein tyrosine phosphatase SHP-1 [10], which is of interest from the point of view of creating antidiabetic drugs, their antibacterial activity [11] and cytotoxicity towards cancer cell lines [12,13] are also known. In our study [14] of a new reaction of phosphoralkylation of various phenols, aromatic hydrocarbons 2-hydroxy-5,7,8-trimethylbenzo[e][1,2]oxaphosphinine 2-oxide, which occurs according to the Friedel-Crafts reaction type, we found that this reaction is realized only in the presence of trifluoroacetic acid, which was used as a catalyst and solvent. It is known that one of the important conditions of the Friedel-Crafts reaction is the use of very strong acids of various types and their compositions. In our case, trifluoroacetic acid is an acid of medium strength, and since the reaction proceeds successfully, the question arose: what is the strength of this cyclic phosphonic acid that it creates such a synergistic effect of enhancing the acidity of the system? Given the presence of an acidic proton [14], we sought to investigate the acid-base behavior of cyclic phosphonic acid. Understanding these properties not only explains their reactivity in acidic media but also serves as a basis for the development of new Brønsted acid catalysts. Recently, we have demonstrated the effectiveness of the Cox-Yates method [15] for the determination of acidic parameters of phosphoric acid in strongly acidic media [16]. Thus, the aim of this work was a synthesis of derivatives of phosphacoumarins and study their acid-base properties in aqueous solution. For this study, we selected a series of phosphocoumarins synthesized by a new method, presented in Scheme 1.
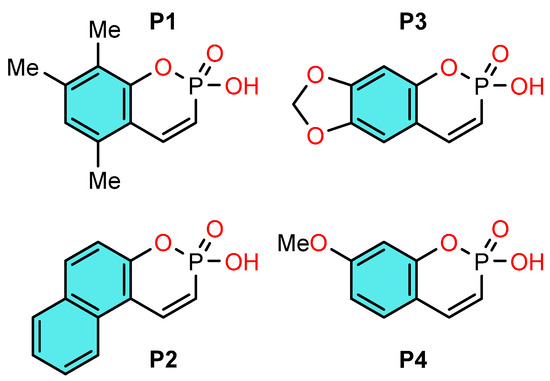
Scheme 1.
Structures of synthesized phosphocoumarins P1–P4.
2. Materials and Methods
2.1. Chemicals Used
All chemicals for the study of equilibrium processes in solution were purchased from commercial suppliers and used without further purification: aminoacetic acid (≥99%), hydrochloric acid (≥99.9%, ChimReact, Nizhniy Novgorod, Russia), acetic acid (≥99.9%, ReaChim, Moscow, Russia), sodium hydroxide (≥98%, ReaChim, Moscow, Russia), and sodium chloride (≥99%, ReaChim, Moscow, Russia). Buffer solutions were prepared as follows: glycine (98%, ChRS, Ufa, Russia)–HCl for pH 1.80–3.60, CH3COOH–CH3COONa(98%, ChRS, Ufa, Russia) for pH 3.60–5.60, and Tris(98%, ChRS, Ufa, Russia)–HCl for pH 7.00–8.00. For solutions with pH < 2, acidity was adjusted using hydrochloric acid. The concentration of HCl was determined by titration with a standardized Na2CO3 (99%, ChRS, Ufa, Russia) solution. For FTIR spectroscopy FTIR Grade Potassium Bromide (KBr, ICL, Garfield, NJ, USA) was used.
2.2. Synthesis of Compounds
2-Hydroxybenzo[e][1,2]oxaphosphinine 2-oxides P1–P4 were obtained by cascade reactions of (2-ethoxyvinyl)phosphonic dichloride (97.5%, IOPC, Kazan, Russia) with phenol (98%, IOPC, Kazan, Russia) or naphthol (98%, DAlChIM, Nizhniy Novgorod, Russia) derivatives (Scheme 2).

Scheme 2.
Synthesis of 2-hydroxybenzo[e][1,2]oxaphosphinine 2-oxides P1–P4.
General procedure for the synthesis of compound P1–P4
(2-Ethoxyvinyl)phosphonic dichloride (1.00 g, 5.3 mmol, 97.5%, IOPC, Kazan, Russia) was dissolved in benzene (25 mL, 99%, ECOS-1, Moscow, Russia) and cooled in a water bath (t = 5–8 °C) under argon atmosphere (99.99%, TechnoRemStroy, Kazan, Russia) with vigorous stirring. A solution of the appropriate phenol (5.3 mmol, 98%, IOPC, Kazan, Russia) and triethylamine (0.53 g, 5.3 mmol, 99.5%, Prime Chemical Group, Moscow, Russia) in benzene (5 mL, 99%, ECOS-1, Moscow, Russia) was added dropwise. The reaction mixture was then allowed to warm to room temperature (t = 23 °C) and stirred until a precipitate of triethylammonium chloride formed, which was removed by filtration. Trifluoroacetic acid (1 mL, 99.5%, SRL, New Mumbai, India) was added to the filtrate. The mixture was stirred for 15 h at room temperature (t = 23 °C), after which the formed crystalline precipitate was filtered, washed with diethyl ether (99%, Chimprom-M, Noscow, Russia), and dried to constant weight.
2-Hydroxy-5,7,8-trimethylbenzo[e][1,2]oxaphosphinine 2-oxide P1 [7]
Yield 0.99 g (83%), white powder. Melting point 208 °C. 1H NMR (DMSO-d6, 600 MHz): 2.14 (s, 3H, CH3), 2.24 (s, 3H, CH3), 2.34 (s, 3H, CH3), 6.24 (dd, J = 13.0 Hz, J = 21.2 Hz, 1H), 6.85 (s, 1Harom), 7.55 (dd, J = 12.8 Hz, J = 42.8 Hz, 1H).
31P NMR (DMSO-d6, 250 MHz): 5.17;
13C NMR (DMSO-d6, 150 MHz): 97.53 (s, CH3), 97.69 (s, CH3), 97.85 (s, CH3), 112.31 (s), 113.45 (s), 117.20 (d, JCP = 17.0 Hz, C-4), 123.43 (d, JCP = 6.0 Hz), 126.22 (s), 133.52 (s), 139.40 (s), 139.52 (s), 150.20 (d, JCP = 9.0 Hz, C-6).
FTIR (KBr): 3450 (OH stretch), 3040 (C-Haromatic stretch), 2560 (broad, weak, O-H overtone), 2270 (P=O combination bands), 1630–1560 (C=Caromatic stretch), 1460 (C-H bending of ring deform), 1400 (C-H bending), 1320 (C-O stretch or ring def), 1232 (C-O stretch), 1225 (P=O stretch), 1070 (P-O-C stretch), 1000 (C-Harom out-of-plane).
3-Hydroxynaphtho[1,2-e][1,2]oxaphosphinine 3-oxide P2
Yield 0.60 g (50%), white powder. Melting point 230 °C. Find (%): С 62.30; Н 3.68; Р 13.02. С12H9O3P. Calc. (%): С 62.07; Н 3.88; Р 13.66. GS-MS (MALDI-TOF, m/z): 232.58 [M]+, 272.61 [М + К]+.
1H NMR (DMSO-d6, 600 MHz): 6.46 (dd, J = 12.5 Hz, J = 20.0 Hz, 1H), 7.35 (d, J = 9.0 Hz, 1Harom), 7.50 (t, J = 7.5 Hz, 1Harom), 7.61 (t, J = 7.5 Hz, 1Harom), 7.94 (d, J = 8.2 Hz, 1Harom), 7.98 (d, J = 8.2, 1Harom), 8.27 (dd, J = 12.5 Hz, J = 42.0 Hz, 1Harom), 8.34 (d, J = 8.2 Hz, 1H), 10.47 (br.s, 1H, OH);
31P NMR (DMSO-d6, 250 MHz): 4.83;
13C NMR (DMSO-d6, 150 MHz): 114.51 (d, JCP = 18.7 Hz, C-3), 116.56 (d, JCP = 168.0 Hz, C2-P), 119.64 (d, JCP = 6.7 Hz, C-4), 122.61 (C-6), 125.63 (C-7), 126.60 (C-8), 128.29 (C-9), 130.14 (C-5), 130.64 (C-10), 132.15 (C-11), 137.48 (C-12), 150.75 (d, JCP = 9.0 Hz, C-13).
FTIR (KBr): 3446 (OH stretch), 3055 (C-Haromatic stretch), 2580 (broad, weak, O-H overtone), 2272 (P=O combination bands), 1630–1560 (C=Caromatic stretch), 1460 (C-H bending of ring deform), 1400 (C-H bending), 1329 (C-O stretch or ring def), 1228 (C-O stretch), 1213 (P=O stretch), 1068 (P-O-C stretch), 1003 (C-Harom out-of-plane).
2-Hydroxy-[1,3]dioxolo[4′,5′:4,5]benzo[1,2-e][1,2]oxaphosphinine 2-oxide P3
Yield 0.78 g (65%), brown powder. Melting point 242 °C. Find (%): C 47.87; H 3.07; P 13.71. С9H7O5P. Calc. (%): С 47.81; Н 3.12; Р 13.7. GS-MS (MALDI-TOF, m/z): 226 [M]+; 227 [M + H]+; 249 [M + Na]+; 265 [M + K]+.
1H NMR (DMSO-d6, 600 MHz): 6.03 (s, 2H, O-CH2-O), 6.13 (dd, J = 12.5 Hz, J = 20.0 Hz, 1H), 6.83 (s, 1Harom), 7.00 (s, 1Harom), 7.24 (dd, J = 12.5 Hz, J = 42.0 Hz, 1Harom), 9.81 (br. s, 1H, OH);
31P NMR (DMSO-d6, 250 MHz): 6.21;
13C NMR (DMSO-d6, 150 MHz): 100.65 (d, JCP = 7.5 Hz, C-4), 102.40 (s, OCO), 108.10 (C-8), 113.53 (d, JCP = 168.0 Hz, C2-P), 114.54 (d, JCP = 20.0 Hz, C-3), 141.96 (C-5), 143.60 (C-6), 147.76 (C-7), 149.40 (C-9).
FTIR (KBr): 3420 (OH stretch), 3049 (C-Harom stretch), 2967 (C-Haliphatic asymmetric stretch), 2845 (C-Haliphatic sym stretch), 1623 (C=Caromatic stretch), 1380 (C-H), 1319 (C-O stretch), 1251, 1230, 1192 (P=O stretch + C-Oaromatic stretch), 1168 (P=O stretch), 1140–1100 (P-O-C stretch), 1026, 1002 (C-O stretch), 850–800 (C-Haromatic out-of-plane).
2-Hydroxy-7-methoxybenzo[e][1,2]oxaphosphinine 2-oxide P4 [17]
Yield 0.84 g (75%), white powder. Melting point 159 °C. 1H NMR (DMSO-d6, 600 MHz): 3.76 (s, 3H, OCH3), 6.1 (dd, J = 12.5 Hz, J = 20.0 Hz, 1H), 6.68–6.76 (m, 2Harom), 7.25–7.39 (m, 2Harom), 9.53 (br.s, 1H, OH).
31P NMR (DMSO-d6, 250 MHz): 5.91;
13C NMR (DMSO-d6, 150 MHz): 56.14 (OCH3), 104.04 (d, JCP = 6.8 Hz, C-4), 110.45 (C-8), 113.21 (d, JCP = 168.0 Hz, C-2), 114.80 (С-3), 131.20 (C-6), 141.80 (C-5), 153.25 (С-9), 161.67 (C-7).
FTIR (KBr): 3441 (OH stretch), 3059 (C-Harom stretch), 2915 (C-Haliph stretch), 2582 (overtone or P-H), 2291 (overtone P-O stretch), 1630–1500 (C=Carom stretch), 1482 (C-H bending), 1260–1200 (C-O-C stretch), 1157 (P=O stretch), 1130–1060 (P-O-C stretch), 1034 (C-O methoxy stretch), 1000 (C-Harom out-of-plane).
2.3. FTIR Spectroscopy
A Tensor 27 Fourier-transform infrared spectrometer (Bruker, Billerica, MA, USA) was used for recording FTIR spectra in the range of 4000–600 cm−1 with a resolution of 4 cm−1 and 32 scans in potassium bromide (FTIR grade) at room temperature. Spectra are available in the Supplementary Materials (Figure S1).
2.4. NMR Measurements
The 1H, 13C{1H} and 31P{1H} NMR spectra were acquired on an AVANCE III 600 NMR spectrometer (Bruker, Billerica, MA, USA) equipped with a 5 mm probe. For analysis, each compound (15 mg) was dissolved in 0.7 mL of DMSO-d6. The two-dimensional 1H-13C-HSQC and 1H-13C-HMBC correlation maps were obtained using a pulse program package by Bruker library. All spectra were measured at room temperature in DMSO-d6 solution. Chemical shifts are given relative to the d-solvent signal. For 31P, chemical shifts are shown referenced to the H3PO4 signal as an external standard. All spectra were processed using TopSpin 3.2 software (Bruker, Billerica, MA, USA). Spectra are available in the Supplementary Materials (Figures S2–S19).
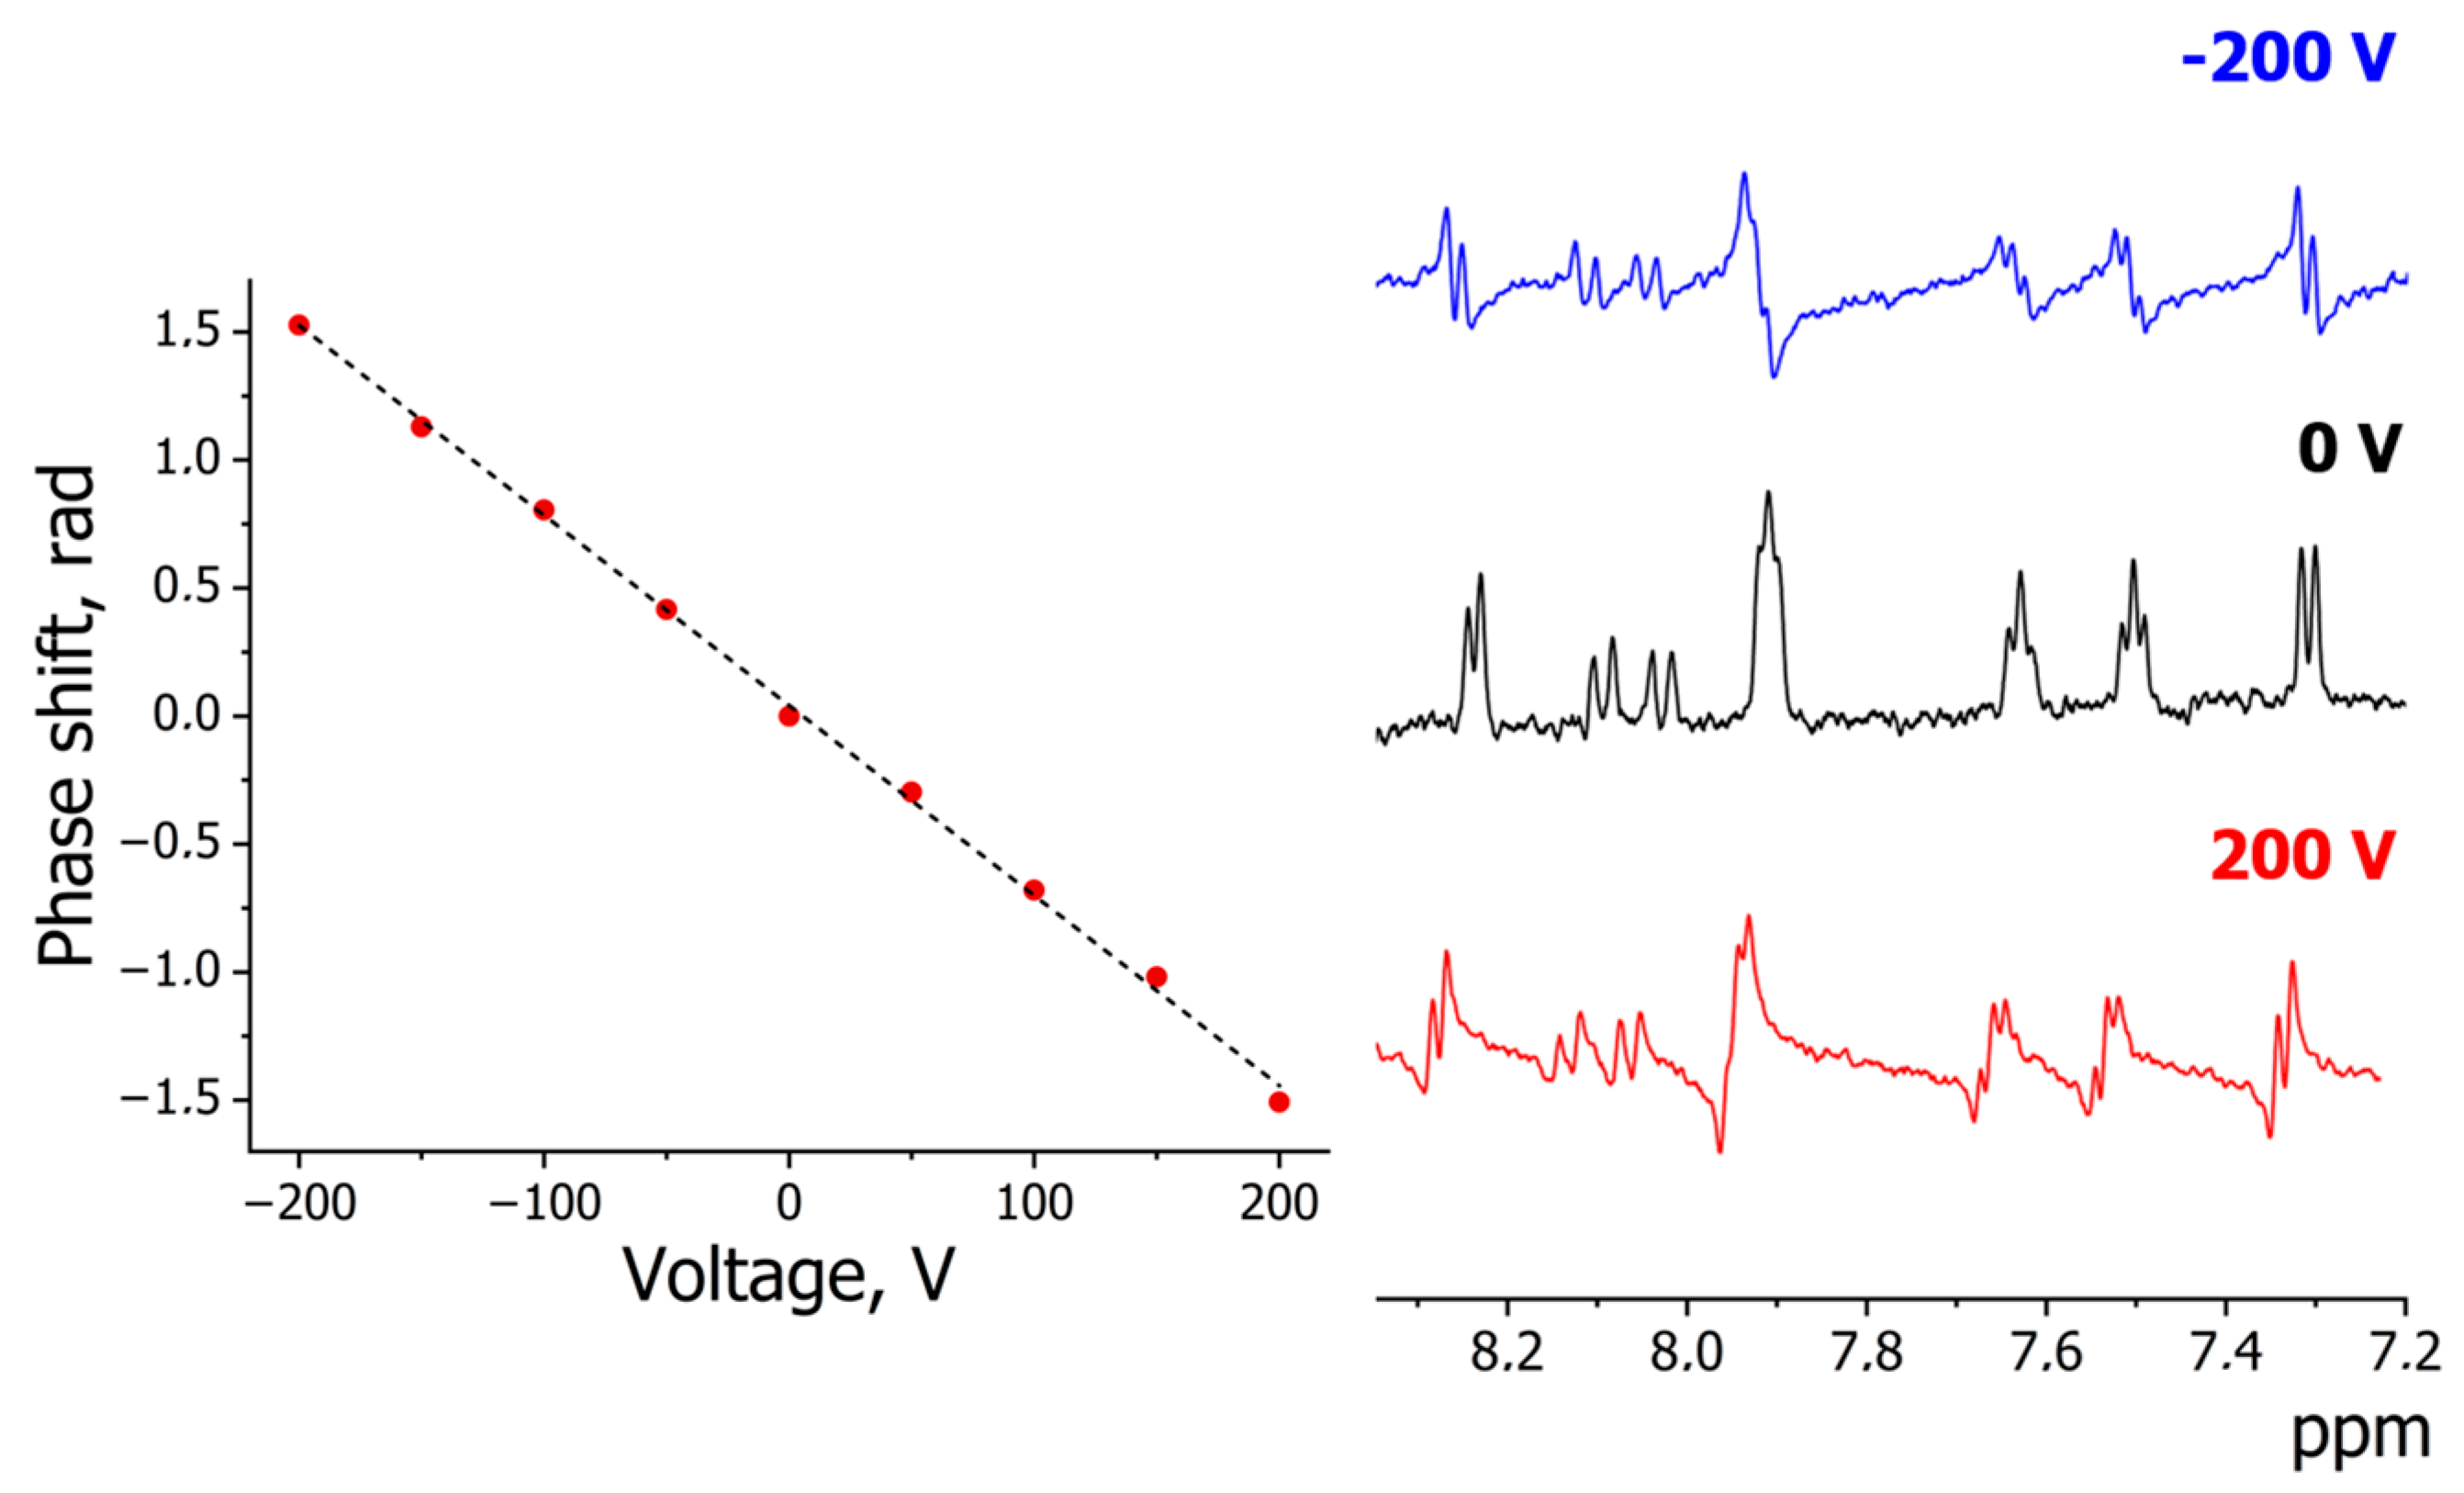
The electrophoretic NMR experiments (eNMR) were performed by incrementing the electric field in 8 steps between −200 V/cm and +200 V/cm. The samples were blown with a gas flow to minimize convection by Joule heating of the sample. The diffusion time Δ was 0.1 s, the gradient pulse duration δ was 2 ms, and the applied magnetic field gradient was 0.24 T/m. The phase shift values were corrected for the solvent shift to eliminate the influence of convection within the sample. A double stimulated echo pulse field gradient sequence with a diffusion time of 0.1 s and a gradient pulse duration of 2 ms was applied for 32 gradient values.
2.5. Steady-State and Time-Resolved Spectral Measurements
To measure absorption spectra in the range of 200–450 nm with a slit width of 1 nm, a 3600 Plus scanning spectrophotometer (Shimadzu, Kyoto, Japan) equipped with a double monochromator, and a one-centimeter quartz cell was used for the detection of electronic absorption spectra. The cell temperature (298 ± 0.1 K) was maintained by a TCC-100 thermoelectrically temperature-controlled cell holder (Horiba Scientific, Edison, NJ, USA). The pH meter “F20” (Mettler Toledo, Columbus, OH, USA) was used for the determination of the acidity level. The concentration of the studied solutions was 1 × 10⁻⁵ M.
The steady-state excitation and fluorescence spectra, as well as fluorescence time-resolved decays, were recorded using a Fluorolog 3–22 spectrofluorometer (Horiba Scientific, Edison, NJ, USA) with a DeltaHub module (Horiba Scientific, Edison, NJ, USA), operating in the time-correlated single photon counting, to obtain the lifetimes. In addition, spectral measurements were performed using an impulse spectrofluorometer “Fluo-rat-02-Panorama” (Lumex, Saint-Petersburg, Russia) with an external double monochromator.
The fluorescence and excitation spectra were corrected for reabsorption, detection system sensitivity, and solvent background. Standard 10 × 10 mm quartz cells were used to study aqueous solutions in L-excitation geometry. All measurements were performed at room temperature.
For the excitation of time-resolved fluorescence, we used a NanoLED N-295 pulse diode (Horiba Scientific, Edison, NJ, USA) with a maximum at a wavelength of 296 nm, and the pulse duration was <1.2 ns. The fluorescence lifetimes were measured from the decays using the deconvolution procedure in the DAS6 program (Horiba Scientific, Edison, NJ, USA).
2.6. Calculation of Dissociation Constant
The process of mono-deprotonation of the neutral form of phosphacoumarins to an anion (in a strongly acidic solution) was studied:
The dissociation constant (Кa) was determined based on a set of absorption spectra for each compound at varying pH values. A F20 pH meter (Mettler Toledo) was used to obtain acidity. The value of Кa of the reaction (1) was calculated using the non-linear Cox–Yates method [15] with the excess acidity function χ [18] in strongly acidic solutions (m* is the solvation coefficient):
where Ai, AHL, and AL− are the absorbance of the current solution, the neutral compounds, and their conjugate base, respectively. The optimized values of dissociation constants were determined from the least squares analysis [19] (Ki = Ka):
The coefficient of determination (R2) was at least 0.97 for all spectrophotometric measurements. The “±” values represent confidence intervals (P = 0.95) throughout the article. Absorption matrices and the absorbance values for single wavelength are presented in the Supporting Information. Calculations of all equilibrium constants and molar extinction coefficients were performed using the GNU Octave software package (8.4.0, Free Software Foundation, Boston, MA, USA) [20].
2.7. Electronic Structure Calculations
Ab initio simulations were carried out using the GAMESS US [21] program package on the MVS-1000M cluster of the Institute of Computational Modeling SB RAS. Quantum-chemical estimations were computed with a temperature of 298 K. The optimization of geometry was performed by density functional theory (DFT-D3) with the hybrid Perdew–Burke–Ernzerhof (PBE0) density functional [22] under Grimme’s empirical correction [23]. The full-electron cc-pVDZ [24] basis set functions were used for C, O, and H atoms. For the P atom, the CRENBL effective core potential [25] was applied for calculations. The choice of the method was according to data about the efficiency of hybrid functionals and correlation-consistent double-zeta basis set functions to conjugated systems [26,27]. The Gibbs free energy of dissociation (∆Gaq) was calculated taking into account three parts: energy in the gas phase (∆Ggas), the free energy of the solvation (δ∆Gsolv), and zero-point energy with thermal correction (∆EZPE) [28]:
logKcalc = −∆Gaq/2.303RT,
∆Gaq = ∆Ggas + δ∆Gsolv + ∆Ezpe + (ΔP)ΔG0→* + Ecorr,
Ecorr = −(ΔP)RTln([H2O]).
Here, Ecorr is the change in free energy associated with the movement of the solvent from of the standard-state solution phase concentration of 1 M to the standard state of the pure liquid at 55.34 M [29]; ΔG0→* is the correction relates with condensation of one mole from the gas phase at the standard condition of one atmosphere (24.46 L/mol) to solution at the standard state of one mole per liter [30]; ΔG0→* = RTln(24.46 L/mol) = 1.89 kcal/mol at 298 K; ΔP is the difference between the number of species during the dissociation reaction. The zero-point energy corrections were estimated from the results of normal mode analysis of the complexes in the gas phase. The solvation long-range effects were evaluated using the SMD solvation model [31].
The maximum wavelengths of ultraviolet absorption spectra of compounds were reproduced from the vertical excitation energies for the first 15 singlet excited states by Time-Dependent Density Functional Theory (TD-DFT) [32].
3. Results and Discussion
3.1. Spectral and Photophysical Properties
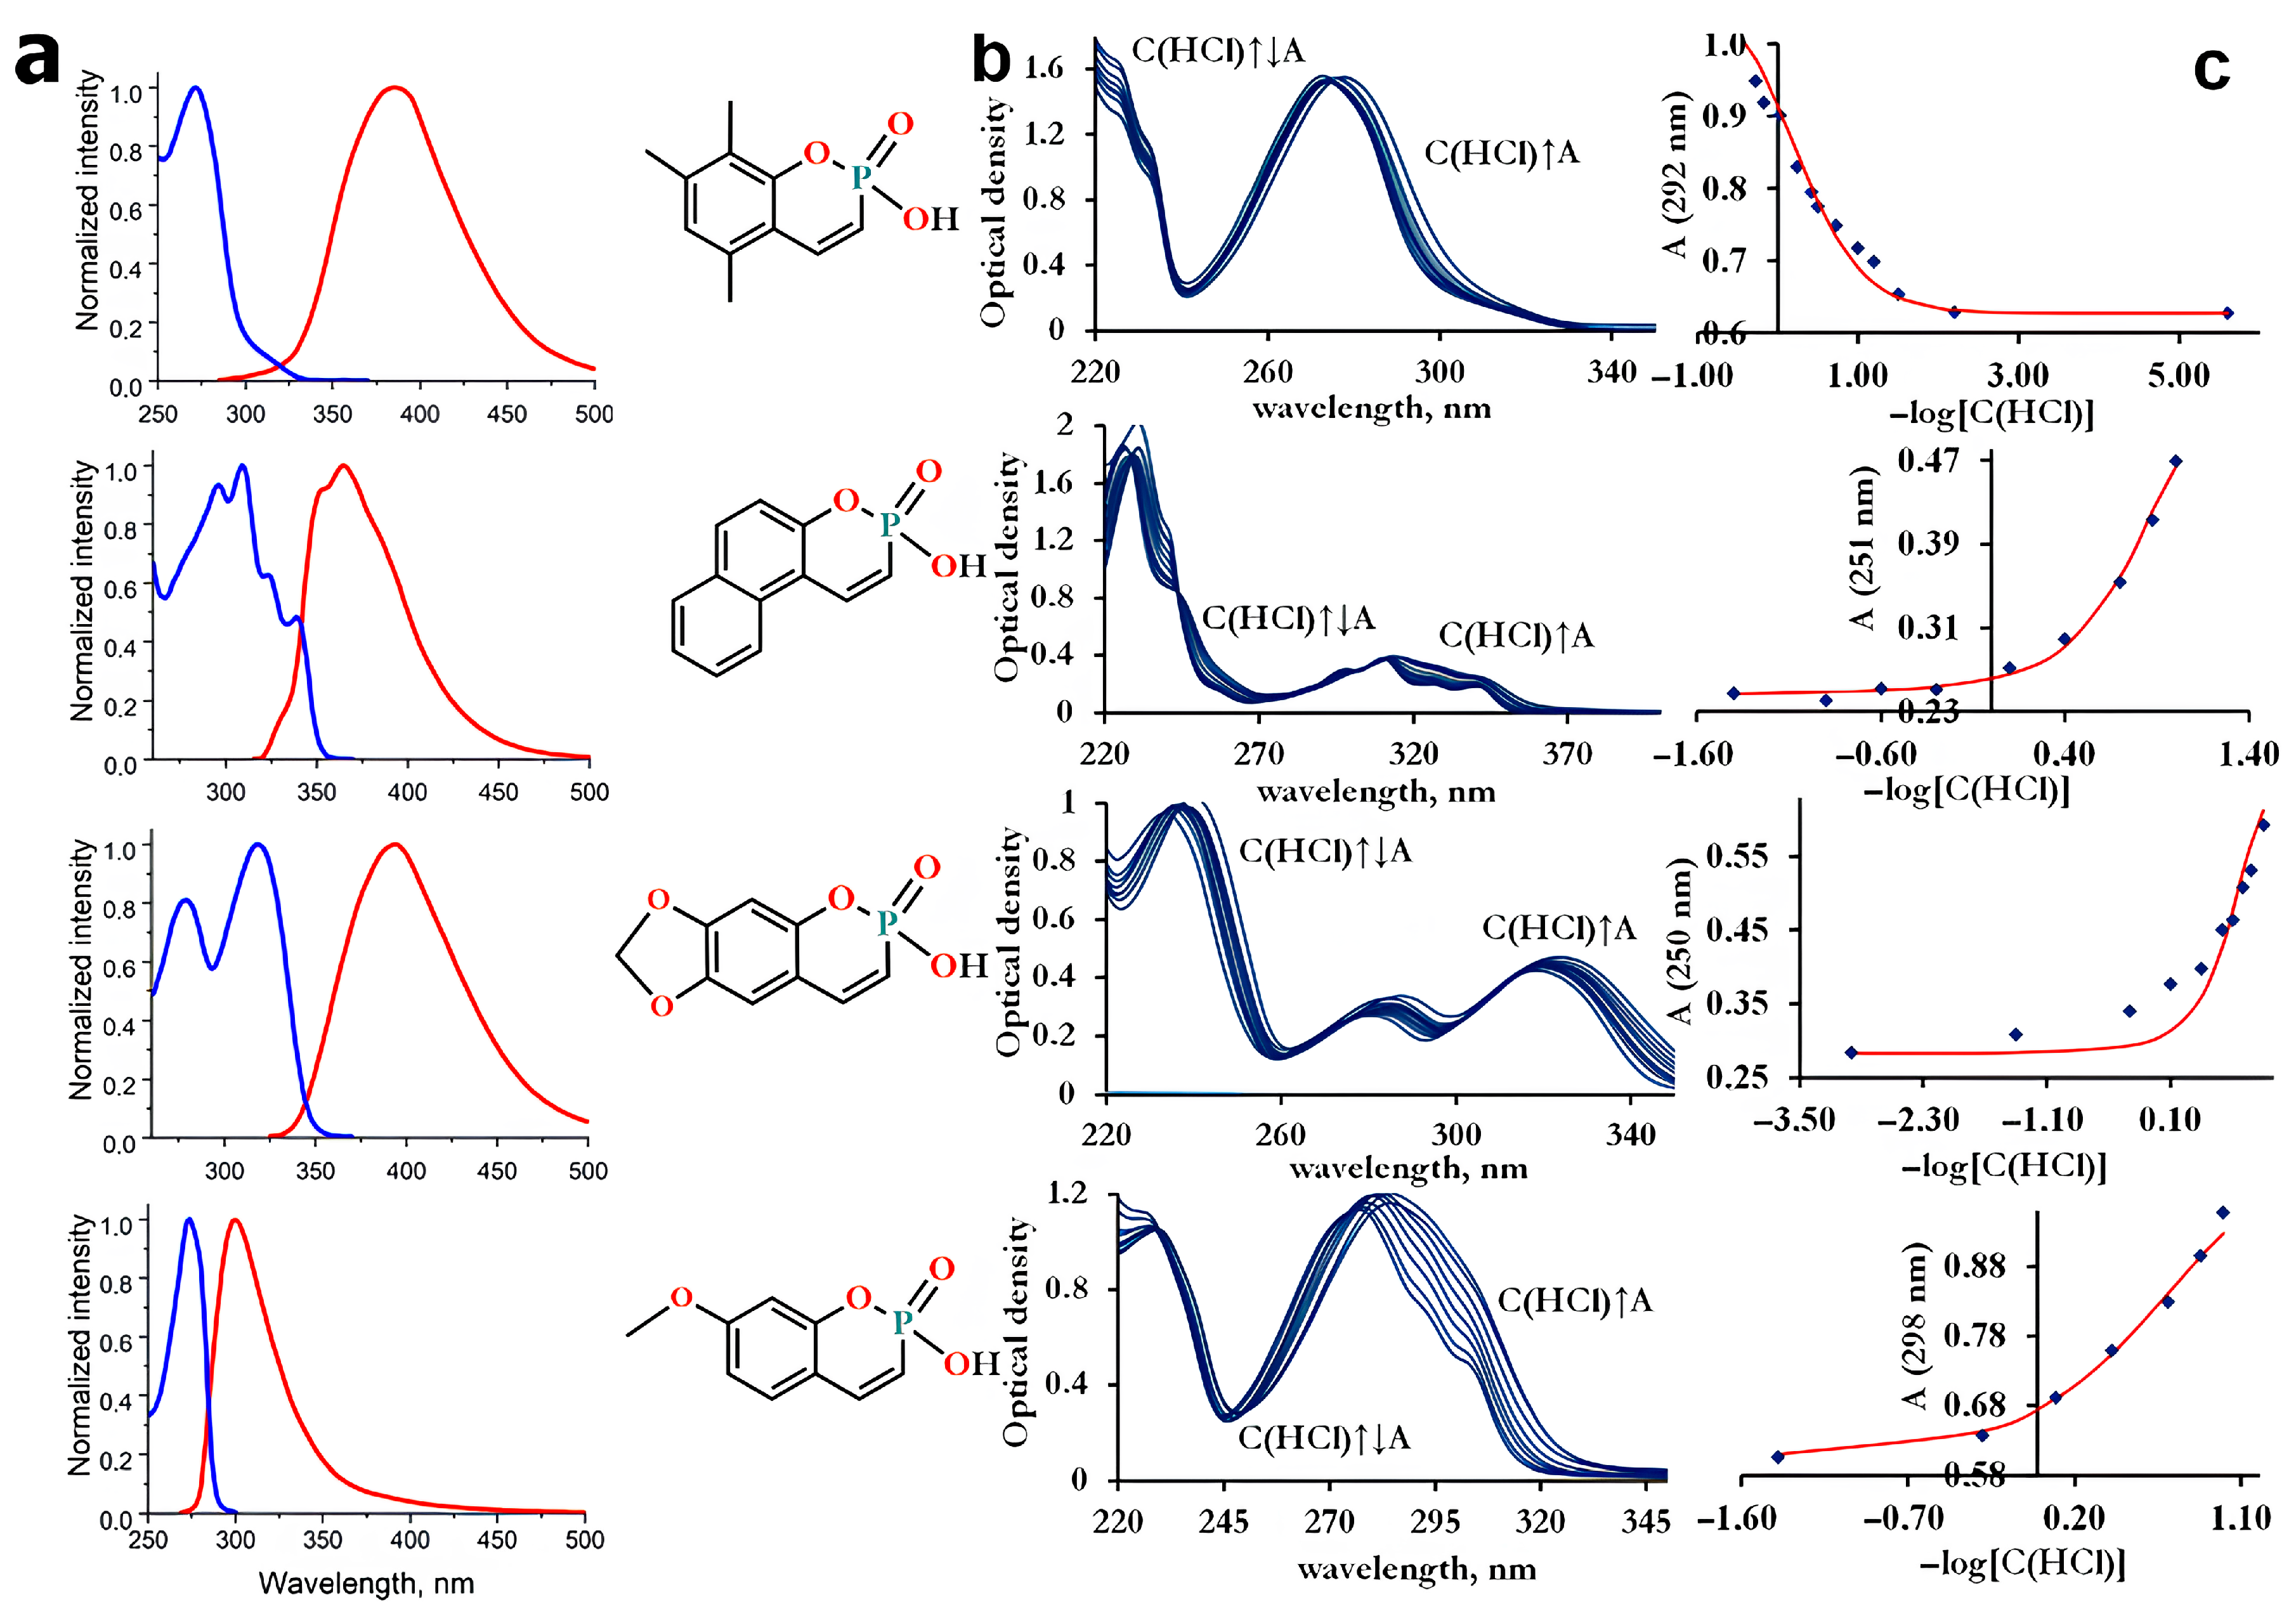
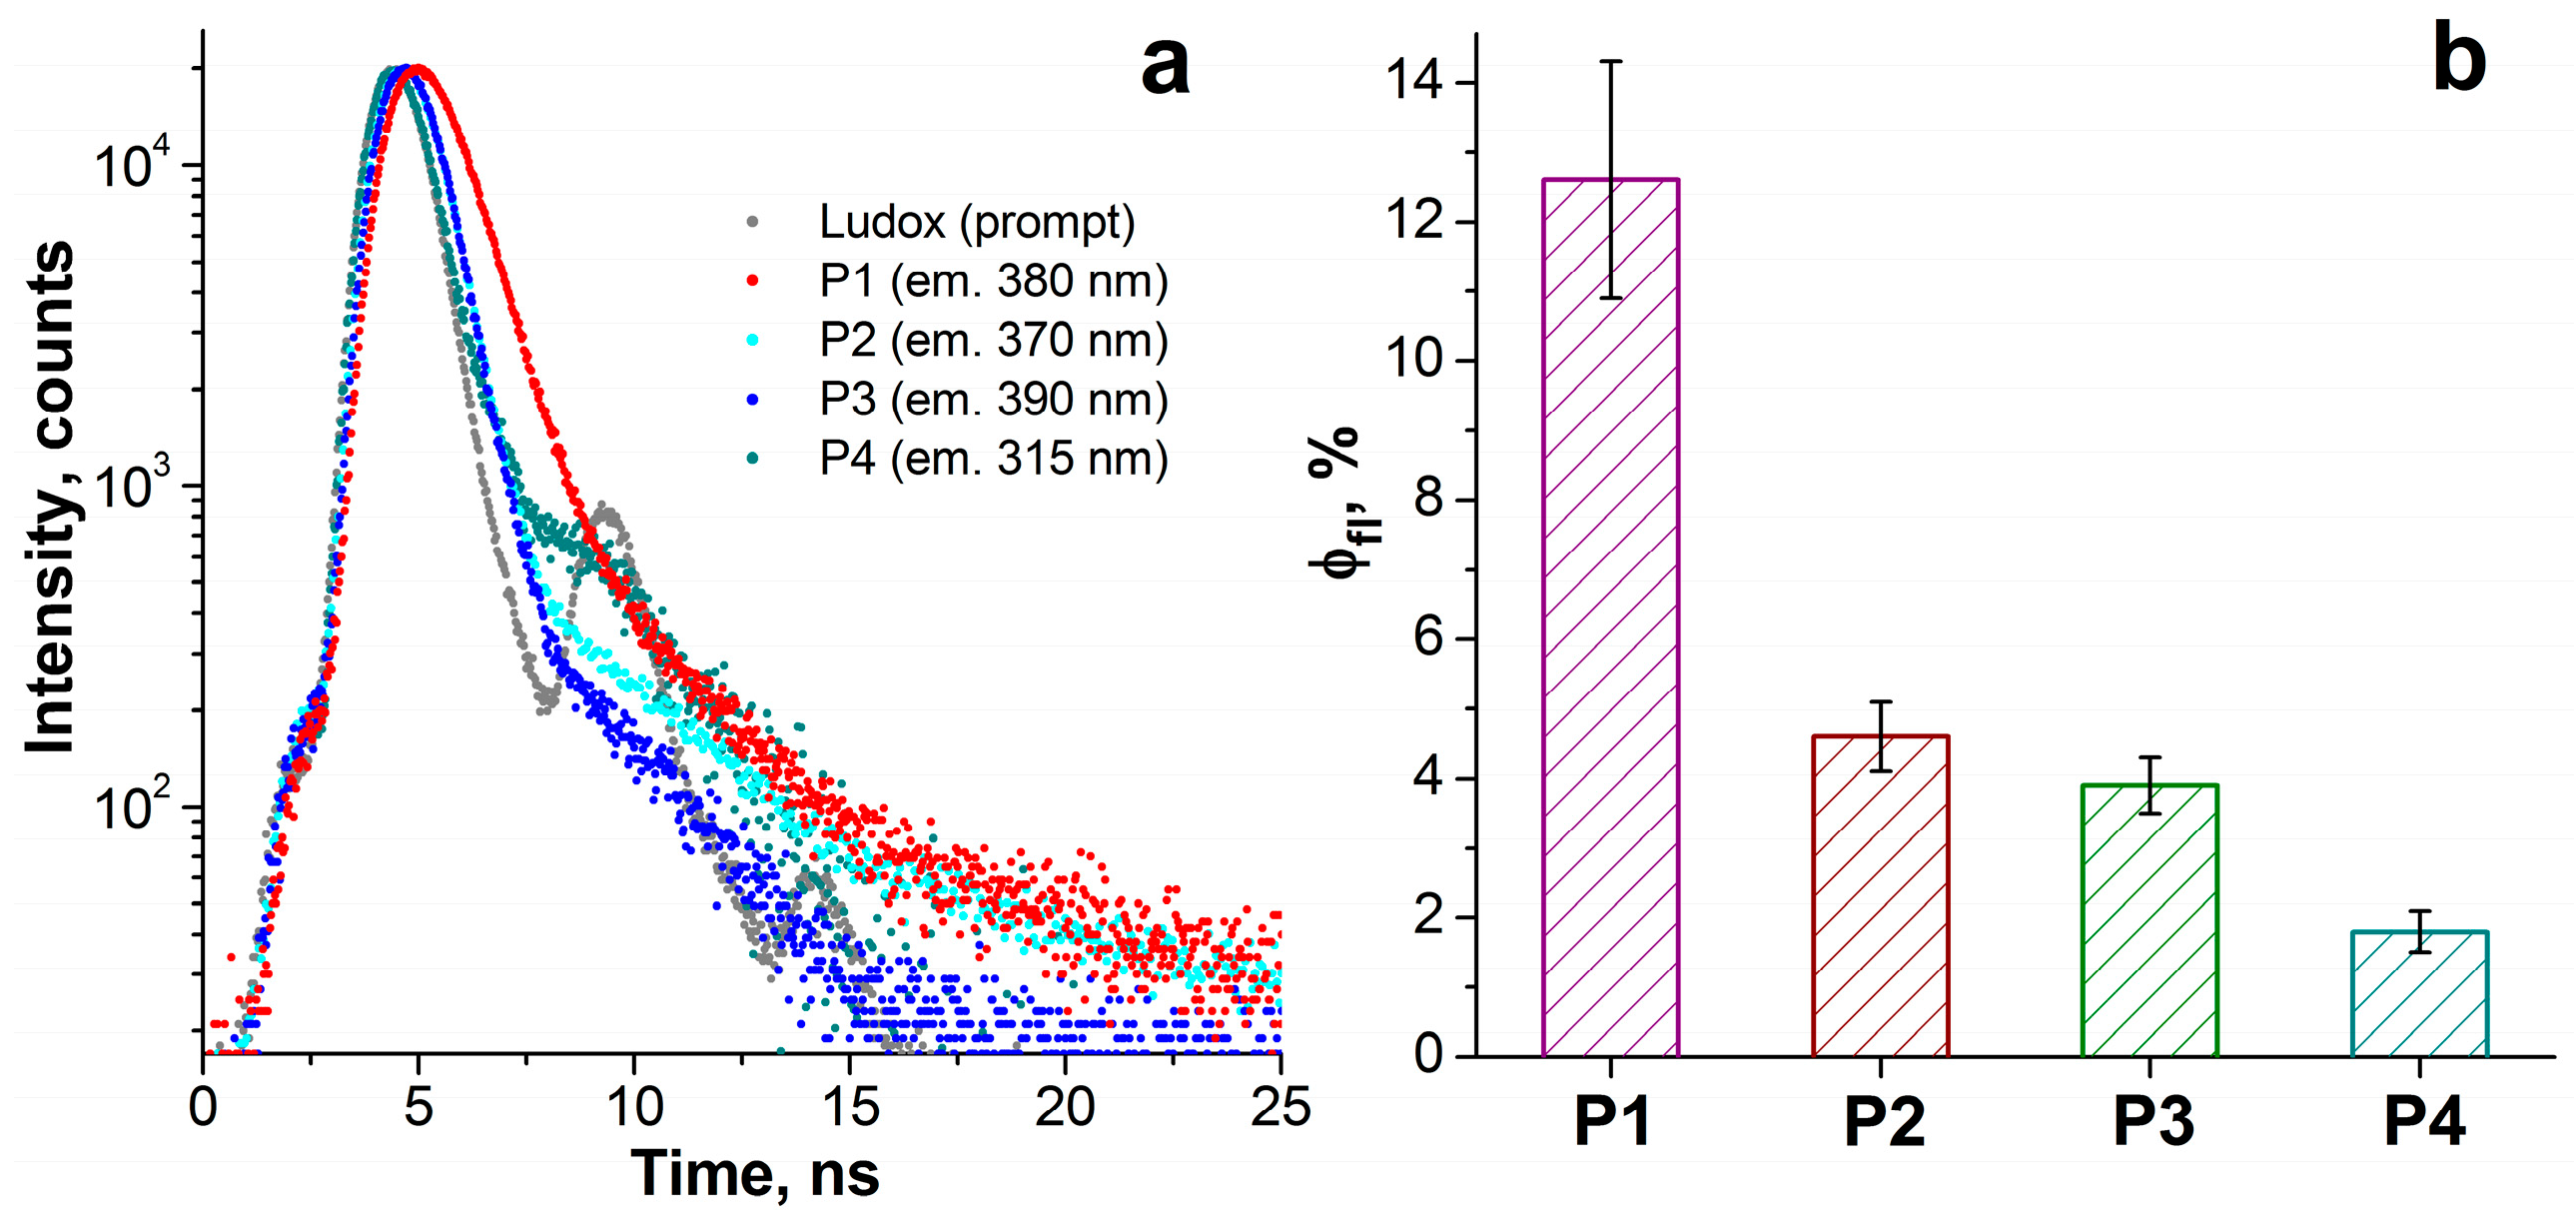
The synthesized compounds demonstrated solubility in aqueous solutions; thus, the spectral parameters described in this section were measured in aqueous media. All compounds exhibit a set of π-π* absorption transitions and rather weak emission in the ultraviolet and visible spectral regions. The emission and excitation spectra are shown in Figure 1a. The maxima of the most intense absorption bands lie in the range of 231–319 nm (Figure 1b), and the maxima of the emission spectra lie in the range of 300–394 nm. From Figure 1 and Table 1, it can be seen that the spectral (absorption, excitation, and emission maxima) and photophysical (emission lifetime, quantum yield, Stokes shift) properties of the synthesized compounds P1–P4 differ significantly and depend on the number of methyl groups. The greatest value of Stokes shift is observed for P1, which contains the largest number of methyl groups. The emission lifetimes of P1–P4 were obtained from the time-resolved decays after pulsed excitation at 296 nm (Figure 2a). The emission lifetimes of P1–P4 (0.06–0.73 ns, see Table 1 for details) correspond to the fluorescence, the radiative transition between singlet states. The fluorescence quantum yield for all compounds is low, ranging from 2 to 13% (Figure 2b, Table 1). Compound P1 exhibits the highest emission efficiency (12.6%) and the longest lifetime (0.73 ns) among the synthesized phosphacoumarins, while compound P4, on the contrary, exhibits the shortest emission lifetime (0.06 ns) and a very low fluorescence quantum yield (1.8%).
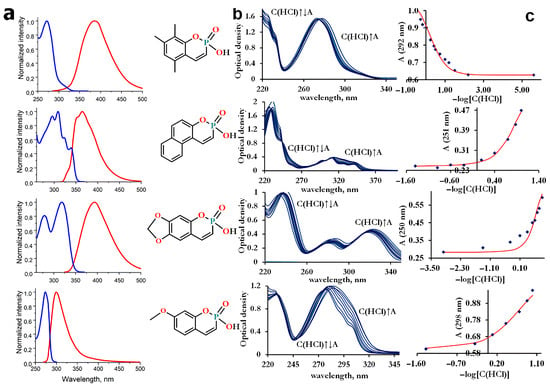
Figure 1.
Spectral properties. (a) Emission (red line) and excitation (blue line) spectra. All spectra were recorded in water, where the compounds exist as ionized species (anion form). (b) Changes in the absorption spectrum with increasing acidity of the media. The HCl concentration ranged from pH 1.4 to concentrated values (11.4 M). (c) Absorbance at a given wavelength as the function of HCl concentration.

Table 1.
Spectral and photophysical parameters of P1–P4 in water.
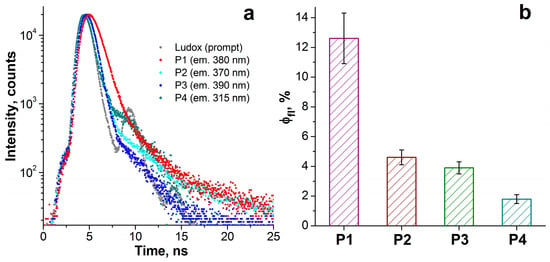
Figure 2.
(a) Time-resolved fluorescence decays of P1–P4 in water after pulsed excitation at 296 nm. (b) Fluorescence quantum yield of P1–P4 defined as the ratio of the measured fluorescence lifetime to the calculated radiative lifetime.
3.2. Acidic Properties
Since the synthesized compounds are derivatives of orthophosphoric acid, they should exhibit acidic capacity. Typical values of the dissociation constants for phosphoric acids and their organic derivatives are in the range of 2–3 logarithmic units (for orthophosphoric acid pKa1 = 2.15 [34]). Initially, we expected the acidity of new compounds to be close to the typical value. However, the absorption spectra of the studied compounds do not change in the pH range of 2–14 and above in alkali media. The significant spectral changes were detected only in strongly acidic media (Figure 1b,c).
Because compounds P1–P4 were unstable over time in the sulfuric acid, all measurements were performed in hydrochloric media. The acidic character is so pronounced that even in concentrated HCl, the dissociation cannot be completely suppressed. The inability to obtain the molar excitation coefficients for the neutral form imposes limits on the accuracy of measurements. Statistical analysis of the obtained data shows that all compounds are strong acids with negative values of pKa. The determined acidic parameters are presented in Table 2.

Table 2.
Acidic parameters.
In addition, the dissociation of the studied compounds in water was obtained by electrophoretic NMR analysis. Using P2 as an example, the electrophoretic behavior was examined in heavy water media (H2O/D2O 1:4 vol.) for greater signal stability and accuracy in determining chemical shifts. The appearance of a phase shift in signals in an applied electric field (Figure 3) indicates the presence of charge carriers (ions). The electrophoretic mobility of the aqueous solution was 2.2 × 10⁻⁸ m2/Vs with an effective anion charge of −0.93. The diffusion coefficient by DOSY measurements was 6 × 10⁻¹⁰ m2/s.

Figure 3.
The 1H eNMR experiment of P2 water solution: dependence of phase shift versus voltage (left); spectrum slices at different voltages (right).
The obtained parameters correspond to the strong acids such as trifluoroacetic acid (pKa = 0.23 [35]) or chloric acid HClO3 (pKa ≈ −2.7 [36]). In fact, we can see a decrease in the dissociation constants from 2.15 (pure H3PO4) to −1.3 (P2) logarithmic units. This unexpected result emphasizes the role of aromatic substituted groups, which are highly delocalized π-conjugated systems. The problem of explaining acidity by π-delocalization lies in the nature of the O-H bond, which has a σ-electron structure. Electronic effects should have a significant impact on the central phosphorus atom, which in turn affects the O-H group. A quantitative assessment of the state of the phosphorus atom can be obtained using 31P-NMR spectra (Figures S3, S6, S11 and S16), but the chemical shifts have typical values (around zero ppm). Aside from electronic effects, changes in acidic properties may be related to solvation effects. Indeed, as donor atoms, phosphorus and oxygen can form a solvation shell of explicit water molecules around their places. This conclusion is difficult to confirm by experimental methods but can be estimated by DFT modeling.
3.3. DFT Modeling
Modeling of spectral parameters by the TD-DFT approach allows us to identify the nature of the observed electronic transitions in absorption spectra. Herein, we estimated the spectra that were recorded in water media, i.e., the anionic form of compounds P1–P4. Table 3 presents a comparison of the theoretically calculated and experimental parameters. All transitions correspond to intracycle π-π* electronic transitions.

Table 3.
Results of TD-DFT estimations.
To describe the acidic properties of the studied compounds, theoretical values of the dissociation constants were calculated. Since the solvation effects are one of the most possible factors leading to anomalous acidity, different solvation forms of phosphacoumarins and protons were involved. Theoretical modeling of the dissociation process was performed using explicit solvation of the hydrogen ion in the form H·(H2O)n+, where n was set to 4. Explicit solvation of the compounds was approximated by one water molecule, which connected with the free oxygen atom of the compound by a hydrogen bond (Figure 4, top). The thermodynamic cycle for the DFT calculation is shown in Scheme 3. The values of the theoretically calculated equilibrium constants and their energy contributions are summarized in Table 4.

Figure 4.
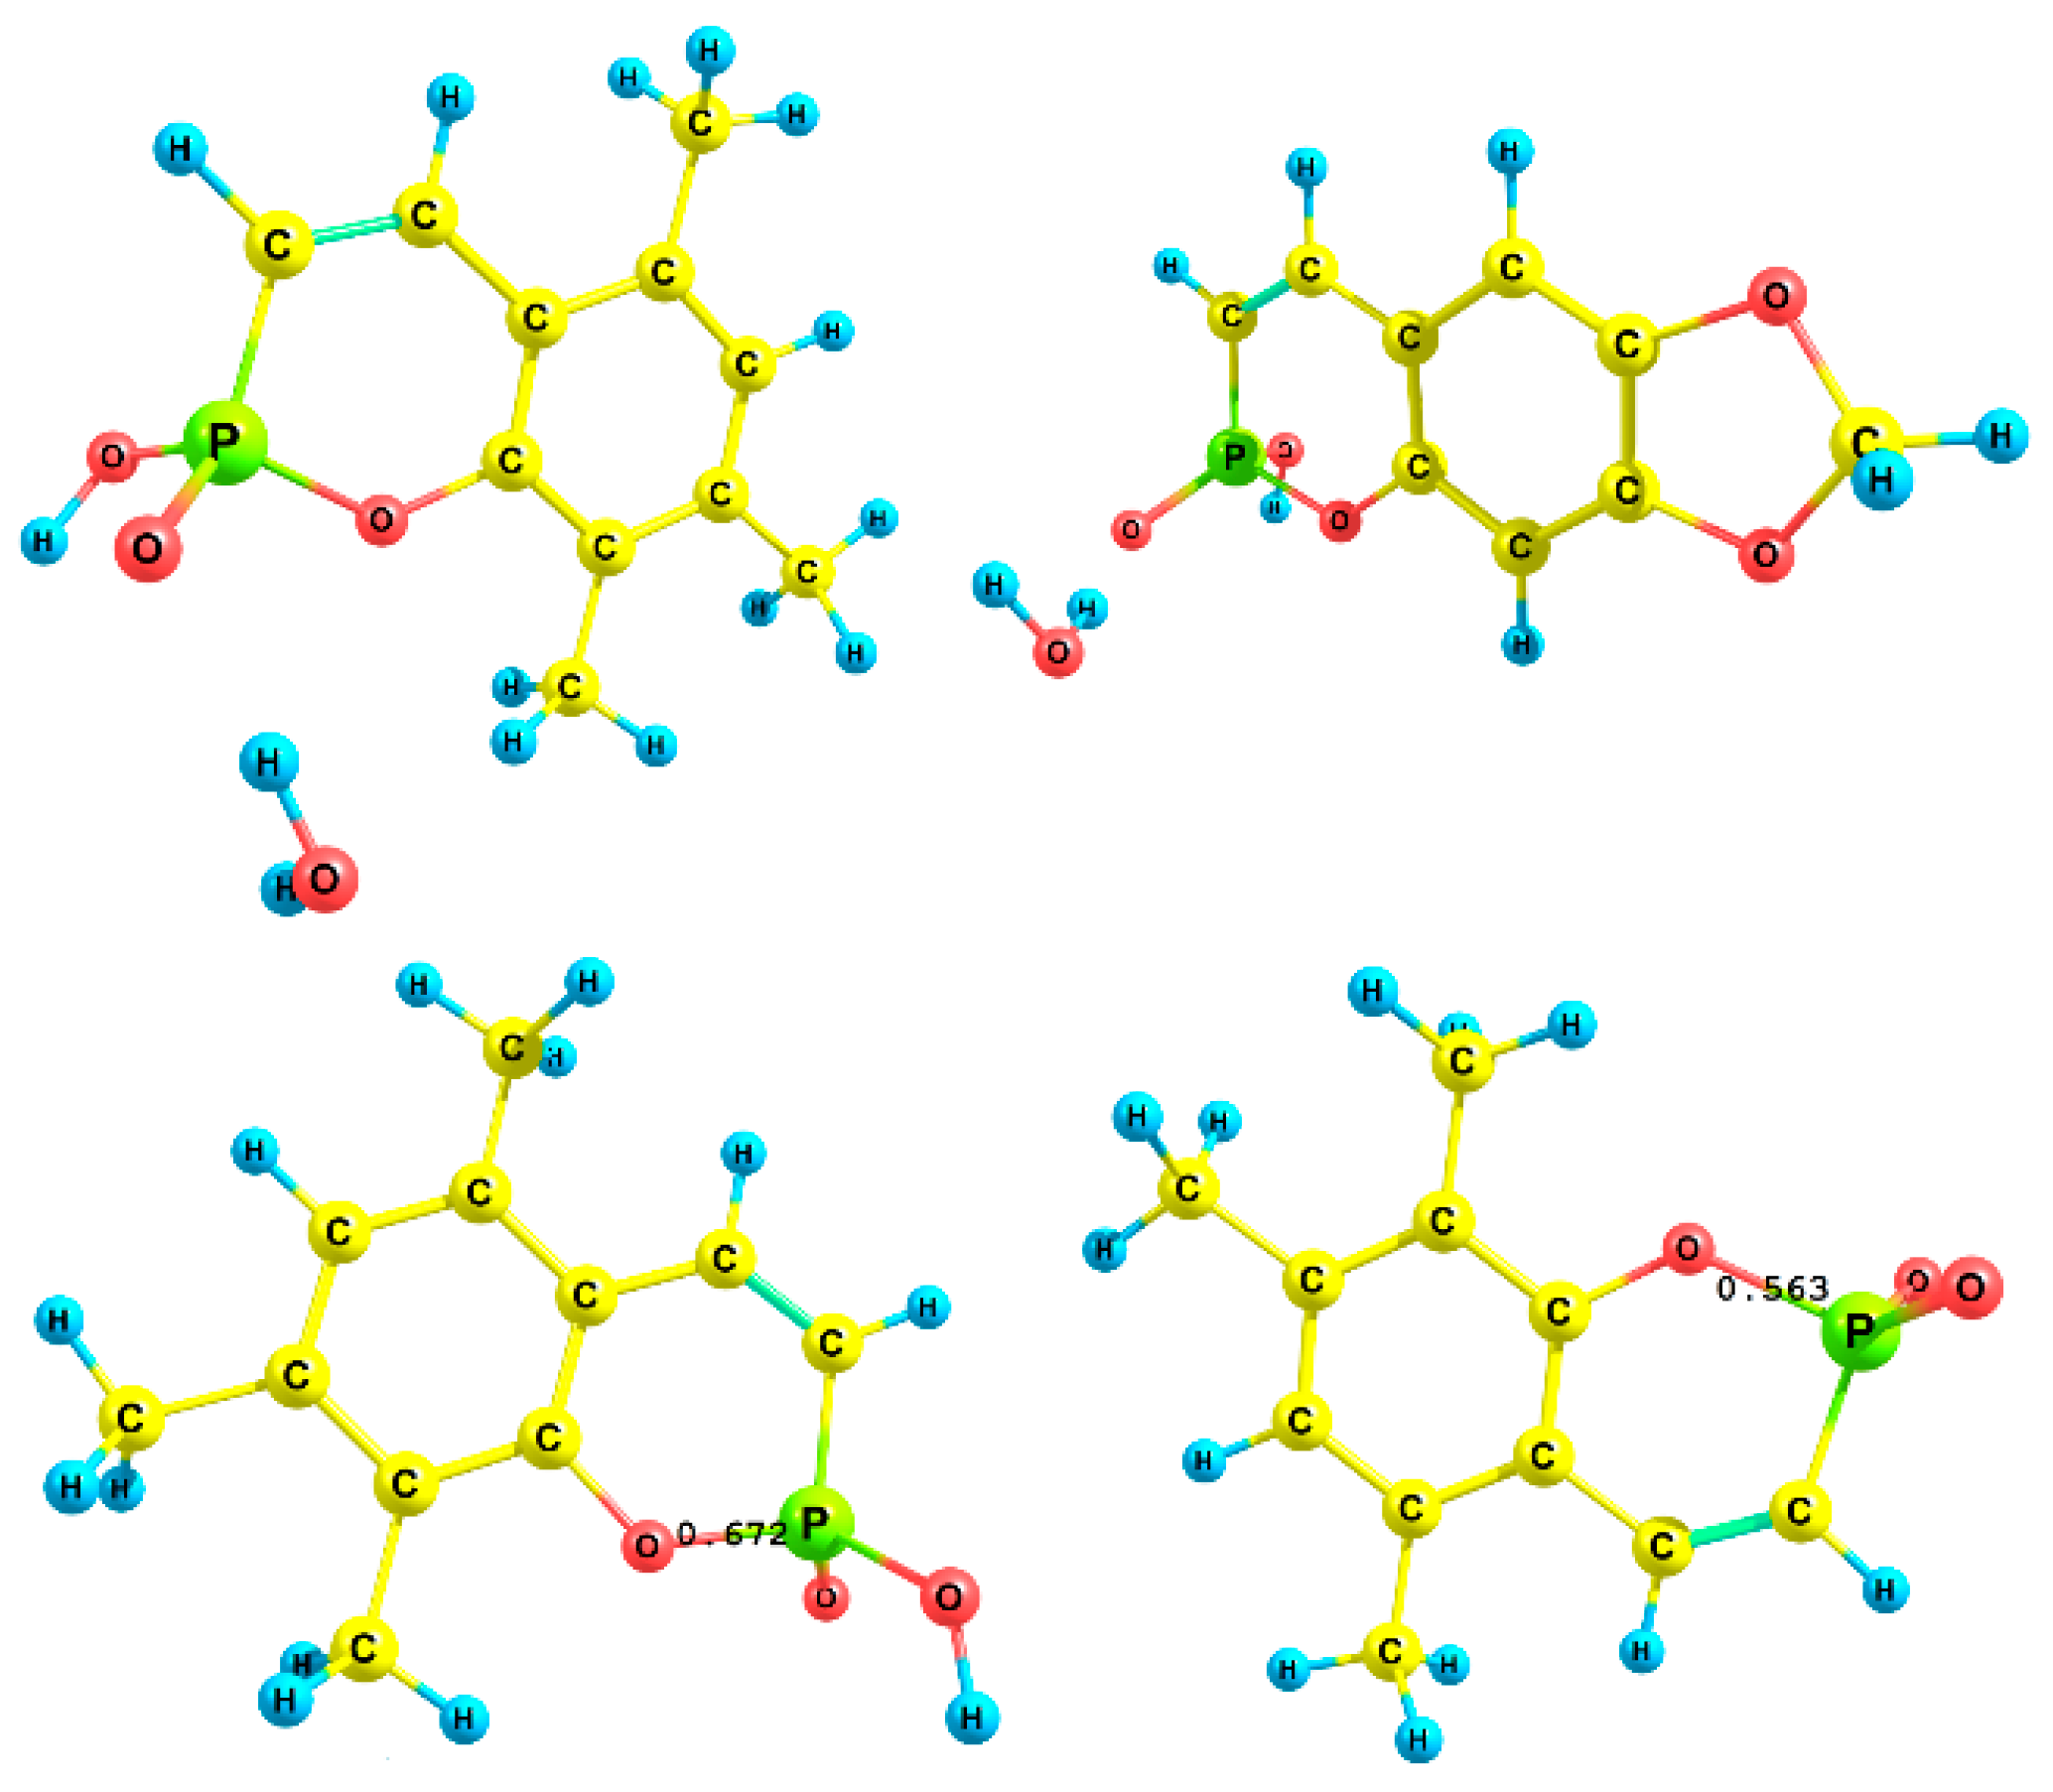
Bond orders for neutral (left) and anion (right) forms of P1.

Scheme 3.
Thermodynamic cycle for DFT calculations.

Table 4.
Energy contribution (kJ/mol) and values of the theoretically calculated acidity constants (log units).
As we can see, the inclusion of explicit solvation in the computational protocol leads to the prediction of acidic properties within one logarithmic unit. At the same time, the solvated form of the proton was necessary to achieve agreement between theoretical computations and the experimental data obtained. The formation of solvated species of P1–P4 explains their unexpected acidity, but only within the first-order approximation. An important feature of the optimized structures is the difference in the P–O bond distances between the anionic and neutral forms. In the anionic form, the P–O bond is significantly weaker than in the neutral form; the bond order varies from 0.67 to 0.56. This fact may be related to the anomalous acidity value, but further research is required for a more specific explanation (Figure 4, bottom).
The cyclic fragment containing phosphorus atoms is larger than that of the neutral forms. In addition, the P-O bond order in the neutral form is significantly smaller than the corresponding order in H3PO4 (all three P-O bonds have an order of 1.16, calculated at the same level of theory cc-pVDZ/CRENBL ECP/PBE0/SMD). Thus, two factors reducing the stability of the neutral form are the weak P-O bonds and the larger size of the phosphorus cycle compared to the anionic form.
4. Conclusions
Four water-soluble 2-hydroxybenzo[e][1,2]oxaphosphinine 2-oxides, P1–P4, were prepared by a novel method via cascade reactions of (2-ethoxyvinyl)phosphonic dichloride with phenol or naphthol derivatives and characterized using a combination of physicochemical methods and DFT modeling. The structures of two compounds were confirmed by NMR, FTIR, GC-MS, and elemental analysis. These compounds exhibit UV-violet emission with a fluorescence quantum yield of 2–13% and possess diverse spectral and acid-base properties.
The acid-base parameters were determined by electron absorption spectroscopy using the non-linear Cox–Yates method in strongly acidic media. Unusually high acidities were observed: in aqueous solution, the compounds predominantly exist as singly deprotonated anionic forms, and dissociation occurs even under strongly acidic conditions. The measured pKₐ values were 0.2, −1.3, −1.26, and −0.7 for P1, P2, P3, and P4, respectively. Electrophoretic NMR confirmed that these anionic forms represent the monodeprotonated forms of neutral compounds and remain dominant throughout the studied pH range.
DFT calculations of the acid–base properties using an explicit solvation model for both the compounds and the proton achieved the best agreement with experiment when the proton was represented as an H9O4+ cluster and the compounds were modeled in their monosolvated neutral form. Within this model, the predicted acid–base parameters agreed with experimental values within ±0.5–1.5 log units.
The unique result obtained in this study: the unexpectedly high acidity of phosphate coumarins P1–P4 is a new scientific fact, allowing us to confirm that they are among the most active organophosphorus acids currently known. This study will serve as an impetus for the further development of methods for synthesizing a wide range of phosphocoumaric acids containing electron-withdrawing substituents in the aromatic ring, the identification of patterns in the influence of these substituents on acidity, and the creation of unique new types of photoactive phosphorus-containing acids.
Supplementary Materials
The following supporting information can be downloaded at: https://www.mdpi.com/article/10.3390/chemistry7060175/s1, Absorption (Figure S1), NMR (Figures S2–S19) and FTIR (Figure S20) spectra.
Author Contributions
Conceptualization, A.R.B. and A.S.G.; methodology, T.Y.I., M.A.G., M.A.L.; software, T.Y.I., M.A.L., V.D.L. and M.A.G.; validation, T.Y.I., M.A.G.; formal analysis, M.A.L., M.A.G.; investigation, A.V.Z., Y.M.S., K.K.D., N.I.A., N.O.A.; resources, T.Y.I., A.R.B., A.S.G.; data curation, T.Y.I., M.A.L., M.A.G.; writing—original draft preparation, T.Y.I. and M.A.L.; writing—review and editing, M.A.G., A.R.B. and A.S.G.; visualization, T.Y.I., M.A.L., M.A.G.; supervision, A.S.G. and M.A.L.; project administration, A.R.B.; funding acquisition, A.R.B. All authors have read and agreed to the published version of the manuscript.
Funding
This research was supported by the Russian Science Foundation (project No. 25-73-20015, https://rscf.ru/en/project/25-73-20015/ accessed on 4 October 2025).
Data Availability Statement
The data presented in this study are available on request from the corresponding authors.
Acknowledgments
This work was performed using the equipment of the Krasnoyarsk Center of Research Equipment, “Krasnoyarsk Science Center of the Siberian Branch of the Russian Academy of Sciences” Federal Research Center. Numerical computations were performed on the MVS-1000M cluster of the Institute of computational modeling SB RAS. The authors are grateful to the Collective Spectral-Analytical Center of the Federal Research Center of the Kazan Scientific Center of RAS for technical support of the studies. Equipment facilities from Center of collective facilities of A.N. Nesmeyanov Institute of Organoelement compounds of Russian Ministry of Sciences and High Education are gratefully acknowledged. The authors would like to acknowledge the Non-Profit Joint-Stock Company “Korkyt Ata Kyzylorda University” (Grant No. 105-05-24) for providing the opportunity to conduct biological experiments.
Conflicts of Interest
The authors declare no conflicts of interest.
References
- Servain, C.M.; Berchel, M.; Couthon, H.; Jaffres, P.-A. Phosphonic acid: Preparation and applications. Beilstein J. Org. Chem. 2017, 13, 2186–2213. [Google Scholar] [CrossRef]
- Boczkowski, M.; Popiel, S.; Nawała, J.; Hubert Suska, H. History of Organophosphorus Compounds in the Context of Their Use as Chemical Warfare Agents. Molecules 2025, 30, 1615. [Google Scholar] [CrossRef]
- Franz, R.G. Comparisons of pKa and log P values of some carboxylic and phosphonic acids: Synthesis and measurement. AAPS PharmSci 2010, 3, 10. [Google Scholar] [CrossRef]
- Glöckler, J.; Klützke, S.; Meyer-Zaika, W.; Reller, A.; García-García, F.J.; Strehblow, H.; Keller, P.; Rentschler, E.; Kläui, W. With Phosphinophosphonic acids to nanostructured, water-soluble, and catalytically active rhodium clusters. Angew. Chem. Int. Ed. 2007, 46, 1164–1167. [Google Scholar] [CrossRef]
- Akiyama, T. Stronger Brönsted Acids. Chem. Rev. 2007, 107, 5744–5758. [Google Scholar] [CrossRef]
- Akiyama, T.; Itoh, J.; Fuchibe, K. Recent progress in chiral Brönsted Acid catalysis. Adv. Synth. Catal. 2006, 348, 999–1010. [Google Scholar] [CrossRef]
- Sadykova, Y.M.; Sadikova, L.M.; Badrtdinova, A.R.; Dobrynin, A.B.; Burilov, A.R.; Pudovik, M.A. Condensation of 2-Ethoxyvinylphosphonic Acid Dichloroanhydride with 2,3,5-Trimethylphenol. Novel Method for Preparation of Phosphacoumarins. Phosphorus Sulfur Silicon Relat. Elem. 2015, 190, 2267–2272. [Google Scholar] [CrossRef]
- Sadikova, L.M.; Sadykova, Y.M.; Zalaltdinova, A.V.; Burilov, A.R.; Pudovik, M.A.; Voronina, J.K.; Mitrasov, Y.N. The reactions of 2-ethoxyvinyldichlorophosphonate with 4-chloro- or 4-bromoresorcinols and 2,3,5-trimethylphenol. Phosphorus Sulfur Silicon Relat. Elem. 2016, 191, 1562–1563. [Google Scholar] [CrossRef]
- Li, B.; Zhou, B.; Lu, H.; Ma, L.; Peng, A.-Y. Phosphaisocoumarins as a New Class of Potent Inhibitors for Pancreatic Cholesterol Esterase. Eur. J. Med. Chem. 2010, 45, 1955–1963. [Google Scholar] [CrossRef]
- Li, X.; Zhang, D.; Pang, H.; Shen, F.; Fu, H.; Jiang, Y.; Zhao, Y. Synthesis of a Diverse Series of Phosphacoumarins with Biological Activity. Org. Lett. 2005, 7, 4919–4922. [Google Scholar] [CrossRef] [PubMed]
- Hariri, M.; Darvish, F.; Mengue Me Ndong, K.-P.; Babouri, R.; Mwande-Maguene, G.; Burilov, A.R.; Licznar-Fajardo, P.; Pirat, J.-L.; Ayad, T.; Virieux, D. Biologically Relevant Surrogates of Coumarins: 2-Phenyl H-Isophosphinoline 2-Oxides with Antibacterial Activity. GSC Biol. Pharm. Sci. 2021, 16, 283–296. [Google Scholar] [CrossRef]
- Sennikova, V.V.; Zalaltdinova, A.V.; Sadykova, Y.M.; Khamatgalimov, A.R.; Gazizov, A.S.; Voloshina, A.D.; Lyubina, A.P.; Amerhanova, S.K.; Voronina, J.K.; Chugunova, E.A.; et al. Diastereoselective Synthesis of Novel Spiro-Phosphacoumarins and Evaluation of Their Anti-Cancer Activity. Int. J. Mol. Sci. 2022, 23, 14348. [Google Scholar] [CrossRef] [PubMed]
- Budzisz, E. Cytotoxic Effects, Alkylating Properties and Molecular Modelling of Coumarin Derivatives and Their Phosphonic Analogues. Eur. J. Med. Chem. 2003, 38, 597–603. [Google Scholar] [CrossRef]
- Zalaltdinova, A.V.; Sadykova, Y.M.; Gazizov, A.S.; Smailov, A.K.; Syakaev, V.V.; Gerasimova, D.P.; Chugunova, E.A.; Akylbekov, N.I.; Zhapparbergenov, R.U.; Appazov, N.O.; et al. Superelectrophilic Activation of Phosphacoumarins towards Weak Nucleophiles via Brønsted Acid Assisted Brønsted Acid Catalysis. Int. J. Mol. Sci. 2024, 25, 6327. [Google Scholar] [CrossRef] [PubMed]
- Cox, R.A.; Yates, K. Acidity Functions: An Update. Can. J. Chem. 1983, 61, 2225–2243. [Google Scholar] [CrossRef]
- Ivanenko, T.Y.; Kondrasenko, A.A.; Rubaylo, A.I. The Determination of the Hammett Acidity Function H0 in a Mixtures of Phosphoric and Acetic Acids by NMR Measurements. J. Mol. Liq. 2023, 391, 123438. [Google Scholar] [CrossRef]
- Sadykova, Y.M.; Dalmatova, N.V.; Voronina, Y.K.; Burilov, A.R.; Pudovik, M.A.; Sinyashin, O.G. Formation of Phosphorus-containing Cage Structures in the Reaction of 2-ethoxyvinylphosphonic Acid Dichloroanhydride with Resorcinol and Its Derivatives. Heteroat. Chem. 2012, 23, 340–344. [Google Scholar] [CrossRef]
- Cox, R.A.; Yates, K. The Excess Acidity of Aqueous HCl and HBr Media. An Improved Method for the Calculation of X-Functions and H0 Scales. Can. J. Chem. 1981, 59, 2116–2124. [Google Scholar] [CrossRef]
- Leggett, D.J. Computational Methods for the Determination of Formation Constants; Plenum Press: New York, NY, USA, 1985; 494p. [Google Scholar] [CrossRef]
- GNU Octave Software. Available online: https://octave.org/ (accessed on 1 February 2025).
- Schmidt, M.W. General atomic and molecular electronic structure system. Comput. Chem. 1993, 14, 1347–1363. [Google Scholar] [CrossRef]
- Adamo, C.; Barone, V. Toward reliable density functional methods without adjustable parameters: The PBE0 model. J. Chem. Phys. 1999, 110, 6158–6170. [Google Scholar] [CrossRef]
- Grimme, S.; Antony, J.; Ehrlich, S.; Krieg, H. A consistent and accurate ab initio parametrization of density functional dispersion correction (DFT-D) for the 94 elements H-Pu. J. Chem. Phys. 2010, 132, 154104–154126. [Google Scholar] [CrossRef]
- Dunning, T.H., Jr. Gaussian basis sets for use in correlated molecular calculations. I. The atoms boron through neon and hydrogen. J. Chem. Phys. 1989, 90, 1007–1023. [Google Scholar] [CrossRef]
- Ross, R.B.; Powers, J.M.; Atashroo, T.; Ermler, W.C.; LaJohn, L.A.; Christiansen, P.A. Abinitio relativistic effective potentials with spin-orbit operators. IV. Cs through Rn. J. Chem. Phys. 1990, 93, 6654–6670. [Google Scholar] [CrossRef]
- Sancho-Garcia, J.C.; Perez-Jimenez, A.J. Assessment of double-hybrid energy functionals for π-conjugated systems. J. Chem. Phys. 2009, 131, 084108. [Google Scholar] [CrossRef]
- Champagne, B.; Botek, E.; Nakano, M.; Nitta, T.; Yamaguchi, K. Basis set and electron correlation effects on the polarizability and second hyperpolarizability of model open-shell π-conjugated systems. J. Chem. Phys. 2005, 122, 114315. [Google Scholar] [CrossRef]
- Lutoshkin, M.A. Solvation Effects on the Sustainability of Lanthanum Complexes. J. Phys. Chem. A 2025, 129, 5490–5498. [Google Scholar] [CrossRef] [PubMed]
- Bryantsev, V.S.; Mamadou, S.D.; Goddard, W.A., III. Calculation of Solvation Free Energies of Charged Solutes Using Mixed Cluster/Continuum Models. J. Phys. Chem. B 2008, 112, 9709–9719. [Google Scholar] [CrossRef]
- Lutoshkin, M.A.; Petrov, A.I.; Golovenev, N.N. Acid–Base, Complexing and Spectral Properties of Thiobarbituric Acid and Its 1,3-Derivatives in Aqueous Solutions: Spectrophotometric and Quantum Chemical Approach. J. Sol. Chem. 2016, 45, 1453–1467. [Google Scholar] [CrossRef]
- Marenich, A.V.; Cramer, C.J.; Truhlar, D.G. Universal Solvation Model Based on Solute Electron Density and on a Continuum Model of the Solvent Defined by the Bulk Dielectric Constant and Atomic Surface Tensions. J. Phys. Chem. B 2009, 113, 6378–6396. [Google Scholar] [CrossRef]
- Laurent, A.D.; Jacquemin, D. TD-DFT benchmarks: A review. Int. J. Quantum Chem. 2013, 113, 2019–2039. [Google Scholar] [CrossRef]
- Strickler, S.J.; Berg, R.A. Relationship between absorption intensity and fluorescence lifetime of molecules. J. Chem. Phys. 1962, 37, 814–822. [Google Scholar] [CrossRef]
- Sheldrick, G.M. N.m.r. study of the protonation of phosphine, hypophosphorous acid and orthophosphorous acid. Trans. Faraday Soc. 1967, 63, 1077–1082. [Google Scholar] [CrossRef]
- Mader, P.M. Trifluoroacetanilide. pKa and Alkaline Hydrolysis Kinetics. J. Am. Chem. Soc. 1965, 87, 3191–3195. [Google Scholar] [CrossRef]
- Alves, W.A.; Tellez, C.A.; Sala, O.; Santos, P.S.; Faria, R.B. Dissociation and rate of proton transfer of HXO3 (X = Cl, Br) in aqueous solution determined by Raman spectroscopy. J. Raman Spectrosc. 2001, 32, 1032–1036. [Google Scholar] [CrossRef]
Disclaimer/Publisher’s Note: The statements, opinions and data contained in all publications are solely those of the individual author(s) and contributor(s) and not of MDPI and/or the editor(s). MDPI and/or the editor(s) disclaim responsibility for any injury to people or property resulting from any ideas, methods, instructions or products referred to in the content. |
© 2025 by the authors. Licensee MDPI, Basel, Switzerland. This article is an open access article distributed under the terms and conditions of the Creative Commons Attribution (CC BY) license (https://creativecommons.org/licenses/by/4.0/).

