Article

Density Functional Theory Simulations of Skaergaardite (CuPd) with a Self-Consistent Hubbard U-Correction

1
Department of Chemistry G. Ciamician, University of Bologna, I-40126 Bologna, Italy
2
Interdepartmental Centre for Industrial Aerospace Research (CIRI Aerospace), University of Bologna, I-47521 Cesena, Italy
*
Author to whom correspondence should be addressed.
Chemistry 2025, 7(2), 56; https://doi.org/10.3390/chemistry7020056
Submission received: 15 February 2025 / Revised: 24 March 2025 / Accepted: 31 March 2025 / Published: 2 April 2025
(This article belongs to the Section Chemistry of Materials)

Abstract

:
The electronic and phonon bands of Skaergaardite are investigated using density functional theory (DFT) as implemented in Quantum ESPRESSO. Skaergaardite is a copper palladium mineral (CuPd) found in the Skaergaard intrusion with a CsCl-type (B2) structure. Due to its porous structure, it presents a large surface area available for interactions, which makes it a promising catalyst. The PBE-GGA functional with a Hubbard-like localized term (DFT+U) is combined with ultrasoft and norm-conserving pseudopotentials, and a conventional approach with a dense Monkhorst–Pack grid of k-points 12 × 12 × 12 is applied. The electronic valence bands are mainly constituted by 3d orbitals of Cu and 4d orbitals of Pd and a pseudo-gap can be recognized. With respect to DFT, DFT+U causes a general downward shift in the valence band. The acoustic and optical phonon branches are separated by a few cm−1 gap at about 150 cm−1 and show a density of state curve typical of ordered materials. These results highlight the reliability of DFT+U in studying bimetallic systems with scarce experimental benchmarks, offering insights into the behavior of Skaergaardite and its potential applications in material science such as reduction reactions and hydrogen storage.

1. Introduction

Bimetallic copper and palladium compounds have gained increasing interest due to their applicability as carbon dioxide [1] and oxygen [2] reduction electrocatalysts. Regarding carbon dioxide electrochemical reduction reactions (CO2RRs), pure copper-based systems stand out for their low cost and their high capability to promote the formation of hydrocarbons such as methane, methanol and ethylene [1,3]. However, pure copper has poor selectivity, as the reduction process tends to produce a mixture of gases that must be purified and separated. In contrast, the selectivity of pure palladium is tunable depending on the applied potential [4]. However, its use is severely limited by: (i) the high cost, (ii) the high binding affinity toward carbon monoxide that may poison the catalysts [4,5] and (iii) the strong competition between the CO2RR and hydrogen evolution reaction (HER) [5]. CuPd compounds have been investigated in order to improve the catalytic performance [6]. It has been found that the Cu:Pd ratio plays a crucial role in affecting the activity and selectivity toward desired products since it rules both the electronics and the geometry of the catalyst [6,7]. Bimetallic alloy nanoparticles with a Cu:Pd molar ratio of approximately 1:1 have been shown to have the best electrocatalytic activity both for the conversion of CO2 to CO [8] and the oxygen reduction reaction (OOR) [2]. Other relevant studies presented a nanocavity-enriched CuPd single atom alloy to drive the CO2RR toward the production of acetylene [9], and an atomically dispersed CuPd alloy loaded on a CuO-phosphomolybdic acid subnanosheet to promote acetate formation [10].
CuPd compounds are viable materials to replace pure palladium membranes in hydrogen storage systems [11,12]. Pure Pd membranes face several issues associated with (i) the high cost, (ii) the high binding affinity toward impurity gas species (especially H2S [13]) and (iii) hydrogen cracking [14]. By contrast, CuPd compounds guarantee better H2S resistance, higher resistance to cracking and, in some forms, higher H2 permeability [15]. The equilibrium phase diagram of the CuPd system assesses that below the melting point, the system is a face-centered cubic (fcc) continuous solid solution [16,17]. However order–disorder transformations can take place and ordered Cu3Pd and CuPd occur with a composition range of homogeneity: 10–30 at.% Pd and 30–50 at.% Pd, respectively. As concerns Cu3Pd different types of crystal structure have been determined, while CuPd always has a CsCl-type (B2) structure [16,17,18] as shown in Figure 1. It is worth noting that the diffusivity of H at room temperature in B2 structures is almost two orders of magnitude faster than in the disordered phase [11,19].
The CuPd mineral was first identified in nature in 2004 in the Skaergaard intrusion in East Greenland and named Skaergaardite [20]. It belongs to the Pm-3m space symmetry group with a lattice parameter of a = 2.988 Å, resulting in a cell volume of 26.677 Å3 [21]. Since, to our knowledge, no experimental data are available on the electronic and phonon properties of Skaergaardite, our purpose is to investigate this compound by density functional theory (DFT) with a Hubbard-like localized term (DFT + U) in order to provide information that can be useful for potential applications in material science.

2. Materials and Methods

Electronic and vibrational band structures were determined by solving self-consistently the Kohn–Sham equations within the framework of plane waves and pseudopotentials as implemented in the Quantum ESPRESSO package [22]. The elastic and mechanical properties were calculated using a thermo_pw package [23]. The exchange–correlation functional was treated within the Perdew–Burke–Ernzerhof parametrization of the generalized gradient approximation (PBE-GGA [24]). During all the structural calculations, the atomic positions were relaxed with a Broyden–Fletcher–Goldfarb–Shanno (BFGS) quasi-Newton algorithm until the internal forces were less than 1 · 10 4 a.u. The strong electronic correlation of d-orbital electrons was taken into account through the Hubbard U-correction [25], calculating the Hubbard U-parameter from first principles using the Density Functional Perturbation Theory (DFPT) [26].
Core electrons were first replaced by ultrasoft pseudopotentials (USPPs) from PSlibrary [27]. The electronic configurations explicitly taken into account are 4 s 1.5 , 4 p 0 , 3 d 9.5 for 29Cu and 5 s 1 , 5 p 0 , 4 d 9 for 46Pd. Valence electron states were expanded in plane waves with a kinetic energy cutoff of 125 Ry, a charge density cutoff of 1000 Ry and a convergence threshold of 4 · 10 10 Ry. The Hubbard U-parameters were calculated on a 4 × 4 × 4 grid and converged to the values U(Cu-3d) = 12.1822 eV and U(Pd-4d) = 9.2512 eV. For structural optimization of the unit cell and calculation of the electronic bands, the first Brillouin zone was integrated with a Monkhorst–Pack (MP) mesh [28] of 12 × 12 × 12 points with a Marzari–Vanderbilt–DeVita–Payne [29] cold smearing parameter σ = 0.01 Ry. The results of the convergence tests are summarized in Figure 2.
Alternative calculations were performed by replacing core electrons with norm-conserving pseudopotentials (NCPPs) from the PseudoDojo library [30]. The electronic configurations explicitly taken into account are 3 s 2 , 3 p 6 , 3 d 10 , 4 s 1 for 29Cu and 4 s 2 , 4 p 6 , 4 d 10 for 46Pd. Valence electron states were expanded in plane waves with a kinetic energy cutoff of 125 Ry, a charge density cutoff of 1000 Ry and a convergence threshold of 4 · 10 10 Ry. The Hubbard U-parameters determined with a single-step calculation on a 2 × 2 × 2 grid are U(Cu-3d) = 10.7045 eV and U(Pd-4d) = 9.0743 eV. For structural optimization of the unit cell and calculation of the electronic bands, the first Brillouin zone was integrated with an MP mesh [28] of 12 × 12 × 12 points with a Marzari–Vanderbilt–DeVita–Payne [29] cold smearing parameter σ = 0.01 Ry. The results of the convergence tests are summarized in Figure 2.
Subsequent phonon analysis with both USPP and NCPP involved a preliminary non-self-consistent field (NSCF) calculation on a 20 × 20 × 20 grid followed by a dynamical matrices calculation using DFPT [31] on a 6 × 6 × 6 q-grid with a convergence threshold of 1 · 10 15 Ry.

3. Results

Geometry optimizations of Skaergaardite led to a slightly larger lattice parameter than the experimental one by 2.2% and 1.5% for USPP and NCPP, respectively as detailed in Table 1. In the same table, we report the three independent elastic constants that characterize cubic crystals ( C 11 , C 12 and C 44 ) calculated at 0 K as the numerical first derivative of the stress with respect to strain. We observe that the USPP values are slightly larger than the NCPP ones. Compared with the experimental values for the pure compounds, C 11 and C 12 values lie between those of Cu and Pd, while C 44 is larger. Based on these values, using the Voigt–Reuss–Hill (VRH) approximation [32], some mechanical parameters such as bulk modulus, shear modulus, Young’s modulus, Poisson’s ratio ( ν ) and sound velocities were estimated. As for the elastic constants, the USPP values are slightly larger than the NCPP ones. The set of calculated parameters compares with those obtained by Jain et al. [33] using full potential linearized augmented plane wave (FP-LAPW) in combination with PBE-GGA, WC-GGA and PBEsol-GGA and by Benmakhlouf et al. using USPP and PBE-GGA [34], as shown in Table 1.
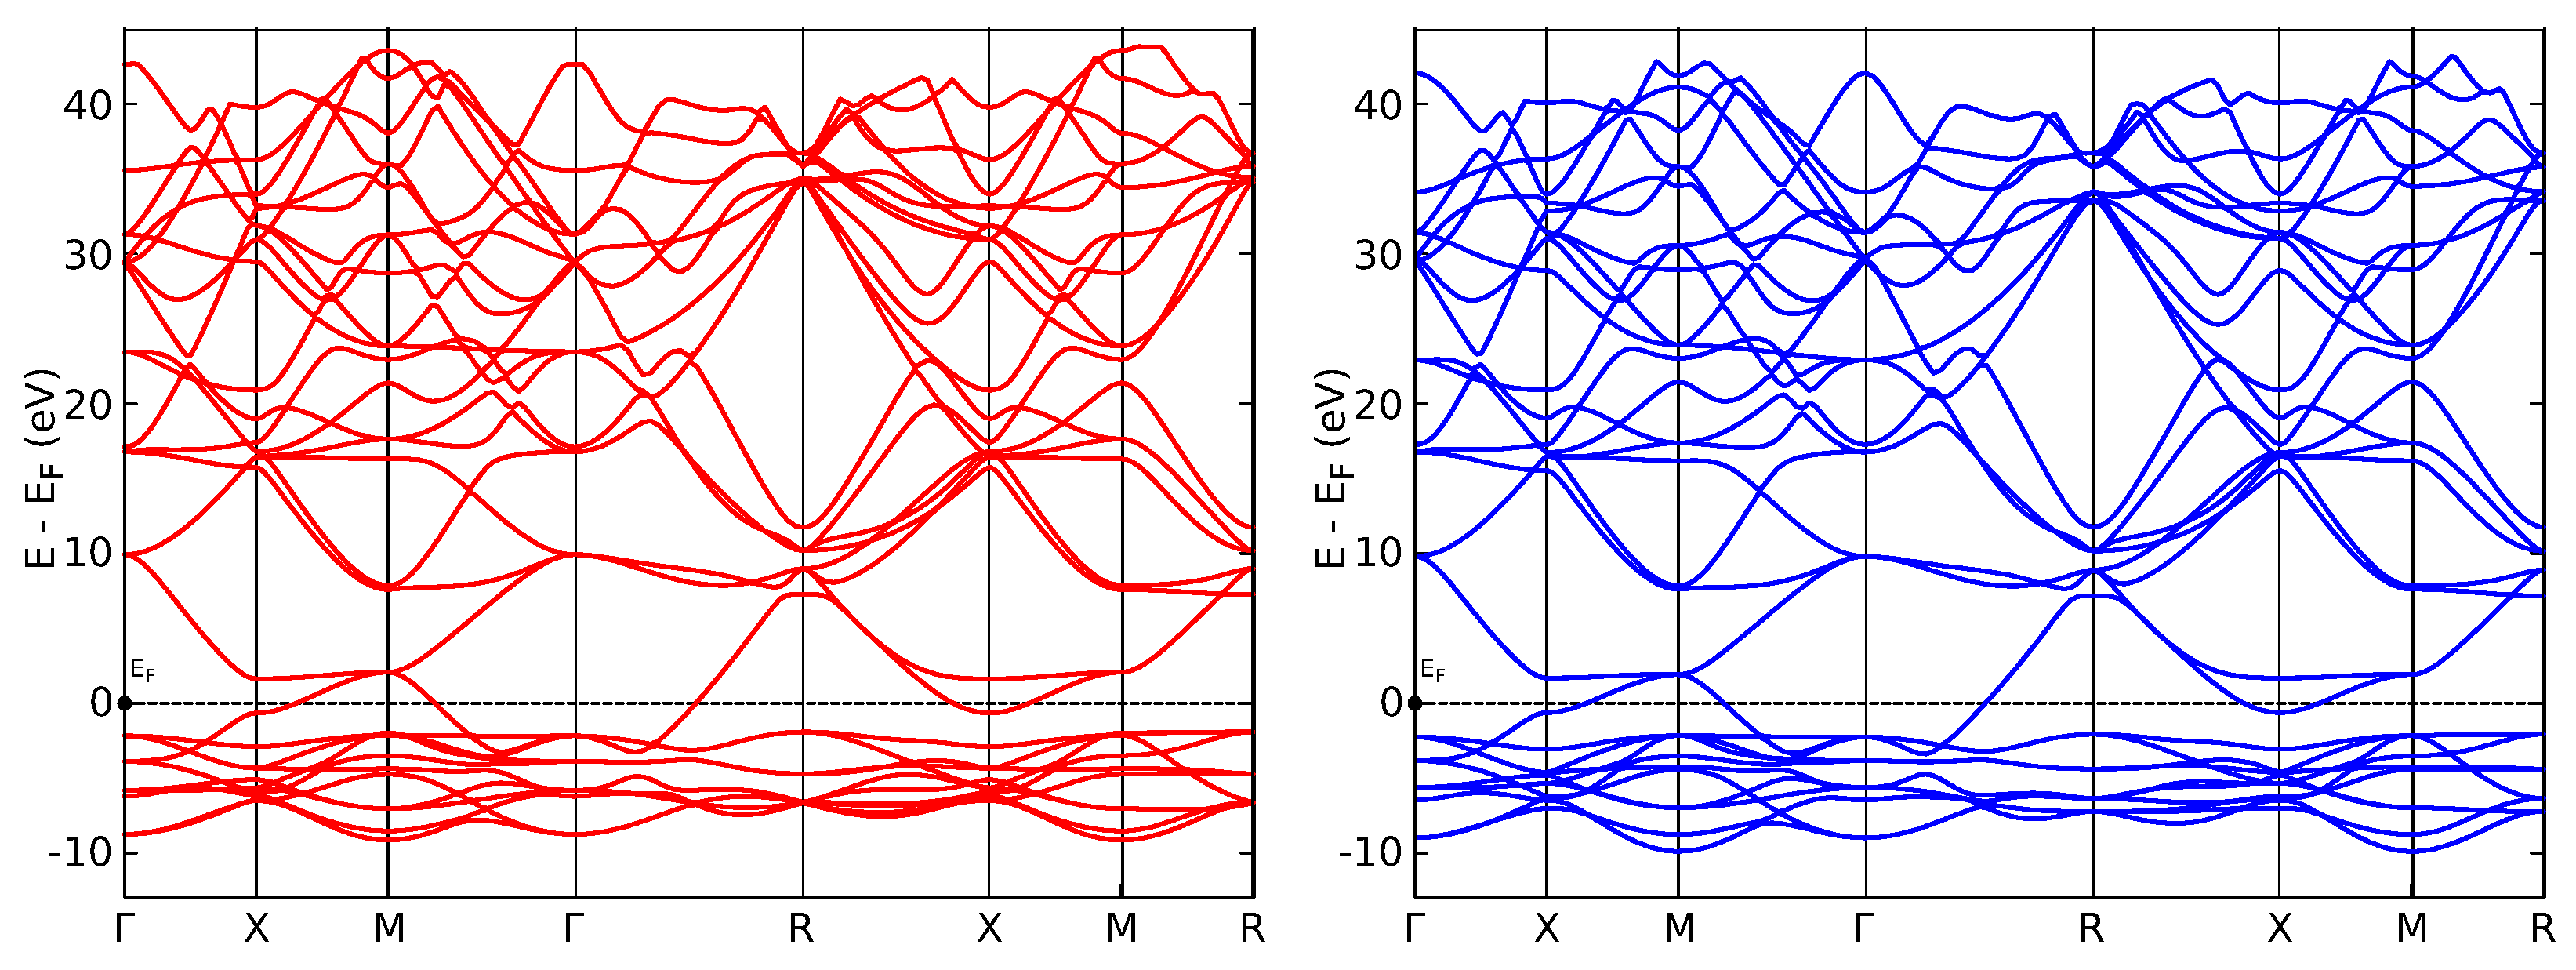
The computed electronic dispersion bands are compared in Figure 3 where the energy of the Fermi level ( E F U S P P = 10.9547 eV and E F N C P P = 16.1461 eV) has been set to zero. The band structures are calculated along the path that contains the highest symmetry points in the first Brillouin zone, as shown in Figure 1.
The corresponding density of state (DOS) diagrams, obtained taking into account 30 and 38 electronic bands explicitly for USPP and NCPP, respectively, are given in Figure 4.
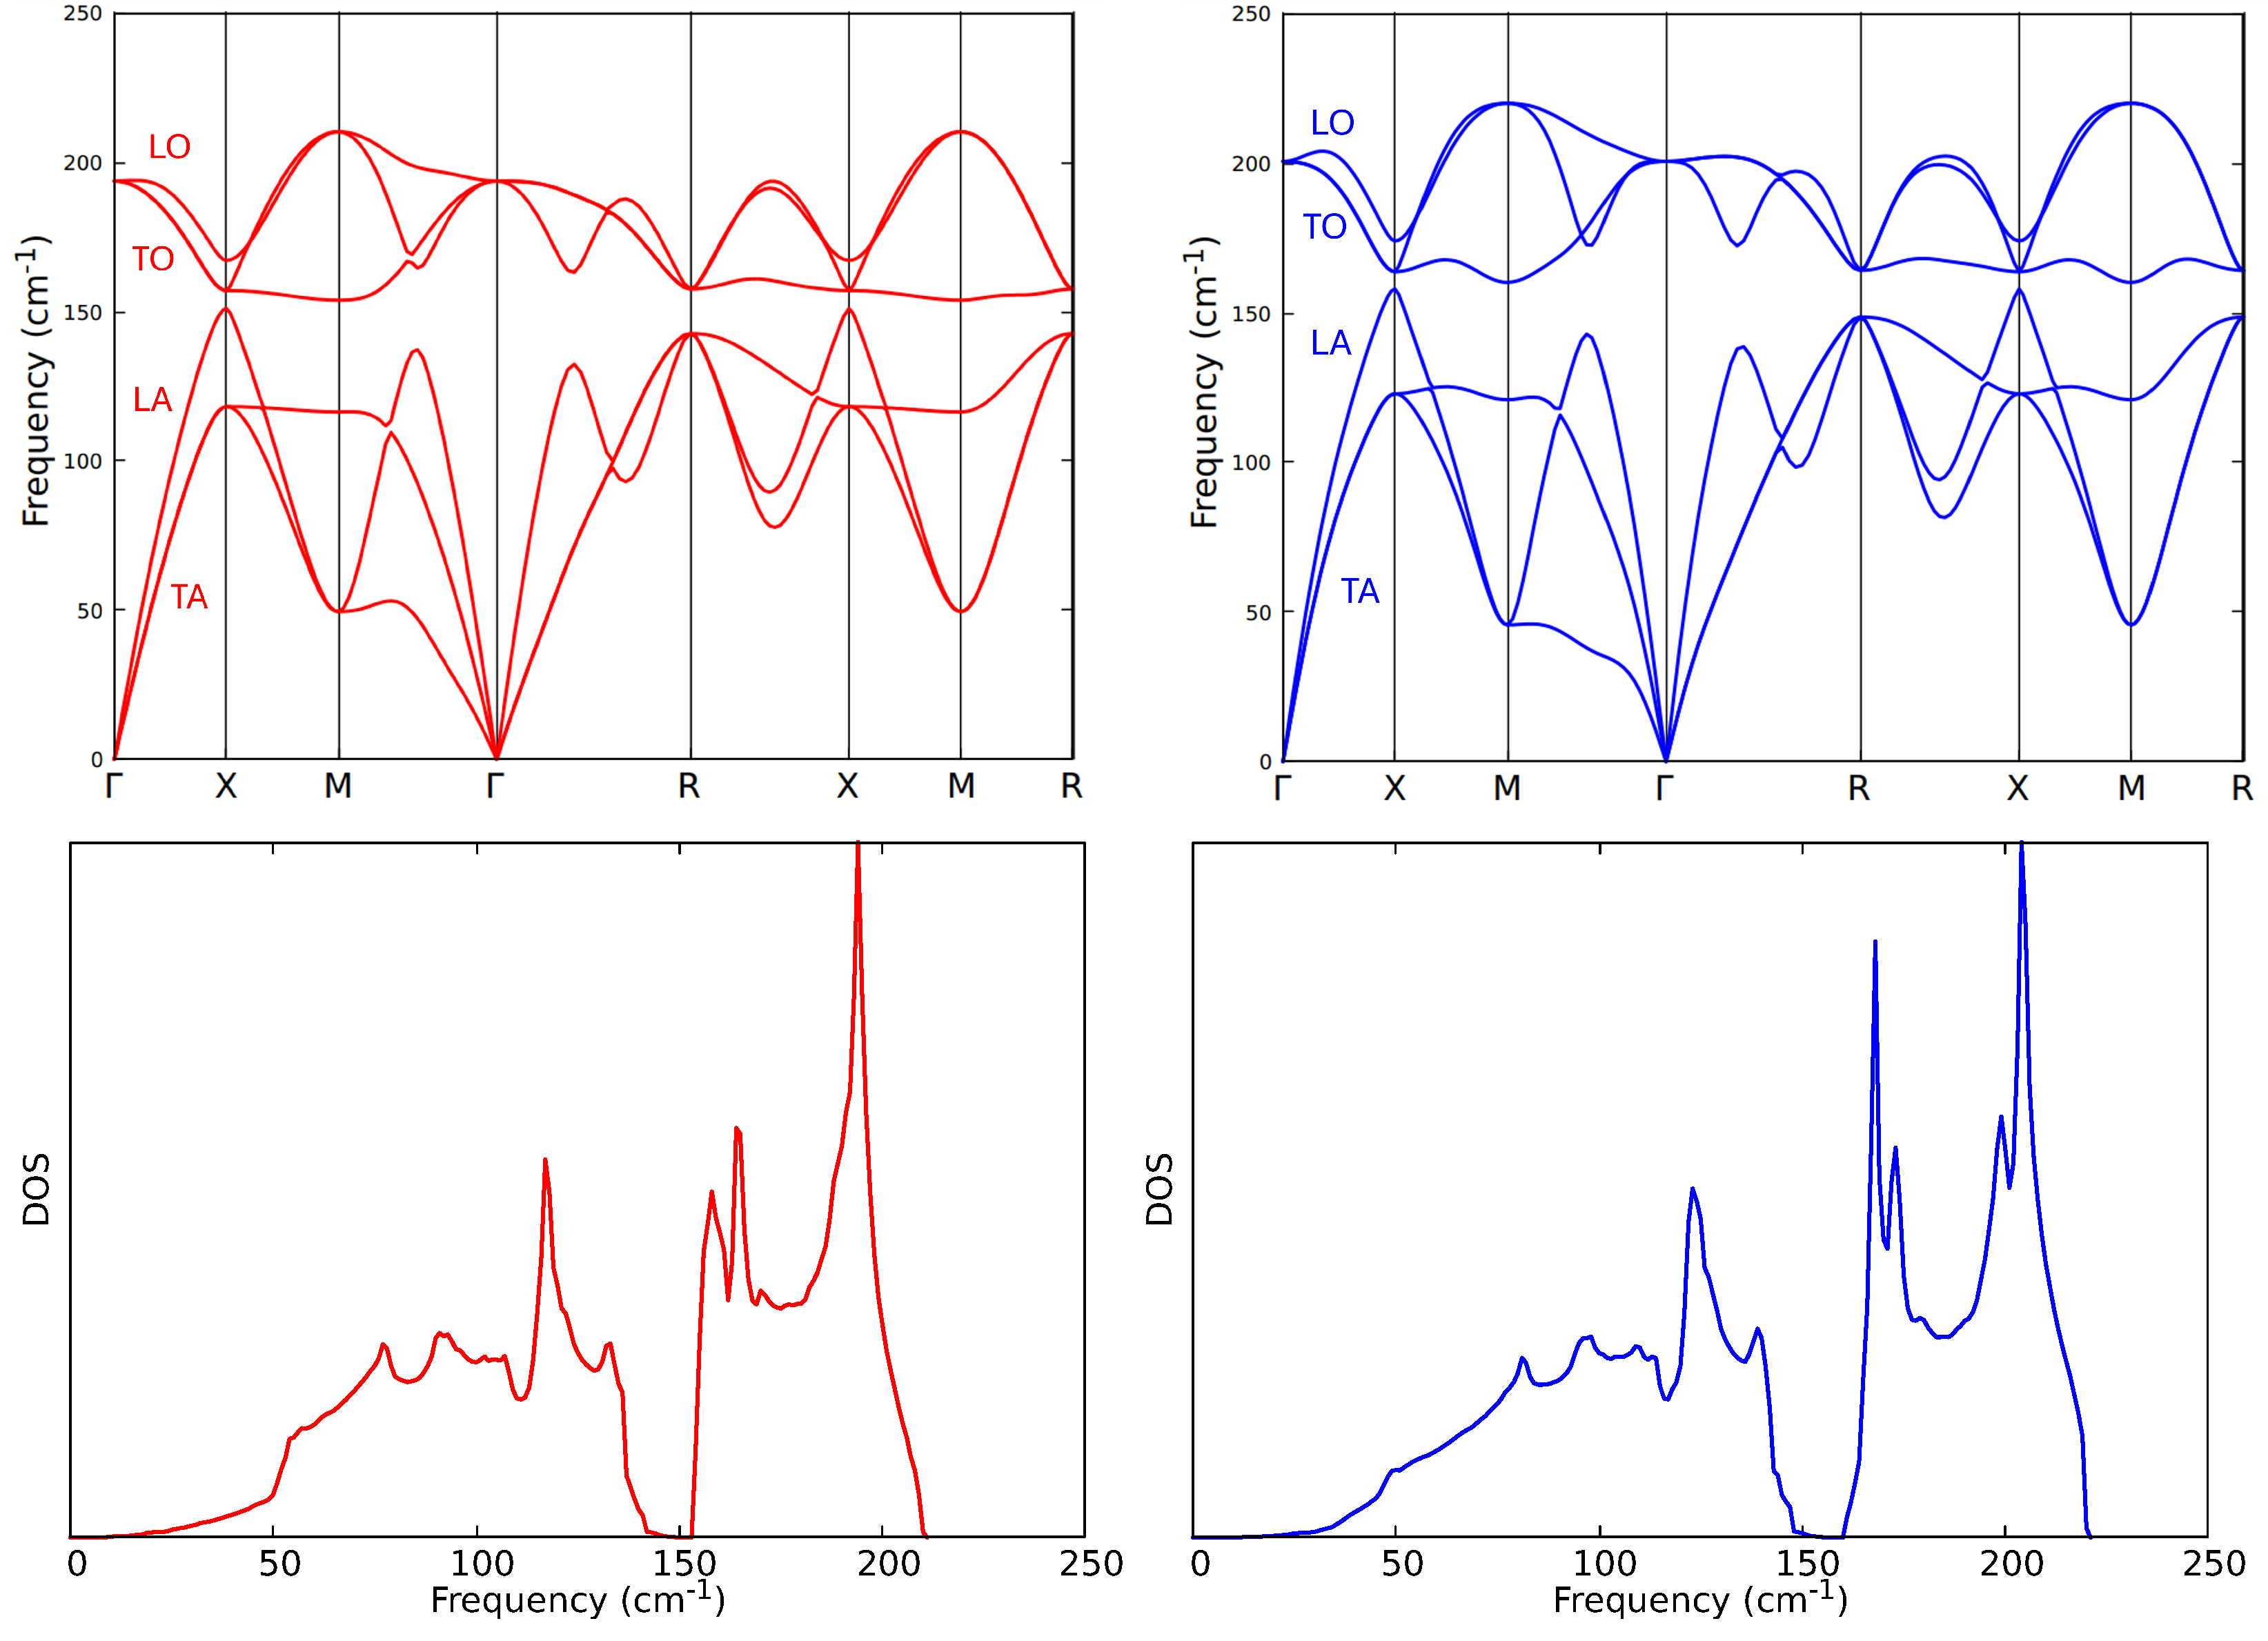
The phonon dispersion bands of Skaergaardite and the corresponding DOS diagrams simulated with USPP and NCPP are compared in Figure 5.
Relevant output files for the Quantum ESPRESSO and thermo_pw codes are freely available at the AMS Acta repository [36].

4. Discussion

The general trend of the electronic bands (Figure 3) and DOS (Figure 4) calculated with USPP and NCPP is similar. Both approaches predict the valence band to lay mainly between −2 and −10 eV. As an example, the valence band energy values at the Γ -point are compared in Table 2 with the corresponding orbital contributions.
At the high-symmetry points, the USPP bands show a higher degeneracy with respect to the NCPP ones. This different behavior is particularly evident at the R-point. Compared to the electronic valence band obtained in the Tight Binding Linear Muffin-Tin Orbitals Atomic Sphere Approximation (TB-LMTO-ASA) on a Γ -M-X- Γ -R path [37], our energy values at the M and R points are underestimated. Indeed, the minimum energy within the valence band is found at the M symmetry point at −9.145 eV and −9.916 eV by USPP and NCPP, respectively. In contrast, the TB-LMTO-ASA model locates the minimum energy level of the valence band in the Γ point at −8.487 eV. The same trend is found at the FP-LAPW/PBE-GGA level of calculation on a R- Γ -X-M- Γ path, with the minimum energy level of the valence band in the Γ point at about −8 eV [33].
The electronic density of state curves calculated with USPP and NCPP and represented in Figure 4 are qualitatively similar. Both are characterized by a dense valence band between the E F and −10 eV and a conduction band above 8 eV separated by a low-density region. In order to assess the contribution of the atomic orbitals of Cu and Pd within the electronic band structure, projected density of state curves were calculated and reported in Figure 4 as colored traces. Before analyzing the obtained results, it is important to take into account that Quantum ESPRESSO calculates wavefunction projections only over the atomic orbitals which are explicitly described by the pseudopotential. For this reason, the projections obtained with NCPP and USPP, which account for different atomic orbitals, are qualitatively different The atomic orbital contributions of the valence bands and the first conduction band at the Γ -point are listed in Table 2. USPP results suggest that the main contribution to the valence band is associated with Cu-3d and Pd-4d orbitals, whereas the Cu-4s, Cu-4p, Pd-5s and Pd-5p ones explain the conduction band peaks at low energy. The lower energy signals mostly originate from the Cu-3d orbitals, while the higher energy ones are mainly traced back to Pd-4d. However, also, the Cu-4s, Cu-4p, Pd-5s and Pd-5p orbitals have a not negligible contribution. In particular, they are responsible for the peak at −0.65 eV. Similarly, it is worth noticing that Pd-4d orbitals significantly contribute to the feature in the 1.3–2.3 eV conduction region. Comparison with Figure 5b of Jain et al. [33] concerning FP-LAPW/PBE-GGA calculations suggests that the color code for Pd-d and Pd-p could be reversed.
As regards the NCPP density of states, the distribution of the copper and palladium contributions in the valence band appears different, with the Cu-3d orbitals dominating in the center of the band and the Pd-4d orbitals prominent at the sides. NCPP prediction also enlightens an important contribution of Cu-4s to the energetics of the valence band that, according to linear muffin-tin orbital (LMTO) studies on CuPd and CuPt, plays a crucial role in the stabilization of the B2 arrangement [38]. Other differences concern the assignment of the peaks close to the Fermi energy: according to NCPP, the peak at −0.61 eV is mainly assigned to the Cu-4s orbital, while the contribution of the Pd-4d orbitals to the peak at 1.79 eV is strongly diminished to the USPP depiction. It is worth noting that except for the peaks around −0.6 and 1.8 eV, there is a pseudo-gap of 8–9 eV between the valence and conduction bands. In particular, according to both used pseudopotentials, at the Γ -point, the gap is 12 eV. Concerning the inner band, the energy values obtained with NCPP are the following: −110 eV (Cu-3s), −82 eV (Pd-4s), −67 eV (Cu-3p) and −47 eV (Pd-4p) with respect to the Fermi energy.
Comparing the electronic density of state curves obtained with or without [33,34,37] the Hubbard U-corrections, it is evident that including these electron correlation terms results in a downshift of the valence band relative to the Fermi level. In Figure 3, we observe that, aside from a small peak at about −0.6 eV, the valence band, mainly constituted by d orbitals, lies below −1.8 eV. In contrast, different calculations show the valence band reaching the Fermi level. Our results are consistent with a systematic study on 638 two-dimensional materials containing 3d transition metals, where U was set to 4 eV [39]. The authors demonstrate that applying the U-correction worsens the agreement with experimental lattice constants, generally increases the band gap and causes 21% of the materials to undergo a metal–insulator transition. Another notable difference due to the Hubbard U-corrections is the presence of a peak at +2 eV.
The phonon dispersion relations represented in Figure 5 show three acoustic and three optical branches, all characterized by T 1 u point symmetry. At the Γ -point, the optical branches are degenerate and the predicted frequency is 194 cm−1 with USPP and 201 with NCPP. The phonon density of state curves, reported in Figure 5, show an energy gap between the acoustic and optical branches corresponding to the LA-TO distance at the X-point: 151–157 cm−1 with USPP and 158–164 cm−1 with NCPP. As concerns the X-point, comparison with experimental data on the pure compounds [40,41] shows that the calculated frequencies of CuPd acoustic phonons are between those of copper and palladium as detailed in Table 3.
The low-frequency region of the density of states corresponding to the acoustic branches shows a peak at 117 cm−1 with USPP and 123 cm−1 with NCPP. The side peaks in the high-frequency region of the density of states (164 and 194 cm−1 with USPP, 168 and 204 cm−1 with NCPP) corresponding to the optical branches are typical of ordered structures [42].

5. Conclusions

In this study, we have successfully employed Density Functional Theory (DFT) with a self-consistent Hubbard U-correction to investigate the electronic and phonon properties of Skaergaardite (CuPd). Our results demonstrate the reliability of the DFT+U approach in studying bimetallic systems with limited experimental data. The electronic band structure reveals that the valence bands are primarily composed of Cu-3d and Pd-4d orbitals, with a pseudo-gap of about 8–9 eV. The inclusion of the Hubbard U-correction significantly impacts the valence dispersion band, resulting in the energy at the M-point being lower than at the Γ -point, and overall, causing a downward shift in the valence band. The phonon dispersion analysis shows distinct acoustic and optical branches, with a small gap between them, typical of ordered materials. The study utilized both USPP and NCPP to ensure the robustness of the results. While both approaches yielded similar trends in the electronic bands and density of states, some differences were observed. USPP results showed higher degeneracy at high-symmetry points compared to NCPP, particularly at the R-point. The phonon dispersion relations also exhibited slight variations, with USPP predicting slightly lower frequencies for acoustic phonons at the X-point compared to NCPP.

Author Contributions

Conceptualization, A.M.; methodology, M.N. and A.M.; validation, M.N. and A.M.; formal analysis, M.N. and A.M.; investigation, M.N. and A.M.; resources, A.M.; data curation, M.N. and A.M.; writing—original draft preparation, A.M.; writing—review and editing, M.N. and A.M.; visualization, M.N.; supervision, A.M. All authors have read and agreed to the published version of the manuscript.

Funding

This research received no external funding.

Data Availability Statement

The computational data supporting the findings of this study are openly available in the University of Bologna repository at https://doi.org/10.6092/unibo/amsacta/8237.

Acknowledgments

We acknowledge the CINECA award under the ISCRA initiative, for the availability of high-performance computing resources and support. We thank the University of Bologna for financial support (RFO, Ricerca Fondamentale Orientata). This research is a contribution to the Italian Space Agency (project HELENA, award n. 2023-9-U.0, CUP-F33C23000310006).

Conflicts of Interest

The authors declare no conflicts of interest.

References

  1. Yin, Z.; Palmore, G.T.R.; Sun, S. Electrochemical reduction of CO2 catalyzed by metal nanocatalysts. Trends Chem. 2019, 1, 739–750. [Google Scholar] [CrossRef]
  2. Wang, X.; Kariuki, N.; Vaughey, J.T.; Goodpaster, J.; Kumar, R.; Myers, D. Bimetallic Pd–Cu oxygen reduction electrocatalysts. J. Electrochem. Soc. 2008, 155, B602. [Google Scholar] [CrossRef]
  3. Woldu, A.R.; Huang, Z.; Zhao, P.; Hu, L.; Astruc, D. Electrochemical CO2 reduction (CO2RR) to multi-carbon products over copper-based catalysts. Coord. Chem. Rev. 2022, 454, 214340. [Google Scholar] [CrossRef]
  4. Jiang, T.-W.; Jiang, K.; Cai, W.-B. Electrochemical CO2 reduction on Pd-based electrodes: From mechanism understanding to rational catalyst design. J. Mater. Chem. A 2024, 12, 21515–21530. [Google Scholar] [CrossRef]
  5. Mustafa, A.; Shuai, Y.; Lougou, B.G.; Wang, Z.; Razzaq, S.; Zhao, J.; Shan, J. Progress and perspective of electrochemical CO2 reduction on Pd-based nanomaterials. Chem. Eng. Sci. 2021, 245, 116869. [Google Scholar] [CrossRef]
  6. Ma, S.; Sadakiyo, M.; Heima, M.; Luo, R.; Haasch, R.T.; Gold, J.I.; Yamauchi, M.; Kenis, P.J.A. Electroreduction of carbon dioxide to hydrocarbons using bimetallic CuPd catalysts with different mixing patterns. J. Am. Chem. Soc. 2017, 139, 47–50. [Google Scholar] [CrossRef]
  7. Xing, M.; Guo, L.; Hao, Z. Theoretical insight into the electrocatalytic reduction of CO2 with different metal ratios and reaction mechanisms on palladium–copper alloys. Dalton Trans. 2019, 48, 1504. [Google Scholar] [CrossRef]
  8. Mun, Y.; Lee, S.; Cho, A.; Kim, S.; Han, J.W.; Lee, J. Cu-Pd alloy nanoparticles as highly selective catalysts for efficient electrochemical reduction of CO2 to CO. Appl. Catal. B 2019, 246, 82–88. [Google Scholar] [CrossRef]
  9. Zhang, Z.-Y.; Wang, H.-B.; Zhang, F.-F.; Li, J.-W.; Hu, X.-Z.; Yan, S.-W.; Bai, Y.-M.; Zhang, X.; Shen, G.-R.; Yin, P.-F.; et al. Nanocavity enriched CuPd alloy with high selectivity for CO2 electroreduction toward C2H4. Rare Met. 2024, 43, 1513–1523. [Google Scholar] [CrossRef]
  10. Nie, S.; Wu, L.; Liu, Q.; Wang, X. Entropy-derived synthesis of the CuPd Sub-1nm alloy for CO2-to-acetate electroreduction. J. Am. Chem. Soc. 2024, 146, 29364–29372. [Google Scholar] [CrossRef]
  11. Piper, J. Diffusion of hydrogen in copper-palladium alloys. J. Appl. Phys. 1966, 37, 715–720. [Google Scholar] [CrossRef]
  12. Petriev, I.S.; Pushankina, P.D.; Andreev, G.A. Investigation of low-temperature hydrogen permeability of surface modified Pd–Cu membranes. Membr. Membr. Technol. 2023, 5, 360–369. [Google Scholar] [CrossRef]
  13. Rivera, D.J.; Muhich, C.L. Preventing H2S poisoning of dense Pd membranes for H2 purification using an electric-field: An Ab initio study. Surf. Sci. 2023, 733, 122303. [Google Scholar] [CrossRef]
  14. Lewis, F.A. The palladium-hydrogen system: Structures near phase transition and critical points. Int. J. Hydrogen Energy 1995, 20, 587–592. [Google Scholar] [CrossRef]
  15. Zhang, K.; Way, J.D. Palladium-copper membranes for hydrogen separation. Sep. Purif. Technol. 2017, 186, 39–44. [Google Scholar] [CrossRef]
  16. Subramanlan, P.R.; Laughlin, D.E. Phase equilibrium of Cu-Pd. J. Phase Equilibria 1991, 12, 231–240. [Google Scholar] [CrossRef]
  17. Geng, F.; Boes, J.R.; Kitchin, J.R. First-principles study of the Cu-Pd phase diagram. Calphad 2017, 56, 224–229. [Google Scholar] [CrossRef]
  18. Mukundan, V.; Yin, J.; Joseph, P.; Luo, J.; Shan, S.; Zakharov, D.; Zhong, C.-J.; Malis, O. Nanoalloying and phase transformations during thermal treatment of physical mixtures of Pd and Cu nanoparticles. Sci. Technol. Adv. Mater. 2014, 15, 025002. [Google Scholar] [CrossRef]
  19. Kamakoti, P.; Sholl, D.S. A comparison of hydrogen diffusivities in Pd and CuPd alloys using density functional theory. J. Membr. Sci. 2003, 225, 145–154. [Google Scholar] [CrossRef]
  20. Rudashevsky, N.S.; McDonald, A.M.; Cabri, L.J.; Nielsen, T.F.D.; Stanley, C.J.; Kretzer, Y.L.; Rudashevsky, V.N. Skaergaardite, PdCu, a new platinum-group intermetallic mineral from the Skaergaard intrusion, Greenland. Mineral. Mag. 2004, 68, 615–632. [Google Scholar] [CrossRef]
  21. Wyckoff, R.W.G. Crystal Structures, 2nd ed.; Interscience Publishers: New York, NY, USA, 1963; Volume 1, pp. 85–237. Available online: https://rruff.geo.arizona.edu/AMS/minerals/Skaergaardite (accessed on 30 March 2025).
  22. Giannozzi, P.; Andreussi, O.; Brumme, T.; Bunau, O.; Buongiorno Nardelli, M.; Calandra, M.; Car, R.; Cavazzoni, C.; Ceresoli, D.; Cococcioni, M.; et al. Advanced capabilities for materials modelling with QUANTUM ESPRESSO. J. Phys. Condens. Matter 2017, 29, 465901. [Google Scholar] [CrossRef]
  23. thermo_pw Is an Extension of the Quantum ESPRESSO Package. Available online: http://qeforge.qe-forge.org/gf/project/thermo_pw/ (accessed on 30 March 2025).
  24. Perdew, P.; Burke, K.; Ernzerhof, M. Generalized Gradient Approximation Made Simple. Phys. Rev. Lett. 1996, 77, 3865–3868. [Google Scholar] [CrossRef]
  25. Hubbard, J. Electron correlations in narrow energy bands. Proc. R. Soc. Lond. A 1963, 276, 238–257. [Google Scholar] [CrossRef]
  26. Timrov, I.; Marzari, N.; Cococcioni, M. Hubbard U-parameters from density-functional perturbation theory. Phys. Rev. B 2018, 98, 085127. [Google Scholar] [CrossRef]
  27. Corso, A. Pseudopotentials periodic table: From H to Pu. Comput. Mater. Sci. 2014, 95, 337–350. [Google Scholar] [CrossRef]
  28. Monkhorst, H.J.; Pack, J.D. Special points for Brillouin-zone integrations. Phys. Rev. B 1976, 13, 5188–5192. [Google Scholar] [CrossRef]
  29. Marzari, N.; Vanderbilt, D.; De Vita, A.; Payne, M.C. Thermal Contraction and Disordering of the Al(110) Surface. Phys. Rev. Lett. 1999, 82, 3296–3299. [Google Scholar] [CrossRef]
  30. Hamann, D.R. Optimized norm-conserving Vanderbilt pseudopotentials. Phys. Rev. B 2013, 88, 085117. [Google Scholar] [CrossRef]
  31. Baroni, S.; de Gironcoli, S.; Dal Corso, A.; Giannozzi, P. Phonons and related crystal properties from density-functional perturbation theory. Rev. Mod. Phys. 2001, 73, 515–562. [Google Scholar] [CrossRef]
  32. Hill, R. The Elastic Behaviour of a Crystalline Aggregate. Proc. Phys. Soc. A 1652, 65, 349–354. [Google Scholar] [CrossRef]
  33. Jain, E.; Gitanjali, P.; Chouhan, S.S.; Sanyal, S.P. Structural, electronic, elastic and thermal properties of some transition metal CuX (X = Sc and Pd) intermetallics: A FP-LAPW study. Comput. Mater. Sci. 2014, 52, 3315–3321. [Google Scholar] [CrossRef]
  34. Benmakhlouf, A.; Daoud, S.; Bouarissa, N.; Allaoui, O. Elastic constants and thermophysical properties of CuPd: First-principles study. Rev. Mex. Fís. 2025, 71, 020501. [Google Scholar] [CrossRef]
  35. Kittel, C. Introduction to Solid State Physics, 8th ed.; John Wiley & Sons, Inc.: Hoboken, NJ, USA, 2004; ISBN 0-471-41526-X. [Google Scholar]
  36. Napoli, M.; Maris, A. Reference data for Skaergaardite; University of Bologna: Bologna, Italy, 2025. [Google Scholar] [CrossRef]
  37. Dahal, S.; Kafle, G.; Kaphle, G.C.; Adhikari, N.P. Study of electronic and magnetic properties of CuPd, CuPt, Cu3Pd, and Cu3Pt: Tight binding linear muffin-tin orbitals approach. J. Inst. Sci. Technol. 2014, 19, 137–144. [Google Scholar] [CrossRef]
  38. Takizawa, S.; Blügel, S.; Terakura, K.; Oguchi, T. Theoretical study of the structural stability of CuPd and CuPt alloys: Pressure-induced phase transition of CuPt alloy. Phys. Rev. 1991, 43, 947. [Google Scholar] [CrossRef]
  39. Pakdel, S.; Olsen, T.; Thygesen, K.S. Effect of Hubbard U-corrections on the electronic and magnetic properties of 2D materials: A high-throughput study. npj Comput. Mater. 2025, 11, 18. [Google Scholar] [CrossRef] [PubMed]
  40. Miiller, A.P.; Brockhouse, B.N. Anomalous Behavior of the Lattice Vibrations and the Electronic Specific Heat of Palladium. Phys. Rev. Lett. 1968, 20, 798–801. [Google Scholar]
  41. Buhrer, W.; Schneider, T.; Gläser, W. Phonon dispersion in copper. Solid State Commun. 1966, 4, 443–446. [Google Scholar] [CrossRef]
  42. Fultz, B.; Anthony, L.; Nagel, L.J.; Nicklow, R.M.; Spooner, S. Phonon densities of states and vibrational entropies of ordered and disordered Ni3Al. Phys. Rev. B 1995, 52, 3315–3321. [Google Scholar]
Figure 1. Crystal structure of Skaergaardite (left side) and first Brillouin zone (right side) with highlighted high-symmetry points (red labels) and lines (blue labels).
Chemistry 07 00056 g001
Figure 2. Convergence tests for DFT calculations on Skaergaardite. (a) Energy cutoff convergence test. (b) k-grid convergence test. (c) Hubbard U-parameters convergence test for USPP.
Chemistry 07 00056 g002
Figure 3. Electronic dispersion bands of Skaergaardite simulated with USPP ((left), red trace) and NCPP ((right), blue trace).
Chemistry 07 00056 g003
Figure 4. Electronic density of state curve of Skaergaardite (black trace) and projections over atomic orbitals (colored traces) calculated with USPP (left) and NCPP (right) along the Γ -X-M- Γ -R-X path.
Chemistry 07 00056 g004
Figure 5. Phonon dispersion bands of Skaergaardite and density of state curves simulated with USPP ((left side), red trace) and NCPP ((right side), blue trace). Phonon branches are labeled by their longitudinal (L) or transversal (T) displacement and acoustic (A) or optical (O) character.
Chemistry 07 00056 g005
Table 1. Theoretical parameters of Skaergaardite: lattice parameter (a), interatomic distance ( d C u P d ), volume cell (V), density ( ρ ), elastic constants ( C i j ), bulk modulus (B), shear modulus (G), Young’s modulus (E), Poisson’s ratio ( ν ), compressional, shear and average sound velocities ( v s , v p and v m ), and Debye’s temperature ( θ D ).
USPPNCPPEXPEXPEXPFP-LAPW [33]USPP [34]
PBE-GGA+UPBE-GGA+UCuPdCuPdPBE-GGAWC-GGAPBEsol-GGAPBE-GGA
a3.05313.03432.988 [21]3.6150 [21]3.8898 [21]3.01452.96632.95603.002
d C u P d 2.64402.62752.588
V328.45927.93726.677
ρ /kg m39918.1510,125.67 10,303.04 a
C 11 /GPa199.78178.18 176.2 [35]234.1 [35]184.03217.54208.66181.07
C 12 /GPa163.88154.13 124.9 [35]176.1 [35]144.12173.72185.01150.40
C 44 /GPa100.0195.12 81.4 [35]71.2 [35]60.8794.1169.4797.10
B/GPa173.51162.15 158.85184.92188.84160.04
E/GPa131.77118.37 108.00 a 130.21
G/GPa48.5143.50 38.97 a 47.70
ν 0.35830.3581 0.386 a 0.365
v p /m s−14900.724663.84 4586.79 a 4635
v s /m s−12211.662074.43 2078.34 a 2138
v m /m s−12363.542191.36 2343.30 a 2408
θ D /K290.41287.56 291.49 a 301
a Values from the corrigendum.
Table 2. Valence band energy values (eV) and atomic orbital contributions at the Γ -point of Skaergaardite.
USPP NCPP
Degeneracy E - E F CuPd E - E F CuPd
2−8.7664d 0.483d 0.52−9.0093d 0.454d 0.55
1−6.2195s 0.544s 0.46−6.4854s 0.94
3−5.8294d 0.213d 0.79−5.6383d 0.744d 0.26
2−3.8914d 0.523d 0.48−3.8413d 0.554d 0.45
3−2.1884d 0.793d 0.21−2.2633d 0.264d 0.74
3+9.9094p 0.635p 0.36+9.801n.a.n.a.
Table 3. Transverse and longitudinal phonon acoustic frequencies (cm−1) at the X-point.
TALA
Pdexp. [40]155226
CuPdNCPP123158
CuPdUSPP118151
Cuexp. [41]100141
Disclaimer/Publisher’s Note: The statements, opinions and data contained in all publications are solely those of the individual author(s) and contributor(s) and not of MDPI and/or the editor(s). MDPI and/or the editor(s) disclaim responsibility for any injury to people or property resulting from any ideas, methods, instructions or products referred to in the content.