Article

Rapid and Accurate Prediction of the Melting Point for Imidazolium-Based Ionic Liquids by Artificial Neural Network

1
Institute for Energy Research, Jiangsu University, Zhenjiang 212013, China
2
School of the Environment and Safety Engineering, Jiangsu University, Zhenjiang 212013, China
3
Engineering Research Center of Tropical Marine Functional Polymer Materials of Hainan Province, Key Laboratory of Water Pollution Treatment and Resource Reuse of Hainan Province, Key Laboratory of Functional Organic Polymers of Haikou, College of Chemistry and Chemical Engineering, Hainan Normal University, Haikou 571158, China
*
Authors to whom correspondence should be addressed.
Chemistry 2024, 6(6), 1552-1571; https://doi.org/10.3390/chemistry6060094
Submission received: 26 September 2024 / Revised: 23 November 2024 / Accepted: 27 November 2024 / Published: 30 November 2024
(This article belongs to the Section Theoretical and Computational Chemistry)

Abstract

:
Imidazolium-based ionic liquids (ILs) have been regarded as green solvents owing to their unique properties. Among these, the melting point is key to their excellent performance in applications such as catalysis, biomass processing, and energy storage, where stability and operational temperature range are critical. The utilization of neural networks for forecasting the melting point is highly significant. Nevertheless, the excessive selection of descriptors obtained by density functional theory (DFT) calculations always leads to huge computational costs. Herein, this study strategically selected only 12 kinds of quantum chemical descriptors by employing a much more efficient semi-empirical method (PM7) to reduce computational costs. Four principles of data pre-processing were proposed, and the innovative use of a simulated annealing algorithm to search for the lowest energy molecular conformation improved accuracy. Based on these descriptors, a multi-layer perceptron neural network model was constructed to efficiently predict the melting points of 280 imidazolium-based ILs. The R2 value of the current model reached 0.75, and the mean absolute error reached 25.03 K, indicating that this study achieved high accuracy with very little computational cost. This study reveals a strong correlation between descriptors and melting points. Additionally, the model accurately predicts unknown melting points of imidazolium-based ILs, achieving good results efficiently.

Graphical Abstract

1. Introduction

Ionic liquids (ILs) are molten salts composed of cations, such as imidazolium, benzotriazolium, pyrrolidinium, piperidinium, quinolinium, and other organic compounds, along with anions comprising diverse organic and inorganic substances. Imidazolium-based ionic liquids are extensively researched among many types of ionic liquids [1,2,3,4,5], possessing a series of unique physicochemical properties, including negligible vapor pressure, excellent thermal stability, high electrical conductivity, and low flammability. Due to these properties, imidazolium-based ILs are considered potential green solvents or catalysts [6,7]. The versatility of the imidazolium-based ILs is evident in their wide range of applications, such as chemical catalysis solvents, biocatalysis, chromatography and analysis, biomass pretreatment and processing, electrochemical applications, engineering fluids, and other miscellaneous applications [8,9,10,11,12,13]. The synthesis of imidazolium-based ILs, tailored for specific uses, is a significant focus of current research.
The melting point, a fundamental physical property extensively utilized in chemistry, plays a vital role in differentiating ILs from other salts [14]. In addition to being a reference for the purity assessment, aiding in determining various significant physical and chemical properties, including vapor pressure and water solubility [15], the melting point of ILs establishes its operational temperature range [16]. One example is when ILs serve as liquid organic hydrogen carriers (LOHCs). Due to LOHC dehydrogenation, it is preferable to conduct this process at the lowest achievable temperature to ensure stability and minimize energy loss [17]. In practical applications, when selecting an appropriate IL for a specific purpose, it is crucial to make accurate predictions of specific properties rather than relying on general ranges, such as “low melting point” or “high viscosity” [18]. In the past, quantitative structure–activity relationship (QSPR) modeling has provided extensive data support for experiments and applications in the field of chemistry [19,20,21]. Trohalaki et al. successfully predicted the melting point of a recently synthesized IL using a mathematical QSAR model based on molecular orbitals and electrostatic descriptors [19]. Mathematical models, as the fundamental basis for quantitative analysis across diverse disciplines, are developed through a combination of first principles and empirical observations. The growing complexity of modern systems makes parameter estimation increasingly challenging, often involving many parameters.
In contrast, machine learning models excel at effectively addressing these challenges through the efficient handling of large parameter spaces and the provision of robust solutions for complex modeling problems [22]. Machine learning models offer several advantages, including the absence of complex programming requirements, rapid execution, high precision, and an easy-to-use framework. As a result, machine learning models have emerged as a powerful tool in various fields for data analysis, prediction, and decision-making [23,24,25,26,27]. Therefore, over the past few years, a series of predictions have been conducted on the physicochemical properties of ILs, particularly the melting point, using machine learning techniques [1,28,29,30,31,32,33,34]. Valderrama et al. employed the group contribution method to construct a four-layer neural network structure for predicting the melting points of 667 ILs. The model achieved an average absolute error of less than 10% (~30 K) [30]. Low et al. introduced a kernel ridge regression (KRR) model that integrated five quantum chemical descriptors calculated using density functional theory (DFT) alongside the extended connectivity fingerprint (ECFP) and Coulomb matrix. This model exhibited a strong correlation, as indicated by an R-squared (R2) value of 0.76, between the predicted and experimental values [32]. In order to avoid the high computational cost of DFT, it was observed that in a prior investigation, 113 descriptors were computed using the PM6 level, yielding R2 values between 0.64 and 0.67 for all three models with reduced accuracy [31].
In the previous prediction of the physical and chemical properties of ILs, the neural network combined with multiple descriptors achieved accurate prediction results. These descriptors include a range of quantum chemical descriptors, molecular fragments, three-dimensional structural features, as well as other structural and electronic descriptors [18,28,30,31,35,36]. However, these descriptors are only used to enhance prediction accuracy and establish higher precision models instead of studying the chemical relationship between the melting point and descriptor. In essence, the melting point of ILs can be accurately predicted by the thermodynamic cycle model and accurate quantum chemical calculation. The physicochemical parameters involved in this thermodynamic cycle model include the molar volume, lattice enthalpy, intermolecular forces (such as van der Waals interactions and hydrogen bonding), temperature, and pressure [37]. These parameters are essential in determining the Gibbs free energy changes throughout the cycle, contributing to the accurate prediction of the melting point of ILs. Nevertheless, the utilization of this method demands substantial computational resources, contributing to a relatively sluggish pace in the research progress within this domain. Hence, it is imperative to address the challenges outlined above, encompassing issues such as significant prediction errors, a redundant descriptor selection, elevated computational costs associated with DFT, the expenses incurred in processing high-dimensional data, and inherent limitations in scalability.
Inspired by the previous study, crucial physicochemical parameters inherent to the aforementioned thermodynamic cycle model, along with quantitative parameters associated with these physicochemical attributes, were utilized as descriptors for ILs in this study [37]. Additionally, a detailed examination of the chemical significance of these descriptors and their correlation with the melting points of ILs was undertaken. The primary objectives of this paper are to attain high-precision predictive outcomes, streamline the number of descriptors employed, and minimize computational costs—a focal point within the current research landscape. To be specific, this study proposes a method that utilizes only 12 physical and chemical descriptors at the semi-empirical PM7 level. A melting point prediction model for imidazolium-based ILs was established in this study, aiding in the rapid and accurate prediction of the melting point for specific ILs. This model guides the selection of ILs with different melting points, addressing the challenges in choosing ILs in practical applications.

2. Data and Models

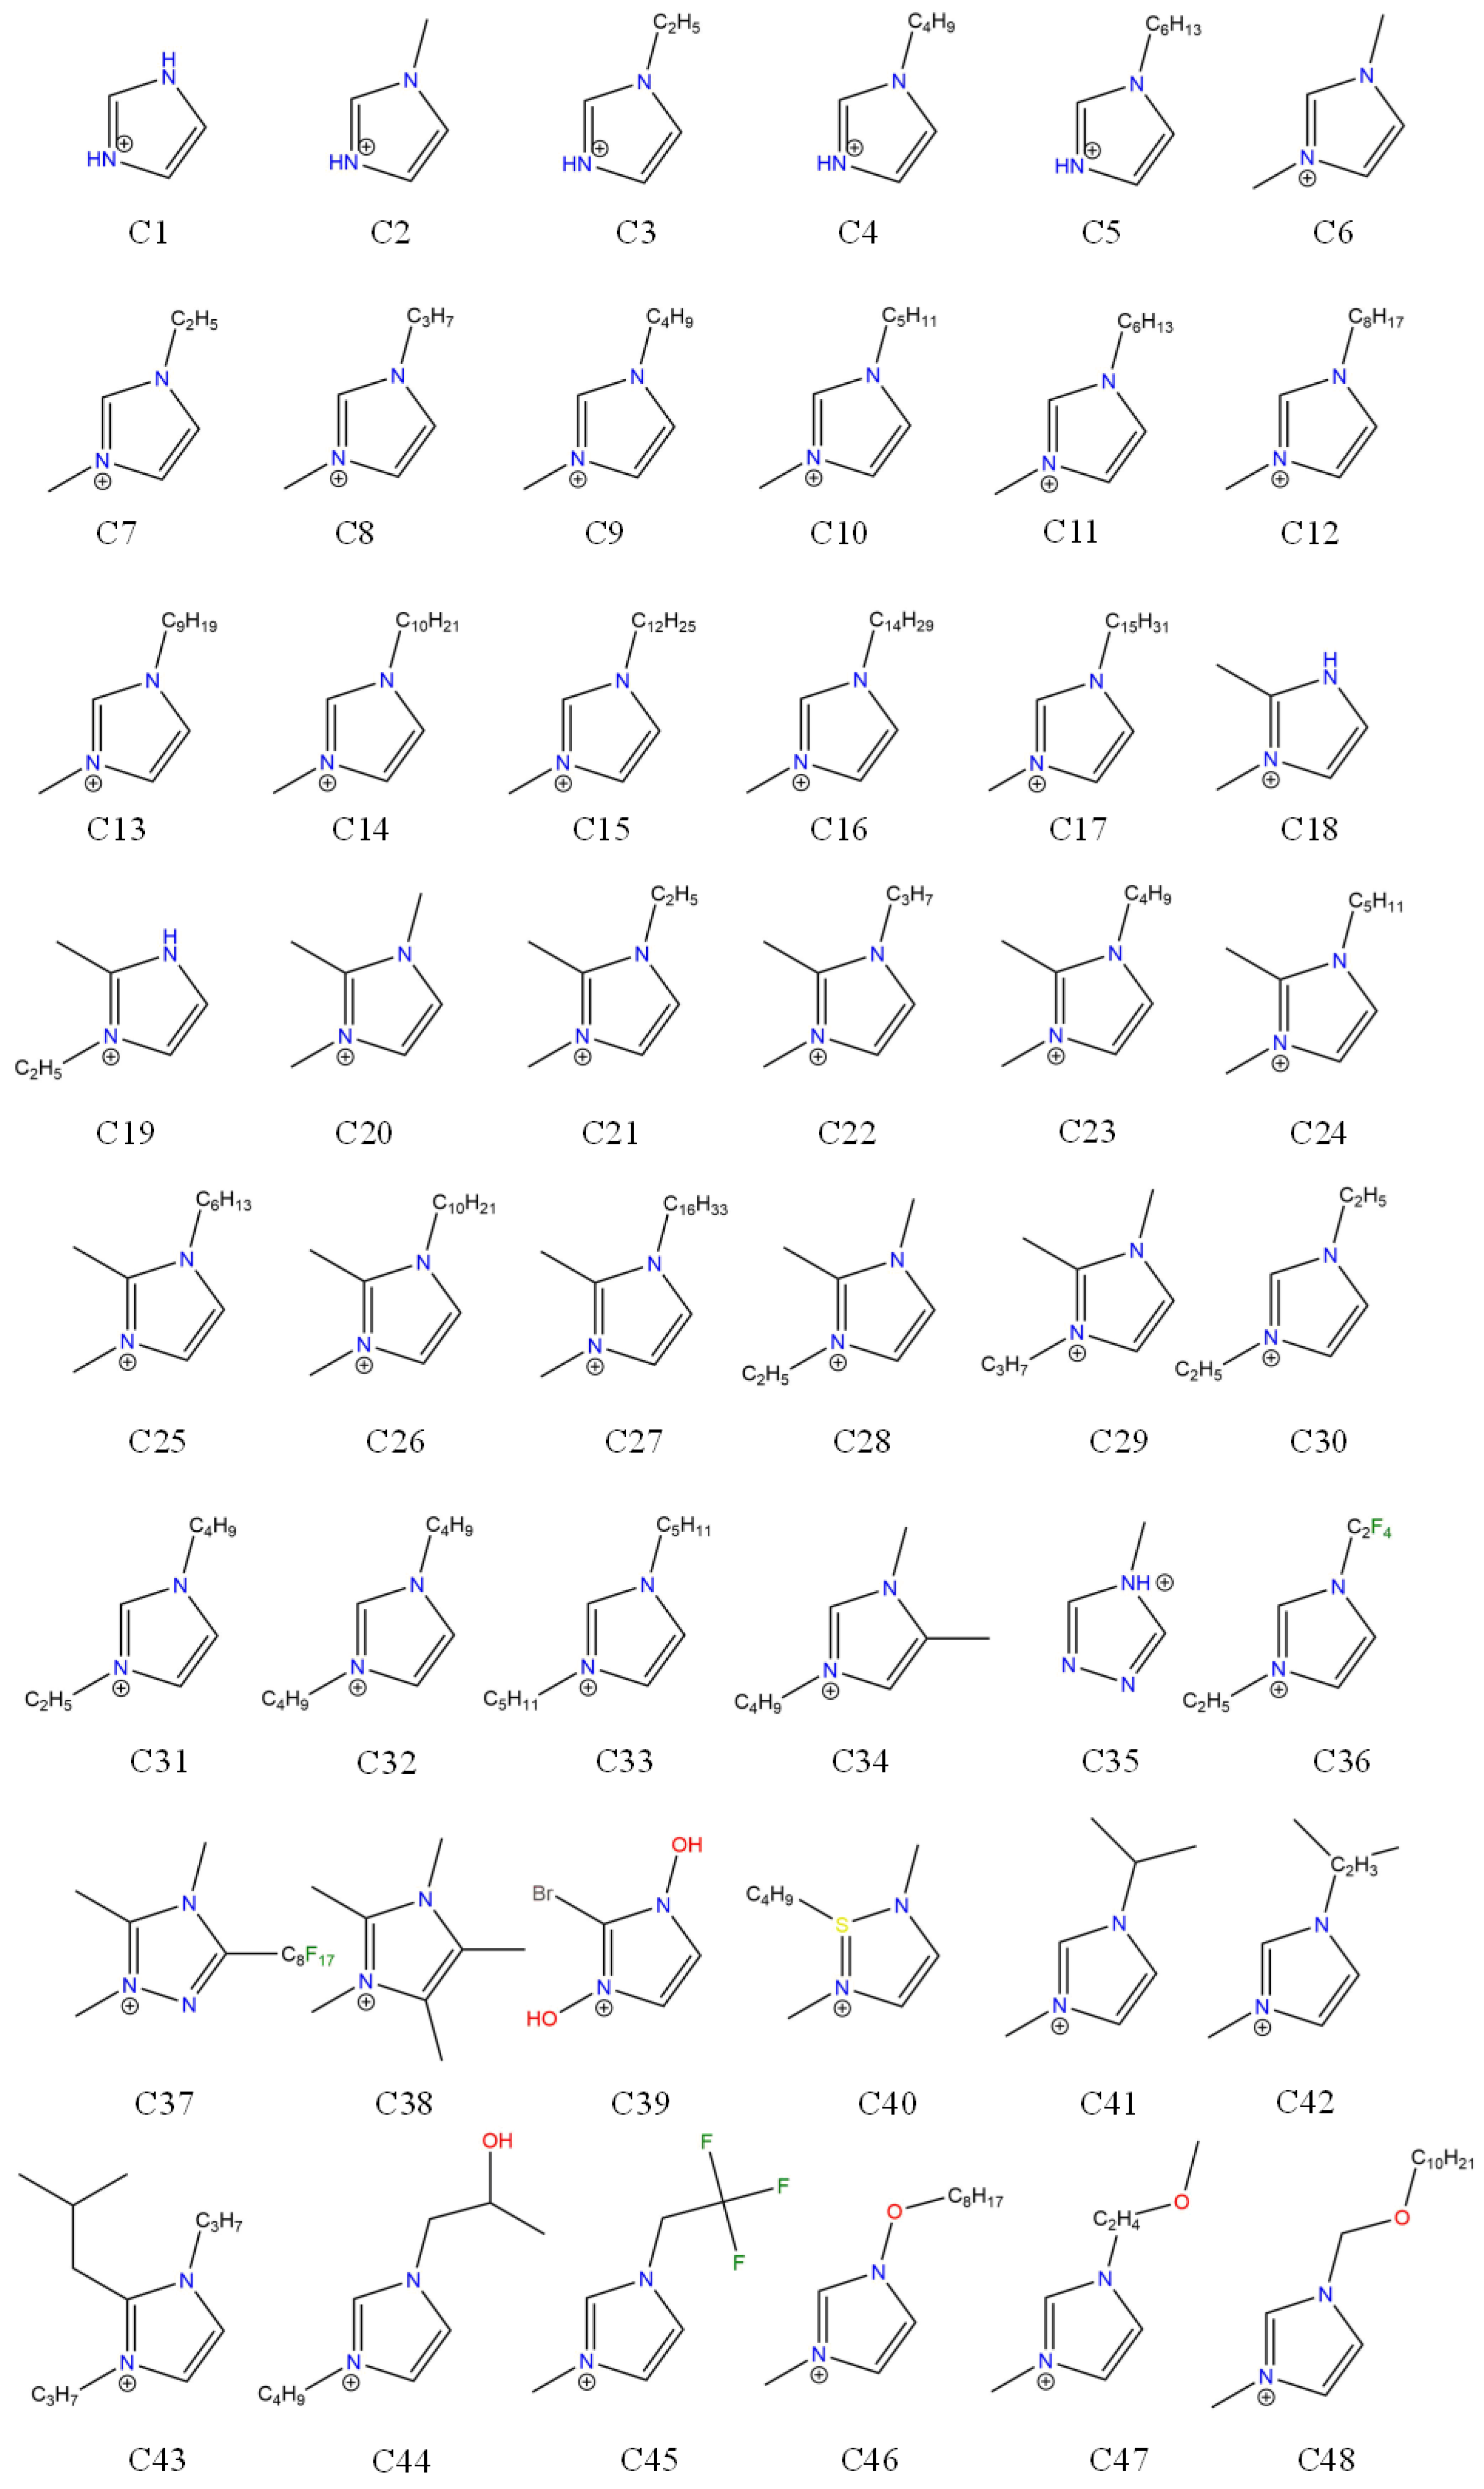
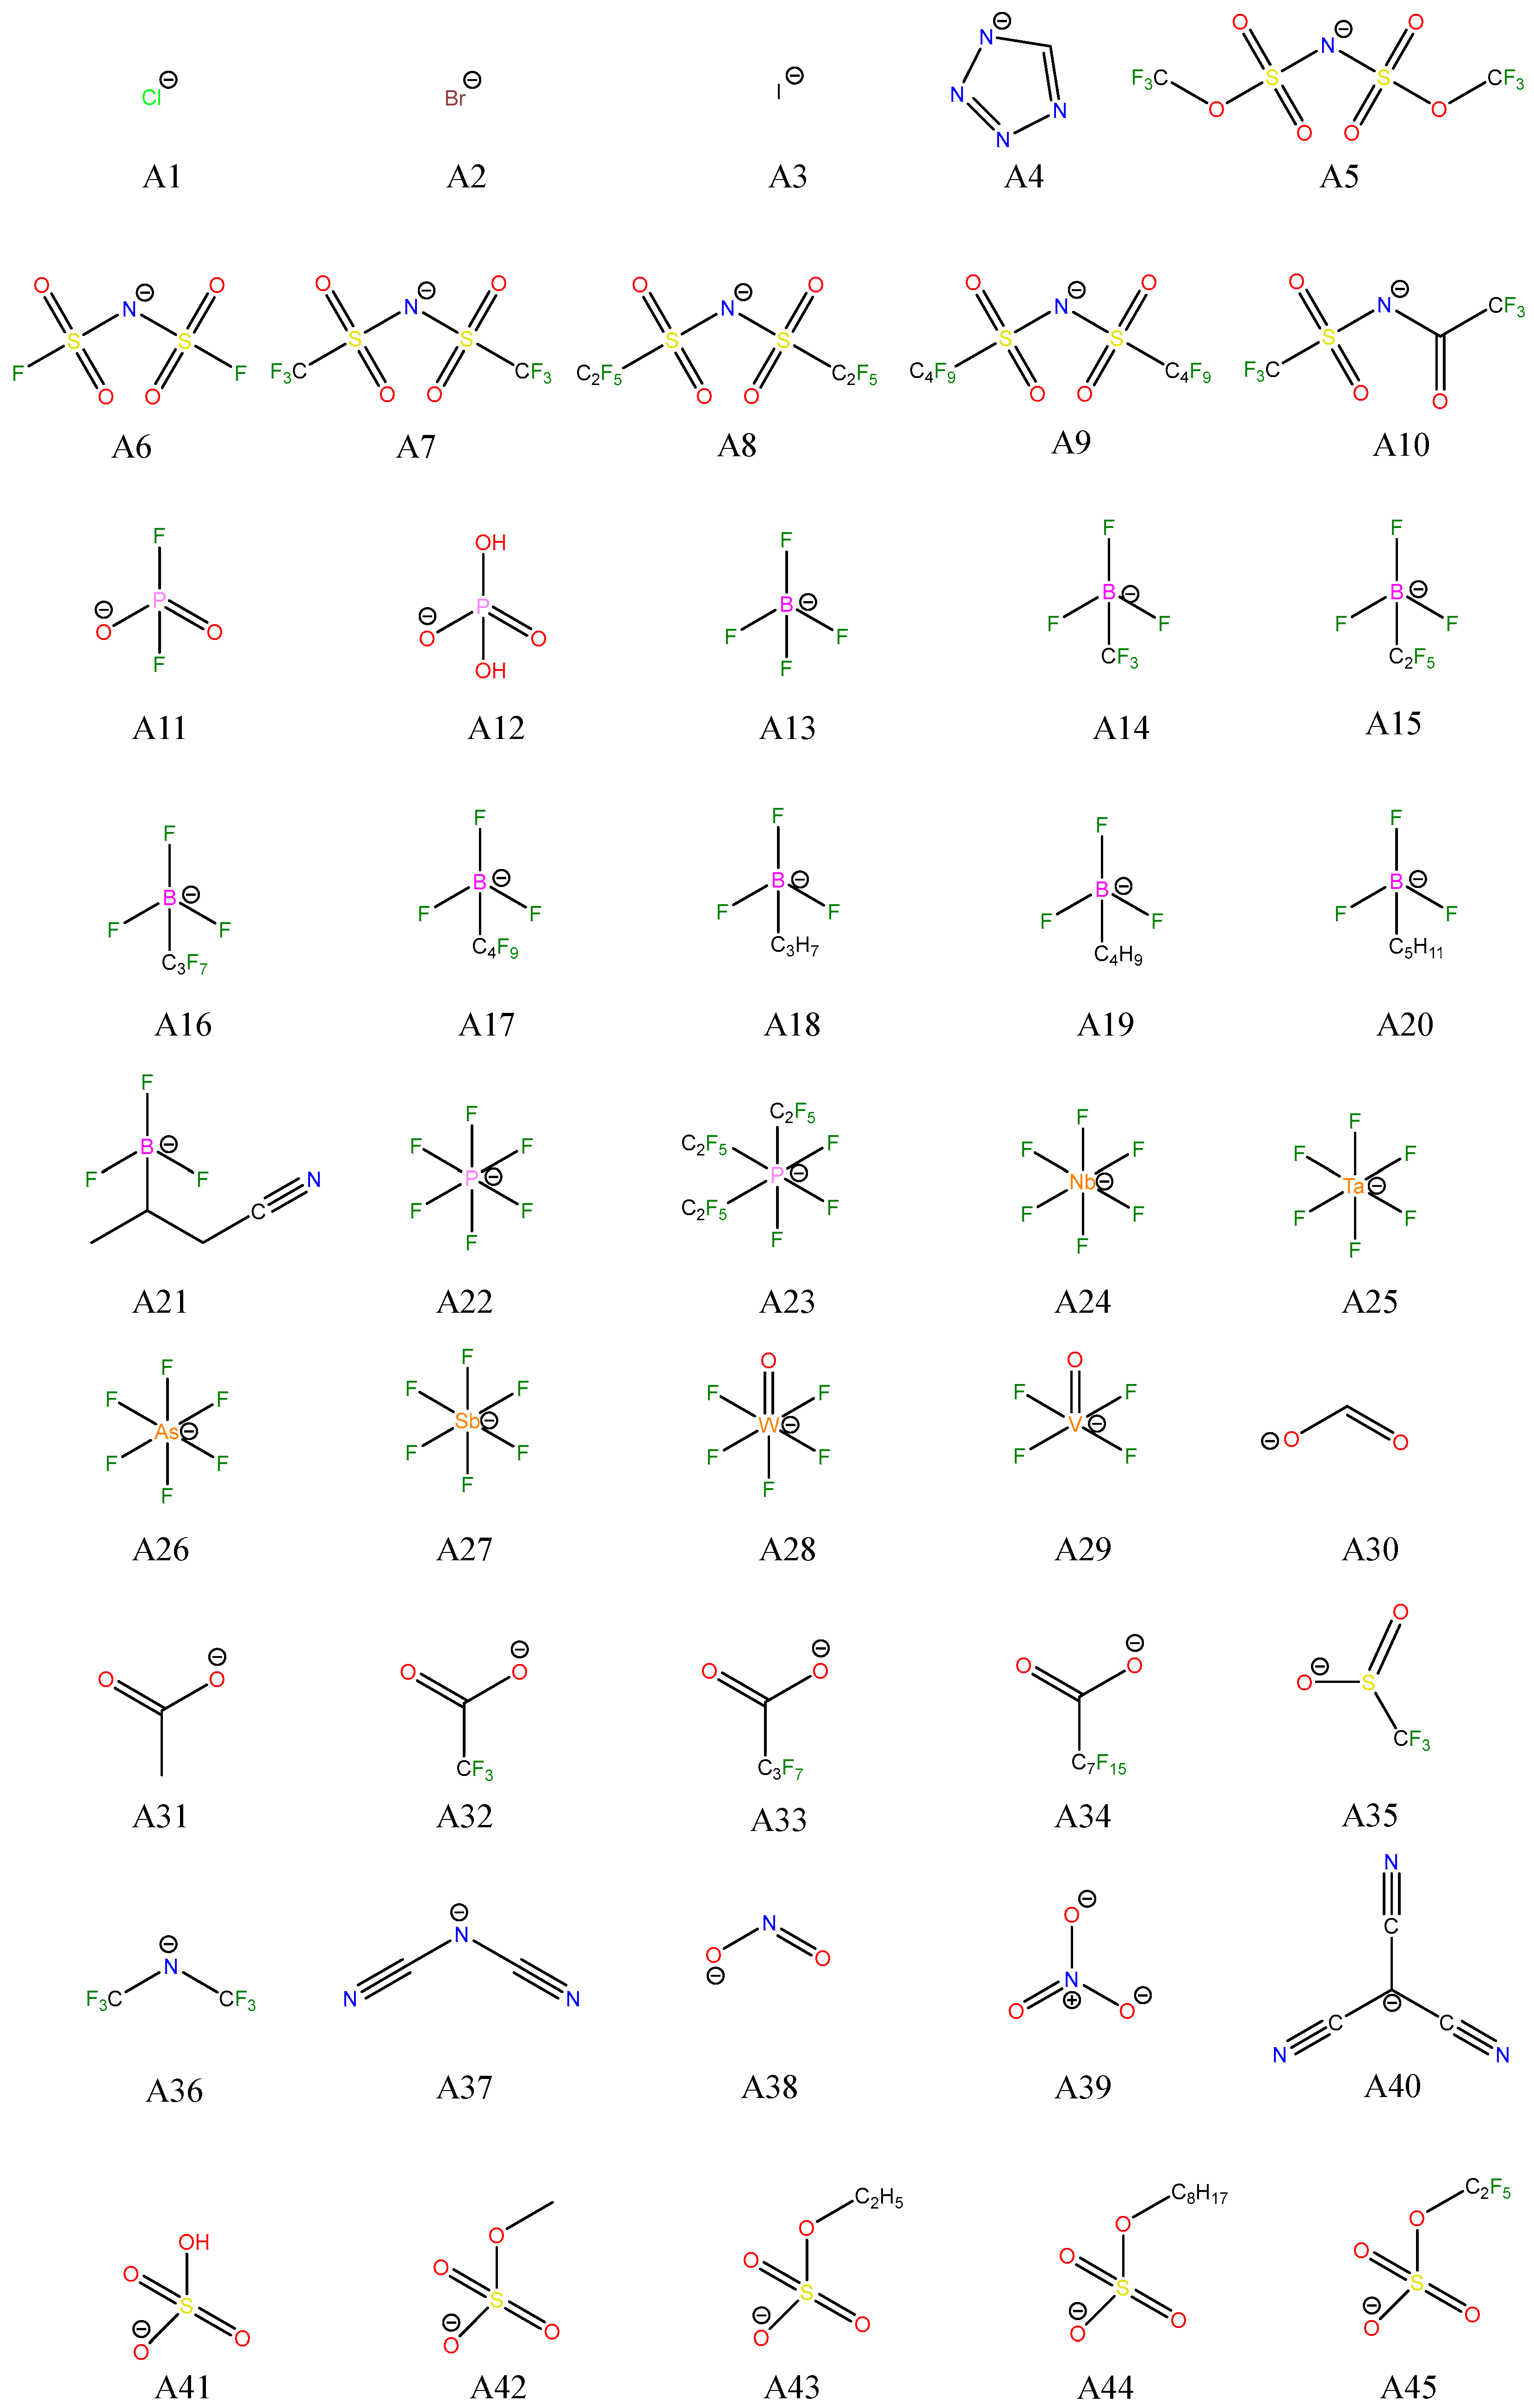
2.1. Data and Descriptor Selection

2.1.1. Database

The database used in this study contains a total of 280 imidazolium-based ILs. Specific ILs can be found in Table S1. Some of them refer to the study of Torrecilla, J. S. et al. [1]. Others are collected from IL databases (IPE, [38]). The melting points of the database range from 180 K to 460 K. Figure 1 and Figure 2 present the structures of anions (A) and cations (C), respectively, with each species assigned a corresponding number. A subset of these structures is shown in Figure 1 and Figure 2, while the others are in the Supporting Information (Figures S1 and S2).

2.1.2. Data Pre-Processing

The database used in this study contains a total of 280 imidazolium-based ILs. The melting point of ILs can be influenced by various factors such as impurities, the measurement technique used, and other contextual elements. For the IPE Ionic Liquid Database [38], the melting points were sourced from multiple references in the literature. Given the potential variations in reported melting point values, specific protocols here have been established to reduce inconsistencies in the database:
(1)
If a particular melting point value for ILs with multiple melting temperature (Tm) values occurs three times or more in different experiments, then it is considered to be accurate.
(2)
If the variation in experimental melting point temperatures measured for a single IL falls within a range of less than 10 K, and no identical value occurs more than three times, then the mean value is chosen.
(3)
If there are data points that appear at least three times but differ from other data by no more than 10 K, the method of calculating the average is chosen.
(4)
If measurements of melting point temperatures for a single IL show variations exceeding 10 K across different literature sources, with no repeated occurrence of the same value more than three times, or if multiple instances of a value appear more than three times but their differences exceed 10 K, then these discrepancies imply a debatable nature of the melting point of the IL, warranting the utilization of the model for verification purposes.

2.1.3. Selection of Descriptors

In essence, the melting point of ILs can be accurately predicted using a Born–Fajans–Haber cycle combined with accurate quantum chemical calculations. Previous research accurately predicted the melting points of ILs using either first-principles methods or molecular dynamics techniques. (The cyclic diagram can be found in Figure S3) [37,39]. These findings undeniably demonstrate the direct influence of the Gibbs fusion free energy on the melting point. However, the direct computation of the Gibbs fusion free energy (ΔfusG) is not feasible. Therefore, in the Born–Fajans–Haber cycle, ΔfusG can be estimated through the lattice Gibbs energy (∆lattG) of groups in molten salts and the solvation of Gibbs energy (∆solvG) [37].
ΔlattG is affected by the size and interaction of anions and cations, with larger ions leading to a reduced lattice enthalpy that facilitates melting [37]. The size of the ions is quantified by volume and mass, with volume being a more convenient parameter than ion radius. The volumes of symmetric and asymmetric ions can be precisely measured. Therefore, this study selected volume and mass descriptors for both anions and cations [37,40].
Furthermore, the investigation of intermolecular interaction forces holds paramount significance in chemical research [41]. These interactions not only impact the lattice enthalpy but also manifest their influence on the melting point in other research studies [42]. For example, imidazolium-based ILs with flexible side chains tend to exhibit significant interionic van der Waals and inductive interactions between cations and anions, which contribute to lower melting points. These interionic interactions help create a smoother potential energy surface, facilitating molecular mobility at reduced temperatures. In the condensed phase, the overall potential energy surface is crucial in determining the physical properties of ILs. The formation of expanded domains or nanostructures within the IL introduces microscopic heterogeneity, which further contributes to the reduction in the melting point by enabling more efficient packing and accommodating low-energy configurations within the structure [42]. Another study also discovered that stronger ion binding results in a reduced lattice energy, leading to a decrease in the melting point [43]. Therefore, in this study, to represent the influence of interaction forces on the melting point, three descriptors were selected: cationic enthalpy, anionic enthalpy, and IL enthalpy (Table 1).
In addition, the asymmetry of imidazolyl cations weakens regular lattice filling, resulting in a lower melting point. In addition, the solvation energy can be estimated by the dielectric constant and other properties, and the dipole moment affects the electrostatic constant [37,42,44]. Molecular dynamic simulations of the liquid also reveal that an increase in the dipole moment leads to a reduction in cation repulsion, consequently lowering the melting point of the IL [45]. This study adopts the dipole moments of different components as descriptors, given its close association with the melting point of ILs.
In the process of intermolecular electron transfer, such as in photoabsorption and charge transfer reactions, electrons move from the highest occupied molecular orbital (HOMO) of one molecule to the lowest unoccupied molecular orbital (LUMO) of another [46]. The energy level difference between HOMO and LUMO significantly influences the electron distribution within the molecules, thereby affecting the electrostatic interactions between them [47]. The dipole moment and polarizability of molecules are associated with the HOMO-LUMO gap. A smaller HOMO-LUMO gap indicates that molecules are more prone to polarization, enhancing electrostatic interactions [48]. These electrostatic forces are fundamental to chemical bonding, intermolecular interactions, and many other chemical properties [49]. Therefore, HOMO and LUMO are closely related to the melting point of ILs.
Consequently, in this study, twelve physicochemical descriptors influencing the melting point of ILs have been identified: the dipole moments of cations, anions, and the entire ILs; the enthalpies of cations, anions, and the entire ILs; the volumes of cations and anions; the LUMO of cations; the HOMO of anions; and the mass of the cations and anions, which correlates with the ion’s energy and fundamental properties. To further investigate the impact of cations and anions on melting points, descriptors are categorized into three groups: those associated with cationic calculations, those for anionic calculations, and those addressing the comprehensive calculations of ILs. The specific experimental descriptors are shown in Table 1.

2.1.4. The Calculation of the Descriptors

All optimization calculations were performed using Gaussian 16 software at the PM7 level [50,51], which was selected for its ability to significantly reduce computational costs compared to DFT methods. While first-principles methods like DFT generally offer higher accuracy, they are computationally intensive, particularly for large-scale studies involving thousands of compounds. Semi-empirical methods such as PM7 introduce certain approximations that reduce accuracy but offer a practical compromise between accuracy and computational efficiency, which is especially valuable when predicting the melting points of large numbers of ILs in practical applications [52,53]. In cases where the computational time required for prediction exceeds the time needed for experimental measurement, predictive models become impractical.
The reason why we employed PM7 in this study is to balance accuracy with computational efficiency. Figure S4 and Table S4 provide the specific computation times. These tables provide detailed comparisons of processing times for the selected tasks, highlighting the significant efficiency gains achieved with the PM7 method. Previous research has shown that PM7 is effective in accurately calculating key molecular properties, making it a viable alternative to DFT for the large-scale screening of ILs [54,55]. Using PM7 allows us to derive descriptors that are computationally affordable while retaining meaningful accuracy for melting point prediction. Table 2 presents the numerical range of descriptors calculated for ILs in the database. The calculation process is divided into the following three steps:
(1) Quantum chemical calculations using the PM7 method were performed on cations and anions to derive descriptors related to these ions. (2) For complex molecules, there may be hundreds or even thousands of potential structures, and many chemical phenomena depend on the arrangement of molecular structures. Hence, for the preservation of data accuracy, it becomes imperative to opt for the molecular conformation with the lowest energy when determining the total enthalpy and dipole moment of ILs. This task is complicated by the formidable ‘multiple minimum’ challenge, which requires identifying and characterizing geometric minima on complex multidimensional potential energy surfaces, ranking among the most difficult problems in computational chemistry. An exhaustive search without prior knowledge of the system is nearly unfeasible due to the vast number of possible configurations. To address this, AMPAC utilizes a simulated annealing technique in the form of a heuristic algorithm designed to identify the conformation with the lowest energy. The concept of annealing is inspired by the physical process of heating an object to a high temperature and then allowing it to cool slowly. At high temperatures, the atoms or molecules are allowed to move from their initial positions, rearranging the system into a more stable configuration. As the system cools, it is less likely to become trapped in higher energy states and instead proceeds toward the lowest possible energy state within a given region. This iterative process of heating and cooling helps guide the system to its most stable conformation [56]. In AMPAC, this process is implemented using the PM7 method. This approach is well-suited for the calculation of molecular descriptors, ensuring that the selected conformation is energetically optimal and provides accurate data for the further analysis of the ILs. Figure 3 illustrates five different ILs, each comprising the commonly used cation C7 paired with several typical anions. Additional examples are provided in Figure S5. The figure shows three different conformations for each IL, along with the corresponding lowest heat of formation values obtained after the annealing process. This illustrates how the simulated annealing method in AMPAC ensures the selection of the most stable conformation for descriptor calculations. (3) At the PM7 level, quantitative calculations were conducted on the lowest energy molecular conformations, yielding the overall dipole moment and enthalpy of the IL.

2.2. Model

The multilayer perceptron network (MLP), which is based on the foundational research of the perceptron model, was employed, and many popular neural network models were either built upon or incorporated perceptron models as their component layers. MLP has shown excellent performance for various problems and is relatively easier to implement in practice [57]. The MLP network configuration was designed and evaluated using a five-fold cross-validation process to ensure robust performance and reliable generalization [58,59]. The architecture, determined based on cross-validation results, consisted of three layers: an input layer corresponding to the input features, a hidden layer with 50 neurons for capturing complex patterns, and an output layer with a single neuron dedicated to predicting the melting point.
The model was trained using the stochastic gradient descent (SGD), which is a gradient-based optimization algorithm with an adaptive learning rate strategy. The initial learning rate was set to 0.1 and was dynamically adjusted, decreasing when no improvement was observed in the validation performance. The hidden layer employed the tanh activation function to effectively capture non-linear relationships, while the output layer utilized a linear activation function appropriate for continuous regression tasks. The training process minimized the mean squared error (MSE) loss function, which is a standard metric for regression problems to reduce the discrepancy between predicted and actual melting points. An early stopping mechanism was implemented, terminating the training process if the validation loss did not improve for 10 consecutive iterations. Additionally, a regularization term (alpha = 0.01) was incorporated to mitigate overfitting and enhance the model’s generalization capability. The maximum number of training iterations was set to 2000, providing sufficient opportunity for convergence. A total of 280 imidazolium-based ILs were randomly divided into training, validation, and test sets at 70%, 15%, and 15% ratios to prevent the artificial division of the dataset from influencing the results.
Finally, an SHAP-based method (SHapley Additive exPlanations) was utilized to evaluate the importance of descriptors during the model development process. SHAP is a technique designed to interpret and understand the outcomes of machine learning models. It is grounded in the concept of Shapley values from cooperative game theory, which fairly allocates the contributions of individual features to the model’s predictions [60].

2.3. Validation

The measured melting point in experiments is influenced by various factors, including laboratory conditions, reagent purity, and measurement methods, among others. As a result, measuring the melting point of the same IL in different studies can yield diverse experimental values, leading to the data presented in the fourth principle of data pre-processing. We used these data as validation data to evaluate the model’s performance. Subsequently, the established model was employed to predict the melting points of the selected ILs.

3. Results and Discussions

3.1. Data Processing Results

For ionic liquids such as [C2MIm][NfO], where only a single data point is available (301.15 K), the first principle was applied, treating the given value as accurate. In cases like [C3MIm][NfO], with multiple data points having differences of less than 10 K but no repeated values, the second principle was used to calculate the average value, resulting in 206.65 K. For ionic liquids like [C2MIm][PF6], which have nine different values in the database, with at least three occurrences differing from others by no more than 10 K, the third principle was applied, and the average value was calculated, resulting in 333 K. Finally, for [C1Im][Br], which exhibited variations greater than 10 K across different literature sources and lacked any repeated value appearing more than three times, the fourth principle was followed, using these data for model verification purposes. The specific data used for verification can be found in the validation results section. The melting points of other ILs in the database are provided in the Supplementary Information, Table S1 [38].

3.2. Descriptor Importance

As shown in Figure 4, the proportions of different descriptors were obtained using the SHAP method. The analysis highlights that the most influential descriptors are the mass and volumetric properties of the cations, contributing 21.1% and 30.5%, respectively, to the model’s predictions. Dipole moment-related descriptors, including contributions from ILs, cations, and anions, account for 14.4%, indicating their significance in influencing the melting point of ionic liquids. Enthalpy-related descriptors, encompassing the enthalpy of ILs, cations, and anions, contribute 16.5%, underscoring their role in thermodynamic stability. While size and mass remain critical for determining IL properties, polarity, and thermodynamic parameters provide secondary but meaningful contributions to the model’s performance. This study provides valuable insights into optimizing model inputs and guiding targeted IL design.

3.3. Model Training Results

The coefficient of determination R2 and the Pearson correlation coefficient R are standard measures for assessing the goodness of fit between model simulations and observations, and they also measure the degree of dependence that one variable has on another. R is used to measure the linear relationship between the model’s predicted values and the actual observed values [61]. R2 represents the proportion of variance in the target variable explained by the model [61,62]. The results are shown in Figure 5. The R value of the training set is 0.89, the verification set is 0.83, the test set is 0.80, and the overall R value of the neural network model is 0.87. Since R2 is used to evaluate the performance of most models, further analyses were conducted. These analyses revealed that the model exhibited an overall R2 value of 0.75, whereas the R2 value for the test set was recorded at 0.63. These results suggest that the model maintains a balance between predictive accuracy and generalizability. To validate the model’s accuracy, the obtained R2 values were compared with those reported in prior studies (Table 3 and Table S3). Notably, the overall R2 value of 0.75 aligns with or exceeds the predictive accuracies reported in other machine learning-based studies on ionic liquid property prediction, such as those conducted by Valderrama et al. and Low et al. [30,32]. This comparison demonstrates that the model effectively balances predictive accuracy with computational efficiency, achieving reliable performance within the range commonly observed in the literature.
Table 3 illustrates the study results obtained with different neural network models in forecasting the melting point of ILs, whilst other machine learning models are included in Table S3. In contrast to prior experiments, which yielded R2 values below 0.70 for several models, this study achieved a substantial improvement in both prediction and accuracy [31,63,64]. In earlier research, certain studies employed a larger number of descriptors [28,30,33,34,63,64,65,66]. This study substantially reduced the descriptor count, while some other studies generated descriptors from ab initio or employed DFT, incurring elevated computational expenses [1,32]. This current work attained enhanced computational accuracy while concurrently reducing computational expenses. Additionally, Torrecilla et al. conducted experiments using a restricted set of descriptors and attained an impressive R2 value of up to 0.99. Nonetheless, another study has suggested the possibility of overfitting in their model [18,33].
As shown in Figure 6, the error distribution between predicted and experimental values is concentrated. Specifically, there are a total of 154 ILs with errors of less than 20 K. The mean absolute error (MAE) value is 25.03 K, and the root mean squared error (RMSE) value is 33.75 K. Compared with some other studies in Table 3 and Table S3, this study has a smaller prediction error [31,32]. Two prior studies employed the mean absolute percentage error (MAPE) as an error representation [30,31]. If the MAPE is converted to MAE, for instance, the MAPE of the test set in this study is 14.6% [30]. If the melting point of an IL is 300 K, then its predicted error is 43.80 K. The MAE in this study is comparable or even lower compared to other studies.
Table 3. The present state of research on predicting the melting point of ILs using neural network models. “——” indicates data that is not mentioned in the original source.
DatabaseDescriptor CountDescriptor TypeModelR2RMAERMSERef.
126 pyridinium bromides1085Constitutional,
2D and 3D
CPG NNs0.748——18.0723.41[28]
126 pyridinium bromides——Positional treesRNN——Training 0.9782
Test 0.8725
Training 7.63
Test 19.37
Training 10.08
Test 23.78
[29]
711 ILs2837Fragment,
Fragment property
BPNNTraining 0.77
Test 0.58
——Test 31.50Training 30.00
Test 39.90
[66]
667 ILs55Group
contribution
ANN————Training %MAE 3.70
Test %MAE 14.60
——[30]
2212 ILs——SMILESTransformer-CNNTraining 0.63
Test 0.55
————Training 50.00
Test 45.00
[64]
1253 ILs137Constitutional,
2D and 3D
RNN0.90————32.88[34]
280
imidazolium ILs
12PM7MLP (ANN)0.750.8725.0333.75This work
For this study, the overall R value of the database was found to be 0.87, indicating a strong relationship between the melting point and functionality. The ILs with errors greater than 40 K are listed in Table S2.
Additionally, the model includes eight ILs with MAE exceeding 80 K, as indicated in Table 4. These substantial disparities are considered unsuitable for practical applications. Hence, conducting a more comprehensive analysis is imperative to identify the root causes of these errors. Initially, it is crucial to assess whether a specific ion is accountable for causing a substantial error. Regarding this issue, the prediction errors of ILs with identical ionic compositions to those exhibiting significant errors are compared.
As depicted in Table 5, the IL formed by the combination of cation C7 and anion A59 exhibits a substantial prediction error of −104.53 K. Conversely, ILs resulting from the interaction of cation C7 with anions A13 and A7 demonstrate prediction errors below 3 K. Likewise, the IL formed by the combination of cation C10 and anion A72 displays a predicted error of −118.01 K. In contrast, ILs produced from anions A65, A51, and other cations demonstrate errors below 8 K. Similarly, ILs composed of A13 and A2 with different cations can also achieve minimal prediction errors. This suggests that despite significant prediction errors in a specific IL, those sharing identical anions and cations may yield minimal errors. Consequently, it is not a specific ion that influences the prediction rule for the melting point of ILs, leading to a substantial discrepancy in the results.
Neural network models may experience overfitting when dealing with small databases, leading to a diminished ability to generalize. Overfitting is typically characterized by a small training set error, accompanied by substantial observation errors in the test and validation sets. This manifestation has also been reflected in previous studies [29,30,31]. Thus, to examine whether the larger errors stem from overfitting, Table 4 presents the datasets and corresponding errors for ILs exhibiting significant discrepancies. The training set, validation set, and test dataset underwent redivision, leading to the establishment of three new neural network models (model 1, model 2, and model 3). By analyzing the prediction errors of ILs in Table 4 and their respective datasets, it was found that the errors of certain ILs (No. 2 and 4) can be attributed to the randomness of the model or dataset partition. For the cation A12 of IL No. 1, A59 of IL No. 4, A72 of IL No. 5, C62 of IL No. 6, and C56 of IL No. 7, each appears only once or twice in the database. Therefore, significant errors may be due to insufficient data, indicating that the neural network has not learned sufficiently about these ions [67,68].
Moreover, the differences in ILs No. 3 and 8 may stem from inherent limitations in the experimental database. No. 8 in Table 4 comprises the anion A22, while the ILs formed by cations paired with A22 display a broad range of melting points (refer to Table S1). Among the 29 ILs investigated in this study, which are composed of various cations and A22, only five exhibit melting points exceeding 400 K. Notably, the IL identified as No. 8 in Table 4 demonstrates the highest melting point within this group. Therefore, the prediction errors for IL No. 8 might be due to anomalies: ILs with similar structures have significantly different experimental melting points.
No. 3, as listed in Table 4, contains featured halogen anions, A2. In the database for this study, a total of 65 ILs contained halogen anions. Among these, two exhibited melting points below 230 K, while the remaining compounds had melting points exceeding 285 K. Notably, 29 ILs within this group display melting points surpassing 400 K. Furthermore, in addition to IL No. 3, the other ILs also exhibit errors exceeding 60 K. From the viewpoint of physical chemistry, employing halogens as anions enhances the attainment of higher melting points in ILs. Halogen anions, which are relatively larger, and larger ions necessitating more lattice space contribute to heightened crystallization stability and an elevated melting point [37,69,70]. Thus, the melting points of most halide-based ILs in the database adhere to this pattern. However, two ILs exhibiting significantly larger errors indicate unusually low melting points. This suggests that the notable discrepancies in the IL may originate from anomalies within the data points, deviating from the general pattern.
In summary, aside from incidental errors attributed to model algorithms and dataset partitioning, inaccuracies may also stem from the inadequate learning of specific ILs. Additionally, disparities might result from anomalies inherent in the data themselves. The database compiles information from diverse literature sources without systematic categorization or advanced processing. Various methodologies can yield varying melting point values for the same IL. Moreover, experimental outcomes are subject to influences like laboratory conditions, climatic variations, and equipment precision. Despite the pre-processing efforts applied to experimental melting point values, disparities endure between experimental values and theoretical values, particularly for ILs with limited experimental values. It is imperative to recognize that, according to the data processing principles of this study, if an IL has only one experimental melting point, data processing considers this value as accurate. However, in reality, it may still differ significantly from the theoretical value.

3.4. Model Validation Result

As shown in Table 6, the model has exhibited excellent performance in predicting the melting points of ILs. Specifically, when confronted with the multiple and significantly disparate melting points of ILs, the model demonstrates its capability to aid in identifying the appropriate data points.
For instance, the anion resulting from the combination of C6 and A2 (No. 3 in Table 6) exhibits three distinct experimental values from various studies, differing by more than 66.35 K. Substantial discrepancies in measured values pose challenges when selecting specific ILs based on their melting points. In such cases, a well-fitted neural network model can predict the theoretical melting point value. As an illustration of this, the predicted melting point can reach 398.42 K, which helps to determine the true melting point of IL. Moreover, the melting point of an IL can occasionally span a broad range rather than a precise value. In such instances, the neural network model aids in pinpointing the exact value, as demonstrated with ILs No. 4 and 5 in Table 6. The use of neural network models can rapidly and accurately predict the melting point, significantly enhancing the selection efficiency of ILs in practical applications.

3.5. Challenges, Research Gaps, and Future Directions

The accuracy and broader applicability of existing models face several issues and research gaps in the field of IL melting point prediction. One of the main obstacles is data limitations. The model struggles to generalize other types of ILs with distinct cations due to the current dataset containing only imidazolium-based ILs. Expanding the dataset to include a wider range of ILs is essential for improving both the accuracy of the model and its ability to generalize.
Selecting and optimizing descriptors is another important difficulty. Even though the 12 descriptors employed in this study were carefully chosen to strike a compromise between computing efficiency and prediction accuracy, more work is required to increase the model’s robustness and generalizability. Future research may explore additional quantum chemical and molecular descriptors that more precisely capture the unique structural characteristics and intermolecular interactions in ILs.
The model’s performance is still a major issue. For more complicated or unique ILs, higher precision might be needed because the existing model might not account for all the important details. Investigating more complex or hybrid models may be useful in subsequent studies. With an emphasis on enhancing prediction accuracy in regions where the model exhibits the most uncertainty, these models may incorporate additional methods or combine other machine learning techniques to better handle the inherent complexities of ILs. Moreover, issues with model interpretability and generalization continue to present challenges. Although neural networks perform well in prediction tasks, their “black-box” nature makes it difficult to understand the relationships between descriptors and melting point estimates. Future studies could examine interpretable machine learning techniques that clearly illustrate these connections in order to offer a better knowledge of the chemical properties influencing melting points. In conclusion, addressing these problems through innovative modeling approaches, enhanced data collection, and enhanced descriptor analysis will be necessary to increase the anticipated accuracy and use of melting point models for ILs.
In conclusion, addressing these challenges through innovative modeling approaches, better data collection, and refined descriptor analysis will be crucial for enhancing the predictive accuracy and practical utility of melting point models for ILs. These efforts will facilitate the development of novel ILs with optimized properties for a range of industrial applications.

4. Conclusions

This study proposes four data pre-processing principles and innovatively employs simulated annealing algorithms to determine molecular conformations with the lowest energy, thereby enhancing data accuracy. A neural network model was constructed using only 12 quantum chemical descriptors, with an R2 of 0.75 and an MAE of 25.03 K, demonstrating a strong correlation between the 12 quantum chemical descriptors and the melting point. The model is notable for its minimal computational demands while offering rapid and precise predictions of the melting points for imidazolium-based ILs. This facilitates the determination of melting points for ILs with unknown values, enabling high-throughput screening to identify new ILs with desired melting points. Neural network models provide promising potential for predictive analysis in the field of chemistry.

Supplementary Materials

The following supporting information can be downloaded at https://www.mdpi.com/article/10.3390/chemistry6060094/s1. Table S1: Database of twelve quantitative descriptors for imidazolium-based ILs; Table S2: ILs with prediction errors greater than 40 K in the database; Table S3: The present state of research on predicting the melting point of ILs using machine learning, excluding neural network models; Table S4: Optimization time, frequency calculation time, and total time for the same IL using PM7 and DFT, calculated on a 40-core server; Figure S1: Remaining structures of imidazolium cations. Different colors are used to represent different chemical substances other than carbon and hydrogen.; Figure S2: Remaining structures of imidazolium anions. Different colors are used to represent different chemical substances other than carbon and hydrogen.; Figure S3: Born–Fajans–Haber cycle for the assessment of the melting (fusion) of a binary salt composed of complex ions ([A][X]), at temperature T, adapted from [37], based on lattice and solvation energies; Figure S4: Optimization time and frequency calculation time for the same IL using PM7 and DFT, calculated on a 40-core server; Figure S5: Three lowest energy molecular configurations obtained from annealed ILs. The energy decreases sequentially from left to right. ΔHf: Heat of formation (kcal mol−1). The labels for the anions and cations of the ILs are indicated in the form of [X]+[Y]; cartesian coordinates are given for ILs. References [28,31,32,37,63,64,65,66,71] are cited in the supplementary materials.

Author Contributions

Conceptualization, H.L. (Hongping Li) and X.L.; methodology, X.L.; software, H.L. (Hongping Li); validation, H.L. (Hongping Li), X.L. and J.Y.; formal analysis, X.L. and W.Q.; investigation, X.L. and J.Y.; resources, L.Z. and H.L. (Hongping Li); data curation, X.L.; writing—original draft preparation, X.L.; writing—review and editing, X.L. and H.L. (Hongping Li); visualization, H.L. (Hongping Li); supervision, J.Y., X.Z., W.J. and M.Z.; project administration, L.Z. and H.L. (Huaming Li); funding acquisition, H.L. (Hongping Li). All authors have read and agreed to the published version of the manuscript.

Funding

This research was funded by the National Natural Science Foundation of China, grant number (Nos. 22078135, 22378176) and the Key Research and Development Plan of Hainan Province (ZDYF2022SHFZ285, ZDYF2022GXJS330).

Data Availability Statement

The data are contained within the article and Supplementary Materials.

Conflicts of Interest

The authors declare no conflicts of interest.

References

  1. Torrecilla, J.S.; Rodriguez, F.; Bravo, J.L.; Rothenberg, G.; Seddon, K.R.; Lopez-Martin, I. Optimising an artificial neural network for predicting the melting point of ionic liquids. Phys. Chem. Chem. Phys. 2008, 10, 5826–5831. [Google Scholar] [CrossRef] [PubMed]
  2. Dong, K.; Liu, X.; Dong, H.; Zhang, X.; Zhang, S. Multiscale Studies on Ionic Liquids. Chem. Rev. 2017, 117, 6636–6695. [Google Scholar] [CrossRef] [PubMed]
  3. Nordness, O.; Brennecke, J.F. Ion Dissociation in Ionic Liquids and Ionic Liquid Solutions. Chem. Rev. 2020, 120, 12873–12902. [Google Scholar] [CrossRef] [PubMed]
  4. Amarasekara, A.S. Acidic Ionic Liquids. Chem. Rev. 2016, 116, 6133–6183. [Google Scholar] [CrossRef]
  5. Noorhisham, N.A.; Amri, D.; Mohamed, A.H.; Yahaya, N.; Ahmad, N.M.; Mohamad, S.; Kamaruzaman, S.; Osman, H. Characterisation techniques for analysis of imidazolium-based ionic liquids and application in polymer preparation: A review. J. Mol. Liq. 2021, 326, 115340. [Google Scholar] [CrossRef]
  6. Hayes, R.; Warr, G.G.; Atkin, R. Structure and nanostructure in ionic liquids. Chem. Rev. 2015, 115, 6357–6426. [Google Scholar] [CrossRef]
  7. Singh, S.K.; Savoy, A.W. Ionic liquids synthesis and applications: An overview. J. Mol. Liq. 2020, 297, 112038. [Google Scholar] [CrossRef]
  8. Zhang, Y.; Chan, J.Y.G. Sustainable chemistry: Imidazolium salts in biomass conversion and CO2 fixation. Energy Environ. Sci. 2010, 3, 408–417. [Google Scholar] [CrossRef]
  9. Werner, S.; Haumann, M.; Wasserscheid, P. Ionic liquids in chemical engineering. Annu. Rev. Chem. Biomol. Eng. 2010, 1, 203–230. [Google Scholar] [CrossRef]
  10. Greer, A.J.; Jacquemin, J.; Hardacre, C. Industrial Applications of Ionic Liquids. Molecules 2020, 25, 5207. [Google Scholar] [CrossRef]
  11. Martins, V.L.; Torresi, R.M. Ionic liquids in electrochemical energy storage. Curr. Opin. Electrochem. 2018, 9, 26–32. [Google Scholar] [CrossRef]
  12. Song, W.; Yan, J.; Ji, H. Tribological Performance of an Imidazolium Ionic Liquid-Functionalized SiO(2)@Graphene Oxide as an Additive. ACS Appl. Mater. Interfaces 2021, 13, 50573–50583. [Google Scholar] [CrossRef] [PubMed]
  13. Nguyen, D.Q.; Bae, H.W.; Jeon, E.H.; Lee, J.S.; Cheong, M.; Kim, H.; Kim, H.S.; Lee, H. Zwitterionic imidazolium compounds with high cathodic stability as additives for lithium battery electrolytes. J. Power Source 2008, 183, 303–309. [Google Scholar] [CrossRef]
  14. Endo, T.; Sunada, K.; Sumida, H.; Kimura, Y. Origin of low melting point of ionic liquids: Dominant role of entropy. Chem. Sci. 2022, 13, 7560–7565. [Google Scholar] [CrossRef] [PubMed]
  15. Katritzky, A.R.; Jain, R.; Lomaka, A.; Petrukhin, R.; Maran, U.; Karelson, M. Perspective on the relationship between melting points and chemical structure. Cryst. Growth Des. 2001, 1, 261–265. [Google Scholar] [CrossRef]
  16. Abbott, A.P.; Ryder, K.S.; König, U. Electrofinishing of metals using eutectic based ionic liquids. Trans. IMF 2013, 86, 196–204. [Google Scholar] [CrossRef]
  17. Deyko, G.S.; Glukhov, L.M.; Kustov, L.M. Hydrogen storage in organosilicon ionic liquids. Int. J. Hydrogen Energy 2020, 45, 33807–33817. [Google Scholar] [CrossRef]
  18. Koutsoukos, S.; Philippi, F.; Malaret, F.; Welton, T. A review on machine learning algorithms for the ionic liquid chemical space. Chem Sci 2021, 12, 6820–6843. [Google Scholar] [CrossRef]
  19. Trohalaki, S.; Pachter, R. Prediction of Melting Points for Ionic Liquids. QSAR Comb. Sci. 2005, 24, 485–490. [Google Scholar] [CrossRef]
  20. Ambure, P.; Halder, A.K.; Gonzalez Diaz, H.; Cordeiro, M. QSAR-Co: An Open Source Software for Developing Robust Multitasking or Multitarget Classification-Based QSAR Models. J. Chem. Inf. Model. 2019, 59, 2538–2544. [Google Scholar] [CrossRef]
  21. Chen, S.; Xue, D.; Chuai, G.; Yang, Q.; Liu, Q. FL-QSAR: A federated learning-based QSAR prototype for collaborative drug discovery. Bioinformatics 2021, 36, 5492–5498. [Google Scholar] [CrossRef]
  22. Kutz, J.N. Machine learning for parameter estimation. Proc. Natl. Acad. Sci. USA 2023, 120, e2300990120. [Google Scholar] [CrossRef] [PubMed]
  23. Dobbelaere, M.R.; Plehiers, P.P.; Van de Vijver, R.; Stevens, C.V.; Van Geem, K.M. Machine Learning in Chemical Engineering: Strengths, Weaknesses, Opportunities, and Threats. Engineering 2021, 7, 1201–1211. [Google Scholar] [CrossRef]
  24. Chen, G.; Song, Z.; Qi, Z. Transformer-convolutional neural network for surface charge density profile prediction: Enabling high-throughput solvent screening with COSMO-SAC. Chem. Eng. Sci. 2021, 246, 117002. [Google Scholar] [CrossRef]
  25. Chen, G.; Song, Z.; Qi, Z.; Sundmacher, K. Neural recommender system for the activity coefficient prediction andUNIFACmodel extension of ionicliquid-solutesystems. AIChE J. 2021, 67, e17171. [Google Scholar] [CrossRef]
  26. Hashim, F.H.; Yu, F.; Izgorodina, E.I. Appropriate clusterset selection for the prediction of thermodynamic properties of liquid water with QCE theory. Phys. Chem. Chem. Phys. 2023, 25, 9846–9858. [Google Scholar] [CrossRef]
  27. Tan, T.; Cheng, H.; Chen, G.; Song, Z.; Qi, Z. Prediction of infinite-dilution activity coefficients with neural collaborative filtering. AIChE J. 2022, 68, e17789. [Google Scholar] [CrossRef]
  28. Carrera, G.A.; Aires-de-Sousa, J.O. Estimation of melting points of pyridinium bromide ionic liquids with decision trees and neural networks. Green Chem. 2005, 7, 20–27. [Google Scholar] [CrossRef]
  29. Bini, R.; Chiappe, C.; Duce, C.; Micheli, A.; Solaro, R.; Starita, A.; Tiné, M.R. Ionic liquids: Prediction of their melting points by a recursive neural network model. Green Chem. 2008, 10, 306–309. [Google Scholar] [CrossRef]
  30. Valderrama, J.O.; Faúndez, C.A.; Vicencio, V.J. Artificial Neural Networks and the Melting Temperature of Ionic Liquids. Ind. Eng. Chem. Res. 2014, 53, 10504–10511. [Google Scholar] [CrossRef]
  31. Venkatraman, V.; Evjen, S.; Knuutila, H.K.; Fiksdahl, A.; Alsberg, B.K. Predicting ionic liquid melting points using machine learning. J. Mol. Liq. 2018, 264, 318–326. [Google Scholar] [CrossRef]
  32. Low, K.; Kobayashi, R.; Izgorodina, E.I. The effect of descriptor choice in machine learning models for ionic liquid melting point prediction. J. Chem. Phys. 2020, 153, 104101. [Google Scholar] [CrossRef] [PubMed]
  33. Paduszyński, K.; Kłębowski, K.; Królikowska, M. Predicting melting point of ionic liquids using QSPR approach: Literature review and new models. J. Mol. Liq. 2021, 344, 117631. [Google Scholar] [CrossRef]
  34. Acar, Z.; Nguyen, P.; Lau, K.C. Machine-Learning Model Prediction of Ionic Liquids Melting Points. Appl. Sci. 2022, 12, 2408. [Google Scholar] [CrossRef]
  35. Makarov, D.M.; Fadeeva, Y.A.; Shmukler, L.E.; Tetko, I.V. Machine learning models for phase transition and decomposition temperature of ionic liquids. J. Mol. Liq. 2022, 366, 120247. [Google Scholar] [CrossRef]
  36. Dhakal, P.; Shah, J.K. Developing machine learning models for ionic conductivity of imidazolium-based ionic liquids. Fluid Phase Equilibria 2021, 549, 113208. [Google Scholar] [CrossRef]
  37. Krossing, I.; Slattery, J.M.; Daguenet, C.; Dyson, P.J.; Oleinikova, A.; Weingärtner, H. Why Are Ionic Liquids Liquid? A Simple Explanation Based on Lattice and Solvation Energies [J. Am. Chem. Soc. 2006, 128, 13427–13434]. J. Am. Chem. Soc. 2007, 129, 11296. [Google Scholar] [CrossRef]
  38. Zhang, S.J.; Zhou, Q.; Lu, X.M.; Wang, X.X.; Lu, C.H. “IPE Ionic Liquid Database”, Institute of Process Engineering, Chinese Academy Sciences, Beijing, 100190. Available online: http://ildate.ilct.com.cn/ (accessed on 1 January 2023).
  39. Velardez, G.F.; Alavi, S.; Thompson, D.L. Molecular dynamics studies of melting and liquid properties of ammonium dinitramide. J. Chem. Phys. 2003, 119, 6698–6708. [Google Scholar] [CrossRef]
  40. Jenkins, H.D.B.; Tudela, D.; Glasser, L. Lattice Potential Energy Estimation for Complex Ionic Salts from Density Measurements. Inorg. Chem. 2002, 41, 2364–2367. [Google Scholar] [CrossRef]
  41. Zheng, H.; Xu, G.; Wu, K.; Feng, L.; Zhang, R.; Bao, Y.; Wang, H.; Wang, K.; Qu, Z.; Shi, J. Highly Intrinsic Thermally Conductive Electrospinning Film with Intermolecular Interaction. J. Phys. Chem. C 2021, 125, 21580–21587. [Google Scholar] [CrossRef]
  42. Zahn, S.; Uhlig, F.; Thar, J.; Spickermann, C.; Kirchner, B. Intermolecular forces in an ionic liquid ([Mmim][Cl]) versus those in a typical salt (NaCl). Angew. Chem. Int. Ed. Engl. 2008, 47, 3639–3641. [Google Scholar] [CrossRef] [PubMed]
  43. Peppel, T.; Roth, C.; Fumino, K.; Paschek, D.; Köckerling, M.; Ludwig, R. The Influence of Hydrogen-Bond Defects on the Properties of Ionic Liquids. Angew. Chem. Int. Ed. 2011, 50, 6661–6665. [Google Scholar] [CrossRef] [PubMed]
  44. Slattery, J.M.; Daguenet, C.; Dyson, P.J.; Schubert, T.J.; Krossing, I. How to predict the physical properties of ionic liquids: A volume-based approach. Angew. Chem. Int. Ed. Engl. 2007, 46, 5384–5388. [Google Scholar] [CrossRef] [PubMed]
  45. Rabideau, B.D.; Soltani, M.; Parker, R.A.; Siu, B.; Salter, E.A.; Wierzbicki, A.; West, K.N.; Davis, J.H., Jr. Tuning the melting point of selected ionic liquids through adjustment of the cation’s dipole moment. Phys. Chem. Chem. Phys. 2020, 22, 12301–12311. [Google Scholar] [CrossRef]
  46. Kanagathara, N.; Usha, R.; Natarajan, V.; Marchewka, M.K. Molecular geometry, vibrational, NBO, HOMO–LUMO, first order hyper polarizability and electrostatic potential studies on anilinium hydrogen oxalate hemihydrate—An organic crystalline salt. Inorg. Nano-Met. Chem. 2021, 52, 226–233. [Google Scholar] [CrossRef]
  47. Pratuangdejkul, J.; Jaudon, P.; Ducrocq, C.; Nosoongnoen, W.; Guerin, G.-A.; Conti, M.; Loric, S.; Launay, J.-M.; Manivet, P. Cation-π Interactions in Serotonin:  Conformational, Electronic Distribution, and Energy Decomposition Analysis. J. Chem. Theory Comput. 2006, 2, 746–760. [Google Scholar] [CrossRef]
  48. Sıdır, İ.; Sarı, T.; Gülseven Sıdır, Y.; Berber, H. Synthesis, solvatochromism and dipole moment in the ground and excited states of substitute phenol derivative fluorescent Schiff base compounds. J. Mol. Liq. 2022, 346, 117075. [Google Scholar] [CrossRef]
  49. Li, L.; Mayer, P.; Stephenson, D.S.; Ofial, A.R.; Mayer, R.J.; Mayr, H. An Overlooked Pathway in 1,3-Dipolar Cycloadditions of Diazoalkanes with Enamines. Angew. Chem. Int. Ed. 2022, 61, e202117047. [Google Scholar] [CrossRef]
  50. Frisch, M.J.; Trucks, G.W.; Schlegel, H.B.; Scuseria, G.E.; Robb, M.A.; Cheeseman, J.R.; Scalmani, G.; Barone, V.; Petersson, G.A.; Nakatsuji, H.; et al. Gaussian 16; Gaussian, Inc.: Wallingford, CT, USA, 2016. [Google Scholar]
  51. Rezac, J.; Hobza, P. Advanced Corrections of Hydrogen Bonding and Dispersion for Semiempirical Quantum Mechanical Methods. J. Chem. Theory Comput. 2012, 8, 141–151. [Google Scholar] [CrossRef]
  52. Rasspe-Lange, L.; Hoffmann, A.; Gertig, C.; Heck, J.; Leonhard, K.; Herres-Pawlis, S. Geometrical benchmarking and analysis of redox potentials of copper(I/II) guanidine-quinoline complexes: Comparison of semi-empirical tight-binding and DFT methods and the challenge of describing the entatic state (part III). J. Comput. Chem. 2023, 44, 319–328. [Google Scholar] [CrossRef] [PubMed]
  53. Zhang, Q.; Khetan, A.; Er, S. Comparison of computational chemistry methods for the discovery of quinone-based electroactive compounds for energy storage. Sci. Rep. 2020, 10, 22149. [Google Scholar] [CrossRef] [PubMed]
  54. Yu, M.; Liu, J.; Cao, X.; Wei, C.; Liang, H.; Gong, C.; Ju, Z. Structures and hydrogen bonds of -SO3H functionalized acid ionic liquids. J. Mol. Liq. 2024, 406, 125129. [Google Scholar] [CrossRef]
  55. Bernardino, K.; Goloviznina, K.; Gomes, M.C.; Padua, A.A.H.; Ribeiro, M.C.C. Ion pair free energy surface as a probe of ionic liquid structure. J. Chem. Phys. 2020, 152, 014103. [Google Scholar] [CrossRef]
  56. Dewar, M.J.S.; Holder, A.J.; Dennington, I.R.D.; Liotard, D.A.; Truhlar, D.G.; Keith, T.A.; Millam, J.M.; Harris, C.D. AMPAC 10; Semichem, Inc.: Shawnee, KS, USA, 2016. [Google Scholar]
  57. Du, K.-L.; Leung, C.-S.; Mow, W.H.; Swamy, M.N.S. Perceptron: Learning, Generalization, Model Selection, Fault Tolerance, and Role in the Deep Learning Era. Mathematics 2022, 10, 4730. [Google Scholar] [CrossRef]
  58. Kohavi, R. A study of cross-validation and bootstrap for accuracy estimation and model selection. In Proceedings of the 14th International Joint Conference on Artificial Intelligence—Volume 2, Montreal, QC, Canada, 20–25 August 1995; pp. 1137–1143. [Google Scholar]
  59. Refaeilzadeh, P.; Tang, L.; Liu, H. Cross-Validation. Encycl. Database Syst. 2009, 1, 532–538. [Google Scholar]
  60. Pelegrina, G.D.; Duarte, L.T.; Grabisch, M. A k-additive Choquet integral-based approach to approximate the SHAP values for local interpretability in machine learning. Artif. Intell. 2023, 325, 104014. [Google Scholar] [CrossRef]
  61. Barber, C.; Lamontagne, J.R.; Vogel, R.M. Improved estimators of correlation and R2 for skewed hydrologic data. Hydrol. Sci. J. 2019, 65, 87–101. [Google Scholar] [CrossRef]
  62. Alexander, D.L.J.; Tropsha, A.; Winkler, D.A. Beware of R2: Simple, Unambiguous Assessment of the Prediction Accuracy of QSAR and QSPR Models. J. Chem. Inf. Model. 2015, 55, 1316–1322. [Google Scholar] [CrossRef]
  63. Baskin, I.; Epshtein, A.; Ein-Eli, Y. Benchmarking machine learning methods for modeling physical properties of ionic liquids. J. Mol. Liq. 2022, 351, 118616. [Google Scholar] [CrossRef]
  64. Makarov, D.M.; Fadeeva, Y.A.; Shmukler, L.E.; Tetko, I.V. Beware of proper validation of models for ionic Liquids! J. Mol. Liq. 2021, 344, 117722. [Google Scholar] [CrossRef]
  65. Cerecedo-Cordoba, J.A.; Gonzalez Barbosa, J.J.; Frausto Solis, J.; Gallardo-Rivas, N.V. Melting Temperature Estimation of Imidazole Ionic Liquids with Clustering Methods. J. Chem. Inf. Model. 2019, 59, 3144–3153. [Google Scholar] [CrossRef] [PubMed]
  66. Varnek, A.; Kireeva, N.; Tetko, I.V.; Baskin, I.I.; Solov’ev, V.P. Exhaustive QSPR Studies of a Large Diverse Set of Ionic Liquids:  How Accurately Can We Predict Melting Points? J. Chem. Inf. Model. 2007, 47, 1111–1122. [Google Scholar] [CrossRef]
  67. Wambugu, N.; Chen, Y.; Xiao, Z.; Tan, K.; Wei, M.; Liu, X.; Li, J. Hyperspectral image classification on insufficient-sample and feature learning using deep neural networks: A review. Int. J. Appl. Earth Obs. Geoinf. 2021, 105, 102603. [Google Scholar] [CrossRef]
  68. Kwon, S.W.; Kim, J.S.; Lee, H.M.; Lee, J.S. Physics-added neural networks: An image-based deep learning for material printing system. Addit. Manuf. 2023, 73, 103668. [Google Scholar] [CrossRef]
  69. Chen, L.; Bryantsev, V.S. A density functional theory based approach for predicting melting points of ionic liquids. Phys. Chem. Chem. Phys. 2017, 19, 4114–4124. [Google Scholar] [CrossRef]
  70. Ryoo, H.; Lee, S.G.; Kim, J.G.; Chung, S.Y. Effect of Chemical Bonding Characteristics on Ordering Structure in Li Spinel Oxides. Adv. Funct. Mater. 2018, 29, 1805972. [Google Scholar] [CrossRef]
  71. Yan, F.; Xia, S.; Wang, Q.; Yang, Z.; Ma, P. Predicting the melting points of ionic liquids by the Quantitative Structure Property Relationship method using a topological index. Chem. Thermodyn. 2013, 62, 196–200. [Google Scholar] [CrossRef]
Figure 1. Structures of the first 48 imidazolium cations from the database, sorted by the complexity of their ionic structures. Additional structures are provided in Figure S1. Different colors are used to represent different chemical substances other than carbon and hydrogen.
Chemistry 06 00094 g001
Figure 2. The first 45 anions of imidazolium-based ionic liquids (ILs) in the database, including both organic and inorganic species. Additional anions are provided in Figure S2. Different colors are used to represent different chemical substances other than carbon and hydrogen.
Chemistry 06 00094 g002
Figure 3. Three lowest energy molecular configurations obtained from annealed ILs. The energy decreases sequentially from left to right. ΔHf:: Heat of formation (kcal mol−1). The labels for the anions and cations of the ILs are indicated in the form of [X]+[Y].
Chemistry 06 00094 g003
Figure 4. Proportion of importance of different descriptors in the MLP model.
Chemistry 06 00094 g004
Figure 5. Pearson correlation coefficients for the training set, validation set, test set and the overall dataset. The red line in the plots represents the best - fit line. The Highlight area indicates the error range, which reflects the possible deviation between the predicted values and the actual values within the scope determined by the confidence level of 95%.
Chemistry 06 00094 g005
Figure 6. The error distribution histogram of the training set, validation set, test set.
Chemistry 06 00094 g006
Table 1. Classification of physicochemical descriptors based on anions, cations, and the ILs as a whole.
CationsAnionsILs
Dipole momentDipole momentDipole moment
EnthalpyEnthalpyEnthalpy
VolumeVolume
MassMass
LUMOHOMO
Table 2. The numerical range of descriptors calculated for ILs in the database.
DescriptorsMaximumMinimum
CationsDipole moment (Debye)36.939940.82669
Enthalpy (Hartree)0.82448−0.76340
Volume (Bohr3/mol)6895.942001024.20200
Mass (amu)530.0525069.04527
LUMO (Hartree)−0.14256−0.23956
AnionsDipole moment (Debye) 27.6910960
Enthalpy (Hartree)0.37276−2.39248
Volume (Bohr3/mol)10195.32850.77300
Mass (amu)935.3360534.96885
HOMO (Hartree)−0.10436−0.62145
ILsDipole moment (Debye)20.4251380.44500
Enthalpy (Hartree)0.700086−2.058234
Table 4. ILs with errors exceeding 80 K in Model 0, along with their corresponding datasets, as well as their errors and associated datasets in the three newly established models; Model 0: the model selected for this study. Model 1, Model 2, and Model 3: three neural network models with dataset partitions different from that of Model 0.
No.12345678
CationsC10C87C11C7C10C62C56C21
AnionsA12A61A2A59A72A7A13A22
Experimental values (K)438.15386.69221.00209.00337.15230.65192.05469.00
model 0R2 = 0.75Errors (K)81.7699.79−88.32−104.53118.01−85.26−104.2280.51
DatasetTrainTrainTrainValidationValidationValidationValidationValidation
model 1R2 = 0.70Errors (K)75.7329.45−106.39−14.1183.85−43.06−82.8448.28
datasetTrainValidationTrainTrainValidationTrainTrainTrain
model 2R2 = 0.68Errors (K)118.3824.23−99.47−48.6841.38−65.48−97.3985.13
datasetTrainTrainTrainTrainTrainTrainTrainTrain
model 3R2 = 0.68Errors (K)80.34−0.99−77.66−19.0355.76−49.99−82.6451.91
datasetTrainTrainTrainTrainTrainTrainTrainTrain
Table 5. Errors, experimental values, and predicted values of different ILs with the same ions.
CationsAnionsErrors (K)Predicted Values (K)Experimental Values (K)
C7A59−104.53313.53209
A130.22285.78286.00
A7−2.23258.23256.00
C10A72118.01219.14337.15
A65−5.48215.63210.15
A51−7.92219.87211.95
C56A13−104.22296.27192.05
C165.29307.33312.62
C653.74186.81190.55
C11A2−88.32309.32221.00
C32−0.33328.48328.15
C921.63445.52447.15
Table 6. Judgement the melting points of ILs with uncertain melting points in external databases [38].
No.CationsAnionsExperimental Values (K)Predicted Values (K)Judged Values (K)
1C2A2314.15
345.15
393.99345.15
2C2A13310.15
325.55
345.28325.55
3C6A2382.65
398.15
449.00
398.42398.15
4C7A9<298.15
304.00
294.88294.88
5C7A31228.15
259.15
<253.15
282.51259.15
6C7A61303.00
322.30
322.90
333.15
339.55333.15
7C8A2309.56
333.15
365.51333.15
8C8A3203.00
290.10
291.64290.10
9C12A1186.15
191.15
218.00
285.41
308.15
327.17308.15
10C19A2417.15
451.15
395.24417.15
Disclaimer/Publisher’s Note: The statements, opinions and data contained in all publications are solely those of the individual author(s) and contributor(s) and not of MDPI and/or the editor(s). MDPI and/or the editor(s) disclaim responsibility for any injury to people or property resulting from any ideas, methods, instructions or products referred to in the content.

