Communication

Solid State Fabrication of Copper Nanoclusters and Supraparticles

Key Laboratory of Functional Molecular Solids, Ministry of Education, College of Chemistry and Materials Science, Anhui Normal University, Wuhu 241000, China
*
Author to whom correspondence should be addressed.
Chemistry 2023, 5(3), 1990-1997; https://doi.org/10.3390/chemistry5030134
Submission received: 20 July 2023 / Revised: 15 August 2023 / Accepted: 16 August 2023 / Published: 6 September 2023

Abstract

:
In this study, we present solid state processes for the fabrication of copper nanoclusters (NCs) and hierarchical supraparticles (SPs). To achieve this, copper salt and thiols are mixed and are then grinded for 10–15 min, and the nano-products are thereby obtained. Interestingly, it was found in this study that the formation of the NCs or SPs is completely dependent on the grinding methods that are used: with mechanical grinding, the products are several nanometer-sized NCs, whereas manual grinding in an agate mortar can obtain Cu SPs with diameters as low as 10 nm all the way up to 200 nm. The photoluminescence emission wavelength of the nano-products is located at ~680 nm. The Stokes shift of the obtained nanomaterials is more than 300 nm. The emission quantum yields of the Cu NCs and SPs are as high as 47.5% and 63%, respectively. Due to their facile fabrication processes and their favorable optical properties, the two as-prepared types of copper nano-materials exhibit great potential for bio-imaging and bio-sensing applications.

1. Introduction

Metal nanoclusters (NCs) and their supraparticles (SPs) are two kinds of favorable nano-entities, and their relationship can be compared to atoms/molecules vs. supermolecules [1,2,3]. Metal NCs, such as gold, silver, and copper ones, are kinds of ultra-small particles that are composed of several to hundreds of metal atoms [4,5,6,7,8,9].
Due to quantum confined effects, metal NCs have a tunable photoluminescence property, and they exhibit great application potentials in the fields of bio-medicine, biosensing, catalysis, and so on [10,11,12]. Among the various metal NCs, copper ones have attracted especial attention due to their favorable biocompatibility, their abundance on the planet, and also their relatively low cost [13,14,15]. In terms of hierarchical SPs that are made of metal NCs, they can not only retain the properties of the building blocks but also enhance the stability of the NCs, and they can even produce novel synergistic effects. For example, Huang et al. self-assembled Cu NCs into uniform SPs with a size of about 65 nm by host–guest interactions. The obtained SPs not only exhibited enhanced photoluminescence quantum yields (from 2.6 to 14.9%) by aggregation-induced emission effects but also became more stable by the encapsulation of the guest molecules [16]. Kang et al. employed arginine-modified Cu NCs as building blocks, and they fabricated the corresponding assemblies with white-light emission [17]. To date, copper NCs and SPs have been employed for chemical sensors, biological imaging, and light emitting devices, and so on [18,19,20].
Generally, Cu NCs are synthesized in aqueous medium, in which copper ions are reduced by NaBH4 (or ascorbic acid) in the presence of small molecules (such as glutathione or GSH) or biomacromolecules (such as bovine serum albumin) as templates [21,22]. For Cu SPs, the fabrication is always conducted by the assembly of pre-synthesized NCs by different approaches. For example, the Rahaie group reported Cu-NC SPs fabrication by using a multimerized VEGF165 aptamer joint with an ssDNA-based linker in the middle and poly(thymine) sequences on both the 3′ and the 5′ends as a template [23]. Robin H. A. Ras and his co-workers employed water-in-oil emulsion as templates, and they fabricated hierarchical SPs self-assembled by Cu NCs [1]. In other words, the formation of Cu SPs requires a two-step process: namely, preparing the building blocks and self-assembling them into the target product. In parallel to the solution synthesis approach, the solid state one is a facile but effective means of nanomaterial fabrication. For example, the Hidehiro group [24] obtained Au–Ag alloy NCs through sequential reduction by simple mortar grinding. Moores and his co-workers [25] reported a novel and simple approach for the bottom-up fabrication of Bi2S3 nanoparticles (NPs) by grinding processes. The Prasad group [26] employed NaBH4 as reducing agents, and they obtained Ag and Cu NCs that were based on a solid state grinding reaction system. In addition, up until today, many NPs, including the Au and Ag ones, have been obtained by the solid state fabrication method [27,28]. However, to our knowledge, the fabrication of Cu NCs and their SPs has not been achieved by solution-free systems.
Herein, we present solid state processes for the fabrication of copper NCs and their SPs. To achieve this, copper salt and thiols are mixed and then grinded for ~10–15 min, and the nanomaterial products are thereby obtained. Interestingly, it was found in this study that the formation of NCs or SPs is completely dependent on the grinding method: with mechanical grinding, the products are several nano-meter sized NCs, whereas manual grinding in an agate mortar can obtain Cu SPs with diameters of 10nm all the way to 200 nm. The photoluminescence emission wavelength of the nano-products is located at ~680 nm. The Stokes shift of the obtained nanomaterials is more than 300 nm. The emission quantum yields of the Cu NCs and the SPs are as high as 47.5% and 63%, respectively. Due to facile fabrication processes and the favorable optical properties, the two as-prepared types of copper nano-materials exhibit great potentials for both bio-imaging and bio-sensing applications.

2. Experimental Section

2.1. Materials

Cupric acetate monohydrate was purchased from a fine chemical plant in Shanghai Jingbao (China). Both l-penicillamine (l-Pen) and 2-mercapto-1-methyl imidazole (MMI) were obtained from Aladdin Chemistry Co., Ltd., in Shanghai, China. l-cysteine (l-Cys) was bought from Alfa Aesar chemical Co., Ltd. in Shanghai, China, and glutathione (GSH) was provided from Shenggong Biological Engineering Co., Ltd. in Beijing, China. The water used in the experiment was deionized water (18.25 MΩ·cm).

2.2. Instruments

A miniature vibrating ball mill was purchased from Hefei Hefei Kejing Material Technology Co., Ltd. (Hefei, China), and the grinding ball with the material of zirconium oxide was 2 mm in diameter. An agate mortar with an agate grinding ball (60 mm in diameter) was obtained from an agate products factory in Lingyuan Bohua (Shenyang, China). Transmission electron microscope (TEM) images were taken with a Hitachi HT-7800 microscope (Tokyo, Japan) at an accelerating voltage of 100 kV. High-resolution (HR) TEM images were captured by a FEI Tecnai F20 transmission electron microscope (Hilsboro, OR, U.S.A.) at an acceleration voltage of 200 kV. The absorption spectra were obtained through a Hitachi U-3100 spectrophotometer (Tokyo, Japan). Fluorescence spectra, fluorescence lifetime, and absolute fluorescence quantum yields (QYs) were measured by a FLS 1000 steady state/transient fluorescence spectrometer (Livingston, UK). X-ray photoelectron spectroscopy (XPS) was measured with Thermofisher Nexsa (Waltham, MA, U.S.A.). Fourier transform infrared (FT-IR) spectra were conducted using a PerkinElmer PE-983 FT-IR spectrophotometer (Waltham, MA, USA).

2.3. Fabrication Processes

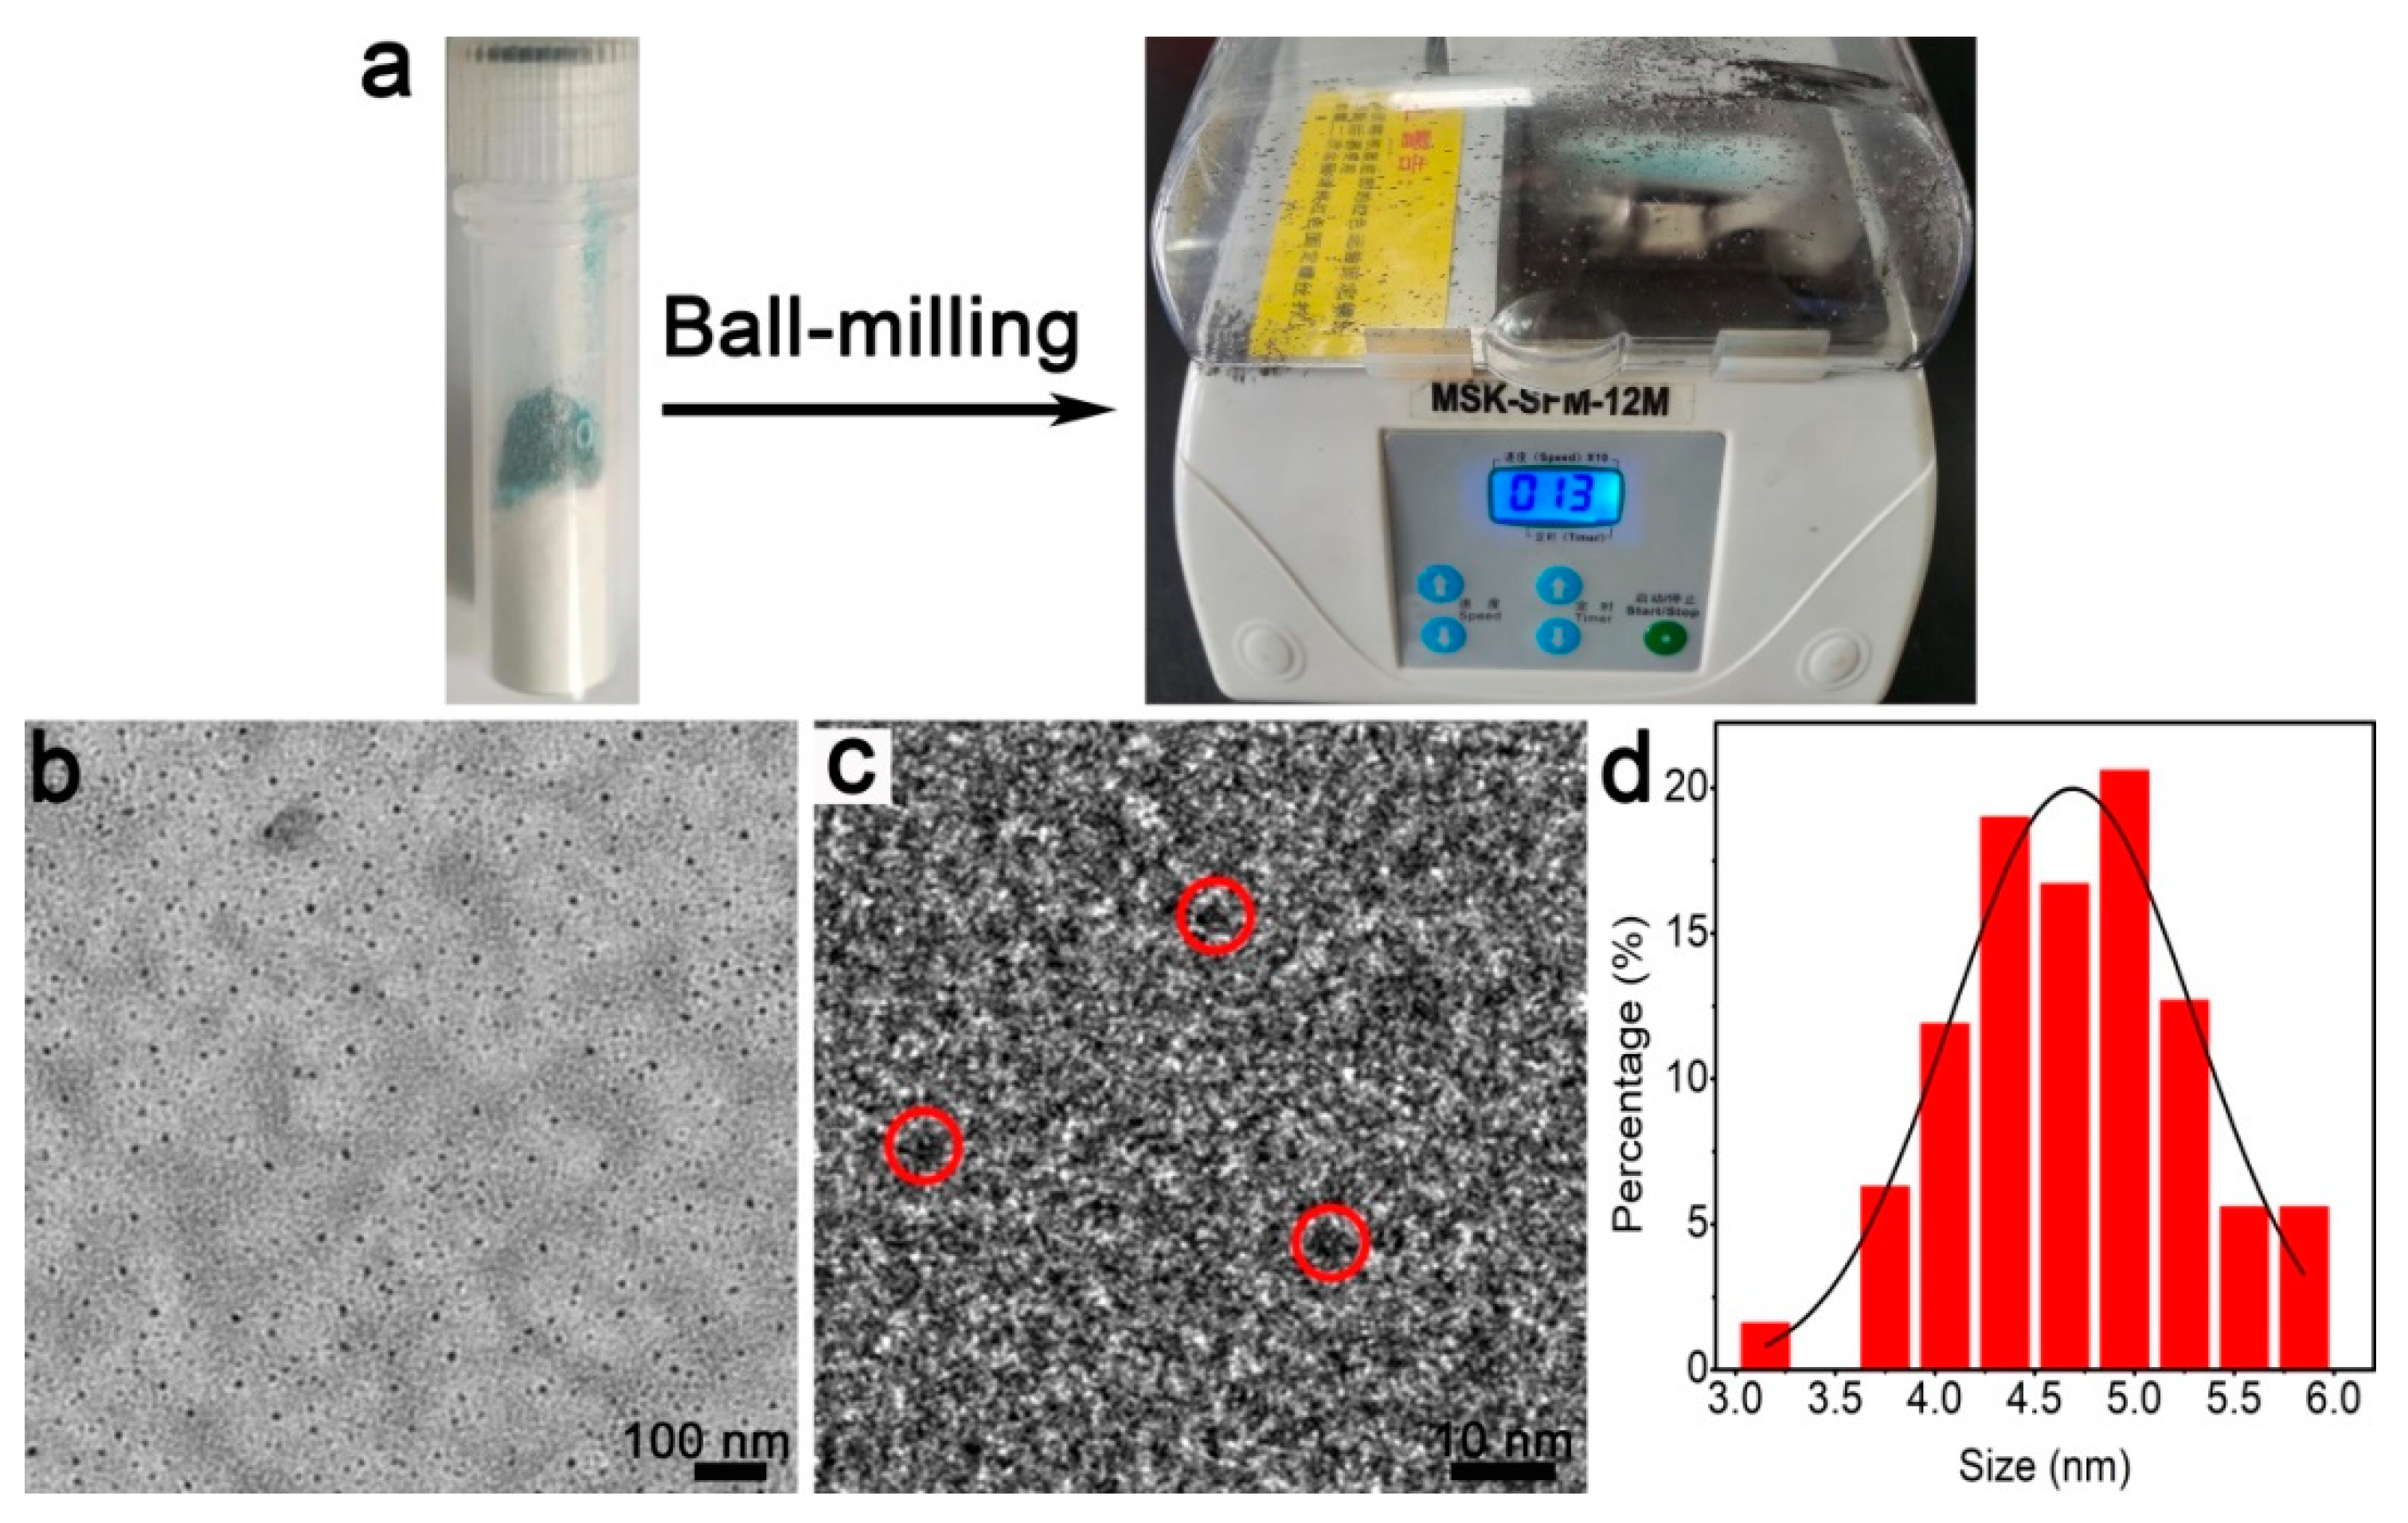
2.3.1. Cu NCs Fabrication

The typical fabrication processes for CuNCs contain several steps. Firstly, 0.1492 g of l-Pen and 0.04 g of copper acetate monohydrate were sequentially added into the ball mill tube and placed in a miniature vibrating ball mill for a 10 min reaction at 3000 r/min. Then, the blue solid powder containing l-Pen-modified CuNCs was obtained. Thirdly, a certain amount of the blue solid powder was taken for directly measuring the optical properties. Lastly, for purification of the crude products, about ~0.02 g of the as-prepared powder was dissolved in 4.0 mL water, fully stirred, and then centrifuged at 1000 r/min for 15 min. After the supernatant was removed, the purified white precipitate was obtained, which was either dissolved in water or else vacuum dried for various characterizations.

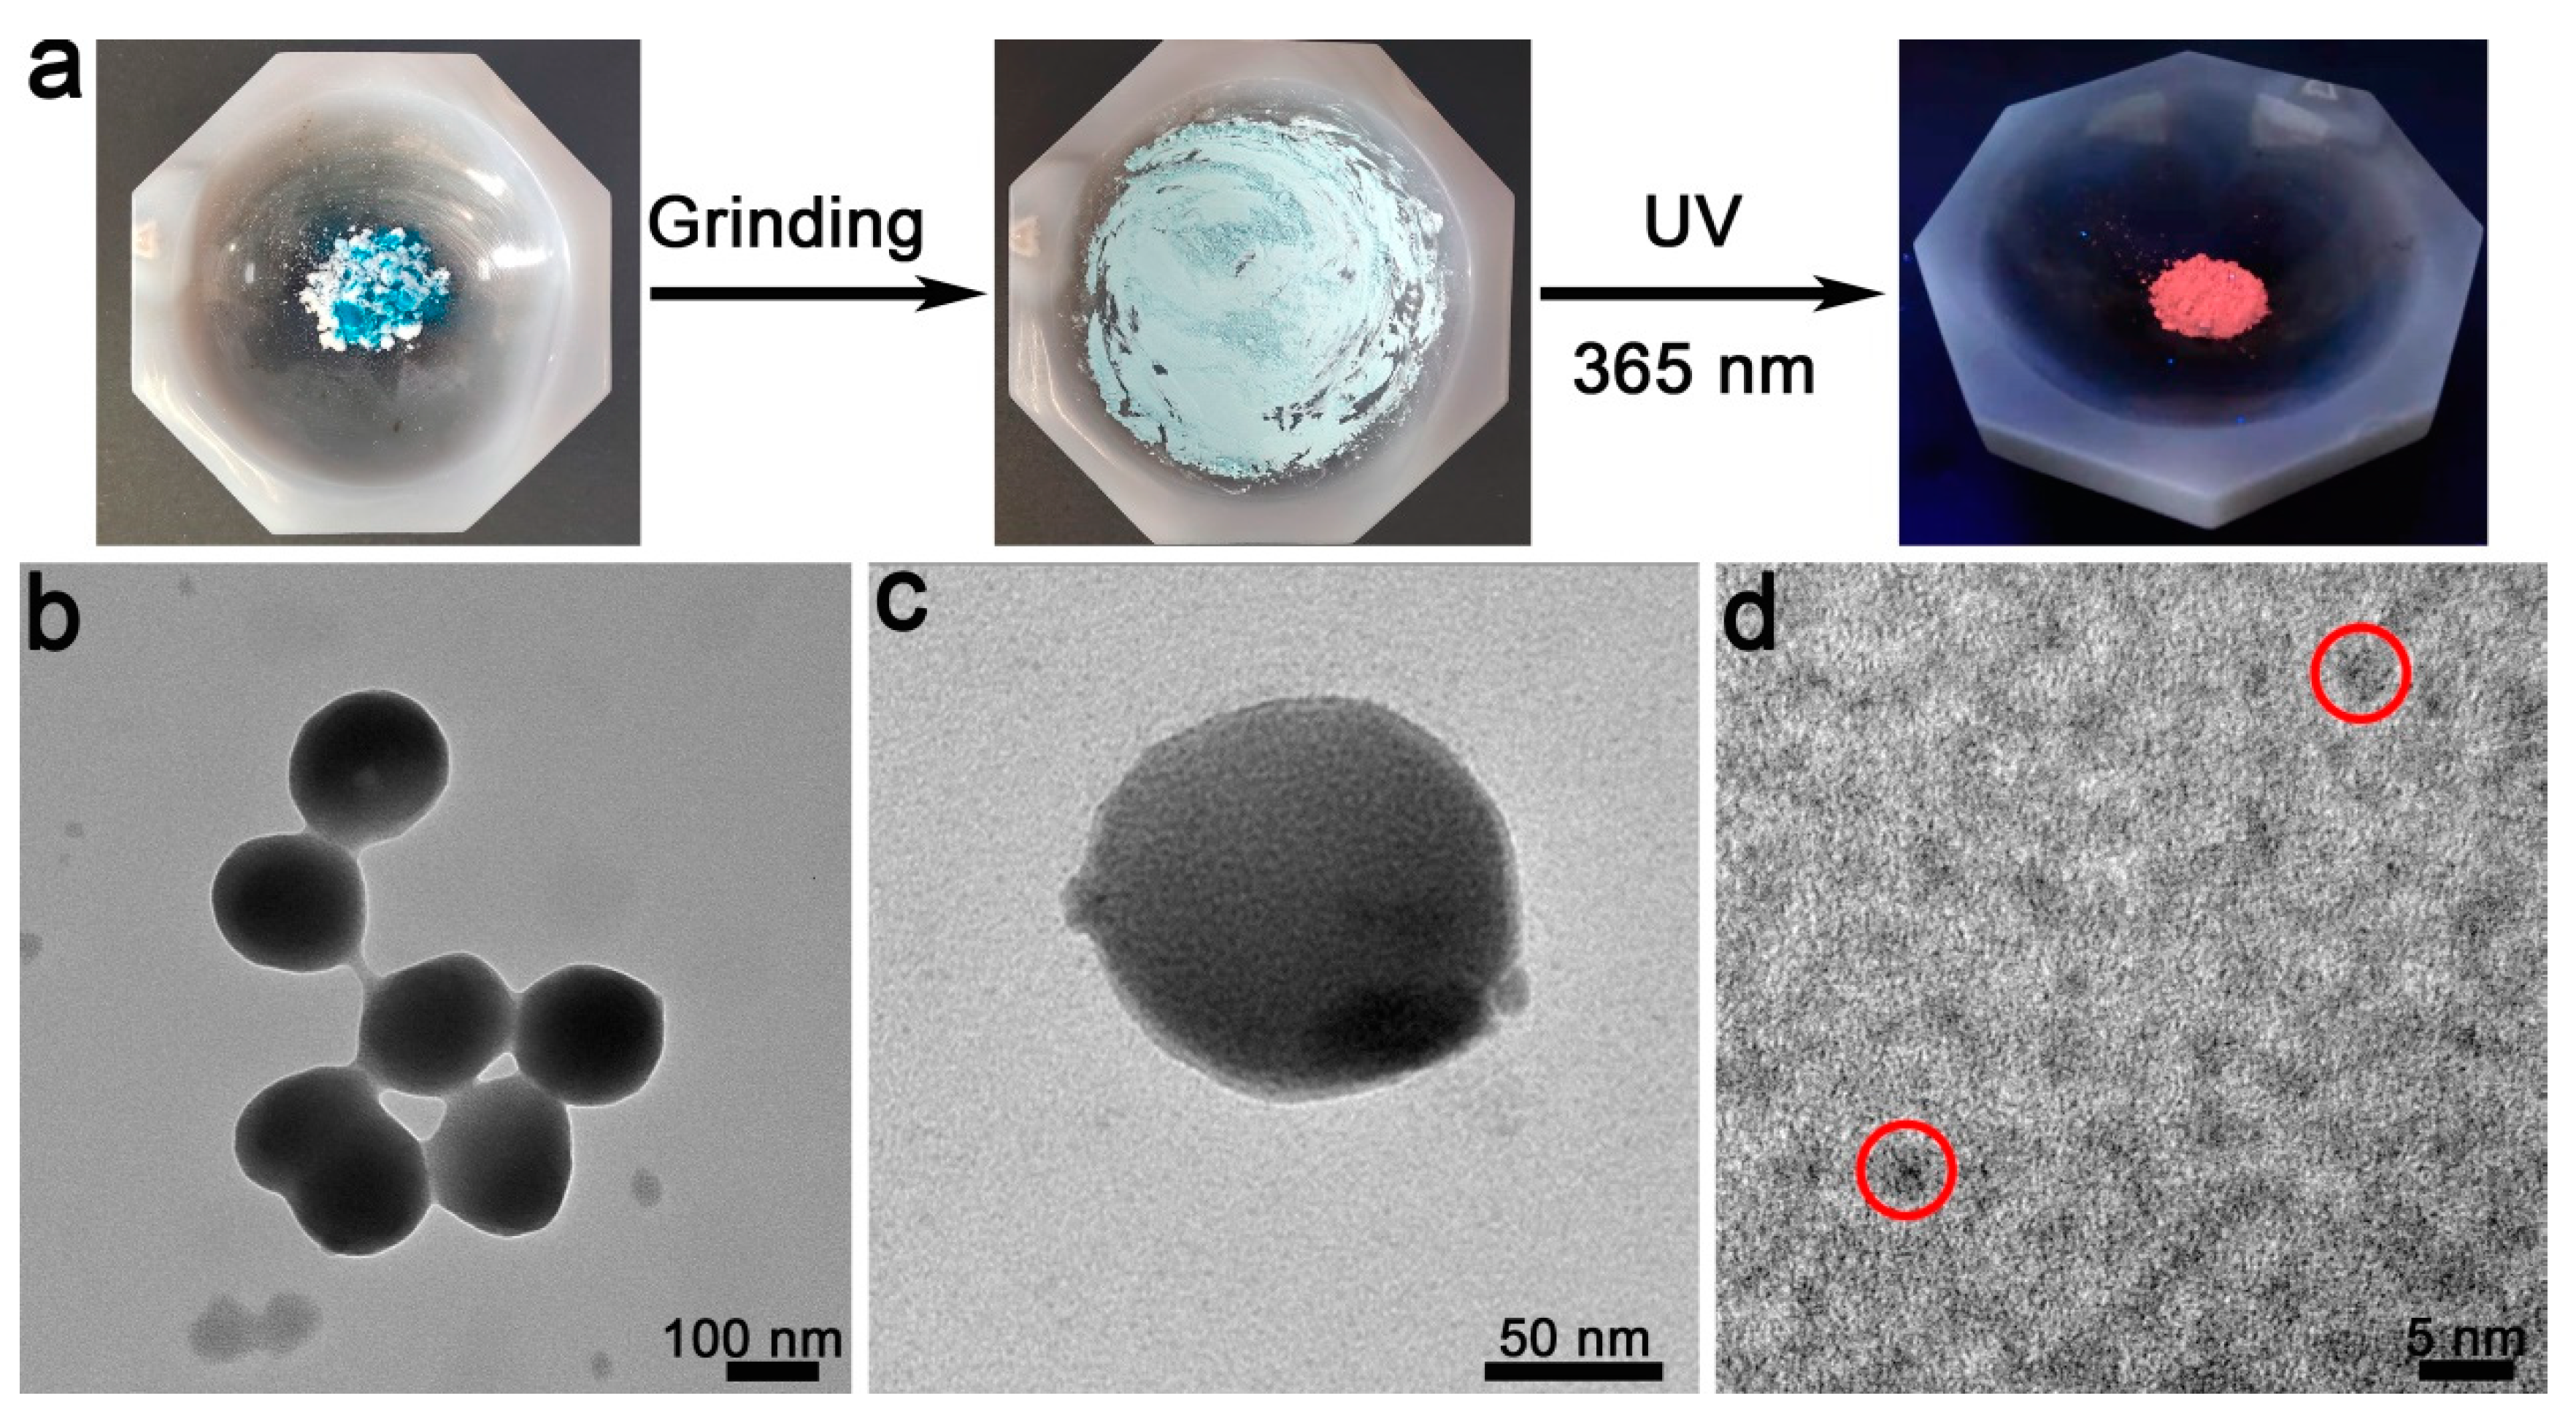
2.3.2. CuSPs Fabrication

The typical fabrication processes for Cu SPs are as follows: 0.1492 g of l-Pen and 0.04 g of copper acetate monohydrate were weighed and successively added in a mortar, which was manually ground (clockwise at a rate of two turns per second) for 10 min. Then, the blue solid powder containing l-Pen-modified Cu SPs was obtained. Thirdly, a certain amount of the blue solid powder was taken for directly measuring the optical properties. Finally, for purification of the crude products, about ~0.02 g of the as-prepared powder was dissolved in 4.0 mL water, fully stirred, and then centrifuged at 1000 r/min for 15 min. After the supernatant was removed, the purified white precipitate was obtained, which was either dissolved in water or vacuum-dried for various characterizations. For obtaining l-Cys-, GSH-, and MMI-modified SPs, the fabrication processes were similar to the above, only l-Pen was replaced by the corresponding stabilizers, respectively.

3. Results and Discussion

Figure 1a shows the employed miniature vibrating ball mill. We first utilize transmission electron microscopy (TEM) in order to explore the feasibility of fabrication. As shown in the large-scale TEM image (Figure 1b), the purified products are typically spherical and 3–5 nm in diameter (Figure 1d). The high-resolution (HR) TEM image (Figure 1c) demonstrates that the particles possess observable lattice fringes, which indicates the formation of crystal products. Accordingly, NC products are obtained.
As shown in Figure 2a, after the solid reaction in the vibrating ball mill, the absorption intensities of Cu2+ ions (broad band at 500–100 nm) decrease by five-sixths, which indicates that most of the Cu2+ ions are involved in the reaction and are probably reduced to Cu+/Cu0 products. As the crude powder products are dissolved in water by purification processes, the Cu2+ absorption (500–1000 nm) disappears completely (green curve in Figure 2b). The absorption edge of the Cu NCs is located at 370 nm, which possibly comes from quantum-confined effects due to their small size. As described in the inset of Figure 2c, the as-prepared Cu NCs powder exhibited an obvious red emission because of its decent quantum yields (25%). Correspondingly, the excitation and the photoluminescence spectra were taken (see Figure 2c), and the peaks were located at 355 and 682 nm, respectively. The Stokes shift of the products was as large as 327 nm, which is the typical feature of Cu NCs, and which results from the charge transfer between the metal and metal atoms and/or between the charge transfer between the metal atoms and the ligands [29,30]. Figure 2e,f is the XPS spectra of Cu 2p. It is clear that the unreacted Cu2+ ions (the binding energy at 934 eV) were well removed by water solution purification, which is well in agreement with the results of Figure 2b. As described in the FTIR spectra (Figure 2g, Figures S1 and S2), after the formation of the Cu NC products, the S-H peak in the l-Pen (2511 cm−1) disappeared, indicating that the thiol molecules are modified onto the NCs by S-Cu bonds [31,32]. The emission lifetime of the Cu NCs is 31.33 μs, which demonstrates that the photoluminescence probably comes from the charge transfer from ligand to metal [33].
As shown in Figure 3a, as the grinding operation is manually conducted in an agate mortar, photoluminescent products can also be obtained. Interestingly, the obtained nano-products are not NCs but are, rather, the particles that are ~200 nm in diameter (Figure 3b,c). Based on the HRTEM observation (Figure 3d and Figure S4), the as-prepared nanoparticles are composed of many 3–5 nm sized NCs. Due to having such as typical hierarchical structure, they are named as SPs in this contribution [34,35,36].
Figure 4a shows the absorption spectra of the raw materials and the crude products (solid states). After reaction, about two-fifths Cu2+ cations (green curve vs. black curve) are reduced. Compared with the reaction in the miniature vibrating ball mill, less Cu2+ cations participate in the redox reaction during the manual grinding processes. The probable reason is that the former reaction system can provide more sufficient mixing and a higher temperature, which results in a relatively full reaction. Similarly, the unreacted raw materials can also be conveniently removed by water washing (Figure 4b). The excitation and the photoluminescence emission peaks of the SPs are located at 307 and 680 nm. Their Stokes shift reaches 373 nm, which is 47 nm larger than that of the above Cu NCs (327 nm). The larger Stokes shift possibly results from the energy transfer effects among the NCs within the SPs. After dispersion in the water solution, the emission peak of the products barely shift (679 vs. 680 nm), which indicates that the hierarchical structures of the SPs keep well in water solution. Because of the high emission quantum yields (63%), both the powder and the solution exhibit bright emission under UV light. Based on Figure 4e–h, the SPs possess similar composition, structure, as well as emission lifetime, as compared with the Cu NC.
According to the above, an obvious but interesting question regarding nano-products that are dependent on grinding manner is why mechanical grinding causes NCs while manual operation causes SPs. First, as the miniature vibrating ball mill is employed, there is a high-speed grinding operation (3000 r/min), whereas manual grinding in an agate mortar can only reach tens of rounds each minute, so the reaction temperature of the former system is probably much higher than that of the latter. Then, due to higher temperature and more sufficient grinding processes, the former system possesses relatively full redox reaction. That is to say, in the mechanical grinding system, more Cu2+ cations are reduced to Cu2+/Cu0 products. On the contrary, more unreacted Cu2+ cations are contained in the manual grinding system, and due to the higher electric charges of Cu2+ cations, they might cross link the formed NCs and result in SP products by electrostatic attraction effects. At present, the exact reason for the formation of the hierarchical SPs is unclear, and it thus needs further study.
To test the applicability of the SPs’ fabrication approach, l-Pen is replaced by other thiols—namely, l-Cys, GSH, and MMI. As shown in Figure 5, by using the three thiol molecules, well-defined Cu SPs can also be obtained. Notably, as GSH or MMI are used as stabilizers, the obtained SPs are much smaller (only 40–60 nm). Furthermore, the MMI-modified SPs are blue-emitting (emission peak at 460 nm), which is distinctly different from the other red-emitting products.

4. Conclusions

In summary, we have presented a one-step solid state reaction approach for the controlled fabrication of Cu nanomaterials. We have found that photoluminescent Cu NCs and hierarchical SPs can be reliably obtained by mechanical and manual grinding methods, respectively. The obtained Cu NCs and SPs have a large Stokes shift, near infrared emission wavelength, and high emission quantum yields. The as-prepared Cu nanoproducts are promising for both bio-imaging and biosensing applications.

Supplementary Materials

The following supporting information can be downloaded at: https://www.mdpi.com/article/10.3390/chemistry5030134/s1. FTIR spectra of l-pen and the formed Cu NCs (Figure S1), FTIR spectra of L-pen and the formed Cu SPs (Figure S2), Amplifed HRTEM image of the Cu NCs (Figure S3), Amplifed HRTEM image of the Cu SPs (Figure S4), The products obtained by different mechanical grinding time (Figure S5), The products obtained by 20 min manual grinding (Figure S6).

Author Contributions

R.W. and Y.Z. conducted the experiments, R.W. written the first drift, Y.X. designed the experiments, written and organized the manuscript. All authors have read and agreed to the published version of the manuscript.

Funding

This work was financially supported by the National Natural Science Foundation of China (No. 21775004).

Data Availability Statement

The work has been studied since 2020.

Conflicts of Interest

The authors declare no conflict of interest.

References

  1. Zhou, S.; Peng, B.; Duan, Y.; Liu, K.; Ikkala, O.; Ras, R.H.A. Bright and Photostable Fluorescent Metal Nanocluster Supraparticles from Invert Emulsions. Angew. Chem. Int. Ed. 2022, 61, e202210808. [Google Scholar] [CrossRef] [PubMed]
  2. Ma, Z.; Gao, G.; Luo, Z.; Tang, X.; Sun, T. Tuning Chirality Transfer and Amplification of Supraparticles via Solvent Inducing Self-Aggregation of Chiral Gold Nanoclusters. J. Phys. Chem. C 2019, 123, 24973–24978. [Google Scholar] [CrossRef]
  3. Mortazavi Moghadam, F.; Bigdeli, M.; Tamayol, A.; Shin, S.R. TISS nanobiosensor for salivary cortisol measurement by aptamer Ag nanocluster SAIE supraparticle structure. Sens. Actuators B 2021, 344, 130160. [Google Scholar] [CrossRef]
  4. Jin, R.; Zeng, C.; Zhou, M.; Chen, Y. Atomically Precise Colloidal Metal Nanoclusters and Nanoparticles: Fundamentals and Opportunities. Chem. Rev. 2016, 116, 10346–10413. [Google Scholar] [CrossRef]
  5. Zou, X.; Jin, S.; Du, W.; Li, Y.; Li, P.; Wang, S.; Zhu, M. Multi-ligand-directed synthesis of chiral silver nanoclusters. Nanoscale 2017, 9, 16800–16805. [Google Scholar] [CrossRef]
  6. Zheng, Y.; Wu, J.; Jiang, H.; Wang, X. Gold nanoclusters for theranostic applications. Coord. Chem. Rev. 2021, 431, 213689. [Google Scholar] [CrossRef]
  7. Shang, L.; Dong, S.; Nienhaus, G.U. Ultra-small fluorescent metal nanoclusters: Synthesis and biological applications. Nano Today 2011, 6, 401–418. [Google Scholar] [CrossRef]
  8. Liu, Q.; Liu, Q.; Chen, Y.; Li, Y.; Su, H.; Liu, Q.; Li, G. Ir nanoclusters confined within hollow MIL-101 (Fe) for selective hydrogenation of α, β-unsaturated aldehyde. Chin. Chem. Lett. 2022, 33, 374–377. [Google Scholar] [CrossRef]
  9. Zou, J.; Fei, W.; Qiao, Y.; Yang, Y.; He, Z.; Feng, L.; Li, M.-B.; Wu, Z. Combined synthesis of interconvertible Au11Cd and Au26Cd5 for photocatalytic oxidations involving singlet oxygen. Chin. Chem. Lett. 2023, 34, 107660. [Google Scholar] [CrossRef]
  10. Lai, W.F.; Wong, W.T.; Rogach, A.L. Development of Copper Nanoclusters for In Vitro and In Vivo Theranostic Applications. Adv. Mater. 2020, 32, e1906872. [Google Scholar] [CrossRef]
  11. Su, Y.; Xue, T.; Liu, Y.; Qi, J.; Jin, R.; Lin, Z. Luminescent metal nanoclusters for biomedical applications. Nano Res. 2019, 12, 1251–1265. [Google Scholar] [CrossRef]
  12. Du, X.; Jin, R. Atomically Precise Metal Nanoclusters for Catalysis. ACS Nano 2019, 13, 7383–7387. [Google Scholar] [CrossRef] [PubMed]
  13. Xie, M.; Han, C.; Zhang, J.; Xie, G.; Xu, H. White Electroluminescent Phosphine-Chelated Copper Iodide Nanoclusters. Chem. Mater. 2017, 29, 6606–6610. [Google Scholar] [CrossRef]
  14. Su, X.; Liu, J. pH-Guided Self-Assembly of Copper Nanoclusters with Aggregation-Induced Emission. ACS Appl. Mater. Interfaces 2017, 9, 3902–3910. [Google Scholar] [CrossRef] [PubMed]
  15. Basu, K.; Paul, S.; Jana, R.; Datta, A.; Banerjee, A. Red-Emitting Copper Nanoclusters: From Bulk-Scale Synthesis to Catalytic Reduction. ACS Sustain. Chem. Eng. 2018, 7, 1998–2007. [Google Scholar] [CrossRef]
  16. Huang, Y.; Ji, J.; Zhang, J.; Wang, F.; Lei, J. Host-guest recognition-regulated aggregation-induced emission for in situ imaging of MUC1 protein. Chem. Commun. 2019, 56, 313–316. [Google Scholar] [CrossRef]
  17. Wang, Z.-X.; Gao, H.; Li, X.-Q.; Jia, Y.-L.; Wang, T.; Cheng, Q.-Y.; Kang, B.; Chen, H.-Y.; Xu, J.-J. Interface Engineering of Copper Nanocluster Assemblies with White-Light Emission. Adv. Funct. Mater. 2023. [Google Scholar] [CrossRef]
  18. Wang, Z.; Chen, B.; Susha, A.S.; Wang, W.; Reckmeier, C.J.; Chen, R.; Zhong, H.; Rogach, A.L. All-Copper Nanocluster Based Down-Conversion White Light-Emitting Devices. Adv. Sci. 2016, 3, 1600182. [Google Scholar] [CrossRef]
  19. Ouyang, X.; Wang, M.; Guo, L.; Cui, C.; Liu, T.; Ren, Y.; Zhao, Y.; Ge, Z.; Guo, X.; Xie, G.; et al. DNA Nanoribbon-Templated Self-Assembly of Ultrasmall Fluorescent Copper Nanoclusters with Enhanced Luminescence. Angew. Chem. Int. Ed. 2020, 59, 11836–11844. [Google Scholar] [CrossRef]
  20. Ye, J.; Dong, X.; Jiang, H.; Wang, X. An intracellular temperature nanoprobe based on biosynthesized fluorescent copper nanoclusters. J. Mater. Chem. B. 2017, 5, 691–696. [Google Scholar] [CrossRef]
  21. Huang, Y.; Feng, H.; Liu, W.; Zhang, S.; Tang, C.; Chen, J.; Qian, Z. Cation-driven luminescent self-assembled dots of copper nanoclusters with aggregation-induced emission for beta-galactosidase activity monitoring. J. Mater. Chem. B. 2017, 5, 5120–5127. [Google Scholar] [CrossRef]
  22. Hu, K.; Liu, Y.; Wang, Q.; Xiong, Y.; Guo, Z.; Weng, Z.; Liu, Y.; Zhang, Y.; Wu, H.; Ai, F.; et al. Copper nanoclusters based short-term memory “eraser”. Chem. Eng. J. 2023, 463, 142366. [Google Scholar] [CrossRef]
  23. Moghadam, F.M.; Rahaie, M. A signal-on nanobiosensor for VEGF165 detection based on supraparticle copper nanoclusters formed on bivalent aptamer. Biosens. Bioelectron. 2019, 132, 186–195. [Google Scholar] [CrossRef] [PubMed]
  24. Murugadoss, A.; Kai, N.; Sakurai, H. Synthesis of bimetallic gold–silver alloy nanoclusters by simple mortar grinding. Nanoscale 2012, 4, 1280–1282. [Google Scholar] [CrossRef] [PubMed]
  25. Malca, M.Y.; Bao, H.; Bastaille, T.; Saadé, N.K.; Kinsella, J.M.; Friscic, T.; Moores, A. Mechanically Activated Solvent-Free Assembly of Ultrasmall Bi2S3 Nanoparticles: A Novel, Simple, and Sustainable Means to Access Chalcogenide Nanoparticles. Chem. Mater. 2017, 29, 7766–7773. [Google Scholar] [CrossRef]
  26. Bera, A.; Busupalli, B.; Prasad, B.L.V. Solvent-Less Solid State Synthesis of Dispersible Metal and Semiconducting Metal Sulfide Nanocrystals. ACS Sustain. Chem. Eng. 2018, 6, 12006–12016. [Google Scholar] [CrossRef]
  27. Sardar, R.; Heap, T.B.; Shumaker-Parry, J.S. Versatile Solid Phase Synthesis of Gold Nanoparticle Dimers Using an Asymmetric Functionalization Approach. J. Am. Chem. Soc. 2007, 129, 5356–5357. [Google Scholar] [CrossRef]
  28. Pandian, P.; Kalimuthu, R.; Arumugam, S.; Kannaiyan, P. Solid phase mechanochemical synthesis of Poly(o-anisidine) protected Silver nanoparticles for electrochemical dopamine sensor. Mater. Today Commun. 2021, 26, 102191. [Google Scholar] [CrossRef]
  29. Chen, D.; Zhao, C.; Ye, J.; Li, Q.; Liu, X.; Su, M.; Jiang, H.; Amatore, C.; Selke, M.; Wang, X. In Situ Biosynthesis of Fluorescent Platinum Nanoclusters: Toward Self-Bioimaging-Guided Cancer Theranostics. ACS Appl. Mater. Interfaces 2015, 7, 18163–18169. [Google Scholar] [CrossRef]
  30. Sun, J.; Yang, X. Gold nanoclusters-Cu2+ ensemble-based fluorescence turn-on and real-time assay for acetylcholinesterase activity and inhibitor screening. Biosens. Bioelectron. 2015, 74, 177–182. [Google Scholar] [CrossRef]
  31. Long, T.; Guo, Y.; Lin, M.; Yuan, M.; Liu, Z.; Huang, C. Optically active red-emitting Cu nanoclusters originating from complexation and redox reaction between copper(II) and D/L-penicillamine. Nanoscale 2016, 8, 9764–9770. [Google Scholar] [CrossRef] [PubMed]
  32. Lin, Z.; Han, D.; Li, S. Study on thermal decomposition of copper(II) acetate monohydrate in air. J. Therm. Anal. Calorim. 2012, 107, 471–475. [Google Scholar] [CrossRef]
  33. Yang, S.; Li, G.; Song, C.; Liu, M.; Yuan, Z. Ultrashort Peptide-Stabilized Copper Nanoclusters with Aggregation-Induced Emission. Colloids Surf. A 2020, 606, 125514. [Google Scholar] [CrossRef]
  34. Zhu, H.; Wang, Y.; Chen, C.; Ma, M.; Gao, M. Monodisperse Dual Plasmonic Au@Cu2–xE (E=S, Se) Core@Shell Supraparticles: Aqueous Fabrication, Multimodal Imaging, and Tumor Therapy at In Vivo Level. ACS Nano 2017, 11, 8273–8281. [Google Scholar] [CrossRef] [PubMed]
  35. Ma, M.; Zhu, H.; Ling, J.; Gong, S.; Zhang, Y.; Xia, Y.; Tang, Z. Quasi-amorphous and Hierarchical Fe2O3 Supraparticles: Active T-1-Weighted Magnetic Resonance Imaging In Vivo and Renal Clearance. ACS Nano 2020, 14, 4036–4044. [Google Scholar] [CrossRef]
  36. Ling, J.; Gong, S.; Xia, Y. Monodisperse Fe2O3 Supraparticles: Eco-Friendly Fabrication, Gallic Acid Modification, Size-Dependent Photothermal Conversion Efficiency, and Cellular Uptake. Adv. Mater. Interfaces 2020, 7, 2000804. [Google Scholar] [CrossRef]
Figure 1. Fabrication of the Cu NCs: (a) ball mill tube (left) and the ball mill instrument (right); (b) TEM; (c) HRTEM; (d) size distribution of the Cu NCs.
Chemistry 05 00134 g001
Figure 2. Characterizations of the Cu NCs. Absorption spectra of the raw materials and the crude products at solid (a) and solution (b) states. Excitation and emission spectra of the products at solid (c) and solution (d) states. XPS spectra of the products before (e) and after (f) purification, FTIR (g), and photoluminescence emission lifetime (h) of the purified products.
Chemistry 05 00134 g002
Figure 3. Fabrication of the Cu SPs. (a) The employed mortar. TEM (b,c) and HRTEM (d) of the Cu SPs.
Chemistry 05 00134 g003
Figure 4. Characterizations of the Cu SPs. Absorption spectra of the raw materials and the crude products at solid (a) and solution (b) states. Excitation and emission spectra of the products at solid (c) and solution (d) states. XPS spectra of the products before (e) and after (f) purification, FTIR (g), and photoluminescence emission lifetime (h) of the purified products.
Chemistry 05 00134 g004
Figure 5. Fabrication of Cu SPs by using other thiol molecules as stablizers: (ac) l-Cys CuSPs; (df) GSH CuSPs; (gi) MMI CuSPs.
Chemistry 05 00134 g005
Disclaimer/Publisher’s Note: The statements, opinions and data contained in all publications are solely those of the individual author(s) and contributor(s) and not of MDPI and/or the editor(s). MDPI and/or the editor(s) disclaim responsibility for any injury to people or property resulting from any ideas, methods, instructions or products referred to in the content.

