Article

Construction of an ATP-Activated Y-Shape DNA Probe for Smart miRNA Imaging in Living Cells

1
MOE Key Laboratory for Analytical Science of Food Safety and Biology, Fujian Provincial Key Laboratory of Analysis and Detection Technology for Food Safety, State Key Laboratory of Photocatalysis on Energy and Environment, College of Chemistry, Fuzhou University, Fuzhou 350116, China
2
Fujian Key Laboratory of Functional Marine Sensing Materials, Center for Advanced Marine Materials and Smart Sensors, College of Materials and Chemical Engineering, Minjiang University, Fuzhou 350108, China
*
Authors to whom correspondence should be addressed.
Chemistry 2023, 5(3), 1634-1644; https://doi.org/10.3390/chemistry5030112
Submission received: 17 June 2023 / Revised: 14 July 2023 / Accepted: 25 July 2023 / Published: 27 July 2023

Abstract

:
A stringent DNA probe to profile microRNA (miRNA) expression within a specific cell remains a key challenge in biology. To address this issue, an intracellular ATP-activated Y-DNA probe for accurate imaging of miRNA in living cells was designed. Y-DNA was based on the fabrication of tripartite function modules, which consisted of a folate (FA)-modified targeting module, an ATP aptamer-sealed driver, and a miRNA sensing module. The Y-DNA probe could be specifically activated by ATP after it efficiently internalized into FA-receptor-overexpressed cells based on caveolar-mediated endocytosis, leading to the activation of the miRNA sensing module. The activated Y-DNA probe allowed for the imaging of miRNA in living cells with high sensitivity. The design of the ATP-activated Y-DNA sensor opens the door for bioorthogonal miRNA imaging and promotes the development of various responsive DNA molecular probes with enhanced anti-interference ability for clinical diagnosis.

1. Introduction

MicroRNAs (miRNAs) are a kind of noncoding endogenous RNA molecule found in eukaryotic cells and consist of 18–24 nucleotides [1]. MiRNAs regulate cellular physiological processes, such as cell proliferation, differentiation, and apoptosis [2]. Notably, the aberrant expression of miRNAs is associated with various diseases [3]. Therefore, miRNAs have attracted increasing attention as biomarkers for potential diagnosis and therapeutics [4]. However, the unique properties of miRNAs, including their small size, degradability, high sequence homology, and low abundance in total RNA samples, present a significant challenge for quantitative analysis [5]. In recent years, quantitative miRNA analysis techniques, such as colorimetry [6], electrochemiluminescence [7,8], and electrochemistry [9,10], have attracted considerable attention. Despite the desirable progress, most of these strategies are confronted with challenges, especially for the precise imaging of live-cell miRNA, which has encouraged researchers to construct living-cell sensing strategies.
Fluorescence molecular imaging technology has been widely used for the imaging of intracellular molecules with the merits of high sensitivity and real-time capability [11,12]. In particular, DNA-based probes have high programmability and biocompatibility and easy synthesis; thus, they have been widely used for the sensing and imaging of various targets in live cells ranging from metal ions to small molecules and proteins [13,14,15]. Specifically, DNA probes can be precisely designed based on the Watson–Crick base pairing principle; thus, they have been developed for the monitoring and detection of specific miRNAs in living cells [16,17]. However, accurate imaging of miRNAs in live cells based on DNA probes remains challenging due to the following reasons: First, traditional DNA probes are continuously in an “always-active” state, which may easily cause unreliable readout for complex biological environments and cannot reflect the real target concentration [18,19]. Second, internalized DNA probes can be subjected to degradation in complex biological environments, which results in false positive signals [20,21]. Accordingly, the construction of site-specific activated DNA probes with high stability for specific and reliable intracellular miRNA imaging is still needed.
Exogenous regulation (especially photo-activation) is an excellent stimulus to control the activation of DNA probes in a site-specific manner [22,23,24]. For example, Li and coworkers demonstrated that the use of deep-tissue-penetrable NIR light as a trigger allows for the spatially selective monitoring of APE1 in subcellular locales in vivo [23]. Lou and coworkers proposed a novel NIR-activated CHA for controllable miRNA imaging in living cells [24]. However, the application of photo-activation in living systems is significantly constrained by several factors, including the cumbersome chemical synthesis of photolabile groups on nucleobases, the limited penetration depth of light, and the potential for phototoxicity. Noteworthily, adenosine triphosphate (ATP) is considered an essential endogenous biomolecule for intracellular energy transfer, and it takes part in cellular metabolism and signaling [25]. Considering the much higher concentration of ATP in intracellular cytosol than that in the extracellular environments (1−10 mM vs 0.4 mM) [26], it is suitable to control DNA probes for biomarker detection with relatively high precision and low interference in living cells. For example, Zhang and coworkers constructed ATP self-powered strand displacement cascade amplification of DNA-structure-modified mesoporous silica nanoparticles for high-sensitivity detection of low-abundance miRNA in living cells [27]. Dong and coworkers reported a target-cell-specific DNA nanosystem using endogenous ATP bioorthogonal activation of the hybridization chain reaction signal amplification to image miRNA in living cells [25]. Herein, we design an endogenously ATP-activated Y-shaped DNA probe for miRNA imaging. The miRNA recognition sites in Y-DNA are sealed with ATP aptamer, and the Y-DNA probe can only be activated by endogenous ATP. Folate (FA) is anchored on the one vertex of Y-DNA to improve affinity for and targetability to cancer cells. As anticipated, the designed Y-DNA probe is successfully applied for the sensitive and selective detection of miR-21 with a detection limit corresponding to 0.12 nM. Furthermore, our ATP-activated Y-DNA probe is extensively explored in MCF-7 cells for realizing reliable intracellular miRNA imaging. Therefore, this Y-DNA probe extremely broadens intracellular miRNA imaging strategies and holds great potential in miRNA-related biological research and early diagnosis.

2. Materials and Methods

2.1. Materials

The oligonucleotide strands were synthesized by Sanya Biotechnology Co., Ltd. (Fuzhou, China). Adenosine triphosphate (ATP), oligomycin, and HEPES were bought from Sigma-Aldrich (Shanghai, China). The 6 × loading buffer was obtained from Thermo Fisher Scientific (San Jose, CA, USA). GelRed was bought from Life-iLab Biotech (Shanghai, China). L02 (mouse endothelial cell line) and MCF-7 cell (human breast adenocarcinoma cell line) lines were purchased from Shanghai Institutes for Biological Sciences (Shanghai, China). Lipofectamine 3000 transfection reagent, miRNA-21 mimic (micrONhsa-miR-21-5p mimic), and inhibitor (MicrOFFhsa-miR-21-5p inhibitor) were purchased from RiboBio Co., Ltd. (Guangzhou, China). All the chemicals were analytical-grade and used as received without further purification. Ultrapure water was obtained through a Millipore Milli-Q water purification system and had an electric resistance >18.25 MΩ. Table S1 exhibits the detailed sequences of the oligonucleotides.

2.2. Instruments

Gel imaging was captured using a ChemiDoc Touch Imaging System from Bio-Rad Laboratories. The fluorescence spectra were measured on a Cary Eclipse Fluorimeter (Varian Inc.). Confocal fluorescence imaging was obtained using Nikon A1 confocal laser scanning microscopy (Tokyo, Japan).

2.3. Preparation of the Y-DNA

Y-DNA was constructed by annealing the mixtures of folate-modified Y1, Y2, and Y3 with a concentration of 5 μM independently at 95 °C for 5 min. Then, the mixtures were cooled to 20 °C at 0.2 °C/s. The as-prepared Y-DTN probe was stored at 4 °C for subsequent experiments.

2.4. Gel Electrophoresis Experiments

The formation and response performance of Y-DNA probes was tested using 3% agarose gel electrophoresis. In brief, 3% agarose gel electrophoresis was prepared by dissolving agarose powder in 0.5 × TBE (Tris, borate, and EDTA) buffer, and then heating in a microwave oven until the solution was transparent. Then, 10 μL samples and 2 μL 6 × loading buffer were subjected to 3% agarose gel electrophoresis. Afterward, the gel was kept at 60 V in 1 × TBE buffer for 2 h. The gel was stained with GelRed and imaged using a ChemiDoc Touch Imaging System under 365 nm photoirradiation.
The feasibility of the ATP-triggered Y-DNA probe was verified by 12% native polyacrylamide gel electrophoresis. In brief, 10 μL samples and 2 μL 6 × loading buffer were subjected to 12% polyacrylamide gel electrophoresis. Afterward, the gel was kept at 80 V in 1 ×TBE buffer for 1.5 h. The gel was imaged using a ChemiDoc Touch Imaging System.

2.5. Fluorescence Monitoring

The prepared Y-DNA probe (100 nM) was allowed to incubate with various concentrations of miRNA-21 in 10 mM HEPES buffer (1 M NaCl, 50 mM MgCl2, pH 7.2) at 37 °C for 3 h with preincubation of ATP. Afterward, the fluorescence signal was recorded between 660 and 750 nm with excitation at 650 nm.

2.6. Biostability of Y-DNA

Serum Stability: The 100 nM Y-DNA was added into PBS buffer containing 10% fetal bovine serum (FBS) and incubated at 37 °C for 0, 1, 2, 4, 8, 12, and 24 h. Then, the mixtures were analyzed by PAGE.

2.7. Material Cell Culture and MTT Assays

L02 and MCF-7 cells were cultured with RPMI-1640 medium containing 10% FBS, penicillin (100 U/mL), and streptomycin (100 μg/mL) in a 5% CO2 atmosphere at 37 °C.
The cytotoxicity of Y-DNA was determined using a classical MTT test. MCF-7 and L02 cells were distributed into 96-well microplates at a density of 1 × 10⁶ cells/well in a cell incubator overnight. Then, the cells were incubated with different concentrations of Y-DNA (0, 50, 100, and 200 nM) for 24 h. Then, the cell medium was discarded, and 100 μL of MTT solution was added to each well for 4 h. Subsequently, the MTT solution was removed, and 100 μL dimethyl sulfoxide (DMSO) was added to dissolve the formazan. Finally, the absorbance at the wavelength of 490 nm was measured with a microplate reader.

2.8. In Vitro miRNA Imaging

MCF-7 and L02 cells were individually cultured in RPMI-1640 medium with 10% FBS using 20 mm glass bottom cell culture dishes under a 5% CO2 atmosphere at 37 °C for 24 h. For fluorescence imaging, 1 mL culture medium containing 100 nM Y-DNA probe was added to each dish and incubated for 6 h. After three times washing with PBS, fluorescence signals of cells were obtained. The fluorescence signals for miR-21 (Cy5) imaging in the cells were observed with NIKON-A1 laser-scanning confocal microscopy.
For the regulation of ATP levels in living cells, MCF-7 cells were preprocessed with oligomycin (10 μM) for 1 h to cut ATP concentration. Finally, the cells were washed with PBS buffer three times and imaged with NIKON-A1 laser-scanning confocal microscopy.
For exploring the ability of Y-DNA to monitor the undulate expression levels of miR-21, miR-21 mimic (micrONhsa-miR-21-5p mimic) and miR-21 inhibitor (MicrOFFhsa-miR-21-5p inhibitor) were transfected into MCF-7 cells by using a lipofectamine 3000 transfection reagent. Briefly, 15 μL, 20 μM of miR-21 mimic or miR-21 inhibitor and 2 μL lipofectamine 3000 were introduced into 485 μL and 498 μL RPMI-1640 medium. After incubating at room temperature for 5 min, the solution was mixed at room temperature for 20 min. Eventually, the resulting solution (1 mL) was introduced into MCF-7 cells for 3 h. Subsequently, the fluorescence imaging of the cells incubated with the nanoprobe was the same as the one mentioned above.

3. Results

3.1. Principle of the Assay

As shown in Scheme 1, the Y-shaped DNA (Y-DNA) monomer was constructed by the self-assembly of three single-stranded DNAs via hybridization (Y1, Y2, and Y3). Y-DNA offers advantages such as ease of synthesis, minimal structural complexity, and excellent chemical stability, which makes it an ideal component for the development of a multifunctional DNA probe for miRNA imaging. The design of Y-DNA involves rationally engineering the toehold of target miRNA recognition in Y3 with the ATP-aptamer seal sequence (Y2), which prevents the hybridization between Y3 and miRNA in the absence of ATP. The folate (FA)-modified on Y1 allows for efficient cellular internalization of Y-DNA [28,29]. Once Y-DNA is internalized into the cell, endogenous ATP will bind with the ATP aptamer and expose the toehold for the recognition of target miRNA, which will, subsequently, hybridize with Y1 and lead to the dissociation of Y-DNA and produce a remarkable fluorescence enhancement. As a result, the sensitive detection of intercellular miRNA was achieved by using the ATP-activated Y-DNA probe.

3.2. Preparation and Characterization of Y-DNA Probe

The self-assembly processes of the Y-DNA probe were validated using 3% agarose gel electrophoresis (AGE) analysis. As displayed in Figure 1A, Lanes 1, 2, and 3 represent Y1, Y2, and Y3 DNA single strands, respectively. Lanes 4, 5, and 6 were assigned to the annealed products of the Y1/Y2, Y1/Y3, and Y2/Y3 complexes, respectively. The slowest migrating band of Lane 7 represents the Y1/Y2/Y3 structure, which indicates that Y-DNA was successfully synthesized. To test the feasibility of ATP-activated miRNA detection, fluorescence measurements were then performed. Figure 1B shows the fluorescence spectrum of the Y-DNA probes under excitation at 650 nm. After incubating with individual miRNA or individual ATP, the fluorescence only has a slight increase because the individual miRNA or ATP cannot disrupt the structure of Y-DNA. Then, the co-incubation of Y-DNA with ATP and miRNA drives the dissociation of Y-DNA, restoring FAM fluorescence. Fluorescence analysis demonstrates that the sensing property of the Y-DNA probe was indeed activated by ATP. Meanwhile, native polyacrylamide gel electrophoresis (PAGE) was further used to verify ATP-triggered Y-DNA. As shown in Figure 1C, a significant miR-21/Y3 product was observed when Y-DNA was activated by ATP followed by the additional miR-21 (Lane 7). Conversely, no obvious miR-21/Y3 products were observed for mixtures of Y-DNA and miR-21 (Lane 6) in the absence of ATP. Obviously, the miR-21 detection ability of Y-DNA could only be triggered by ATP, which is consistent with the fluorescence results. The results of PAGE and fluorescence clearly demonstrate that the proposed ATP-activated Y-shaped DNA holds great potential for the sensitive detection of miR-21.

3.3. Optimization of Experimental Conditions

The reaction temperature was first optimized since it is an important factor that affects the signal-to-noise ratio in miRNA analysis. Y-DNA with/without the addition of ATP and miRNA was tested. As shown in Figure 2A, the reaction behaviors of Y-DNA at 25 °C, 30 °C, and 37 °C were evaluated. The fluorescence response of Y-DNA enhanced with an increase in temperature from 25 °C to 37 °C. Therefore, 37 °C was selected as the optimal condition for miRNA detection. The concentration of ATP was also investigated to obtain the optimal analytical performance of the Y-DNA probe. As illustrated in Figure 2B, the fluorescence signal surged with an increase in ATP concentration, and 5 mM ATP was sufficient to ensure the complete reaction. Therefore, 5 mM was selected as the optimal concentration of ATP for miRNA detection.

3.4. Analytical Performance of Y-DNA Probe

We further investigated the quantitative analysis performance of ATP-activated Y-DNA for the detection of miR-21 under optimal experimental conditions. In the absence of ATP, the fluorescence response of the Y-DNA probe was weak, and this barely changed upon miR-21 treatment, demonstrating that Y-DNA was blocked efficiently, and there was hardly signal leakage (Figure S1). In the presence of ATP, the fluorescence intensity enhanced with increasing miR-21 concentration under the optimized condition (Figure 3A). A linear relationship between F and the concentration of miR-21 in a range of 0.2−8 nM was obtained. The regression equation is as follows: F = 13.41 CmiR-21 + 60.37 (R2 = 0.995). The limit of detection (LOD) was estimated to be 0.12 nM (based on the 3 σ/k criterion). The specific ATP-activated Y-DNA probe allows for the detection of miRNA with high sensitivity. It is expected that the system can be applied to intracellular miRNA imaging, considering that endogenous ATP could on-site activate the Y-DNA sensor in live cells.
Considering the accuracy of miRNA detection could be substantially improved in an ATP-activated manner, the ATP-specific activatable Y-DNA probe was then testified using a fluorescence assay. As shown in Figure S2, the fluorescence signal of ATP-activated Y-DNA differs greatly from that of other analog (CTP, GTP, and UTP)-treated systems, which is comparable with the background signal of the ATP-absent system. These results demonstrate the remarkable specificity of ATP-activated Y-DNA. Furthermore, the selectivity of the ATP-activated Y-DNA probe was also assessed by introducing miR-429, miR-144, miR-155, and Let-7a as interfering agents. As depicted in Figure S3, compared with target miR-21, miR-429, miR-144, miR-155, and Let-7a did not cause any obvious fluorescence signal change, indicating the excellent selectivity of the proposed ATP-activated Y-DNA probe for miRNA detection.

3.5. Biostability and Biocompatibility of Y-DNA

The toxicity of DNA probes can affect the viability of living cells, which can compromise accuracy in imaging and monitoring targets. As such, the cytotoxicity of Y-DNA nanoprobes toward MCF-7 cells, HeLa cells, and L02 cells was investigated individually using standard MTT assays. In this case, different concentrations of the Y-DNA probes were incubated with these cells for 24 h. As shown in Figure S4, the Y-DNA probes exhibited no obvious cytotoxicity in living cells. The results prove that the proposed Y-DNA probes exerted minimal cytotoxicity for cells; thus, it was ideal for subsequent intracellular experiments. Moreover, biological stability is also important since nucleic acid probes are subject to degradation by nuclease in complex biological samples. In order to demonstrate the biostability of the Y-DNA probes in complex biological systems, 10% fetal bovine serum (FBS) was incubated with the Y-DNA probe. As shown in Figure S5, the strip of the Y-DNA probe was still clearly visible even after 24 h of incubation with 10% FBS. These results suggest that the Y-DNA probe is able to maintain stability in complex physiological environments and ensures feasibility in cellular imaging.

3.6. Sensitivity of miRNA Imaging in Cancer Cells

To investigate the practical application of the Y-DNA probes for miR-21 imaging in living cells, the cellular uptake of the Y-DNA probe was then observed using confocal laser scanning microscopy (CLSM). MCF-7 cells with high expression of miR-21 were selected as a model. As displayed in Figure S6, the real-time imaging of intracellular fluorescence increased according to the incubation time, confirming the cellular uptake process of the Y-DNA probe in live cells. The mean fluorescence intensity reached a maximum at 4 h, indicating that this time point should be used in subsequent experiments.
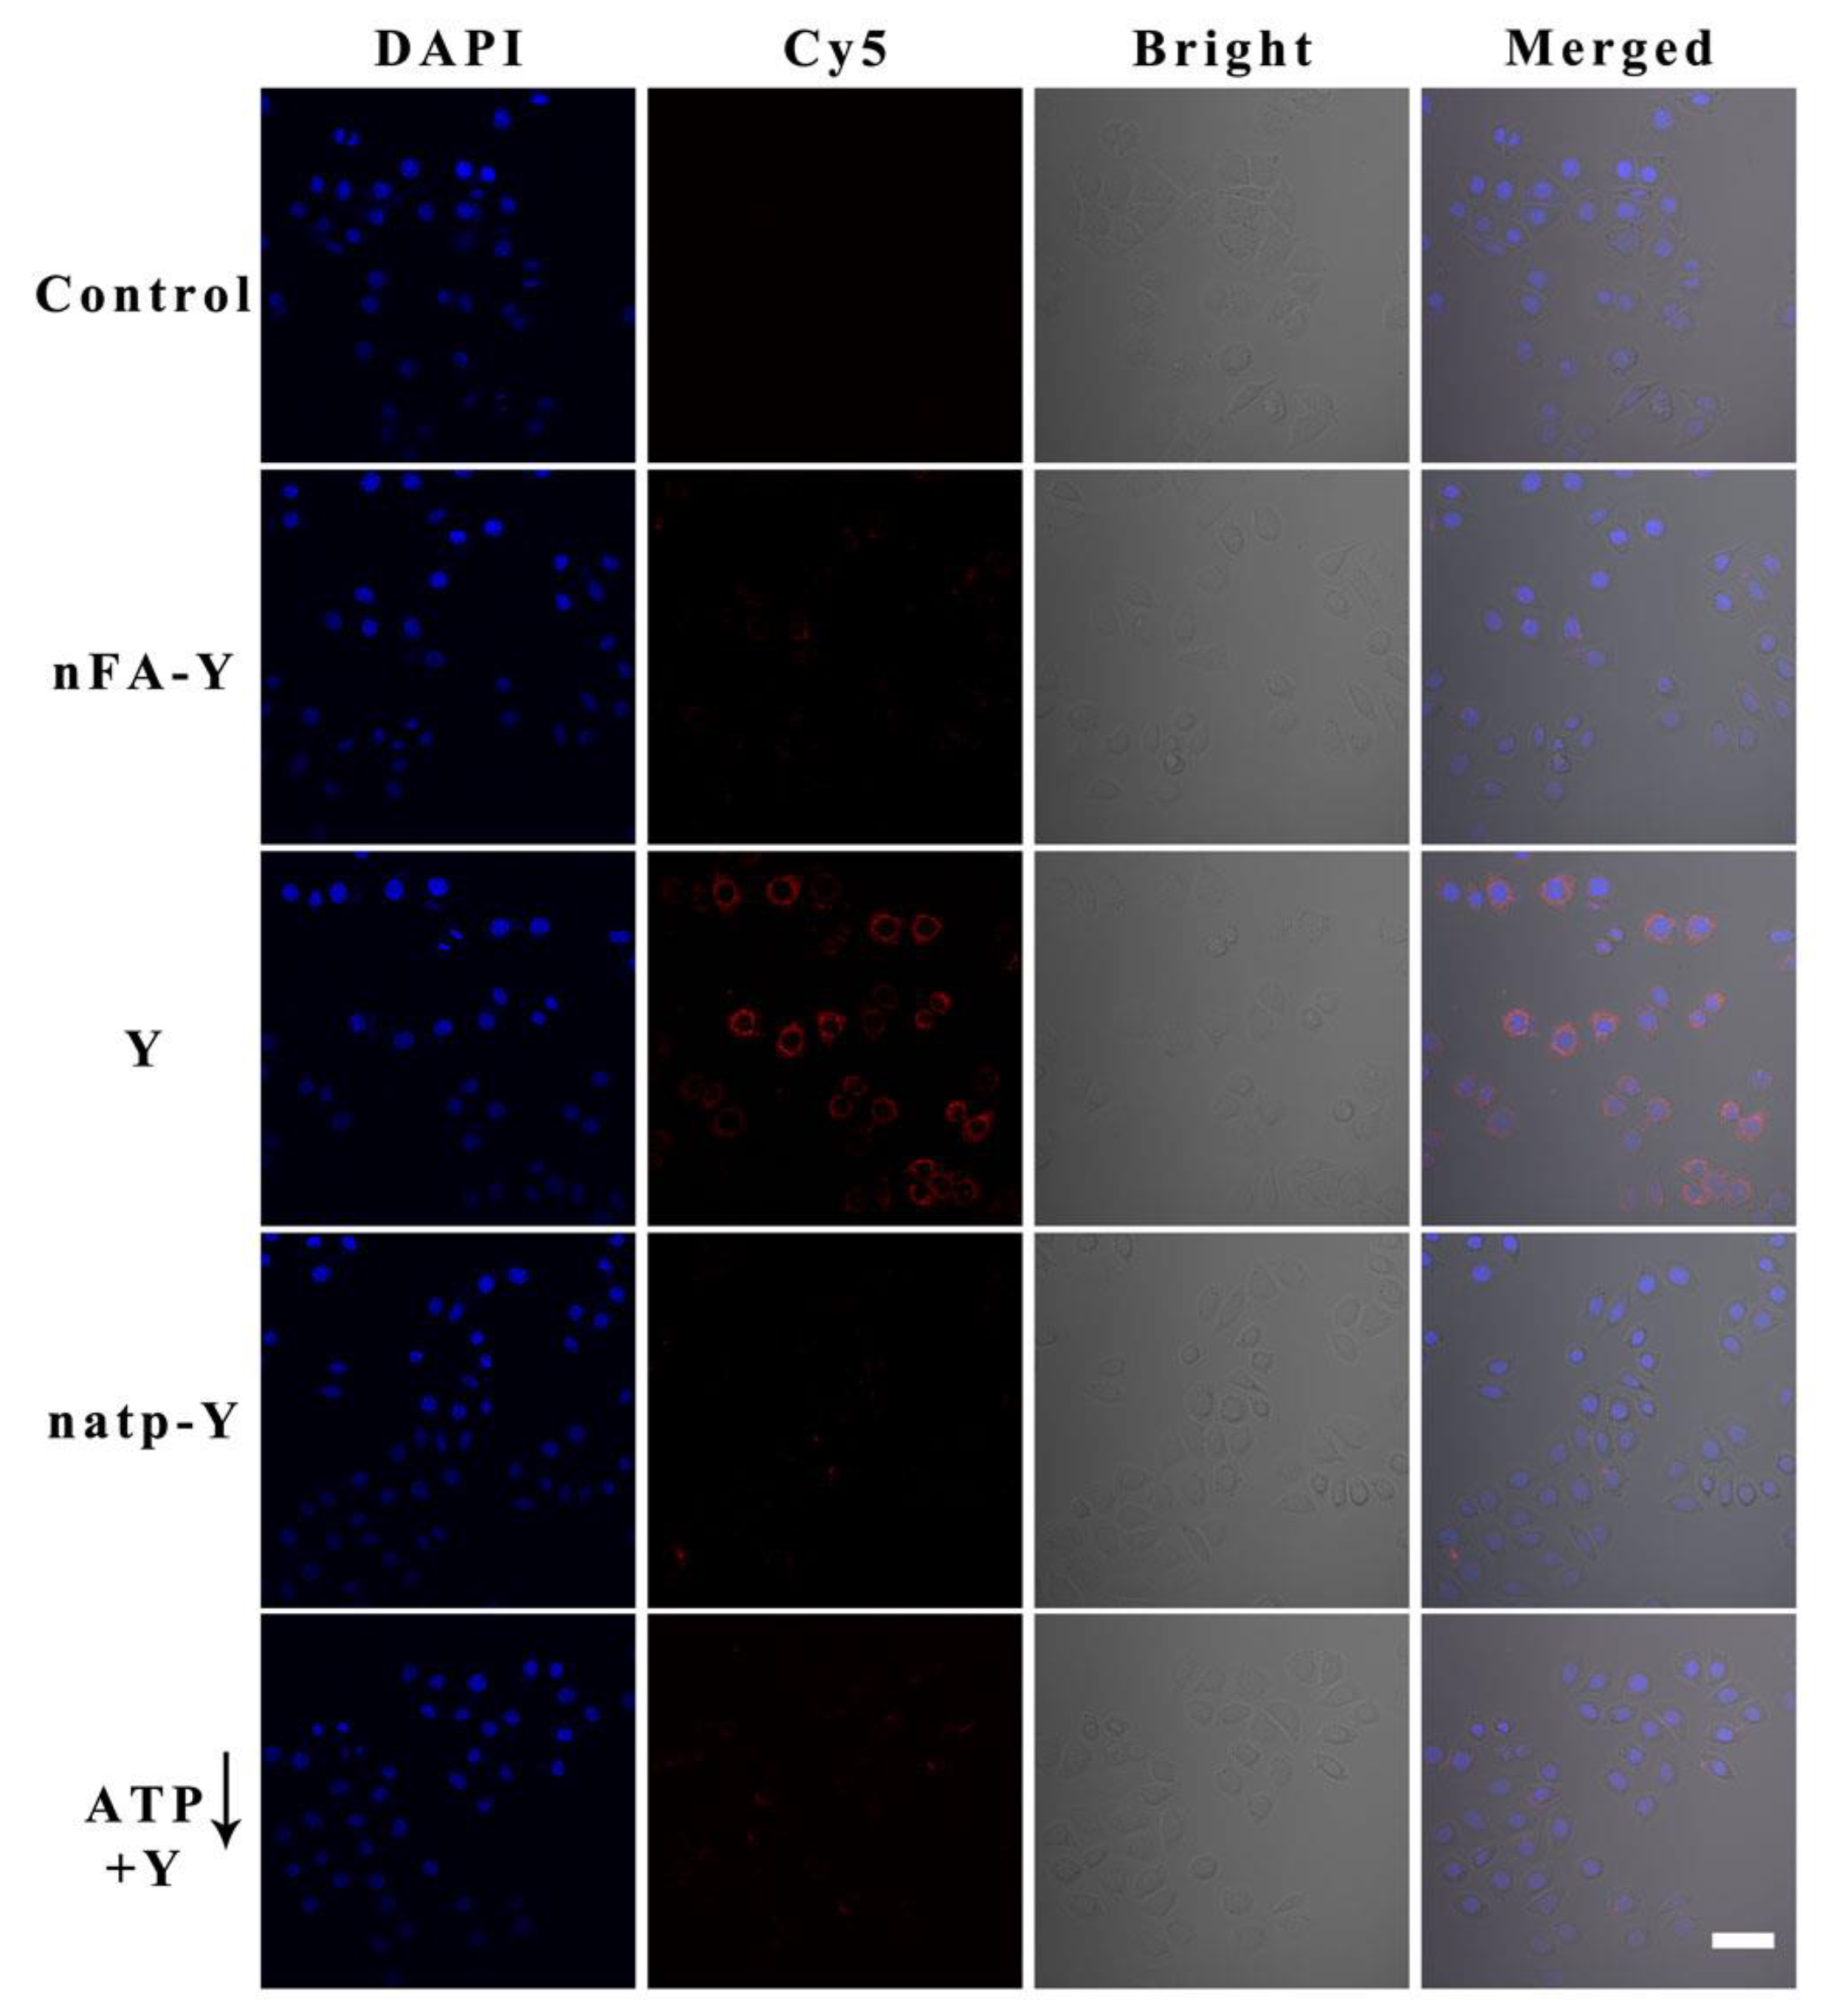
After demonstrating the biosafety, biostability, and cellular uptake ability, the applicability of the ATP-activated Y-DNA probe for miR-21 imaging in living cells was further studied. MCF-7 cells were separately incubated with the medium, Y-DNA probe, and Y-DNA probe without FA modification (nFA-Y) under identical conditions. As shown in Figure 4, an obvious fluorescence signal was measured for the Y-DNA probe group, suggesting that the Y-DNA probe has the potential for miRNA imaging in living cells. For comparison, the group of nFA-Y exhibited a weaker fluorescence intensity, which was attributed to the fact that FA enhanced the cellular delivery of the Y-DNA probe to FA-receptor-overexpressed cells. Next, we validated ATP-activated Y-DNA in living cells by utilizing oligomycin to downregulate ATP levels in MCF-7 cell lines. As expected, oligomycin-treated groups did not exhibit significant fluorescence in the cytoplasm, confirming the importance of ATP regulation. Moreover, a control Y-DNA sensor without an ATP recognition sequence (natp-Y) was also prepared to study the specificity of the ATP-activated Y-DNA probe, with the result showing that almost no signal was observed in MCF-7 cells with the incubation of natp-Y. These results suggest that the Y-DNA probe could be activated in a highly specific manner and could supplement a robust analysis tool for miRNA imaging in living cells.
Subsequently, the ability of the ATP-activated Y-DNA probe to image the expression level changes in miR-21 in cancer cells was tested. To change the expression pattern of miR-21, an miR-21 inhibitor (downregulation of miR-21) and an miR-21 analog (upregulation of miR-21) were selected to treat MCF-7 cells. As shown in Figure 5, minimal fluorescence was detected in anti-miR-21-inhibitor-pretreated MCF-7 cells compared with non-treated MCF-7 cells. For comparison, miR-21-analogue-pretreated MCF-7 cells displayed more significant fluorescent signals than non-treated MCF-7 cells. These results clearly confirm that the ATP-activated Y-DNA probe can accurately reflect the expression levels of target miRNAs inside living cells.
It is significant to differentiate cancer cells from normal cells in the early diagnosis of cancer. MCF-7 and L02 cell lines were incubated with Y-DNA to analyze the expression levels of miR-21 in order to distinguish normal cells and cancer cells. As a result, a strong Cy5 signal was observed in MCF-7 cells, whereas a negligible fluorescent signal was generated in L02 cells (Figure S7), which is consistent with previous reports that miR-21 is overexpressed in MCF-7 cells and underexpressed in L02 cells [30]. These results further demonstrate that the ATP-controlled strategy allowed for distinguishing cancer cells from normal cells.

4. Conclusions

In summary, we have developed an endogenously activated Y-DNA sensor for intracellular miRNA imaging through an intracellular ATP-modulated methodology. Y-DNA can be easily constructed by the self-assembly of three DNA sequences and allows for in vitro imaging of miRNA with excellent specificity. The Y-DNA sensor is activated by ATP and instantly lights up the fluorescence signal by reacting with the target miRNA. The quantitative assessment of miRNA level fluctuations in living cells upon inhibitor/mimic treatments suggests its feasibility in intracellular sensing of low-abundance targets. Compared with conventional nucleic acid probes, the ATP-activated Y-DNA sensor enables site-specific probe activation in specific live cells with high efficiency and avoids off-site signal leakage. Hence, this intracellular ATP regulation strategy provides a good opportunity to facilitate the application of DNA nanoprobes in selective live-cell imaging. This Y-DNA probe can also be customized for disease diagnostics by incorporating other endogenously specific molecule aptamers. Therefore, this work provides an impressive avenue for the accurate recognition of cancer cells and could contribute to the acquirement of deep insight into the molecular mechanisms of miRNA-related life processes.

Supplementary Materials

The following supporting information can be downloaded at: https://www.mdpi.com/article/10.3390/chemistry5030112/s1. Figure S1: Fluorescence dynamics of the Y-DNA to the miR-21 in the absence of ATP. Figure S2: Specificity of Y-DNA to ATP against other analogues (5 mM) in the presence of miR-21. Figure S3: Specificity investigation of the Y-DNA toward nonspecific substances. Figure S4: Cell viabilities of Hela, MCF-7 and L02 cells after incubating with different concentrations of Y-DNA. Figure S5: The PAGE test of Y-DNA after increasing the treatment time with 10% FBS. Figure S6: CLSM images of MCF-7 cells by incubating different time with Y-DNA. Figure S7: CLSM images of miR-21 in L02 and MCF-7 cells with Y-DNA. Table S1: Oligonucleotide sequences.

Author Contributions

Conceptualization, data curation, formal analysis, investigation, W.Z.; investigation, methodology, Y.Z.; visualization, L.H.; supervision, writing—review and editing, C.X. supervision, funding acquisition, writing—review and editing, C.L. All authors have read and agreed to the published version of the manuscript.

Funding

This research was funded by the National Key R&D Program of China (no.: 2018YFA0902600) and the National Natural Science Foundation of China (no.: 22174019).

Data Availability Statement

Data are available upon reasonable request from the authors.

Conflicts of Interest

The authors declare no conflict of interest.

References

  1. Xi, X.; Li, T.; Huang, Y.; Sun, J.; Zhu, Y.; Yang, Y.; Lu, Z.J. RNA Biomarkers: Frontier of Precision Medicine for Cancer. Noncoding RNA 2017, 3, 9. [Google Scholar]
  2. Vargas, A.J.; Harris, C.C. Biomarker development in the precision medicine era: Lung cancer as a case study. Nat. Rev. Cancer 2016, 16, 525–537. [Google Scholar] [PubMed]
  3. Bartel, D.P. MicroRNAs: Genomics, Biogenesis, Mechanism, and Function. Cell 2004, 116, 281–297. [Google Scholar] [PubMed] [Green Version]
  4. Croce, C.M. Causes and consequences of microRNA dysregulation in cancer. Nat. Rev. Genet. 2009, 10, 704–714. [Google Scholar] [PubMed]
  5. Ouyang, T.L.; Liu, Z.Y.; Han, Z.Y.; Ge, Q.Y. MicroRNA Detection Specificity: Recent Advances and Future Perspective. Anal. Chem. 2019, 91, 3179–3186. [Google Scholar] [PubMed] [Green Version]
  6. Gong, S.; Wang, X.; Zhou, P.; Pan, W.; Li, N.; Tang, B. AND Logic-Gate-Based CRISPR/Cas12a Biosensing Platform for the Sensitive Colorimetric Detection of Dual miRNAs. Anal. Chem. 2022, 94, 15839–15846. [Google Scholar]
  7. Kitte, S.A.; Bushira, F.A.; Xu, C.; Wang, Y.; Li, H.; Jin, Y. Plasmon-Enhanced Nitrogen Vacancy-Rich Carbon Nitride Electrochemiluminescence Aptasensor for Highly Sensitive Detection of miRNA. Anal. Chem. 2022, 94, 1406–1414. [Google Scholar] [CrossRef]
  8. Sun, Y.; Fang, L.; Han, Y.; Feng, A.; Liu, S.; Zhang, K.; Xu, J.J. Reversible Ratiometric Electrochemiluminescence Biosensor Based on DNAzyme Regulated Resonance Energy Transfer for Myocardial miRNA Detection. Anal. Chem. 2022, 94, 7035–7040. [Google Scholar]
  9. Liu, N.; Lu, H.; Liu, L.; Ni, W.; Yao, Q.; Zhang, G.J.; Yang, F. Ultrasensitive Exosomal MicroRNA Detection with a Supercharged DNA Framework Nanolabel. Anal. Chem. 2021, 93, 5917–5923. [Google Scholar] [CrossRef]
  10. Zhang, X.; Yang, Z.; Chang, Y.; Qing, M.; Yuan, R.; Chai, Y. Novel 2D-DNA-Nanoprobe-Mediated Enzyme-Free-Target-Recycling Amplification for the Ultrasensitive Electrochemical Detection of MicroRNA. Anal. Chem. 2018, 90, 9538–9544. [Google Scholar] [CrossRef]
  11. Xue, C.; Luo, M.; Wang, L.; Li, C.; Hu, S.; Yu, X.; Yuan, P.; Wu, Z.S. Stimuli-Responsive Autonomous-Motion Molecular Machine for Sensitive Simultaneous Fluorescence Imaging of Intracellular MicroRNAs. Anal. Chem. 2021, 93, 9869–9877. [Google Scholar]
  12. He, L.; Lu, D.Q.; Liang, H.; Xie, S.T.; Luo, C.; Hu, M.M.; Xu, L.J.; Zhang, X.B.; Tan, W.H. Fluorescence Resonance Energy Transfer-Based DNA Tetrahedron Nanotweezer for Highly Reliable Detection of Tumor-Related mRNA in Living Cells. Acs Nano 2017, 11, 4060–4066. [Google Scholar] [CrossRef] [Green Version]
  13. Tang, J.; Li, Q.; Yao, C.; Yang, D. DNA Nanomaterial-Based Optical Probes for Exosomal miRNA Detection. Chempluschem 2023, 88, e202200345. [Google Scholar] [CrossRef]
  14. Li, J.; Wang, W.; Zhang, H.; Lu, Z.; Wu, W.; Shu, M.; Han, H. Programmable DNA Tweezer-Actuated SERS Probe for the Sensitive Detection of AFB(1). Anal. Chem. 2020, 92, 4900–4907. [Google Scholar] [CrossRef]
  15. Ebrahimi, S.B.; Samanta, D.; Partridge, B.E.; Kusmierz, C.D.; Cheng, H.F.; Grigorescu, A.A.; Chavez, J.L.; Mirau, P.A.; Mirkin, C.A. Programming Fluorogenic DNA Probes for Rapid Detection of Steroids. Angew. Chem. Int. Ed. 2021, 60, 15260–15265. [Google Scholar] [CrossRef]
  16. Wei, Q.M.; Huang, J.; Li, J.; Wang, J.L.; Yang, X.H.; Liu, J.B.; Wang, K.M. A DNA nanowire based localized catalytic hairpin assembly reaction for microRNA imaging in live cells. Chem. Sci. 2018, 9, 7802–7808. [Google Scholar]
  17. Liu, L.; Rong, Q.M.; Ke, G.L.; Zhang, M.; Li, J.; Li, Y.Q.; Liu, Y.C.; Chen, M.; Zhang, X.B. Efficient and Reliable MicroRNA Imaging in Living Cells via a FRET-Based Localized Hairpin-DNA Cascade Amplifier. Anal. Chem. 2019, 91, 3675–3680. [Google Scholar] [CrossRef] [PubMed]
  18. Wu, Z.; Liu, G.Q.; Yang, X.L.; Jiang, J.H. Electrostatic nucleic acid nanoassembly enables hybridization chain reaction in living cells for ultrasensitive mRNA imaging. J. Am. Chem. Soc. 2015, 137, 6829–6836. [Google Scholar] [PubMed]
  19. Xue, C.; Zhang, S.X.; Ouyang, C.H.; Chang, D.; Salena, B.J.; Li, Y.; Wu, Z.S. Target-Induced Catalytic Assembly of Y-Shaped DNA and Its Application for In Situ Imaging of MicroRNAs. Angew. Chem. Int. Ed. 2018, 57, 9739–9743. [Google Scholar] [CrossRef] [PubMed]
  20. Wang, K.M.; Tang, Z.W.; Yang CY, J.; Kim, Y.M.; Fang, X.H.; Li, W.; Wu, Y.R.; Medley, C.D.; Cao, Z.H.; Li, J.; et al. Molecular Engineering of DNA: Molecular Beacons. Angew. Chem. Int. Ed. 2009, 48, 856–870. [Google Scholar]
  21. He, L.; Lu, D.Q.; Liang, H.; Xie, S.T.; Zhang, X.B.; Liu, O.L.; Yuan, Q.; Tan, W.H. mRNA-Initiated, Three-Dimensional DNA Amplifier Able to Function inside Living Cells. J. Am. Chem. Soc. 2018, 140, 258–263. [Google Scholar] [CrossRef]
  22. Duan, Z.; Tan, L.; Duan, R.; Chen, M.; Xia, F.; Huang, F. Photoactivated Biosensing Process for Dictated ATP Detection in Single Living Cells. Anal. Chem. 2021, 93, 11547–11556. [Google Scholar] [CrossRef]
  23. Shao, Y.; Zhao, J.; Yuan, J.; Zhao, Y.; Li, L. Organelle-Specific Photoactivation of DNA Nanosensors for Precise Profiling of Subcellular Enzymatic Activity. Angew. Chem. Int. Ed. 2021, 60, 8923–8931. [Google Scholar]
  24. Zhao, X.X.; Zhang, L.L.; Gao, W.Y.; Yu, X.L.; Gu, W.; Fu, W.L.; Luo, Y. Spatiotemporally Controllable MicroRNA Imaging in Living Cells via a Near-Infrared Light-Activated Nanoprobe. ACS Appl. Mater. Interfaces 2020, 12, 35958–35966. [Google Scholar] [CrossRef]
  25. Meng, X.; Wang, H.; Yang, M.; Li, J.; Yang, F.; Zhang, K.; Dong, H.; Zhang, X. Target-Cell-Specific Bioorthogonal and Endogenous ATP Control of Signal Amplification for Intracellular MicroRNA Imaging. Anal. Chem. 2021, 93, 1693–1701. [Google Scholar]
  26. Mo, R.; Jiang, T.; Gu, Z. Enhanced anticancer efficacy by ATP-mediated liposomal drug delivery. Angew. Chem. Int. Ed. 2014, 53, 5815–5820. [Google Scholar]
  27. Meng, X.; Dai, W.; Zhang, K.; Dong, H.; Zhang, X. Imaging multiple microRNAs in living cells using ATP self-powered strand-displacement cascade amplification. Chem. Sci. 2018, 9, 1184–1190. [Google Scholar]
  28. Wu, H.; Chen, T.T.; Wang, X.N.; Ke, Y.; Jiang, J.H. RNA imaging in living mice enabled by an in vivo hybridization chain reaction circuit with a tripartite DNA probe. Chem. Sci. 2020, 11, 62–69. [Google Scholar]
  29. Ren, K.; Xu, Y.; Liu, Y.; Yang, M.; Ju, H. A Responsive “Nano String Light” for Highly Efficient mRNA Imaging in Living Cells via Accelerated DNA Cascade Reaction. ACS Nano 2018, 12, 263–271. [Google Scholar]
  30. Wan, Y.; Li, G.; Zou, L.; Wang, H.; Wang, Q.; Tan, K.; Liu, X.; Wang, F. A Deoxyribozyme-Initiated Self-Catalytic DNA Machine for Amplified Live-Cell Imaging of MicroRNA. Anal. Chem. 2021, 93, 11052–11059. [Google Scholar] [CrossRef]
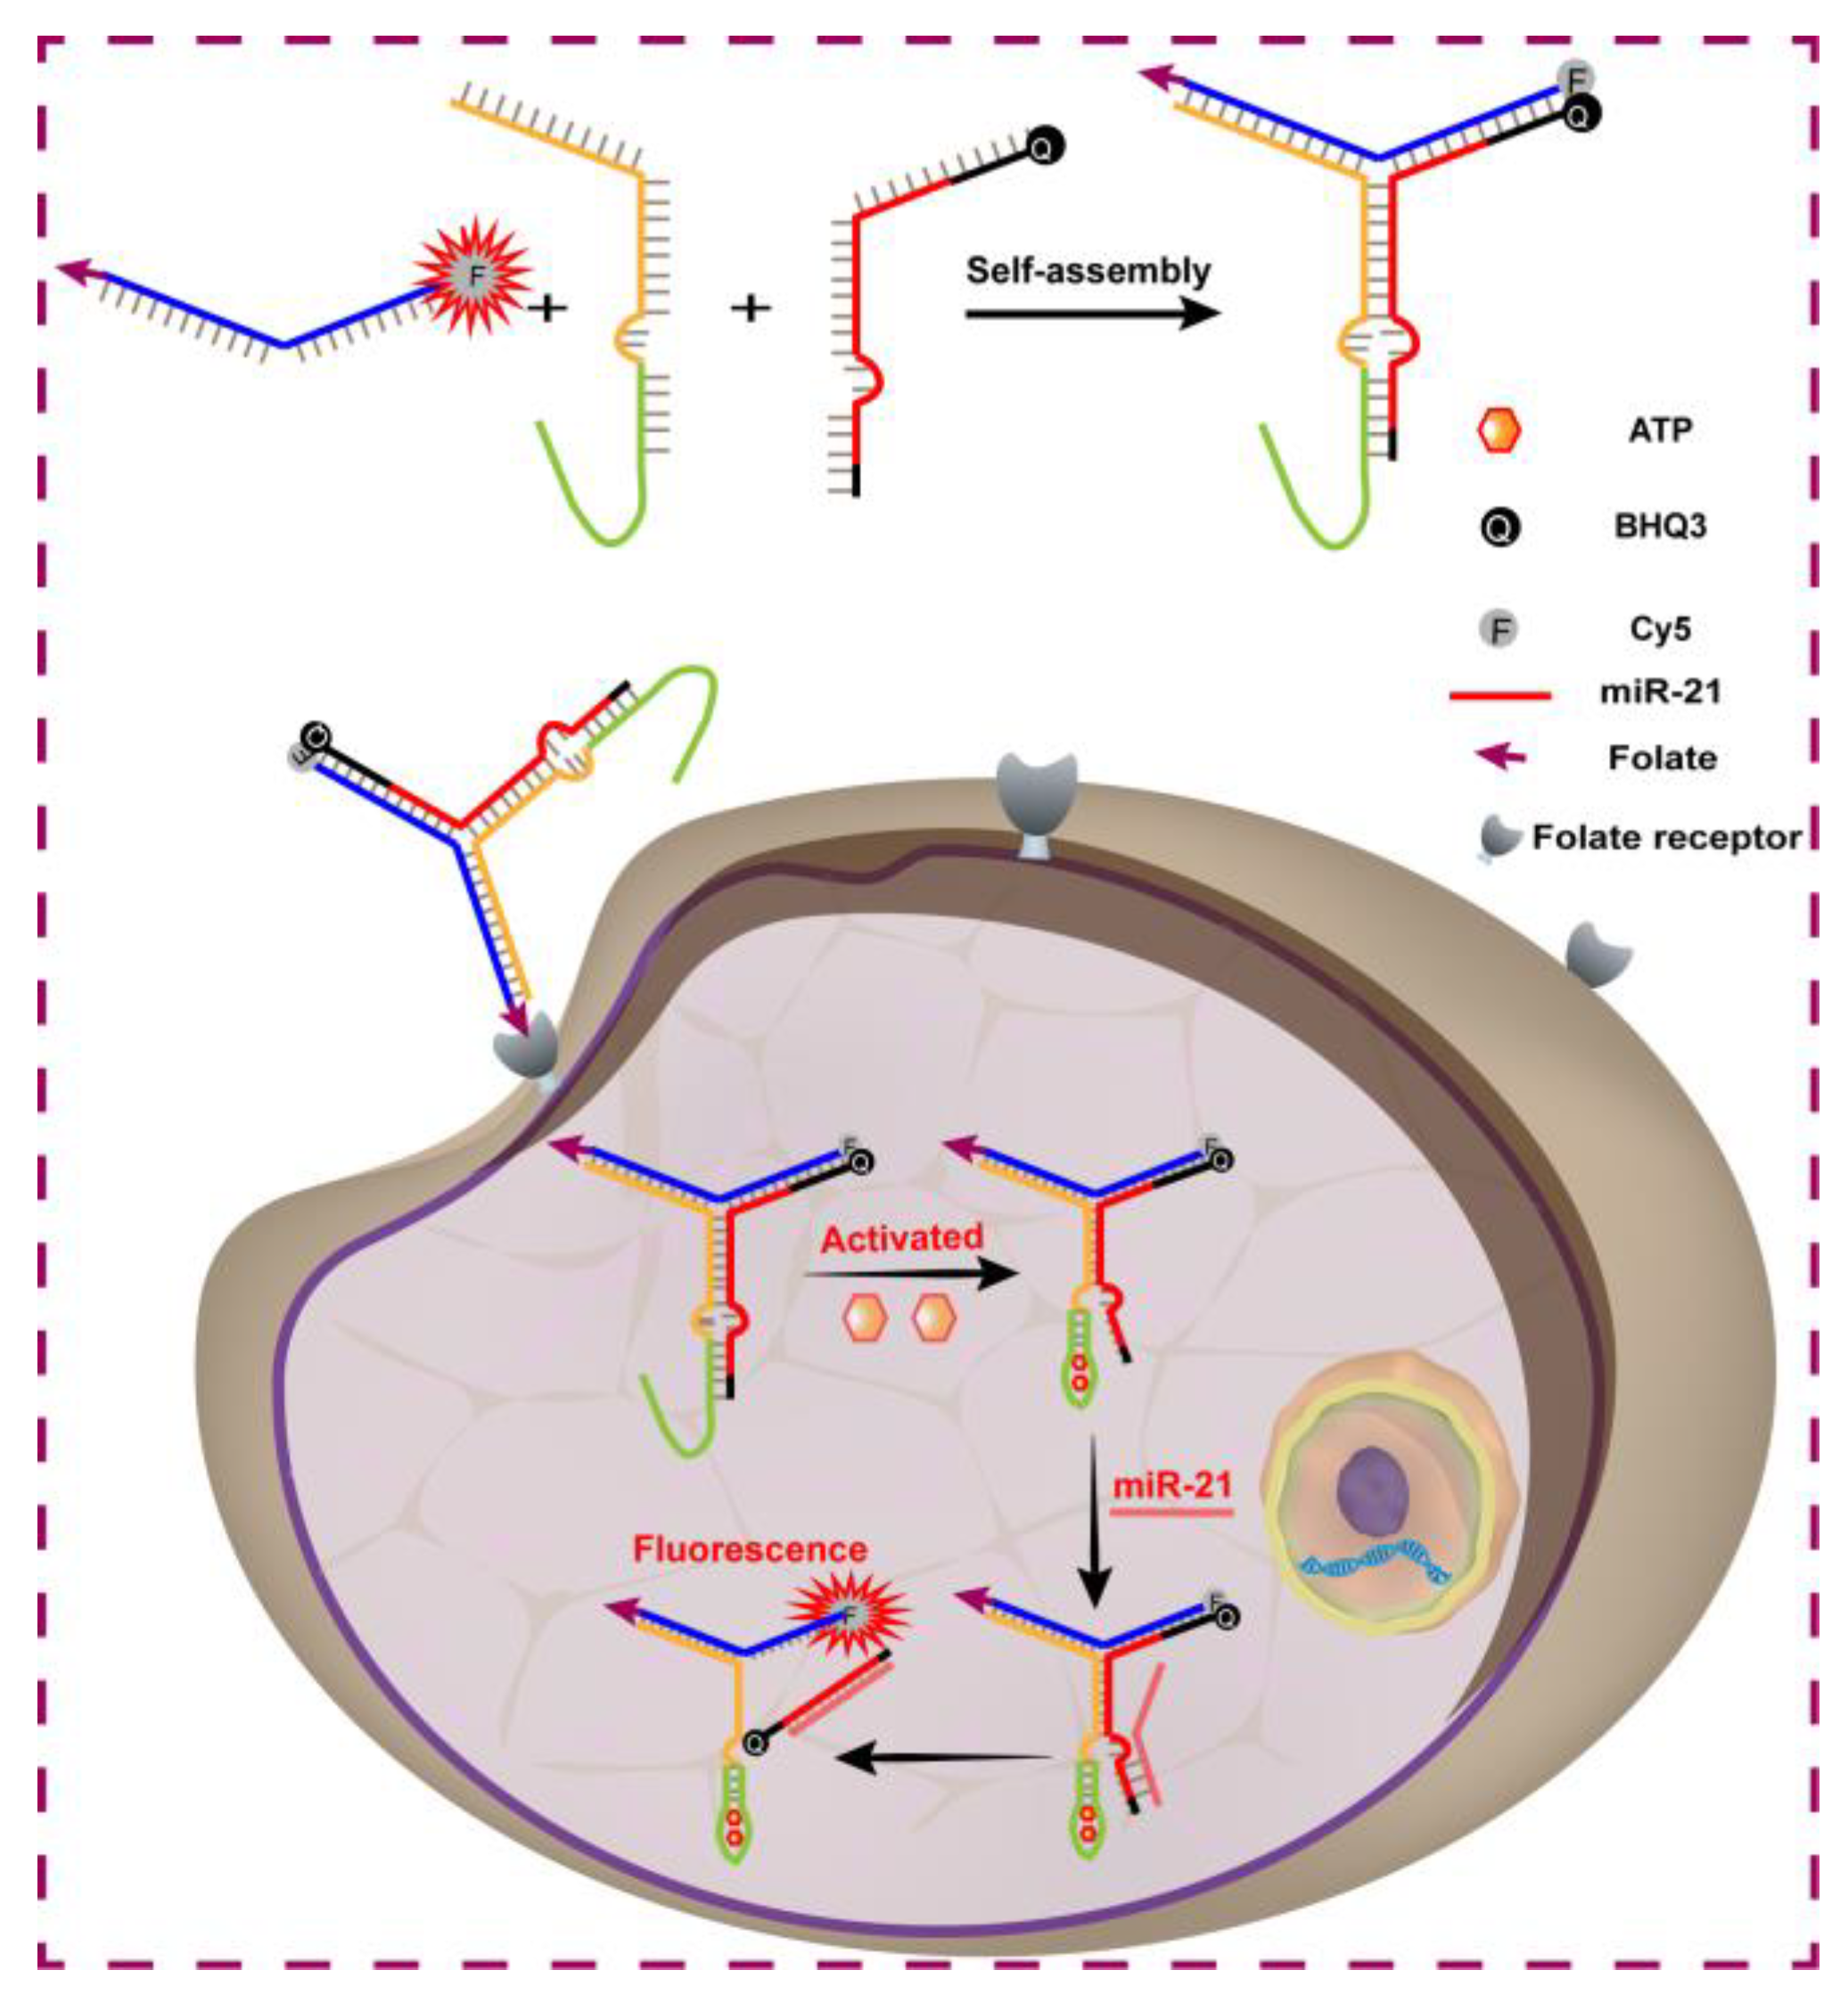
Scheme 1. Scheme of the ATP-activated Y-DNA probe for miRNA sensing in living cells. Once Y-DNA is internalized into the cells based on caveolar-mediated endocytosis, ATP activates Y-DNA by binding with ATP aptamer, exposing the toehold for the recognition of target miRNA. Subsequently, target miR-21 hybridizes with Y1 and leads to the dissociation of Y-DNA, generating a fluorescence enhancement for miRNA imaging.
Chemistry 05 00112 sch001
Figure 1. (A) Verification of the formation of Y-DNA via 3% AGE test. Lane 1: Y1, Lane 2: Y2, Lane 3: Y3, Lane 4: Y1 + Y2, Lane 5: Y1 + Y3, Lane 6: Y2 + Y3, Lane 7: Y1 + Y2 + Y3. (B) Dependence of the Y-DNA-supported probe on ATP and miR-21. (C) The 12% PAGE test of the reaction in Scheme 1. Lane 1: Y1/Y2, Lane 2: Y3 + miR-21, Lane 3: Y1/Y2 + ATP, Lane 4: Y2 + ATP + miR-21, Lane 5: Y + ATP, Lane 6: Y + miR-21, Lane 7: Y + ATP + miR-21.
Chemistry 05 00112 g001
Figure 2. Optimization of experimental conditions: (A) the reaction temperatures (with 5 mM ATP) and (B) the concentrations of ATP (with 37 °C) for the detection of miR-21 (8 nM). The data error bars indicate means ± SD (n = 3).
Chemistry 05 00112 g002
Figure 3. (A) Restoration of Cy5 fluorescence under the addition of different amounts of targets. (B) Scatter diagram between the fluorescence intensity and miR-21 concentrations (from 0 to 100 nM). Inset: linear relationship between the fluorescence intensity and miR-21 concentrations (from 0.2 nM to 8 nM). The data error bars indicate means ± SD (n = 3).
Chemistry 05 00112 g003
Figure 4. Confocal microscopy of miR-21 in routine MCF-7 cells using 100 nM Y-DNA probe without FA modification (nFA-Y DNA), routine MCF-7 cells using 100 nM Y-DNA, routine MCF-7 cells using 100 nM Y-DNA sensor without ATP recognition sequence (natp-Y DNA), and oligomycin-pretreated MCF-7 cells using 100 nM Y-DNA. The fluorescence channel of Cy5 was collected by using an excitation of 650 nm. The scale bar is 50 μm.
Chemistry 05 00112 g004
Figure 5. Confocal microscopic imaging of MCF-7 cells upregulated (miRNA-21 mimics) or downregulated (antisense miRNA-21) and detected by Y-DNA probe. The scale bar is 50 μm.
Chemistry 05 00112 g005
Disclaimer/Publisher’s Note: The statements, opinions and data contained in all publications are solely those of the individual author(s) and contributor(s) and not of MDPI and/or the editor(s). MDPI and/or the editor(s) disclaim responsibility for any injury to people or property resulting from any ideas, methods, instructions or products referred to in the content.