Abstract
The aim of this study was to investigate 30 different types of Dalmatian wines as a potential source of fluoride. A fluoride ion selective electrode was used to measure the fluoride concentration in each sample. The direct potentiometric method and the standard addition method were evaluated, the latter being suggested as more accurate and precise. Measurements were performed in two buffers, acetate buffer and total ionic strength adjustment buffer (TISAB), to compare their influence on fluoride determination. The obtained results show that TISAB is a better choice than acetate buffer as a medium for fluoride determination. According to the proposed method, mass concentrations of fluoride of 0.19 and 0.18 mg/L were found in the studied red and white wines, with standard deviations of 0.04 and 0.03 mg/L, respectively. All determined fluorine levels in the tested wines were within the recommended limits and do not pose a risk to human health. No significant difference was found between the fluorine content in white and red wines, but there was a difference depending on the place of origin of the wine. The measured pH values for all the wines studied (except one sample) are very similar and show no significant correlation with the fluoride content.
1. Introduction
Fluoride is the inorganic anion of fluorine, the thirteenth most abundant element in the earth’s crust [1], constituting 0.065% by weight [2]. It is an inevitable component of the biosphere and human life. As the most chemically reactive of all elements in the periodic table, it has a strong affinity for some of the most abundant elements on our planet, such as Si, Al, Ca, and Mg [1]. Therefore, it never or rarely occurs in the environment in elemental form (electron configuration of fluorine 1s2 2s2 2p5), but in combination with other elements such as fluoride compounds [3].
Its effects on health are significant. It is considered one of the essential elements that should be taken for health [4,5]. For more than eight decades, it has been observed that small amounts of fluoride have a beneficial effect on the prevention of dental caries [6], activation of enzymes (adenylate cyclase, alkaline and acid phosphatases, and isocitrate dehydrogenase) [7], bone health, and so on. This has led to fluoride being widely used in public health practice. However, the effect of fluoride on humans is twofold. For example, prolonged exposure to high fluoride concentrations causes it to be incorporated not only into tooth enamel, but also into bones, making them more brittle and prone to cracking (bone fluorosis) [3]. High fluoride concentrations also act as a direct cytotoxin by binding to calcium and other cations important for homeostasis [8]. The negative effect of fluoride ions is also reflected in the increase in oxidative stress, lipid peroxidation, and decrease in the activity of antioxidant enzymes such as superoxide dismutase, catalase, and glutathione peroxidase, i.e., fluoride ions can act as an enzyme inhibitor, disrupting cellular respiration and decreasing ATP production [3]. Similarly, in same severe cases ingested fluoride can cause respiratory paralysis and death [7]. In addition, high fluoride concentration in childhood is associated with a decrease in intelligence [9], which is why some authors place it in the same category of harmful elements as lead, arsenic, and mercury [10].
For this very reason, one should be very careful with the intake of fluoride, because there is almost no food, drink or dental care product that does not contain fluoride [11]. Various authorized agencies and organizations dealing with public health issues worldwide have agreed to recommend daily intake of up to 3–4 mg of fluoride per adult, with the maximum recommended fluoride intake not exceeding 10 mg per day [4,6]. In addition, fluorides are commonly found in wines and their concentrations vary widely from the lowest [7,11] to extremely high and dangerous to humans [6,12].
The interest of the scientific community and the importance of fluoride determination is best illustrated (besides the number of existing [13,14,15,16,17,18,19]) by the development and publication of instrumental methods in recent years based on the following techniques: Gas chromatography-mass spectrometry [20], inductively coupled plasma mass spectrometry [21,22], molecular absorption spectrometry [23,24], spectrophotometry [25], ion chromatography [26], high-resolution continuum source graphite furnace atomic absorption spectrometry [27], etc. Unlike these enumerated techniques, potentiometry (one of the nondestructive techniques of electrochemical analysis based on the measurement of the potential difference under equilibrium conditions between the reference and the indicator electrodes) does not require expensive equipment, elaborate and complex sample pretreatment steps, and authorized skilled personnel. Moreover, potentiometry is widely used due to its adaptability and ease of performance and handling. Ion-selective electrodes (ISEs), as one of the indicator electrodes in potentiometry, generate a potential difference according to the Nernst equation. Their great advantage is that they respond rapidly to the slightest change in the concentration of free ions of a given species. The fluoride ion-selective electrode (FISE) is still considered to be the most widely used of all ISEs because it rapidly provides accurate results on the fluoride concentration in the test solution [9,28,29,30].
The aim of this study was to determine the fluoride concentration in 30 different wine samples from 10 different Dalmatian areas using the commercial FISE and to compare the fluoride content of the wine with each other and with wine worldwide. A statistical comparison of the precision and accuracy of the fluoride concentration determined by direct potentiometry and the recently proposed standard addition method [31] in the two buffers studied was performed, as well as the statistical significance of the agreement (correlation) of the fluoride concentrations obtained with the pH values measured.
2. Materials and Methods
2.1. Chemicals and Solutions
All chemicals used were of analytical reagent grade. Double distilled water was used for the experiments. Sodium fluoride, glacial acetic acid, ethylenediaminetetraacetic acid (EDTA), sodium hydroxide anhydrous and potassium nitrate were obtained from Kemika (Zagreb, Croatia). Sodium chloride and sodium acetate trihydrate were purchased from Merck (Darmstadt, Germany).
To prepare total ionic strength adjusting buffer (TISAB), 29.0 g NaCl, 18.5 g NaOH and 28.5 mL glacial acetic acid were first added to 150 mL of a 0.1 mol/L EDTA solution. The pH of the prepared solution was then adjusted to 5.5 by adding small amounts of 5.0 mol/L acetic acid solution. The prepared solution was thoroughly transferred to a 500 mL volumetric flask and made up to the mark with distilled water to prepare TISAB. Finally, the TISAB dilution solution (TISAB_DS) was prepared by mixing the same volume of TISAB and double distilled water.
The acetate buffer pH 5.5 was prepared by mixing 154.0 mL of 0.1 mol/L acetic acid solution and 846.0 mL of 0.1 mol/L sodium acetate solution. The dilute acetate buffer solution (AcB_DS) was prepared by mixing the same volumes of acetate buffer with 0.01 mol/L potassium nitrate solution.
The fluoride ion standard solution (0.1000 mol/L) was prepared by dissolving 0.2100 g of sodium fluoride (in 50.0 mL of TISAB_DS, i.e., AcB_DS), which was previously oven-dried at 110 °C for 2 h and then cooled in a desiccator at room temperature.
2.2. Wine Samples
Each of aliquot for fluoride determination was made by adding 5.0 mL of the wine sample to a 50.0 mL volumetric flask and filling up to the mark with TISAB_DS, i.e., AcB_DS. Aliquots were transferred to the electrochemical cell to perform potentiometric measurements.
2.3. Apparatus
Potentiometric measurements were carried out by using milivoltmeter model Seven Easy (Mettler Toledo, GmbH, Schwerzenbach, Switzerland). As an indicator electrode was used the combined FISE (model perfectIONTM combination F-, P/N 51344715, Mettler Toledo, GmbH, Greifensee, Switzerland). EcoStir (DLAB Scientific Co., Ltd., Beijing, China) was used as magnetic stirrer. An electrode InLab Expert Pro (P/N 51343101, Mettler Toledo GmbH, Greifensee, Switzerland) was used to measure pH.
2.4. Potentiometric Measurenments
The responses in the fluoride ion standard solutions are shown in Figure 1. The slopes of the constructed calibration curves were 54.4 and 56.2 mV/decade within the linear dynamic range of 6.3 × 10⁻⁶ ie, 1.6 × 10⁻⁶ to 1.0 × 10⁻¹ mol/L for the measurements performed in AcB_DS, ie, TISAB_DS. The linearity (R2) was also acceptable (0.9985 and 0.9971).
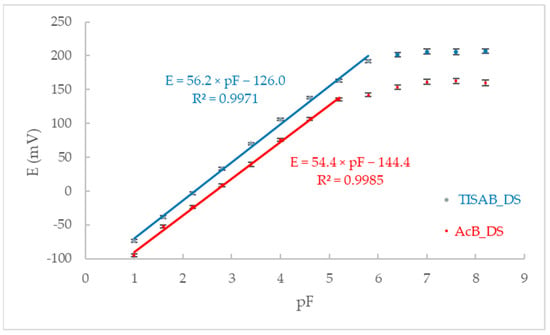
Figure 1.
Calibration curves for fluoride ions in experiments performed in AcB_DS and TISAB_DS using commercial FISE.
For direct potentiometry, the fluoride concentration in the aliquot () was first calculated using the Nernst equation
where E is the value of the potential read from the potentiometer, E′ is a conditional standard cell potential, S is the slope of the calibration curve, while pF is the negative logarithm of the fluoride ion concentration.
The equation
was used to calculate the mass concentration of fluoride ions in the wine sample ().
In the standard addition method, small volumes of the 0.001 mol/L standard solution of sodium fluoride were added successively to each of the prepared aliquots and the potential was recorded. The obtained experimental values were recalculated according to a recently published works [31,32], where the expressions and are denoted as the x-axis and y-axis of the equation of a straight line, respectively. The concentration and the sum of increments of the sodium fluoride standard solution were and , while the initial volume of the tested aliquot, the difference of recorded potentials after each increment of the standard solution, and the slope of the calibration curve were denoted by and , respectively. The intersection of the x-axis of the obtained graph represented a negative value of the fluoride concentration in the tested aliquots (). An example of the application of the proposed standard addition method is shown in Figure 2.
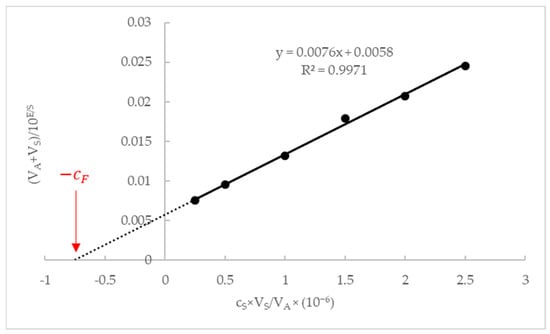
Figure 2.
Graph of the proposed standard addition method application for fluoride determination in wine sample aliquot R9.
Finally, the mass concentration of fluoride ions in the wine sample () was calculated using the following equation.
Since the procedure for preparing the aliquot is identical, the factor by which the fluoride concentration in the aliquot is multiplied is identical for direct potentiometry and for the standard addition method.
All determinations of fluoride content were performed in five replicates and data were reported as mean ± relative standard deviations for each method.
2.5. Statistical Analysis
For statistical analysis, one-way ANOVA method, Tukey’s multiple comparison test, and Pearson test were used using GraphPad Prism 7.0 statistical software (San Diego, CA, USA). The significance level was set at least at p < 0.05.
3. Results and Discussion
A total of 30 wine samples were analyzed: 18 red wine samples (15 with protected designation of origin) and 12 white wine samples (6 with protected designation of origin), obtained from different grape varieties from different areas of Dalmatia.
In the first phase of the research, the influence of the composition of the solution on the FISE response was studied by direct potentiometry. Since some groups of authors used acetate buffer [33,34] while others suggested TISAB as optimal for fluoride determination [35,36,37], both were investigated in this study by comparing their influence on fluoride determination. Evaluation of the direct potentiometry method and the standard addition method in the determination of fluoride was also performed. The pH of each wine sample was measured and the results obtained are summarized in Table 1.

Table 1.
A list of wine varieties, regions of origin, pH values and fluoride contents determined by direct potentiometry and the standard addition method in TISAB_DS, i.e., AcB_DS.
3.1. Buffer Influence in Fluoride Determination
Therefore, fluorides were first determined by the direct potentiometry method to determine the choice of buffer solution. As can be seen from Table 1 (a-b denote), the one-way ANOVA method and Tukey’s multiple comparisons test showed statistical significance (p < 0.05) for fluoride determination between the direct potentiometry method in the diluted acetate buffer solution (dp-AcB_DS) and the direct potentiometry method in the TISAB dilution solution (dp-TISAB_DS). The results obtained show that TISAB is a better choice as a medium for fluoride determination in wines compared to acetate buffer. This is also evident from the calibration curve (Figure 1) and even more so from the comparison of the fluoride content obtained when calculating the results of the dp-AcB_DS and dp-TISAB_DS used, which were 9.5% and 5.4%, respectively (Figure 3).
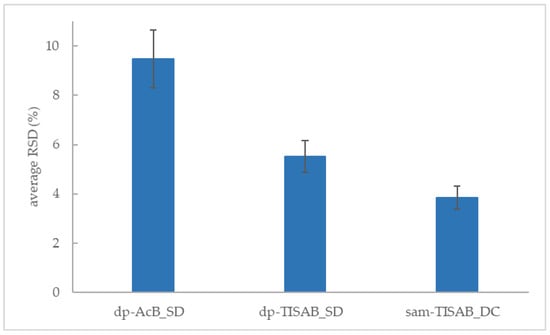
Figure 3.
Graphical description of the method’s accuracy expressed using mean values of RSD in fluoride determination in wine samples.
This is consistent with the conclusions of numerous groups of authors proposing TISAB as the optimal buffer for fluoride determination [35,36,37]. Additionally, the higher values of fluoride concentration in the tested wine samples obtained with dp-TISAB_DS (0.19 mg/L) compared to the results obtained with dp-AcB_DS (0.16 mg/L) are logically due to chelation [36].
3.2. Method Evaluation
A statistical comparison was also made between the results obtained with dp-TISAB_DS, i.e., with the standard addition method in the TISAB dilution solution (sam-TISAB_DS) using Pearson’s correlation analysis. It showed a positive significant correlation between the fluoride content determined by these two methods (r = 0.98, p < 0.0001, Figure 4).
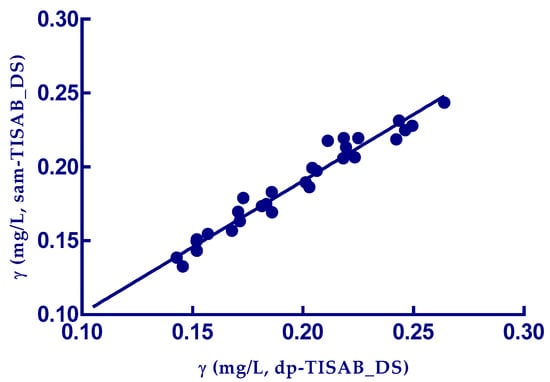
Figure 4.
Pearson’s correlation analysis between the fluoride content in various kinds of white and red wines obtained using dp-TISAB_DS and sam-TISAB_DS (p < 0.0001).
However, considering that the average values of RSD of direct potentiometry (5.51%) are 43.1% higher than those of the standard addition method (3.85%), it is clear that the latter provides more accurate and precise results (Figure 3). As such, it can be proposed for the determination of fluoride. The different mean values for fluoride concentration obtained with dp-AcB_DS or sam-TISAB_DS are due to the fact that the fluoride concentrations in the wines are at the sensitivity limit of the electrode and it was expected that the addition of standards would be more precise and therefore more accurate due to the shift in the sensitivity limit.
From all the obtained results and their statistical processing, it is clear that the most repeatable values of fluoride mass concentrations are those obtained with the proposed sam-TISAB_DS. Therefore, on the basis of these values, a further breakdown of the results of the mass concentration of fluoride in the wines of the Dalmatian region was performed, as well as a comparison with the fluoride content in wines around the world.
3.3. Fluoride Content in Wine Samples
According to the proposed method, the mass concentration of fluoride in the studied red wines ranges from 0.10 to 0.24 mg/L (mean value 0.19 ± 0.04 mg/L), while the fluoride concentration in white wines ranges from 0.13 to 0.23 mg/L with a mean value of 0.18 ± 0.03 mg/L.
Since there was no difference between the fluoride contests in the tested red and white wines, Figure 5 shows the average fluoride content from 10 different Dalmatian areas.
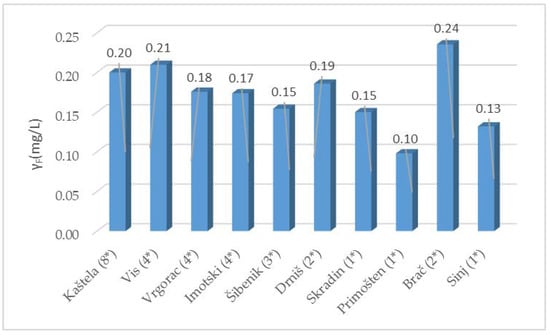
Figure 5.
Mean mass concentration of fluoride depending on the vineyard origin; (*) number of different tested wine samples.
The samples from Kaštela, Brač and Vis have the highest average fluoride concentration, while the sample from Primošten has the lowest. It is known that, on the Central Dalmatian islands, the pesticide cryolite used to be used even excessively to protect vineyards. However, until recently, a significant part of the industry of the entire country was located in the area of Kaštela. Thus, it can be assumed that for this reason slightly higher fluoride levels were found in the wines (in comparison with other wines from the Dalmatian region studied in this study) on the islands of Brač and Vis, as well as in Kaštela, without taking into account the geological origin of the vineyards.
In the literature, it was found that fluoride concentrations in wines from the USA or Europe, determined by the standard addition method in 12 different certified laboratories, ranged from 0.12 to 3.08 mg/L [12]. Similarly, a group of authors comparing their results with a number of results from the literature confirmed that the mass concentrations of fluoride in wines from different regions of the world ranged from 0.12 to 2.02 mg/L [6], which is significantly higher than the values obtained from wines from Dalmatia. The results of fluoride content of all 30 tested wines from Dalmatia are particularly interesting, as none of the analyzed wines exceeds the fluoride limit of 1 mg/L recommended by the International Organization of Vine and Wine. This means that all tested wines meet the criteria in terms of fluoride concentration. Studies on 50 different wine samples from the Canary Islands (the fluoride content ranges from 0.07 to 0.22 mg/L, if two wine samples are excluded) [11] confirm that the relatively low values of the fluoride content of Dalmatian wines are not exceptional.
Since small changes in pH significantly affect the sensory characteristics and stability of wine [38,39], in this work the pH of wine samples studied was determined. If the pH of sample W5 (Rukatac, Vrgorac) was disregarded, which is significantly different from all Dalmatian white and red wines studied, significant difference in pH values was found between none of them. The highest pH of 3.84 was measured in the red wine of the Babica variety from the Kaštela area, while the lowest pH of 1.98 was measured in the white wine of the Rukatac variety from the Vrgorac area. The average pH of all wines was 3.43 ± 0.34. As can be seen from Figure 6, Pearson’s correlation analysis showed that there is no significant correlation between pH and fluoride content in the tested wine samples (r = 0.04).
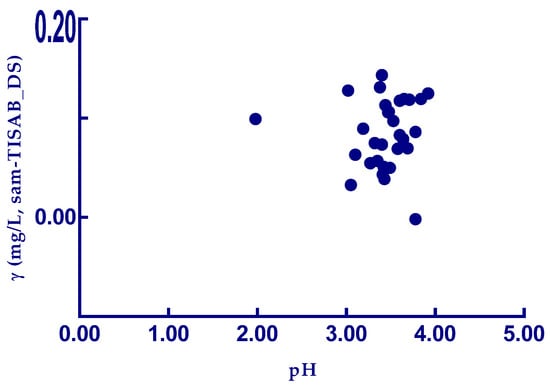
Figure 6.
Pearson’s correlation analysis between pH and fluoride content in various kinds of a tested white and red wines in the dependence of sam-TISAB_DC and pH.
The obtained results are not in accordance with the conclusions of the group of authors, who in their study found a close correlation between the fluoride content and the pH of the wine [40].
4. Conclusions
In this study, potentiometry was used to determine the fluoride content in wines. Based on the results obtained, total ionic strength adjustment buffer is proposed as a suitable medium and the standard addition method as the determination method. The fluoride levels in the tested wines show low values within the recommended limits and do not pose any risk to human health. No significant difference was found between the fluoride content in white and red wines, but the mentioned difference exists depending on the place of origin of the wine. Additionally, no correlation was found between the fluoride content and the pH of the tested wines.
Author Contributions
Conceptualization, M.B. (Maša Buljac) and J.R.; methodology, M.B. (Marija Bralić); validation, M.B. (Maša Buljac) and J.R.; formal analysis, J.R.; investigation, M.B. (Maša Buljac); resources, M.B. (Maša Buljac), M.B. (Marija Bralić) and M.K.; data curation, I.V. and J.R.; writing—original draft preparation, M.B. (Maša Buljac), M.B. (Marija Bralić) and J.R.; writing—review and editing, M.B. (Maša Buljac) and J.R.; supervision, M.K. All authors have read and agreed to the published version of the manuscript.
Funding
This research received no external funding.
Data Availability Statement
Not applicable.
Conflicts of Interest
The authors declare no conflict of interest.
References
- Budisa, N.; Kubyshkin, V.; Schulze-Makuch, D. Fluorine-Rich Planetary Environments as Possible Habitats for Life. Life 2014, 4, 374–385. [Google Scholar] [CrossRef] [PubMed]
- Štepec, D.; Ponikvar-Svet, M. Fluoride in Human Health and Nutrition. Acta Chim. Slov. 2019, 66, 255–275. [Google Scholar] [CrossRef] [PubMed]
- Barbier, O.; Arreola-Mendoza, L.; Del Razo, L.M. Molecular mechanisms of fluoride toxicity. Chem. Biol. Interact. 2010, 188, 319–333. [Google Scholar] [CrossRef] [PubMed]
- Jaudenes, J.R.; Hardisson, A.; Paz, S.; Rubio, C.; Gutiérrez, A.J.; Burgos, A.; Revert, C. Potentiometric Determination of Fluoride Concentration in Beers. Biol. Trace Elem. Res. 2018, 181, 178–183. [Google Scholar] [CrossRef]
- Dhar, V.; Bhatnagar, M. Physiology and toxicity of fluoride. Indian J. Dent. Res. 2009, 20, 350. [Google Scholar] [CrossRef]
- Gutiérrez, A.J. Potentiometric Determination of Fluoride in Vinegars. Open Access J. Toxicol. 2018, 2, 555589. [Google Scholar] [CrossRef]
- Paz, S.; Jaudenes, J.R.; Gutiérrez, A.J.; Rubio, C.; Hardisson, A.; Revert, C. Determination of Fluoride in Organic and Non-organic Wines. Biol. Trace Elem. Res. 2017, 178, 153–159. [Google Scholar] [CrossRef]
- Perumal, E.; Paul, V.; Govindarajan, V.; Panneerselvam, L. A brief review on experimental fluorosis. Toxicol. Lett. 2013, 223, 236–251. [Google Scholar] [CrossRef]
- Miya, K.S.; Jha, V.K. Determination of Fluoride in Various Samples Using a Fluoride Selective Electrode. J. Anal. Sci. Methods Instrum. 2020, 10, 97–103. [Google Scholar] [CrossRef]
- Guth, S.; Hüser, S.; Roth, A.; Degen, G.; Diel, P.; Edlund, K.; Eisenbrand, G.; Engel, K.-H.; Epe, B.; Grune, T.; et al. Toxicity of fluoride: Critical evaluation of evidence for human developmental neurotoxicity in epidemiological studies, animal experiments and in vitro analyses. Arch. Toxicol. 2020, 94, 1375–1415. [Google Scholar] [CrossRef]
- Rodríguez Gómez, M.; Hardisson de La Torre, A.; Burgos Ojeda, A.; Álvarez Marante, R.; Díaz-Flores, L. Fluoride levels in wines of the Canary Islands (Spain). Eur. Food Res. Technol. 2003, 216, 145–149. [Google Scholar] [CrossRef]
- Trombella, B.E.; Caputi, A.; Musso, D.; Ribeiro, A.; Ryan, T.; Andrade, G.; Burns, G.; Eder, R.; Gallego, R.G.; Garcia, J.; et al. Determination of Fluoride in Wine by Fluoride Selective Ion Electrode, Standard Addition Method: Collaborative Study. J. AOAC Int. 2003, 86, 1203–1207. [Google Scholar] [CrossRef] [PubMed]
- Kage, S.; Kudo, K.; Nishida, N.; Ikeda, H.; Yoshioka, N.; Ikeda, N. Determination of fluoride in human whole blood and urine by gas chromatography-mass spectrometry. Forensic Toxicol. 2008, 26, 23–26. [Google Scholar] [CrossRef]
- Pagliano, E.; Meija, J.; Ding, J.; Sturgeon, R.E.; D’Ulivo, A.; Mester, Z. Novel Ethyl-Derivatization Approach for the Determination of Fluoride by Headspace Gas Chromatography/Mass Spectrometry. Anal. Chem. 2013, 85, 877–881. [Google Scholar] [CrossRef]
- Bayón, M.M.; Garcia, A.R.; Ignacio García Alonso, J.; Sanz-Medel, A. Indirect determination of trace amounts of fluoride in natural waters by ion chromatography: A comparison of on-line post-column fluorimetry and ICP-MS detectors. Analyst 1999, 124, 27–31. [Google Scholar] [CrossRef] [PubMed]
- Ozbek, N.; Akman, S. Method Development for the Determination of Fluorine in Water Samples via Molecular Absorption of CaF Using A High-Resolution Continuum Source Electrothermal Atomic Absorption Spectrophotometer. E3S Web Conf. 2013, 1, 05006. [Google Scholar] [CrossRef]
- Morés, S.; Monteiro, G.C.; Santos, F.D.S.; Carasek, E.; Welz, B. Determination of fluorine in tea using high-resolution molecular absorption spectrometry with electrothermal vaporization of the calcium mono-fluoride CaF. Talanta 2011, 85, 2681–2685. [Google Scholar] [CrossRef]
- Noh, J.-H.; Coetzee, P. Evaluation of the potentiometric determination of trace fluoride in natural and drinking water with a fluoride ISE. Water SA 2007, 33, 519–529. [Google Scholar]
- Dhillon, A.; Nair, M.; Kumar, D. Analytical methods for determination and sensing of fluoride in biotic and abiotic sources: A review. Anal. Methods 2016, 8, 5338–5352. [Google Scholar] [CrossRef]
- Du, J.; Sheng, C.; Wang, Y.; Zhang, H.; Jiang, K. Determination of trace fluoride in water samples by silylation and gas chromatography/mass spectrometry analysis. Rapid Commun. Mass Spectrom. 2021, 35, e9089. [Google Scholar] [CrossRef]
- Guo, W.; Jin, L.; Hu, S.; Guo, Q. Method Development for the Determination of Total Fluorine in Foods by Tandem Inductively Coupled Plasma Mass Spectrometry with a Mass-Shift Strategy. J. Agric. Food Chem. 2017, 65, 3406–3412. [Google Scholar] [CrossRef] [PubMed]
- Moirana, R.L.; Kivevele, T.; Mkunda, J.; Mtei, K.; Machunda, R. Trends towards Effective Analysis of Fluorinated Compounds Using Inductively Coupled Plasma Mass Spectrometry (ICP-MS). J. Anal. Methods Chem. 2021, 2021, 8837315. [Google Scholar] [CrossRef]
- Moro, T.T.; Arcênio, P.P.; de Oliveira, F.J.S.; Chaves, E.S.; Bascuñan, V.L.A.F.; Maranhão, T.d.A. Determination of extractable fluorine from residue of oil and gas industry by HR-CS MAS applying toxicity characteristic leaching procedure. J. Fluor. Chem. 2021, 252, 109917. [Google Scholar] [CrossRef]
- Akman, S.; Welz, B.; Ozbek, N.; Pereira, É.R. CHAPTER 5. Fluorine Determination in Milk, Tea and Water by High-Resolution, High-Temperature Molecular Absorption Spectrometry. In Food and Nutritional Components in Focus; Royal Society of Chemistry: London, UK, 2015; pp. 75–95. [Google Scholar]
- Ünal, E.İ.; Kenar, A.; Aksu, M.L.; Tastekin, M. Spectrophotometric methods for the determination of fluoride ion using indole-3-acetic acid interaction with iron(III). Turkish J. Chem. 2019, 43, 415–423. [Google Scholar] [CrossRef]
- Xu, D.H.; Liu, S.H.; Chen, P. Fluoride Determination by Ion Chromatography in Fluorocarbon Coatings. Key Eng. Mater. 2017, 726, 50–54. [Google Scholar] [CrossRef]
- Ozbek, N.; Akman, S. Determination of fluorine in Turkish wines by molecular absorbance of CaF using a high resolution continuum source atomic absorption spectrometer. LWT Food Sci. Technol. 2015, 61, 112–116. [Google Scholar] [CrossRef]
- Švarc-Gajić, J.; Stojanović, Z.; Vasiljević, I.; Kecojević, I. Determination of fluorides in pharmaceutical products for oral hygiene. J. Food Drug Anal. 2013, 21, 384–389. [Google Scholar] [CrossRef]
- Radić, J.; Bralić, M.; Kolar, M.; Genorio, B.; Prkić, A.; Mitar, I. Development of the New Fluoride Ion-Selective Electrode Modified with FexOy Nanoparticles. Molecules 2020, 25, 5213. [Google Scholar] [CrossRef]
- Reshetnyak, V.Y.; Nesterova, O.V.; Admakin, O.I.; Dobrokhotov, D.A.; Avertseva, I.N.; Dostdar, S.A.; Khakimova, D.F. Evaluation of free and total fluoride concentration in mouthwashes via measurement with ion-selective electrode. BMC Oral Health 2019, 19, 251. [Google Scholar] [CrossRef]
- Radić, J.; Buljac, M.; Genorio, B.; Gričar, E.; Kolar, M. A Novel Reduced Graphene Oxide Modified Carbon Paste Electrode for Potentiometric Determination of Trihexyphenidyl Hydrochloride in Pharmaceutical and Biological Matrices. Sensors 2021, 21, 2955. [Google Scholar] [CrossRef]
- Radić, J.; Perović, D.; Gričar, E.; Kolar, K. Potentiometric Determination of Maprotiline Hydrochloride in Pharmaceutical and Biological Matrices Using a Novel Modified Carbon Paste Electrode. Sensors 2022, 22, 9201. [Google Scholar] [CrossRef] [PubMed]
- Jurić, A.; Prkić, A.; Giljanović, J.; Brkljača, M.; Sokol, V.; Bošković, P.; Vukušić, T. Determination of total fluoride content in teas by using fluoride ion-selective electrode. Int. J. Electrochem. Sci. 2014, 9, 5409–5415. [Google Scholar]
- Bralić, M.; Buljac, M.; Prkić, A.; Buzuk, M.; Brinić, S. Determination fluoride in products for oral hygiene using flow-injection (FIA) and continuous analysis (CA) with home-made FISE. Int. J. Electrochem. Sci. 2015, 10, 2253–2264. [Google Scholar]
- Spano, N.; Guccini, V.; Ciulu, M.; Floris, I.; Nurchi, V.M.; Panzanelli, A.; Pilo, M.I.; Sanna, G. Free fluoride determination in honey by ion-specific electrode potentiometry: Method assessment, validation and application to real unifloral samples. Arab. J. Chem. 2018, 11, 492–500. [Google Scholar] [CrossRef]
- Galvis-Sánchez, A.C.; Santos, J.R.; Rangel, A.O.S.S. Standard addition flow method for potentiometric measurements at low concentration levels: Application to the determination of fluoride in food samples. Talanta 2015, 219, 121341. [Google Scholar] [CrossRef]
- Patel, S.; Omid, N.; Zohoori, F.V.; Maguire, A.; Waldron, K.J.; Valentine, R.A. Comparison of total ionic strength adjustment buffers iii and iv in the measurement of fluoride concentration of teas. Nutr. Health 2018, 24, 111–119. [Google Scholar] [CrossRef]
- Forino, M.; Picariello, L.; Rinaldi, A.; Moio, L.; Gambuti, A. How must pH affects the level of red wine phenols. LWT 2020, 129, 109546. [Google Scholar] [CrossRef]
- Gambuti, A.; Picariello, L.; Forino, M.; Errichiello, F.; Guerriero, A.; Moio, L. How the Management of pH during Winemaking Affects Acetaldehyde, Polymeric Pigments and Color Evolution of Red Wine. Appl. Sci. 2022, 12, 2555. [Google Scholar] [CrossRef]
- Fabjanowicz, M.; Kosek, K.; Płotka-Wasylka, J.; Namieśnik, J. Evaluation of the influence of grapevine growing conditions on wine quality. Mon. Fur Chem. 2019, 150, 1579–1584. [Google Scholar] [CrossRef]
Disclaimer/Publisher’s Note: The statements, opinions and data contained in all publications are solely those of the individual author(s) and contributor(s) and not of MDPI and/or the editor(s). MDPI and/or the editor(s) disclaim responsibility for any injury to people or property resulting from any ideas, methods, instructions or products referred to in the content. |
© 2022 by the authors. Licensee MDPI, Basel, Switzerland. This article is an open access article distributed under the terms and conditions of the Creative Commons Attribution (CC BY) license (https://creativecommons.org/licenses/by/4.0/).