
The Influence of Al Doping on the Optical Characteristics of ZnO Nanopowders Obtained by the Low-Cost Sol-Gel Method

1
Department of Physics, Sri Sai University, Palampur 176081, India
2
Department of Physics, The University of the West Indies, Saint Augustine 32080, Trinidad and Tobago
*
Author to whom correspondence should be addressed.
Chemistry 2022, 4(4), 1136-1146; https://doi.org/10.3390/chemistry4040077
Submission received: 8 August 2022
/
Revised: 11 September 2022
/
Accepted: 20 September 2022
/
Published: 25 September 2022
(This article belongs to the Topic Synthesis, Properties and Applications of Fluorescent Nanomaterials)
Abstract
:In this work, the influence of Al (0, 2, 4, and 6 wt.%) on the optical properties of ZnO has been briefly investigated and described. The undoped and doped samples were characterized using a UV-visible spectrophotometer and Photoluminescence (PL). The X-ray diffraction (XRD) data in our preceding study is also indexed, and materials are said to have a wurtzite-structured hexagonal phase and exhibit no impurity phases. The average crystallite sizes of the pure ZnO were found to increase, i.e., from 14.19 nm to 34.17 nm with an increase in temperature, and in the case of Al-doped ZnO, at a constant temperature, from 35.05 nm to 18.89 nm, respectively. The average crystallite size of AZO (Al-doped ZnO) decreases with increasing Al content. With the increasing temperature, increases in crystallinity and size of the pure ZnO have been observed. In the case of Al doping, with an increase in the concentration of doping the crystallite size is seen to be decreased, without any change in the temperature. Al doping improves the formation of the well-ordered crystalline structure of ZnO up to a certain limit of doping. The absorbance spectra were used to determine the optical band gap of the samples. The optical photoluminescence (PL) spectra of both ZnO and AZO nanopowder are obviously influenced by the increasing temperature and Al doping content, respectively. Different optical properties of ZnO and AZO were observed for different contents of Al in ZnO. The band gap of AZO nanopowder with different concentrations has been seen to be lower than that of undoped ZnO (3.10 eV), suggesting broad application potential. Also, the optical properties of ZnO were tailored by Al doping in the near visible region, suggesting various potential uses.
1. Introduction
Because of the size-dependent electrical and optical properties, nanosized semiconductors have gained a lot of interest. The behavior of a nanosized semiconductor may differ from that of the bulk semiconductors. ZnO nanomaterial is a great multifunctional material with a wide variety of technological applications due to its excellent physical/chemical stability. It is a wide-gap semiconductor with interesting properties for a number of fields, such as electronics, optics, thermal, and piezoelectricity [1]. Due to its resource availability and non-toxicity, ZnO is gaining a great deal of research interest and is also a focus of attention for industries. It belongs to II–VI semiconductor family. It is an excellent n-type semiconductor with a direct wide band gap (3.37 eV) and large exciton binding energy (60 meV) at room temperature, the largest among II–VI semiconductors, which results in its strong candidacy for optoelectronic devices [2]. Many metal elements have been doped into ZnO nanomaterial to improve electrical and optical characteristics. The doping of metals such as In, B, Ga, and Al into ZnO nanoparticles has improved their electrical conductivity [3]. Al-doped ZnO is one of these elements that is being investigated as a replacement for transparent conducting oxide material (TCO) in solar cells and light-emitting diodes (LEDs) [4]. The atomic replacement of Al for Zn in the ZnO crystal structure has resulted in the acquiescence of a free electron in the conduction band, lowering the electrical resistance [5]. The resultant material is transparent and has a low resistance [6]. It is critical to optimize the size and element of nanoparticles in response to improved current density.
There are a number of physical and chemical techniques that have been used to synthesize the nanopowder of various materials. Spray pyrolysis, forced hydrolysis, sol-gel method, reactive electron beam evaporation technique, thermal breakdown, chemical vapor deposition, hydrothermal method, and solvothermal reaction have all been used to make ZnO nanopowder [7,8,9,10,11,12,13,14,15,16,17,18,19,20,21]. These nanoparticles can be produced into a variety of morphologies like tetra legs, nanorods, nanosheets, nano combs, nanoflowers, and nanowires [20,22,23,24,25,26,27,28,29,30,31]. Among these, the sol-gel preparation approach is particularly important and beneficial because it offers a number of benefits and advantages, including a low process temperature, low cost, and no need for specialized equipment [32,33,34,35]. It has now been proven that the sol-gel process is a single-step nanopowder preparation method that works without any extreme conditions. ZnO has a greater photocatalytic efficiency when exposed to UV light and a weaker photocatalytic activity when exposed to visible light. As a result, significant efforts to improve ZnO performance in the visible range using metal- or non-metal-doped ZnO or ZnO composites have been made [36]. While some elements improved the optical characteristics of ZnO, others had the reverse effect. This means that a significant improvement in ZnO’s optical characteristics is still achievable. One of the most effective ways to improve the optical and electrical properties of ZnO is to dope it with Al [37].
Because of its size-dependent characteristics, ZnO nanopowder is a promising material for applications. Al doping of ZnO is one of the most effective ways to improve ZnO’s optical characteristics. In this paper, pure and capped AZO nanopowder with different concentrations has been prepared by using the economical sol-gel method. To examine the doped samples with the pure ZnO nanopowder, a pure ZnO nanopowder has also been synthesized. The effects of Al on ZnO’s crystalline structural characteristics have been examined in our earlier work [35]. One of the potential challenges in ZnO research is its low-cost synthesis with the uniformity and stability of nanostructures. The scope of Al incorporation into ZnO indicates the ability to control the crystallinity as well as tailor the band gap. The tuned band gap of the material is required for photovoltaic conversion and harnessing solar energy applications. The UV-visible spectrophotometer and Photoluminescence (PL) have been used to examine the optical properties of ZnO and Al-ZnO nanopowders in this paper.
2. Materials and Methods
The sol-gel process has been used to make pure ZnO and Al-doped ZnO nanopowders. Our prior study, “Synthesis and Structural Characterization of Pure and Al-Doped Capped ZnO Nano Powder at Different Temperature and Concentration”, briefly described the synthesis technique of ZnO and AZO nanopowder by the sol-gel method, using Zinc acetate dihydrate (Zn (CH3COO)2·2H2O) as a precursor and ethanol (CH2COOH) as a solvent, and using distilled water and Sodium hydroxide (NaOH) as medium [35]. To get a homogeneous solution, ethanol (about 2 mL) was added dropwise along with continuous magnetic stirring. Keeping the stoichiometry in mind, a 2-gm batch of zinc oxide was prepared. After that, the obtained residue was dried in an oven for about 4 h. at a temperature of 200 °C. The obtained samples were calcinated at 500 °C, 700 °C, and 750 °C. Finally, yellowish-white ZnO nanomaterial in the form of powder was obtained.
To prepare the AZO nanopowder, different amounts of aluminum acetate (Al(OH)(CH3COO)2)were dissolved in a solution of zinc acetate dihydrate and polyethylene glycol to obtain concentrations of 0%, 2%, 4%, and 6% AZO (g/mL) respectively.
The prepared materials were dried at 500 °C for a few minutes in an oven and then ground for 10 min. The resulting powders were heat-treated at 700 °C and 750 °C in a furnace. The synthesized ZnO and AZO nanopowder was taken out and subjected to the characterization process. An optical investigation was performed using Shimadzu Corporation Model UV-2450, a UV-visible spectrophotometer in the wavelength range of 300–800 nm. In addition, for studying the luminescence properties of materials at low and high temperatures, photoluminescence (PL) spectroscopy was also carried out. The XRD study was performed in our previous study under the characterization of pure ZnO and AZO nanopowder, not discussed here [35].
3. Results and Discussion
3.1. Temperature Effect on Crystallization of ZnO and Doping Effect on Crystallization of AZO Nanopowder
From the study of XRD patterns in our previous study under the structural characterization of pure ZnO and AZO nanopowder, the diffraction peaks reveal to have a wurtzite-structured hexagonal phase [35]. The mean size of the ordered ZnO and capped AZO nanopowder has been estimated from the full width at half maximum (FWHM) and the Debye–Scherrer formula. Data were obtained from XRD and after calculation exhibited that the particle size is between 35 nm and 18 nm as listed in Table 1. With increase in temperature, the crystallinity of the pure ZnO increases, because of the diffusion of grain boundaries, which is well-established fact in grain growth phenomena [38]. With increasing Al concentrations, the crystallite size decrease, which can be explored as crystal growth, is slowed down with increasing Al concentrations due to distortion caused by dopants, as shown in Table 2. The XRD reveals the wurtzite structure of ZnO without any secondary phase also when ZnO is doped and capped to Al. The XRD patterns of AZO powders were similar to those of ZnO powders, indicating that micro-Al ions were substituted for Zn atoms, and there were no variations in the structure of the ZnO nanoparticles [38].
3.2. UV-VIS Spectroscopy Analysis
3.2.1. UV-Visible Characterization of Pure ZnO
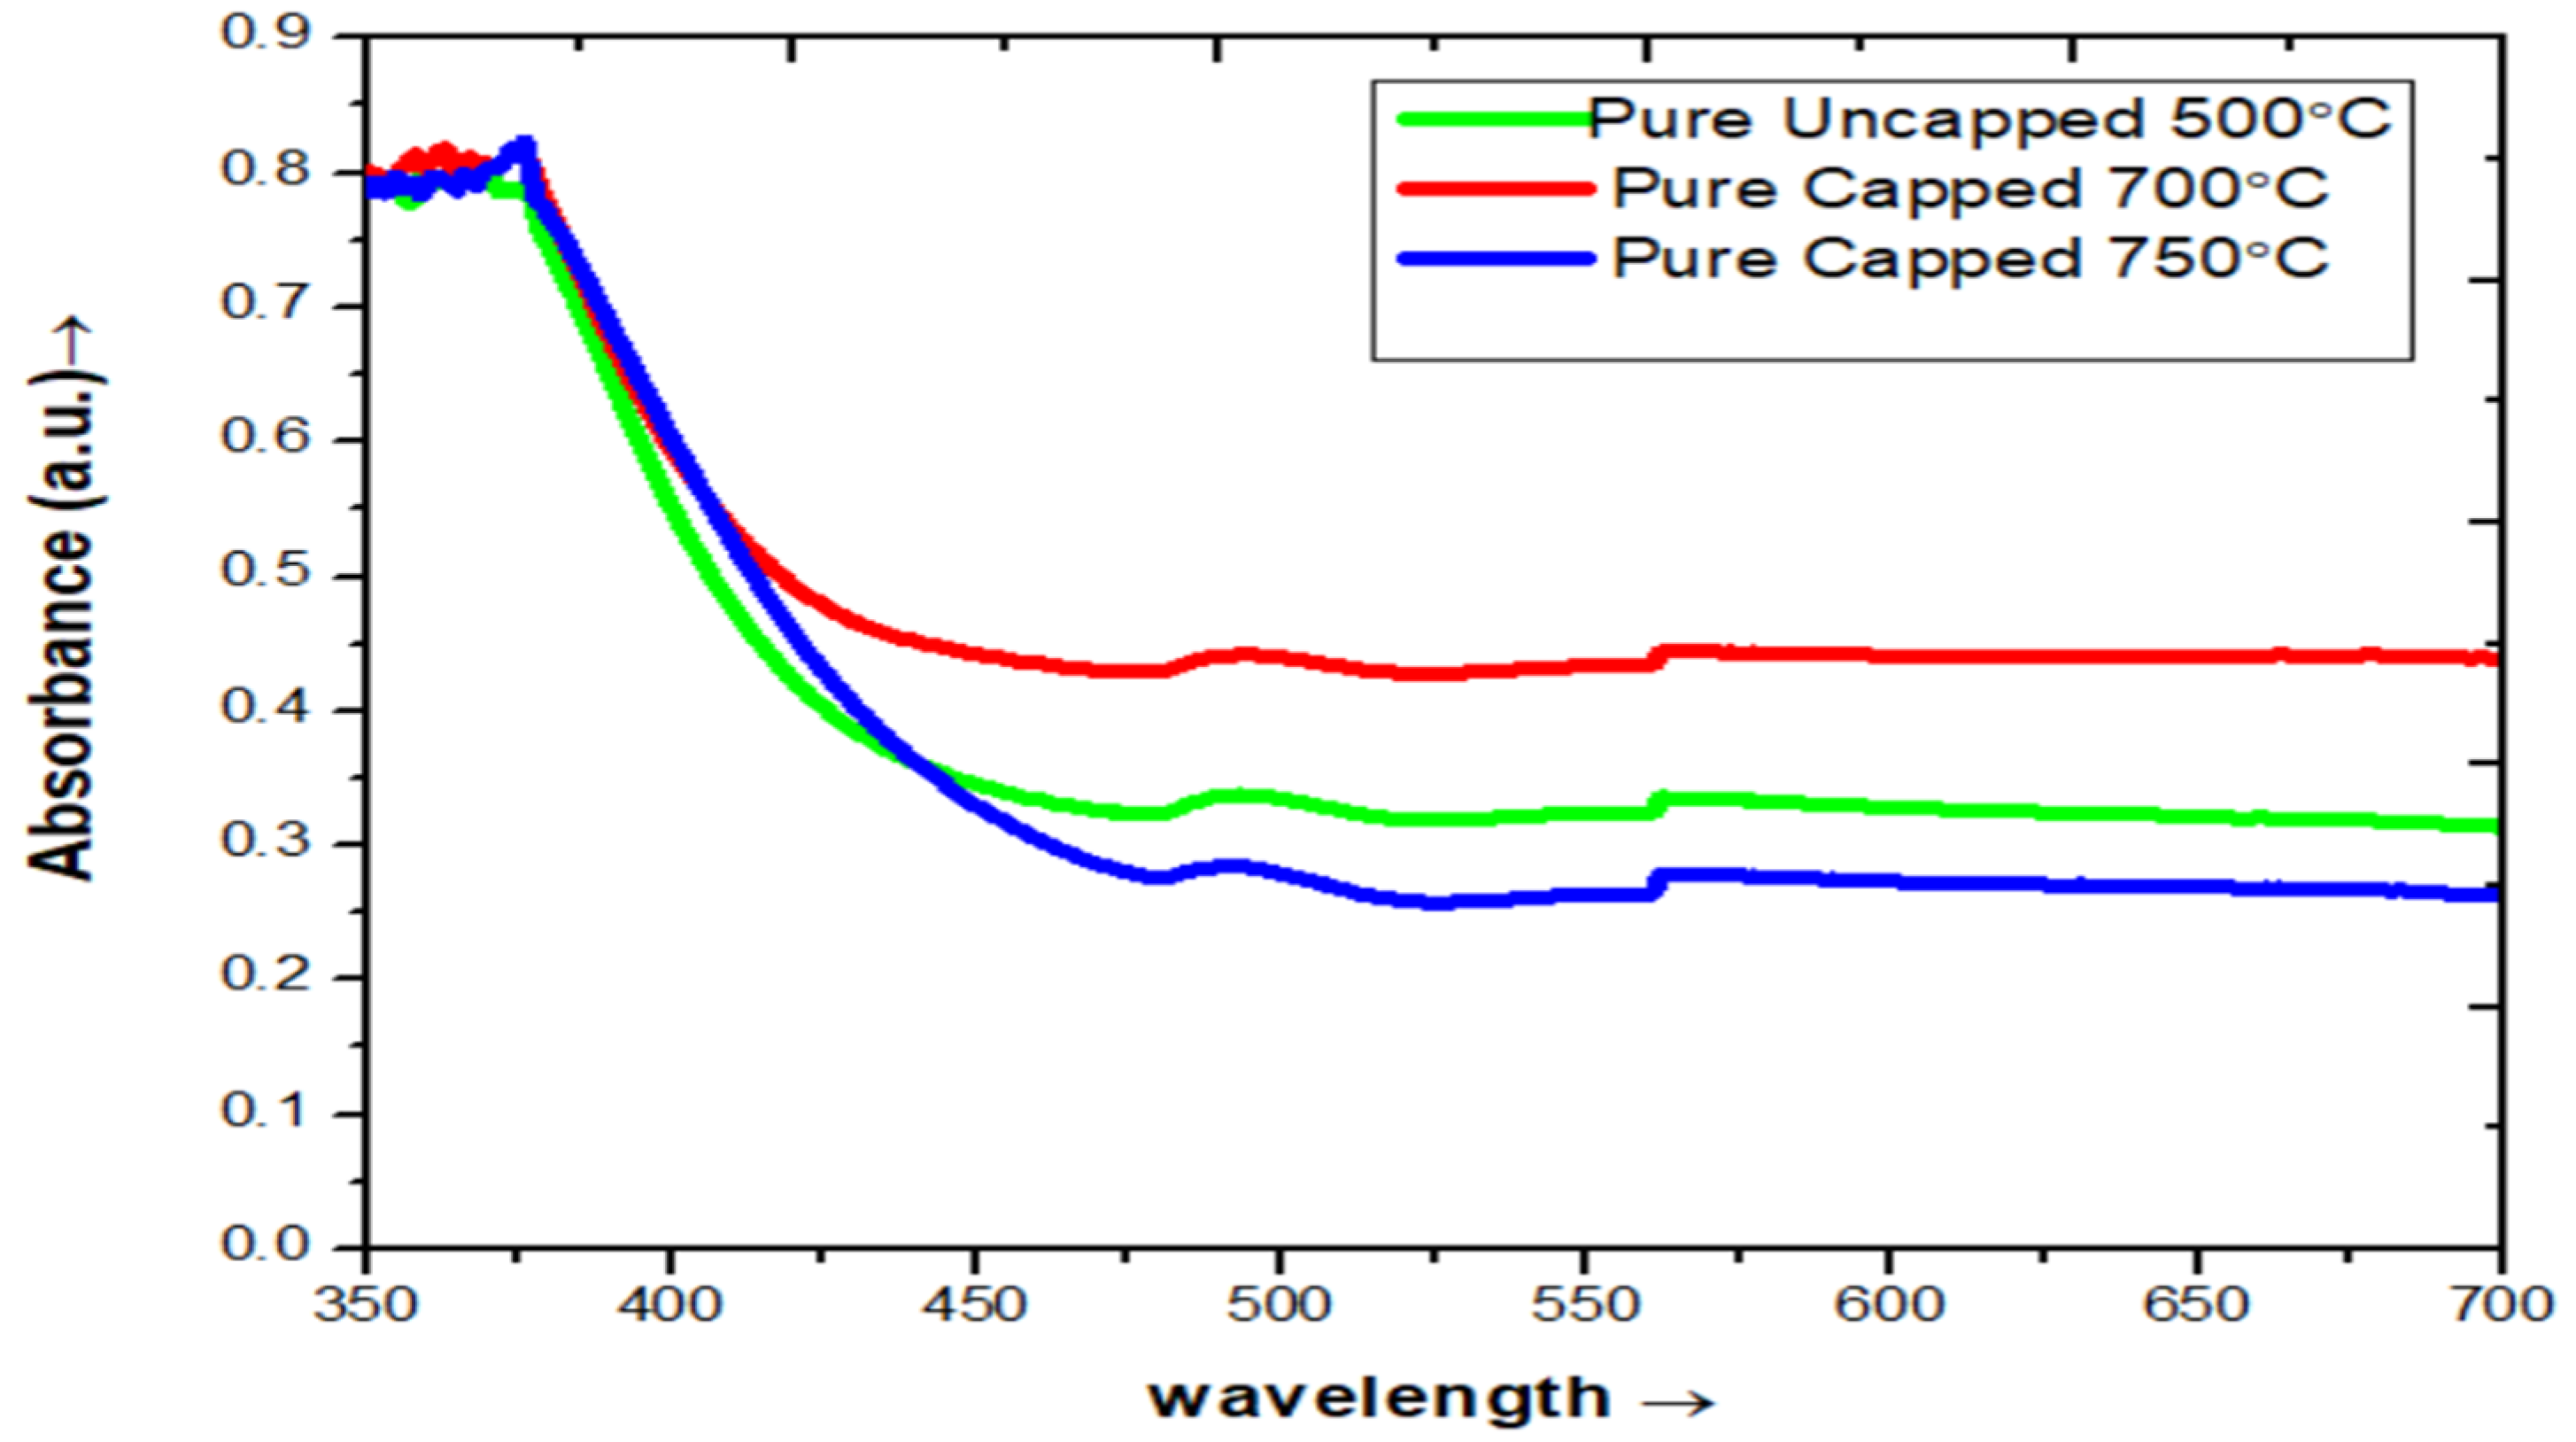
The size of the nanopowder plays an important role in changing the properties of materials. Thus, the size evolution of semiconducting nanopowder becomes very essential to exploring the properties of the materials. For the optical properties of nanopowder, the UV-visible absorption spectroscopy technique is used to examine synthesized ZnO and capped AZO nanopowder. The absorption spectrum of ZnO nanopowder is shown in Figure 1. It exhibits a strong absorption band at about 355 nm [34]. Figure 1 shows the optical absorption spectra of ZnO in the wavelength range of 350 to 700 nm. It is observed that the absorbance increases when the nanopowder is capped, and then its absorbance further decreases when annealed at a higher temperature. This event can be related to structural properties in the solid with great reductions in particle size. When the size of the particle is small, the ratio of the atoms on the surface to all the atoms in the particle increases. In this situation, the surface atoms can affect the morphology [38].
Due to the effect of particle size on the UV absorption, there is a sharp increase in absorbance below 380 nm. Figure 1 and Table 1 show that with decreasing particle size there is both a decrease in absorbance and a blue shift in the curves to lower wavelengths. Also, the broad exciton-related peak at 360–370 nm disappears. As a consequence, not only does the overall UV absorbance decrease with decreasing particle size but the absorbance ratio also decreases, providing a less uniform absorption of radiation over the UV region [39].
The optical band gap of the nanopowder was determined by applying the Tauc relation, as given below:
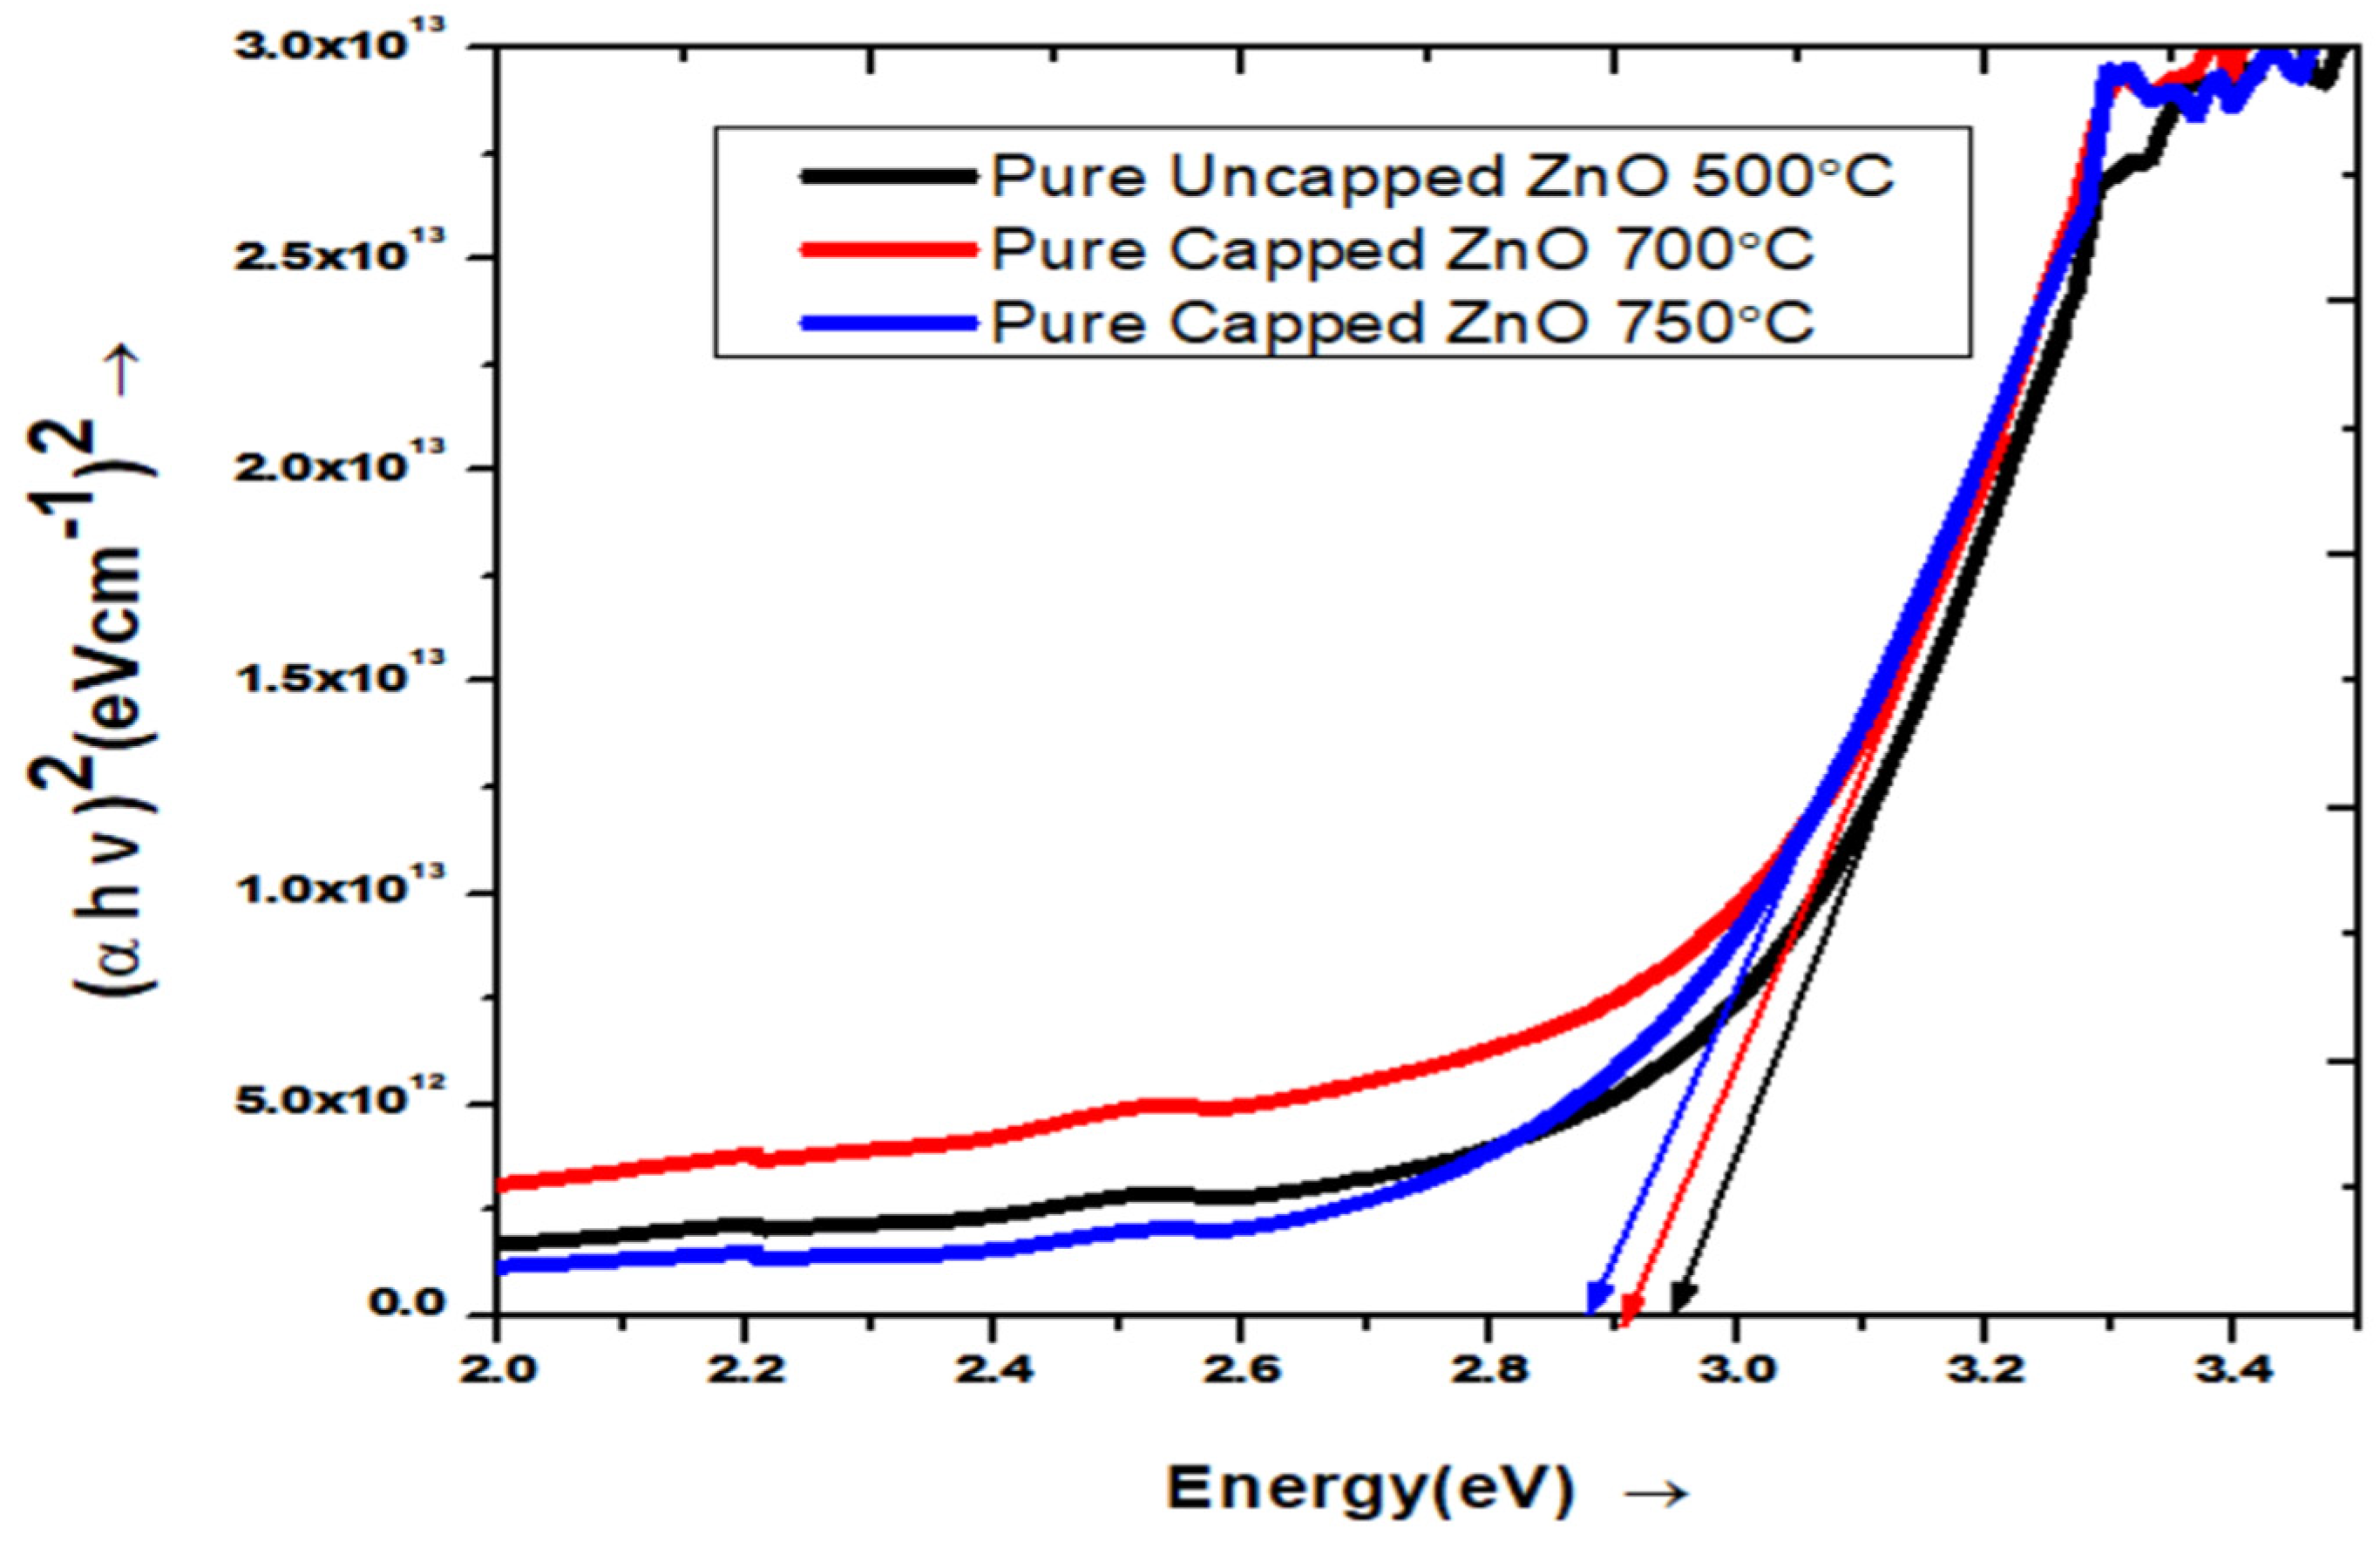
where α is the absorption coefficient (α = 2.303 A/t, here A is the absorbance and t are the thickness of the cuvette), β is a constant called the band tailing parameter, h is Planck’s constant, ν is the photon frequency, Eg is the optical band gap, and n is the power factor of the transition mode, which is dependent upon the nature of the material, whether it is crystalline or amorphous. The value of n = 1/2, 3/2, 2, or 3 depending on the nature of the electronic transition responsible for absorption. The n = 1/2 in Equation (1) is for direct allowed band gap. The extrapolation of this straight line will intercept the (hυ)-axis, giving the value of the indirect optical energy gap (Eg), as shown in Figure 2 and tabulated in Table 1 for all samples.
αhν = β (hν – Eg) n
It is observed that the band gap increases roughly for undoped ZnO with an increase in annealing temperature, which is supposed to be the formation of defects at higher temperatures [32]. Capping ZnO nanopowder decreases the band gap, and then by increasing the annealing temperature, there is a further decrease in the band gap, and it has been referenced that the variations in the value of Eg in semiconductor nanopowder depend only on the size. Through quantum confinement effects, this study presents experimental evidence on how the atomistic arrangement and the type of crystallographic facets are present on the nanopowder surface. These are determined by the nature of the capping ligand molecule, and also have an effect on the value of Eg. Further theoretical and experimental studies are needed to gain a better understanding of the effect on the surface atomistic arrangement of ZnO nanopowder, and also on the values of their respective energy band gap.
3.2.2. UV-Visible Characterization of AZO
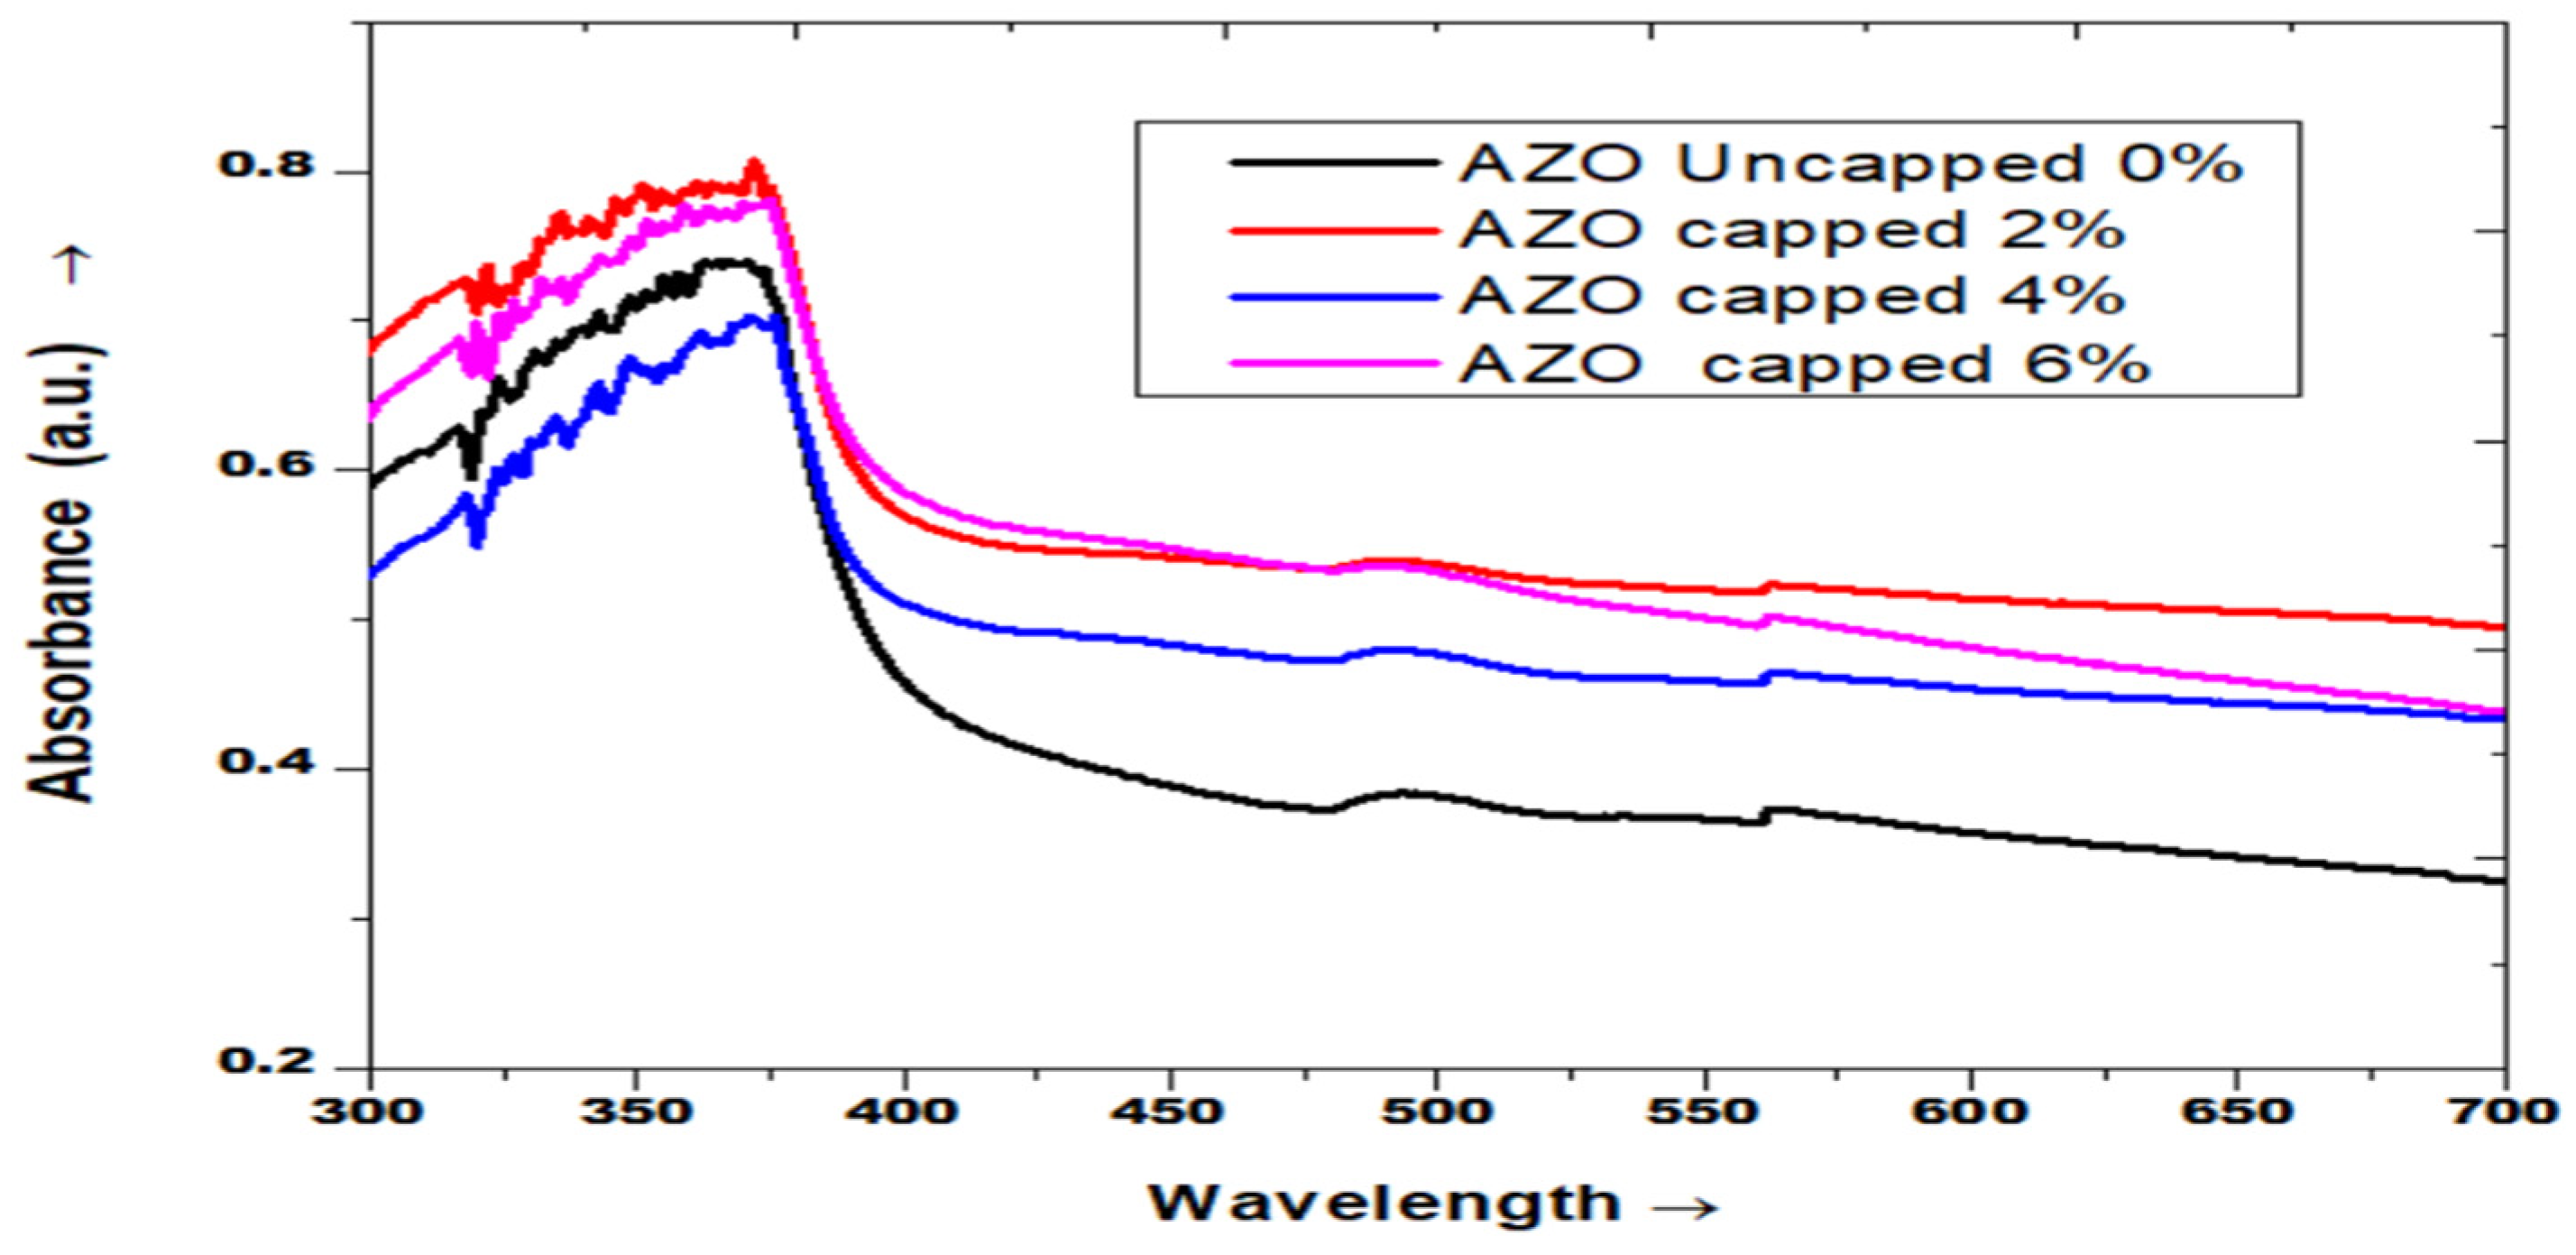
Figure 3 shows the optical absorption spectra of AZO in the wavelength range of 300 to 700 nm. It is observed that the absorbance increases with an increase in Al doping concentration. The absorbance of all samples decreases as the wavelength increases in the visible region. When doped with Al, the samples exhibit low absorbance compared to undoped. As Figure 3 shows, capped AZO 0% with an annealing temperature of 500 °C has the lowest absorbance, and the highest absorbance is obtained with Al dopant 6%. By doping with Al, the absorption edge of a degenerate semiconductor is shifted to shorter wavelengths with increasing carrier concentrations. The optical absorption at the absorption edge corresponds to the transition from the valence band to the conduction band, while the absorption edge shifting to the lower energy relates to some local energy levels caused by some intrinsic defects.
In addition, the increase in the carrier concentration with high annealing temperatures implies that more Al atoms diffuse into the ZnO layer and replace some of the Zn2+ sites at elevated temperatures. When the annealing temperature and concentration is increased, the process would result in the precipitation of AlOx and consequently decrease the carrier concentration [40] as the absorption edge shifted to higher wavelengths, as shown in Figure 3. In Table 2 it is enumerated that the crystallite size of undoped ZnO is 35.05 nm, which decreases to 24.03 nm in the 2% (capped) Al-doped nanopowder. An increase in crystallite size on Al doping arises due to a reduction in the densities of nucleation centers and the consequent growth of large crystallites [41]. However, on further doping, the crystallite size begins to decrease and becomes 18.89 nm for 6% Al-doped nanopowder. This is because of the decreased sintering rate that occurred during the sol-gel process [42]. The direct optical band gap (Eg) of the materials is obtained by the plotting and extrapolation of (αhv)2 vs. hν; the band gap energy estimated from the absorption fringe of the nanopowder is shown in Figure 4. It is clear from the figure that uncapped AZO 0% nanopowder encompasses a band gap of 3.10 eV at 500 °C, and capped AZO 2% nanopowder encompasses a band gap of 3.02 eV at 500 °C; it also increases to 3.08 eV and 3.09 eV with the Al dopants of 4% and 6%, respectively.
The smaller particle size of the ZnO powder is responsible for the slightly greater band gap. Depending on the size of the nanopowder, the band of ZnO fluctuates between 3.02 and 3.10 eV. The increased electronegativity of Zn compared to Al may explain the narrowing of the band gap after Al. Because of the Al3+ incorporation, this variation in electronegativity causes defects in the AZO. In capped AZO nanopowder, the band gap increases with the rise in Al concentration, which could follow the relaxation of growth-induced strain [43]. The rise in band gap is significant to the quantum confinement effect of Al-doped ZnO nanopowder. In very small dimensions, since the energy levels are quantified, more energy is required for the excitation [44]. The decrease in absorbance with increasing Al-dopant concentration indicates a widening of the band gap [45]. The decrease in absorbance at a higher doping level of Al is also attributed to the decrease in the size of nanopowder, which ultimately widens the band gap. The decrease in size ends up in an increase in the surface-to-volume ratio which in turn increases its porosity [46].
3.3. Photoluminescence Spectrum Analysis
3.3.1. Photoluminescence Spectra of Pure ZnO Nanopowder
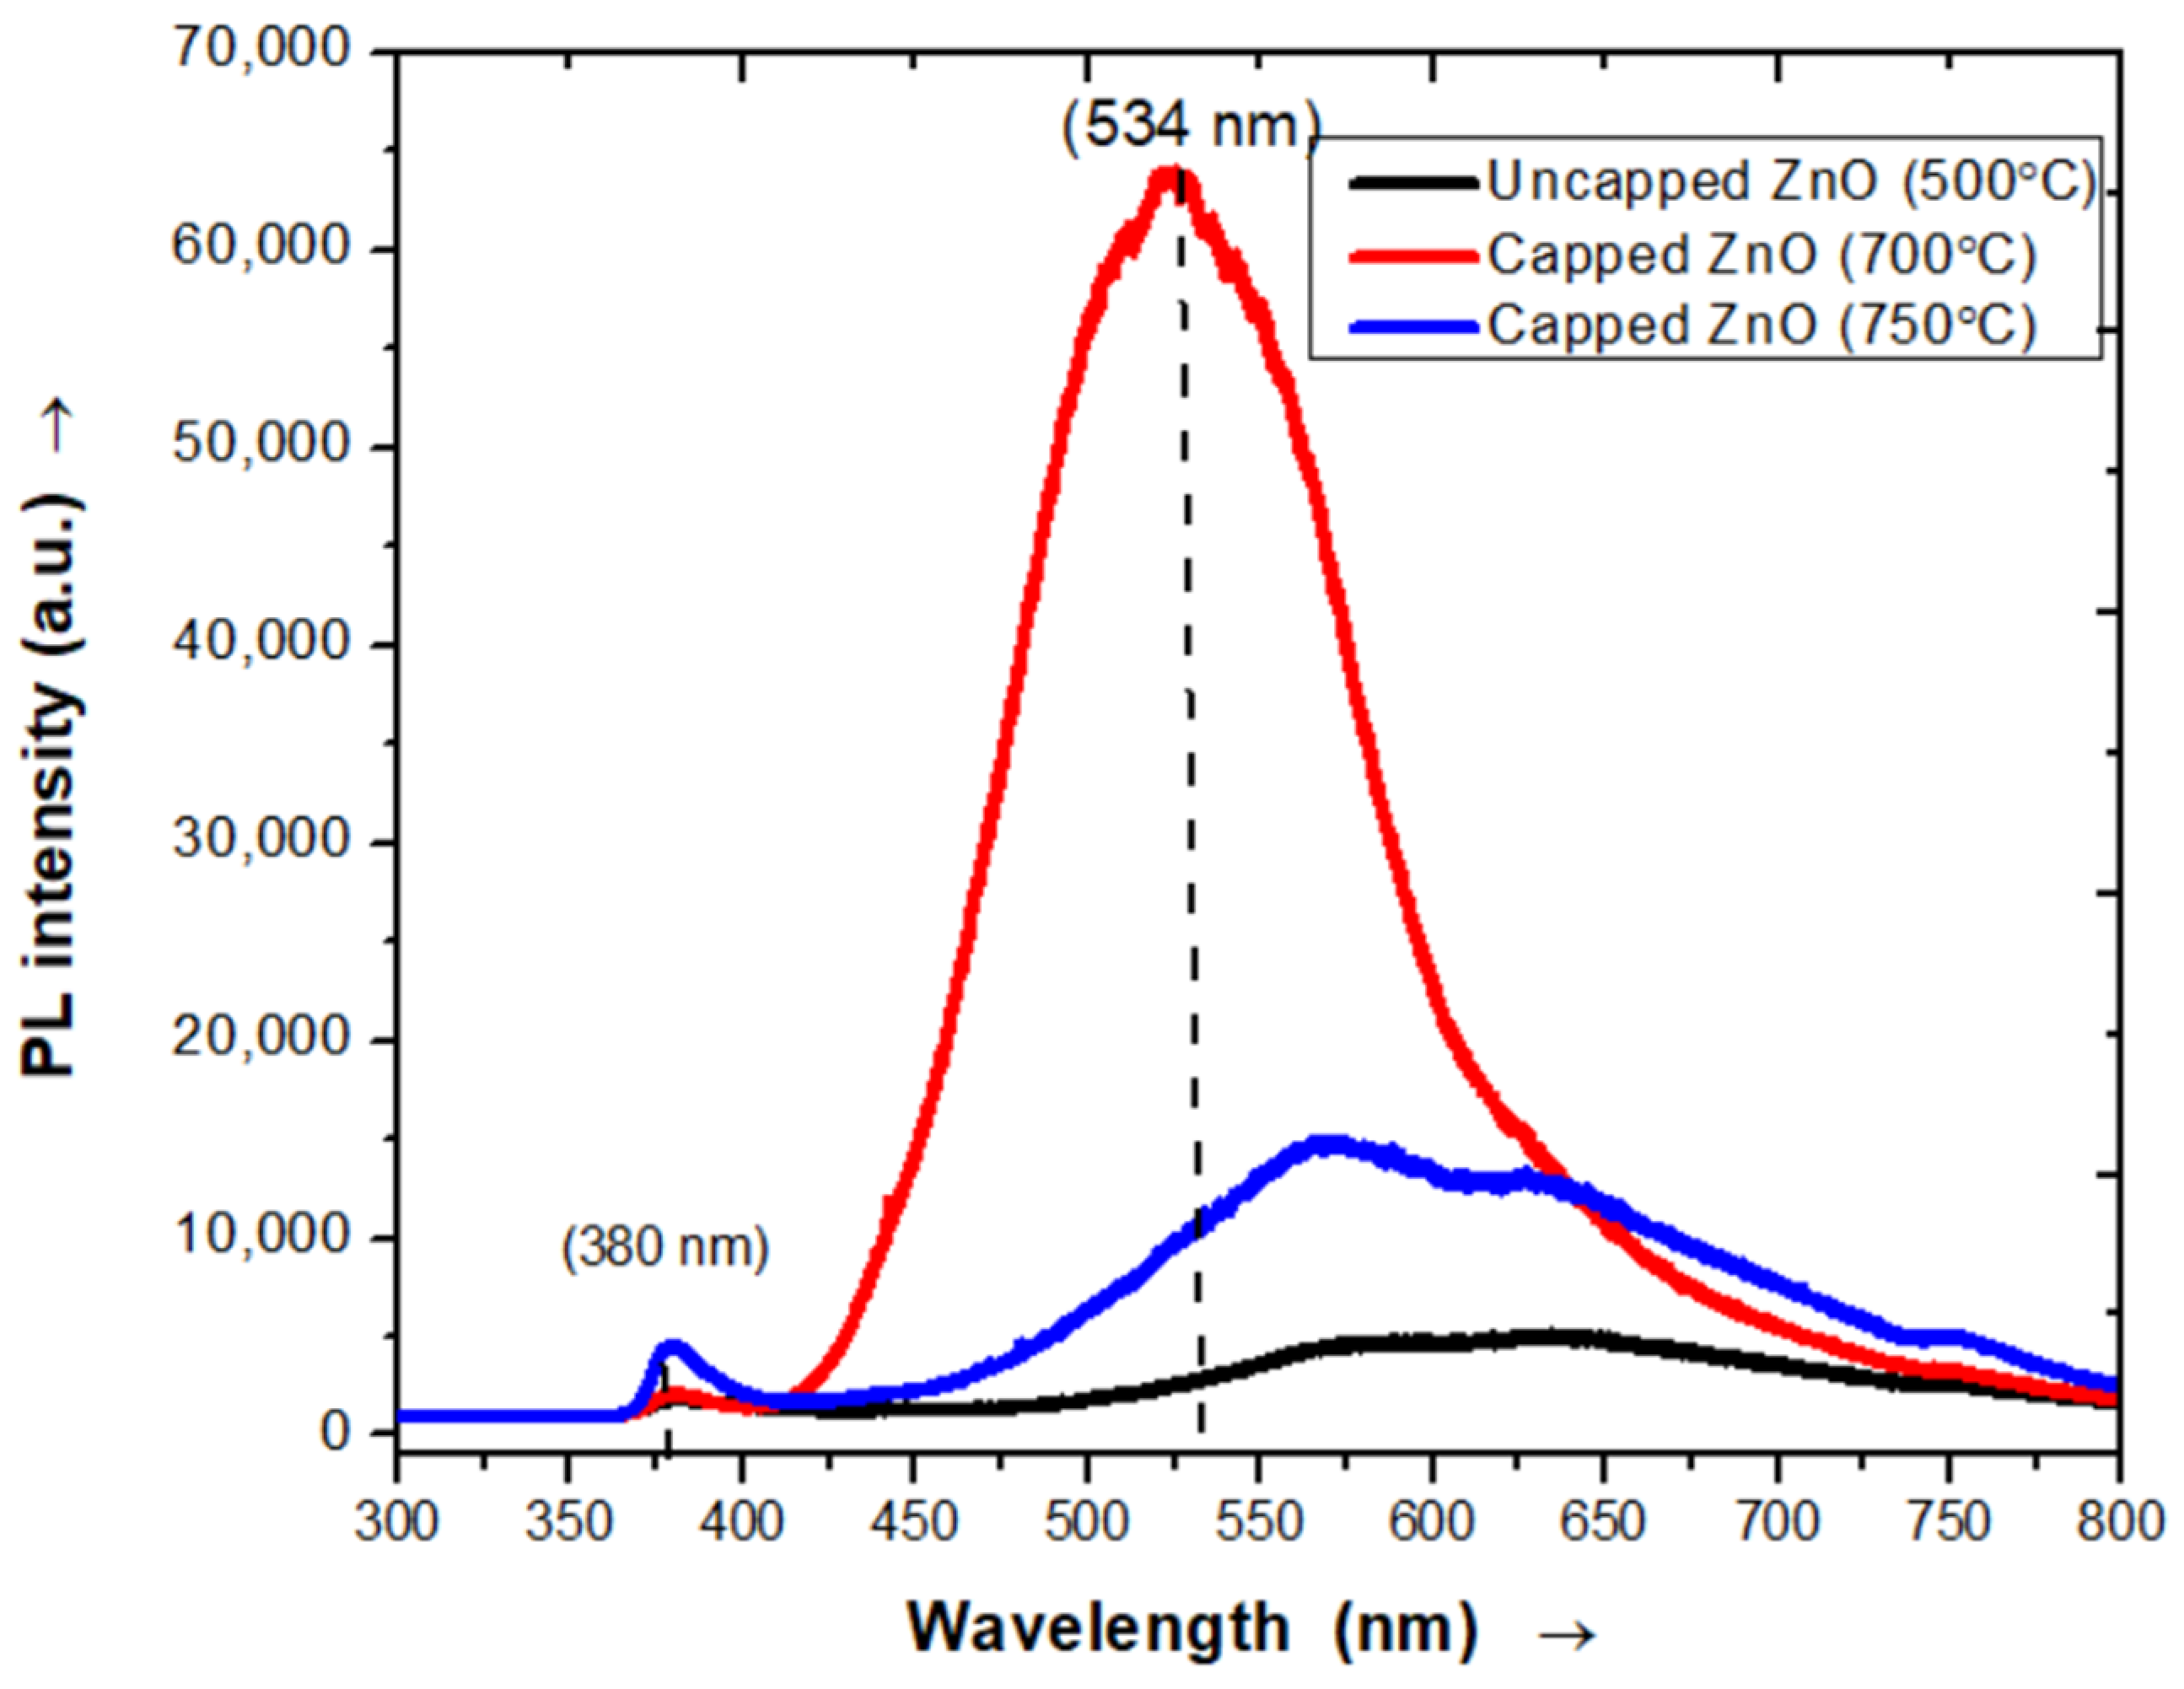
It is worth citing that the properties of semiconducting materials change when their dimensions get down to the nanometer scale known as “quantum”, which has been observed by photoluminescence [47]. The photoluminescence originated from states in the band gap or recombination by surface defects. Figure 5 shows the photoluminescence spectrum of ZnO nanopowder with an excitation wavelength of 320 nm at 500 °C. The spectrum exhibits two emission peaks, one located at around 380 nm (UV region) corresponding to the near band gap excitonic emission [48], and the other located at around 534 nm, attributed to the presence of singly ionized oxygen vacancies [49]. The emission is caused by the radiative recombination of a photo-generated hole with an electron occupying the oxygen vacancy. Figure 5 shows the PL spectra for pure ZnO; there occurs a broad emission band at around 380 nm which occurs near the UV emission region. The trap state emission is responsible for the increases in intensity, and broad low energy PL spectra may be arising from surface defect sites. The PL intensity reveals that the emission intensity of ZnO nanopowder decreases, and shifts from the green region towards the yellow-orange region as the size increases due to capping and increasing temperature.
3.3.2. Photoluminescence Spectra of AZO
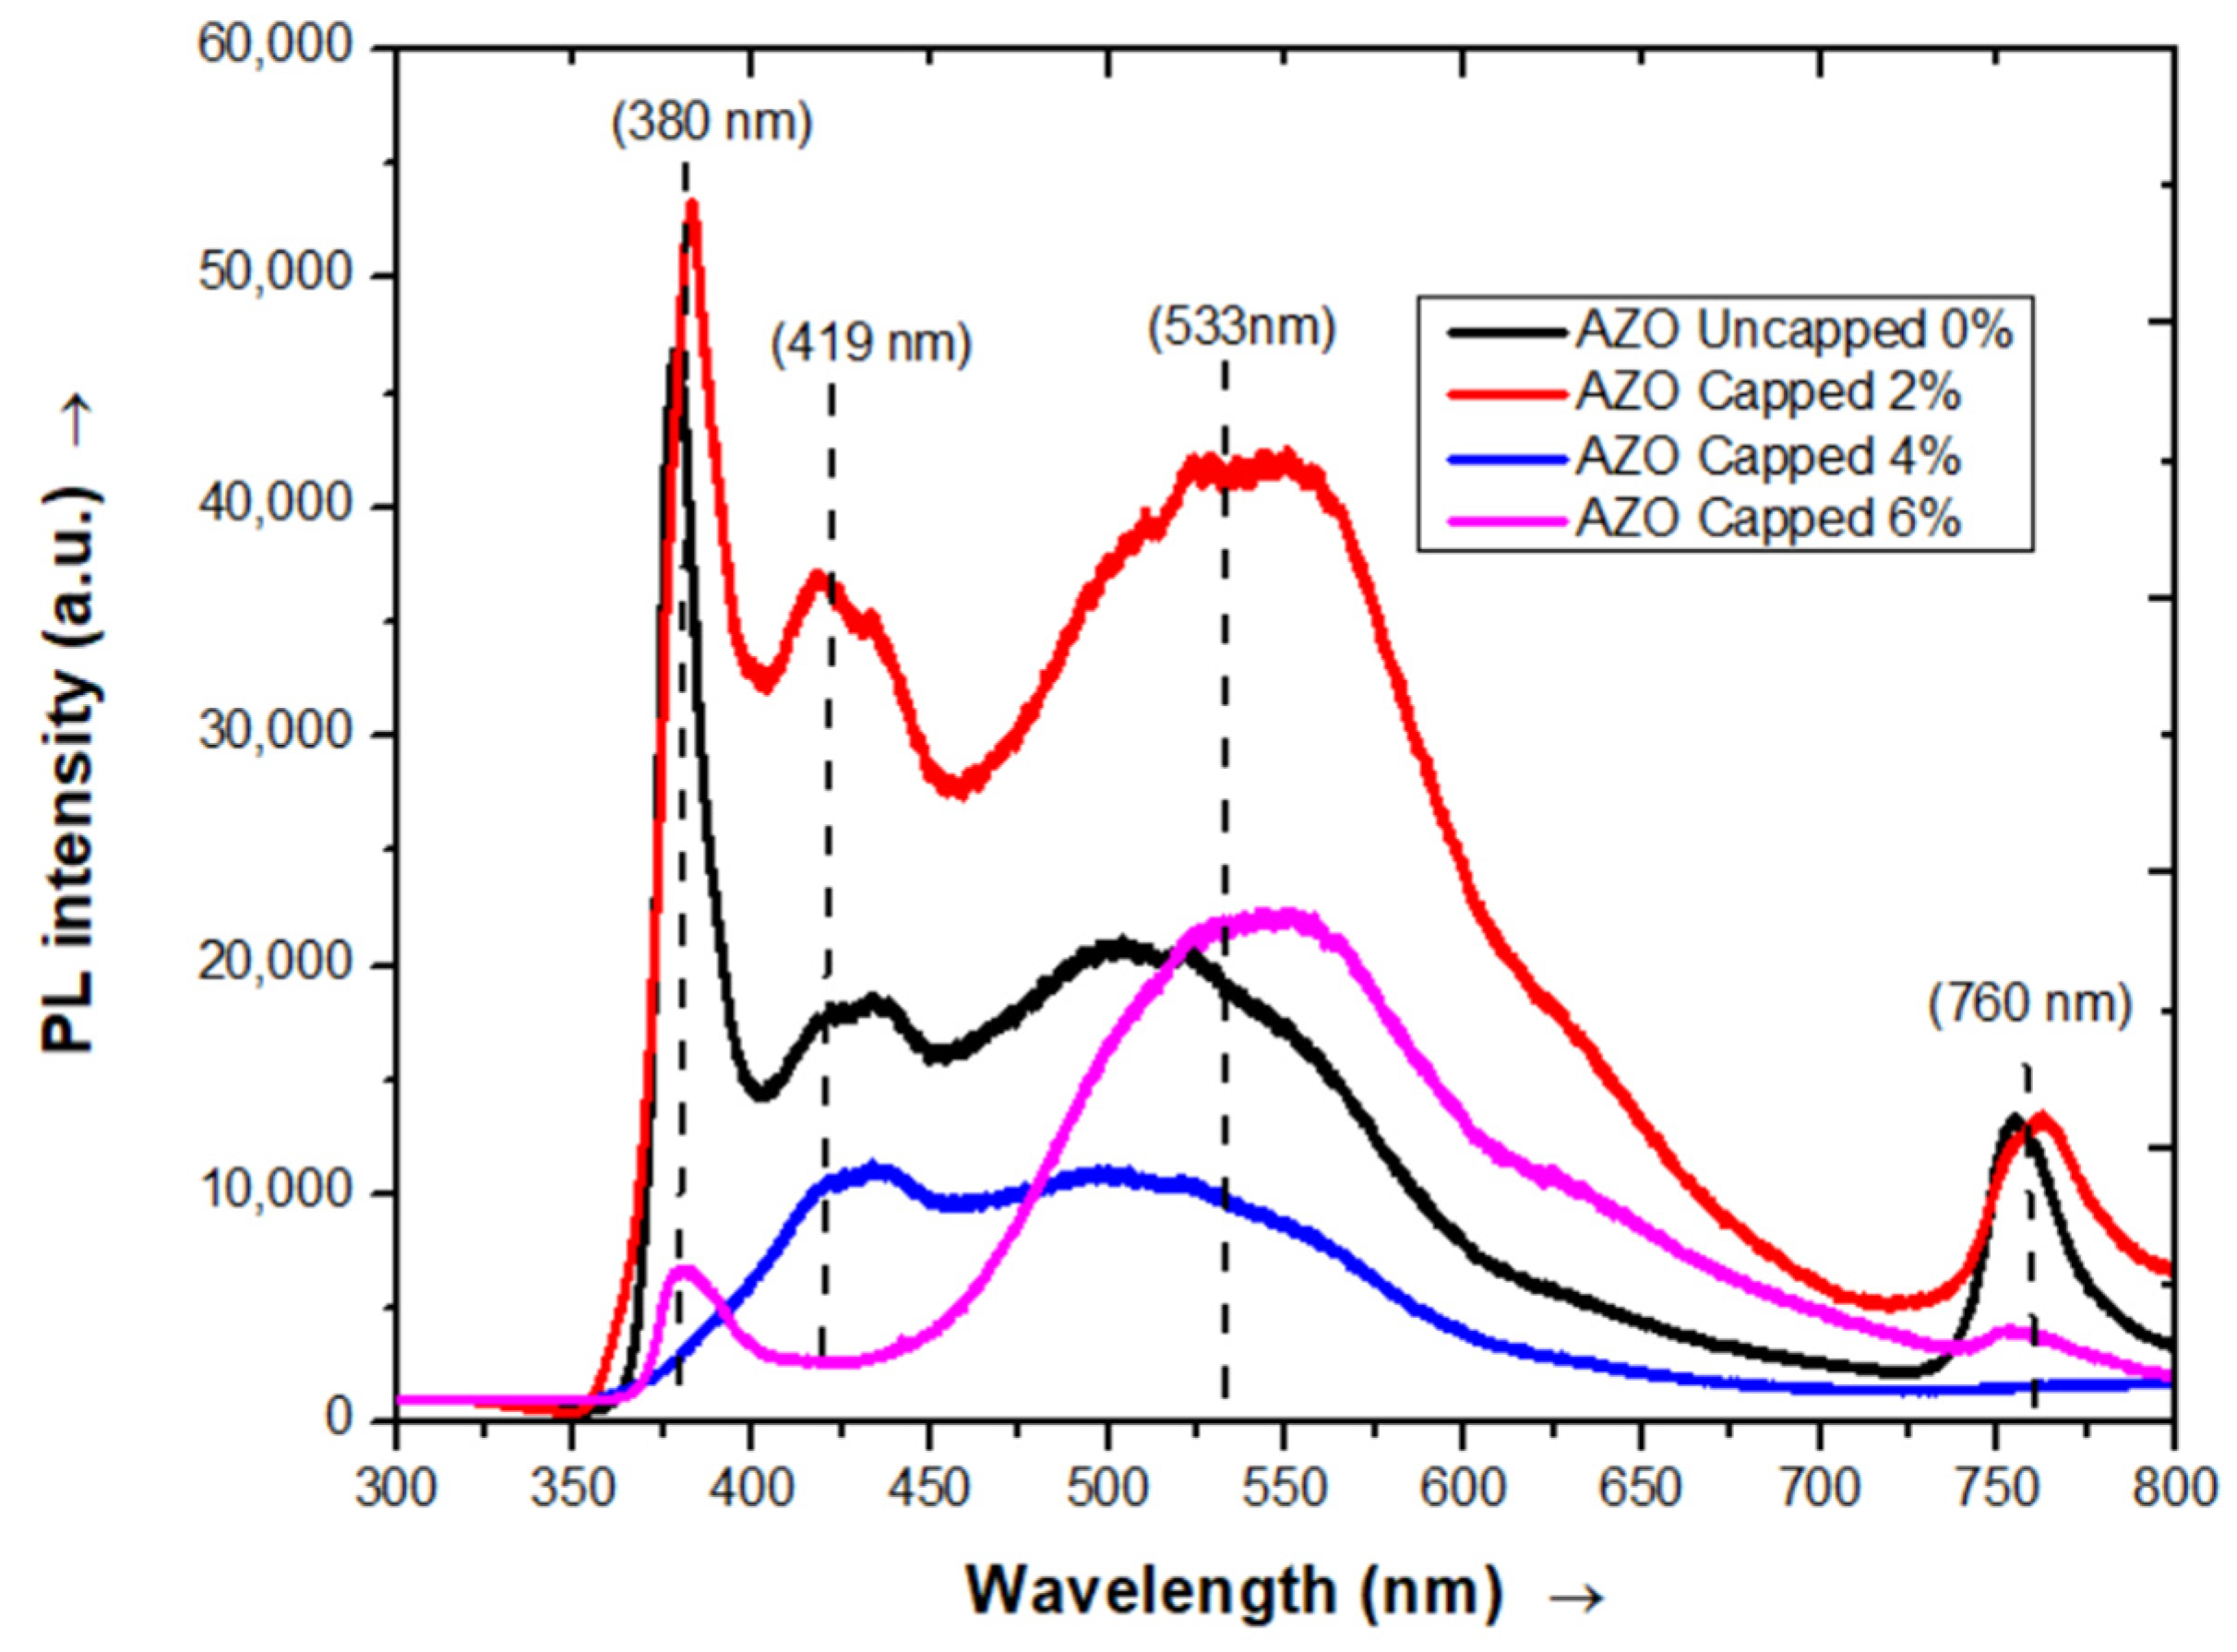
The PL properties of various kinds of AZO nanostructures demonstrated a relative intensity emission between the UV-visible emission, and therefore the point defects like oxygen deficiency within the crystalline structure of the fabric. This relative intensity is often observed in PL measurements. Figure 6 shows the photoluminescence spectra of AZO nanopowder, deposited at 500 °C, with capping and different atomic concentrations. Thus, to enhance the luminescence within the visible region, aluminum as a doping agent with different atomic concentrations (0%, 2%, 4%, and 6%) has been used in this study. Our aim is to optimize Al3+ ion concentration in the AZO sample. We have noted that by adding aluminum, there is a change in the photoluminescence PL peak intensity. The PL spectrum obtained for the pure and capped AZO nanopowder with different Al concentrations shows four main emissions at λ = 380, 419, 533, and 760 nm. The UV emission peak at 380 nm corresponds to the near band-edge (NBE) emission of AZO, and is thanks to the radiative recombination of free excitons [50]. The intensity of UV emission was found to decrease with the concentration of aluminum, and may be associated with the decrease in the size of the particles, beyond which intensity diminishes. Size reduction causes more atoms to be closer to the surface and thereby increases the speed of trapping of photo-generated holes at the surface, which successively enhances the emission intensity [51].
The other blue-green emission was observed to be located at λ = 419 nm, which is also typical in AZO material, showing the presence of sub-band transition. There is no valid luminescent center description for this particular emission. According to [52], this peak would correspond to a defect-related luminescence. Photoluminescence spectra reveal that for all the samples, visible emission is observed at the green region (∼533 nm) with the rise in capped Al concentration, which shows the emission band at the yellow region (∼570 nm). The radiative recombination of localized electrons with deeply trapped holes within the oxygen interstitials located at 2.14 and 2.2 eV below the conduction band leads to green luminescence (GL) and yellow luminescence (YL) bands, respectively [53]. Also, it has often been concluded that the next concentration of aluminum will end in the shifting of defect levels to higher energies. For the visible peaks, we observe that for the pure and capped AZO (0%, 2%, 4%, and 6%) the PL intensity increases by adding aluminum, especially for the red emission, as shown within the band diagram in Figure 5. The intensity of the UV peak is higher for the capped and doped samples, especially for the ZnO at 2% Al. The rise of UV emission corresponds to the engineered crystal quality and defects. This confirms the doping effect on the crystalline nanopowder for potential low-cost ZnO-based devices. AZO, being an n-type semiconductor, can be used as electrodes in solar cells. Also, with low-cost sol-gel synthesis, transparent, highly insoluble, thermally stable aluminum sources are made suitable for glass, optic, and ceramic applications.
4. Conclusions
The influence of Al on the structural and optical characteristics of ZnO was investigated in this paper. ZnO and AZO nanopowder with different molar ratios of Al (0, 2, 4, and 6 mol. percent) were successfully fabricated by a low-cost sol-gel process. The crystallite sizes of all samples were estimated by using Scherrer’s equation and were in the nanometer range. It would be intriguing to first prepare Al-doped ZnO with nanometer-sized particles and then compare the characteristics of ZnO with Al–ZnO nanopowders made with different molar ratios of Al (0, 2, 4, and 6 mol%). The optical properties of the samples were determined by UV-visible spectrophotometer and PL. The average crystallite size was between 14.19 nm to 34.17 nm for pure ZnO at different temperatures. A slight decrease in the average crystallite size of AZO was observed in comparison to the pure ZnO. The average crystallite size was between 35.05–18.89 nm for AZO nanopowder. The band gap energy of pure ZnO was nearly 3.10 eV. The doped samples exhibited better optical properties in comparison with pure ZnO. A slight decrease in the band gap energies of AZO was observed in comparison to the pure ZnO. The decrease in the band gap of the doped samples shows that the samples could be used in a number of optical applications ranging from bio-sensing, photovoltaics, optoelectronics, photonics, and solar cell. The rise in UV emission corresponds to the engineered crystal quality and defects. This confirms the doping effect on the crystalline nanopowder for potential low-cost ZnO-based luminescent devices.
Author Contributions
Conceptualization, D.P.; Formal analysis, D.P. and P.N.M.; Investigation, P.K.M.; Writing—original draft, P.K.M.; Writing—review & editing, D.P. and P.N.M. All authors have read and agreed to the published version of the manuscript.
Funding
This research received no external funding.
Data Availability Statement
Not applicable.
Conflicts of Interest
The authors declare no conflict of interest in the collection, analyses, or interpretation of data; in the writing of the manuscript; or in the decision to publish the results.
Abbreviations
The following abbreviations are used in this manuscript:
| ZnO | Zinc oxide |
| AZO | Aluminum doped zinc oxide |
| XRD | X-ray diffraction |
| UV | Ultraviolet characterization |
| PL | Photoluminescence |
| NBE | Near band-edge |
| UV-VIS | Ultraviolet-visible |
References
- Shrisha, B.V.; Bhat, S.; Kushavah, D.; Gopalakrishna Naik, K. Hydrothermal growth and characterization of Al-doped ZnO nanorods. Mater. Today Proc. 2016, 3, 1693–1701. [Google Scholar] [CrossRef]
- Klingshirn, C.F.; Waag, A.; Hoffmann, A.; Geurts, J. Zinc oxide: From fundamental properties towards novel applications. SS Mater. 2010, 120, 233–266. [Google Scholar]
- Nurfani, E.; Lailani, A.; Kesuma, W.; Anrokhi, M.; Kadja, G.; Rozana, M. UV sensitivity enhancement in Fe-doped ZnO films grown by ultrafast spray pyrolysis. Opt. Mater. 2021, 112, 110768. [Google Scholar] [CrossRef]
- Shahedi, Z.; Jafari, M.R. Synthesis Al complex and investigating effect of doped ZnO nanoparticles in the electrical and optical efficiency of OLEDS. Appl. Phys. A 2017, 123, 98. [Google Scholar] [CrossRef]
- Varudkar, H.; Umadevi, G.; Nagaraju, P.; Dargad, J.; Mote, V. Fabrication of Al-doped ZnO nanoparticles and their application as a semiconductor-based gas sensor for the detection of ammonia. J. Mater. Sci. Mater. Electron. 2020, 31, 12579–12585. [Google Scholar] [CrossRef]
- Raghu, P.; Srinatha, N.; Naveen, C.; Mahesh, H.; Angadi, B. Investigation on the effect of Al concentration on the structural, optical and electrical properties of spin coated Al: ZnO thin films. J. Alloys Compd. 2017, 694, 68–75. [Google Scholar] [CrossRef]
- Li, Y.; Liao, C.; Tjong, S.C. Recent advances in zinc oxide nanostructures with antimicrobial activities. Int. J. Mol. Sci. 2020, 21, 8836. [Google Scholar] [CrossRef] [PubMed]
- Oprea, O.; Vasile, O.; Voicu, G.; Andronescu, E. The influence of the thermal treatment on luminescence properties of ZnO. Dig. J. Nanomater. Biostructures (DJNB) 2013, 8, 747–756. [Google Scholar]
- Chang, J.S.; Phuan, Y.W.; Chong, M.N.; Ocon, J.D. Exploration of a novel Type II 1D-ZnO nanorods/BiVO4 heterojunction photocatalyst for water depollution. J. Ind. Eng. Chem. 2020, 83, 303–314. [Google Scholar] [CrossRef]
- Chen, L.-C.; Tien, C.-H. The influence of hydrogen gas treatment on the characteristics of ZnO films. Open Crystallogr. J. 2009, 2, 11–14. [Google Scholar] [CrossRef]
- Tonto, P.; Mekasuwandumrong, O.; Phatanasri, S.; Pavarajarn, V.; Praserthdam, P. Preparation of ZnO nanorod by solvothermal reaction of zinc acetate in various alcohols. Ceram. Int. 2008, 34, 57–62. [Google Scholar] [CrossRef]
- Chang, J.S.; Strunk, J.; Chong, M.N.; Poh, P.E.; Ocon, J.D. Multi-dimensional zinc oxide (ZnO) nanoarchitectures as efficient photocatalysts: What is the fundamental factor that determines photoactivity in ZnO? J. Hazard. Mater. 2020, 381, 120958. [Google Scholar] [CrossRef]
- Al Asmar, R.; Atanas, J.; Ajaka, M.; Zaatar, Y.; Ferblantier, G.; Sauvajol, J.; Jabbour, J.; Juillaget, S.; Foucaran, A. Characterization and Raman investigations on high-quality ZnO thin films fabricated by reactive electron beam evaporation technique. J. Cryst. Growth 2005, 279, 394–402. [Google Scholar] [CrossRef]
- Oprea, O.; Vasile, O.; Voicu, G.; Craciun, L.; Andronescu, E. Photoluminescence, Magnetic Properties and Photocatalytic Activity of Gd 3+ Doped Zno Nanoparticles. Dig. J. Nanomater. Biostructures (DJNB) 2012, 7, 1757–1766. [Google Scholar]
- Singh, N.; Kaur, D.; M Mehra, R.; Kapoor, A. Effect of ageing in structural properties of ZnO nanoparticles with ph variation for application in solar cells. Open Renew. Energy J. 2012, 5, 15–18. [Google Scholar] [CrossRef]
- Wu, J.J.; Liu, S.C. Low-temperature growth of well-aligned ZnO nanorods by chemical vapor deposition. Adv. Mater. 2002, 14, 215–218. [Google Scholar] [CrossRef]
- Baruah, S.; Dutta, J. Hydrothermal growth of ZnO nanostructures. Sci. Technol. Adv. Mater. 2009, 10, 013001. [Google Scholar] [CrossRef]
- Voicu, G.; Oprea, O.; Vasile, B.; Andronescu, E. Photoluminescence and photocatalytic activity of Mn-doped Zno nanoparticles. Dig. J. Nanomater. Biostructures (DJNB) 2013, 8, 667–675. [Google Scholar]
- Wahab, R.; Ansari, S.; Kim, Y.S.; Dar, M.; Shin, H.-S. Synthesis and characterization of hydrozincite and its conversion into zinc oxide nanoparticles. J. Alloys Compd. 2008, 461, 66–71. [Google Scholar] [CrossRef]
- Sharma, A.; Pathak, D.; Patil, D.S.; Dhiman, N.; Bhullar, V.; Mahajan, A. Electrospun PVP/TiO2 nanofibers for filtration and possible protection from various viruses like COVID-19. Technol. 2021, 9, 89. [Google Scholar] [CrossRef]
- Ghrib, T.; Massoudi, I.; Al-Otaibi, A.L.; Al-Malki, A.; Kharma, A.; Al-Hashem, E.; Al-Ghamdi, R.A.; Al-Zuraie, R.A. Effects of Terbium Doping on Structural, Optical and Photocatalytic Properties of ZnO Nanopowder Prepared by Solid-State Reaction. J. Inorg. Organomet. Polym. Mater. 2021, 31, 239–250. [Google Scholar] [CrossRef]
- He, H.; Yang, Q.; Wang, J.; Ye, Z. Layer-structured ZnO nanowire arrays with dominant surface-and acceptor-related emissions. Mater. Lett. 2011, 65, 1351–1354. [Google Scholar] [CrossRef]
- Liu, C.-P.; Wang, R.-C.; Kuo, C.-L.; Liang, Y.-H.; Chen, W.-Y. Recent patents on fabrication of nanowires. Recent Pat. Nanotechnol. 2007, 1, 11–20. [Google Scholar] [CrossRef]
- Huang, N.; Zhu, M.; Gao, L.; Gong, J.; Sun, C.; Jiang, X. A template-free sol–gel technique for controlled growth of ZnO nanorod arrays. Appl. Surf. Sci. 2011, 257, 6026–6033. [Google Scholar] [CrossRef]
- Sangpour, P.; Roozbehi, M.; Akhavan, O.; Moshfegh, A. ZnO nanowires from nanopillars: Influence of growth time. Curr. Nanosci. 2009, 5, 479–484. [Google Scholar] [CrossRef]
- Jia, G.; Wang, Y.; Yao, J. Fabrication and optical properties of well-aligned ZnO nanorods on sapphire prepared by chemical bath deposition. Dig. J. Nanomater. Biostructures 2012, 7, 261–267. [Google Scholar]
- Sharma, M.; Gayen, R.; Pal, A.; Kanjilal, D.; Chatterjee, R. Single phase formation of Fe-doped directional ZnO nanorod films: Study of cluster formation by complex impedance spectroscopy and removal of metal clustering by swift heavy ion irradiation. Nucl. Instrum. Methods Phys. Res. Sect. B Beam Interact. Mater. At. 2020, 467, 73–79. [Google Scholar] [CrossRef]
- Singh, J.; Kumar, P.; Late, D.; Singh, T.; More, M.; Joag, D.; Tiwari, R.; Hui, K.S.; Hui, K.; Srivastava, O. Optical and field emission properties in different nanostructures of ZnO. Dig. J. Nanomater. Bios 2012, 7, 795–806. [Google Scholar]
- Hashim, A.; Jaafar, M.; Ghazai, A.J.; Ahmed, N. Fabrication and characterization of tetraleg zinc oxide nanostruture using evaporation methode. Digest J. Nanomater. Biostructures 2012, 7, 487–491. [Google Scholar]
- Kou, H.; Zhang, X.; Du, Y.; Ye, W.; Lin, S.; Wang, C. Electrochemical synthesis of ZnO nanoflowers and nanosheets on porous Si as photoelectric materials. Appl. Surf. Sci. 2011, 257, 4643–4649. [Google Scholar] [CrossRef]
- Mikailzade, F.; Türkan, H.; Önal, F.; Karataş, Ö.; Kazan, S.; Zarbali, M.; Göktaş, A.; Tumbul, A. Structural, optical and magnetic characterization of nanorod-shaped polycrystalline Zn1−xMnxO films synthesized using sol–gel technique. Appl. Phys. A 2020, 126, 768. [Google Scholar] [CrossRef]
- Worku, A.K.; Ayele, D.W.; Habtu, N.G.; Melas, G.A.; Yemata, T.A.; Mekonnen, N.Y.; Teshager, M.A. Structural and thermal properties of pure and chromium doped zinc oxide nanoparticles. SN Appl. Sci. 2021, 3, 699. [Google Scholar] [CrossRef]
- Mouzaia, F.; Djouadi, D.; Chelouche, A.; Hammiche, L.; Touam, T. Particularities of pure and Al-doped ZnO nanostructures aerogels elaborated in supercritical isopropanol. Arab. J. Basic Appl. Sci. 2020, 27, 423–430. [Google Scholar] [CrossRef]
- Diguna, L.J.; Fitriani, A.D.; Liasari, B.R.; Timuda, G.E.; Widayatno, W.B.; Wismogroho, A.S.; Zeng, S.; Birowosuto, M.D.; Amal, M.I. Optical and Photodetection Properties of ZnO Nanoparticles Recovered from Zn Dross. Crystals 2021, 11, 6. [Google Scholar] [CrossRef]
- Mishra, P.N.; Pathak, D.; Mishra, P.K.; Kumar, V. Low-cost processing of pure and Al-doped capped ZnO nano powder for industry scale applications. Chalcogenide Lett. 2022, 19, 19–31. [Google Scholar] [CrossRef]
- Akhoondi, A.; Sharma, A.; Pathak, D.; Yusuf, M.; Demissie, T.B.; Guo, R.-t.; Ali, A. Hydrogen evolution via noble metals based photocatalysts: A review. Synth. Sinter. 2021, 1, 223–241. [Google Scholar] [CrossRef]
- T Chen, K.J.; Fang, T.H.; Hung, F.Y.; Ji, L.W.; Chang, S.J.; Young, S.J.; Hsiao, Y.J. The crystallization and physical properties of Al-doped ZnO nanoparticles. Appl. Surf. Sci. 2008, 254, 5791–5795. [Google Scholar] [CrossRef]
- Bedi, R.K.; Pathak, D.; Deepak; Kaur, D. Structural and optical properties of AgInSe2 films. Z. Kristallogr. Suppl. 2008, 27, 177–183. [Google Scholar] [CrossRef]
- Goh, E.; Xu, X.; McCormick, P. Effect of particle size on the UV absorbance of zinc oxide nanoparticles. Scr. Mater. 2014, 78, 49–52. [Google Scholar] [CrossRef]
- Umar, A.; Rahman, M.; Vaseem, M.; Hahn, Y.-B. Ultra-sensitive cholesterol biosensor based on low-temperature grown ZnO nanoparticles. Electrochem. Commun. 2009, 11, 118–121. [Google Scholar] [CrossRef]
- Zhao, L.; Lian, J.; Liu, Y.; Jiang, Q. Structural and optical properties of ZnO thin films deposited on quartz glass by pulsed laser deposition. Appl. Surf. Sci. 2006, 252, 8451–8455. [Google Scholar] [CrossRef]
- Hu, Y.; Lin, C.; Huang, J.-C.A. Dependences of the Al thickness and annealing temperature on the structural, optical and electrical properties in ZnO/Al multilayers. Thin Solid Film. 2006, 497, 130–134. [Google Scholar] [CrossRef]
- Filipponi, L.; Sutherland, D.; Center, I.N. Introduction to nanoscience and nanotechnologies. Nanoyou Teach. Train. Kit Nanosci. Nanotechnol. 2010, 188, 1–29. [Google Scholar]
- Rashid, A.R.A.; Hazwani, T.N.; Mukhtar, W.M.; Taib, N.A.M. Influence of annealing temperature on optical properties of Al doped ZnO nanoparticles via sol-gel methods. AIP Conf. Proc. 2018, 1972, 030006. [Google Scholar]
- Azizah, N.m.; Muhammady, S.; Purbayanto, M.A.K.; Nurfani, E.; Winata, T.; Sustini, E.; Widita, R.; Darma, Y. Influence of Al doping on the crystal structure, optical properties, and photodetecting performance of ZnO film. Prog. Nat. Sci. Mater. 2020, 30, 28–34. [Google Scholar] [CrossRef]
- Bao, D.; Yao, X.; Shinozaki, K.; Mizutani, N. Growth and electrical properties of Pb (Zr, Ti) O3 thin films by a chemical solution deposition method using zirconyl heptanoate as zirconium source. J. Cryst. Growth 2003, 259, 352–357. [Google Scholar] [CrossRef]
- Wang, X.; Ding, Y.; Summers, C.J.; Wang, Z.L. Large-scale synthesis of six-nanometer-wide ZnO nanobelts. J. Phys. Chem. B 2004, 108, 8773–8777. [Google Scholar] [CrossRef]
- Huang, M.H.; Wu, Y.; Feick, H.; Tran, N.; Weber, E.; Yang, P. Catalytic growth of zinc oxide nanowires by vapor transport. Adv. Mater. 2001, 13, 113–116. [Google Scholar] [CrossRef]
- Williams, G.; Kamat, P.V. Graphene—Semiconductor nanocomposites: Excited—State interactions between ZnO nanoparticles and graphene oxide. Langmuir 2009, 25, 13869–13873. [Google Scholar] [CrossRef]
- Teke, A.; Özgür, Ü.; Doğan, S.; Gu, X.; Morkoç, H.; Nemeth, B.; Nause, J.; Everitt, H.O. Excitonic fine structure and recombination dynamics in single-crystalline ZnO. Phys. Rev. B 2004, 70, 195207. [Google Scholar] [CrossRef]
- Kumar, V.B.; Kumar, K.; Gedanken, A.; Paik, P. Facile synthesis of self-assembled spherical and mesoporous dandelion capsules of ZnO: Efficient carrier for DNA and anti-cancer drugs. J. Mater. Chem. B 2014, 2, 3956–3964. [Google Scholar] [CrossRef] [PubMed]
- Vanheusden, K.; Seager, C.; Warren, W.t.; Tallant, D.; Voigt, J. Correlation between photoluminescence and oxygen vacancies in ZnO phosphors. Appl. Phys. Lett. 1996, 68, 403–405. [Google Scholar] [CrossRef]
- Studenikin, S.; Golego, N.; Cocivera, M. Fabrication of green and orange photoluminescent, undoped ZnO films using spray pyrolysis. J. Appl. Phys. 1998, 84, 2287–2294. [Google Scholar] [CrossRef]
Figure 1.
UV-vis. absorption spectrum of pure and capped ZnO nanopowder with different temperatures.
Figure 1.
UV-vis. absorption spectrum of pure and capped ZnO nanopowder with different temperatures.

Figure 2.
Absorbance spectra and Energy band gaps of pure ZnO with different temperatures.

Figure 3.
UV-Vis. absorption spectrum of AZO nanopowder with different Al concentrations.

Figure 4.
Absorbance spectra and energy band gaps of pure and doped AZO with different concentrations.
Figure 4.
Absorbance spectra and energy band gaps of pure and doped AZO with different concentrations.
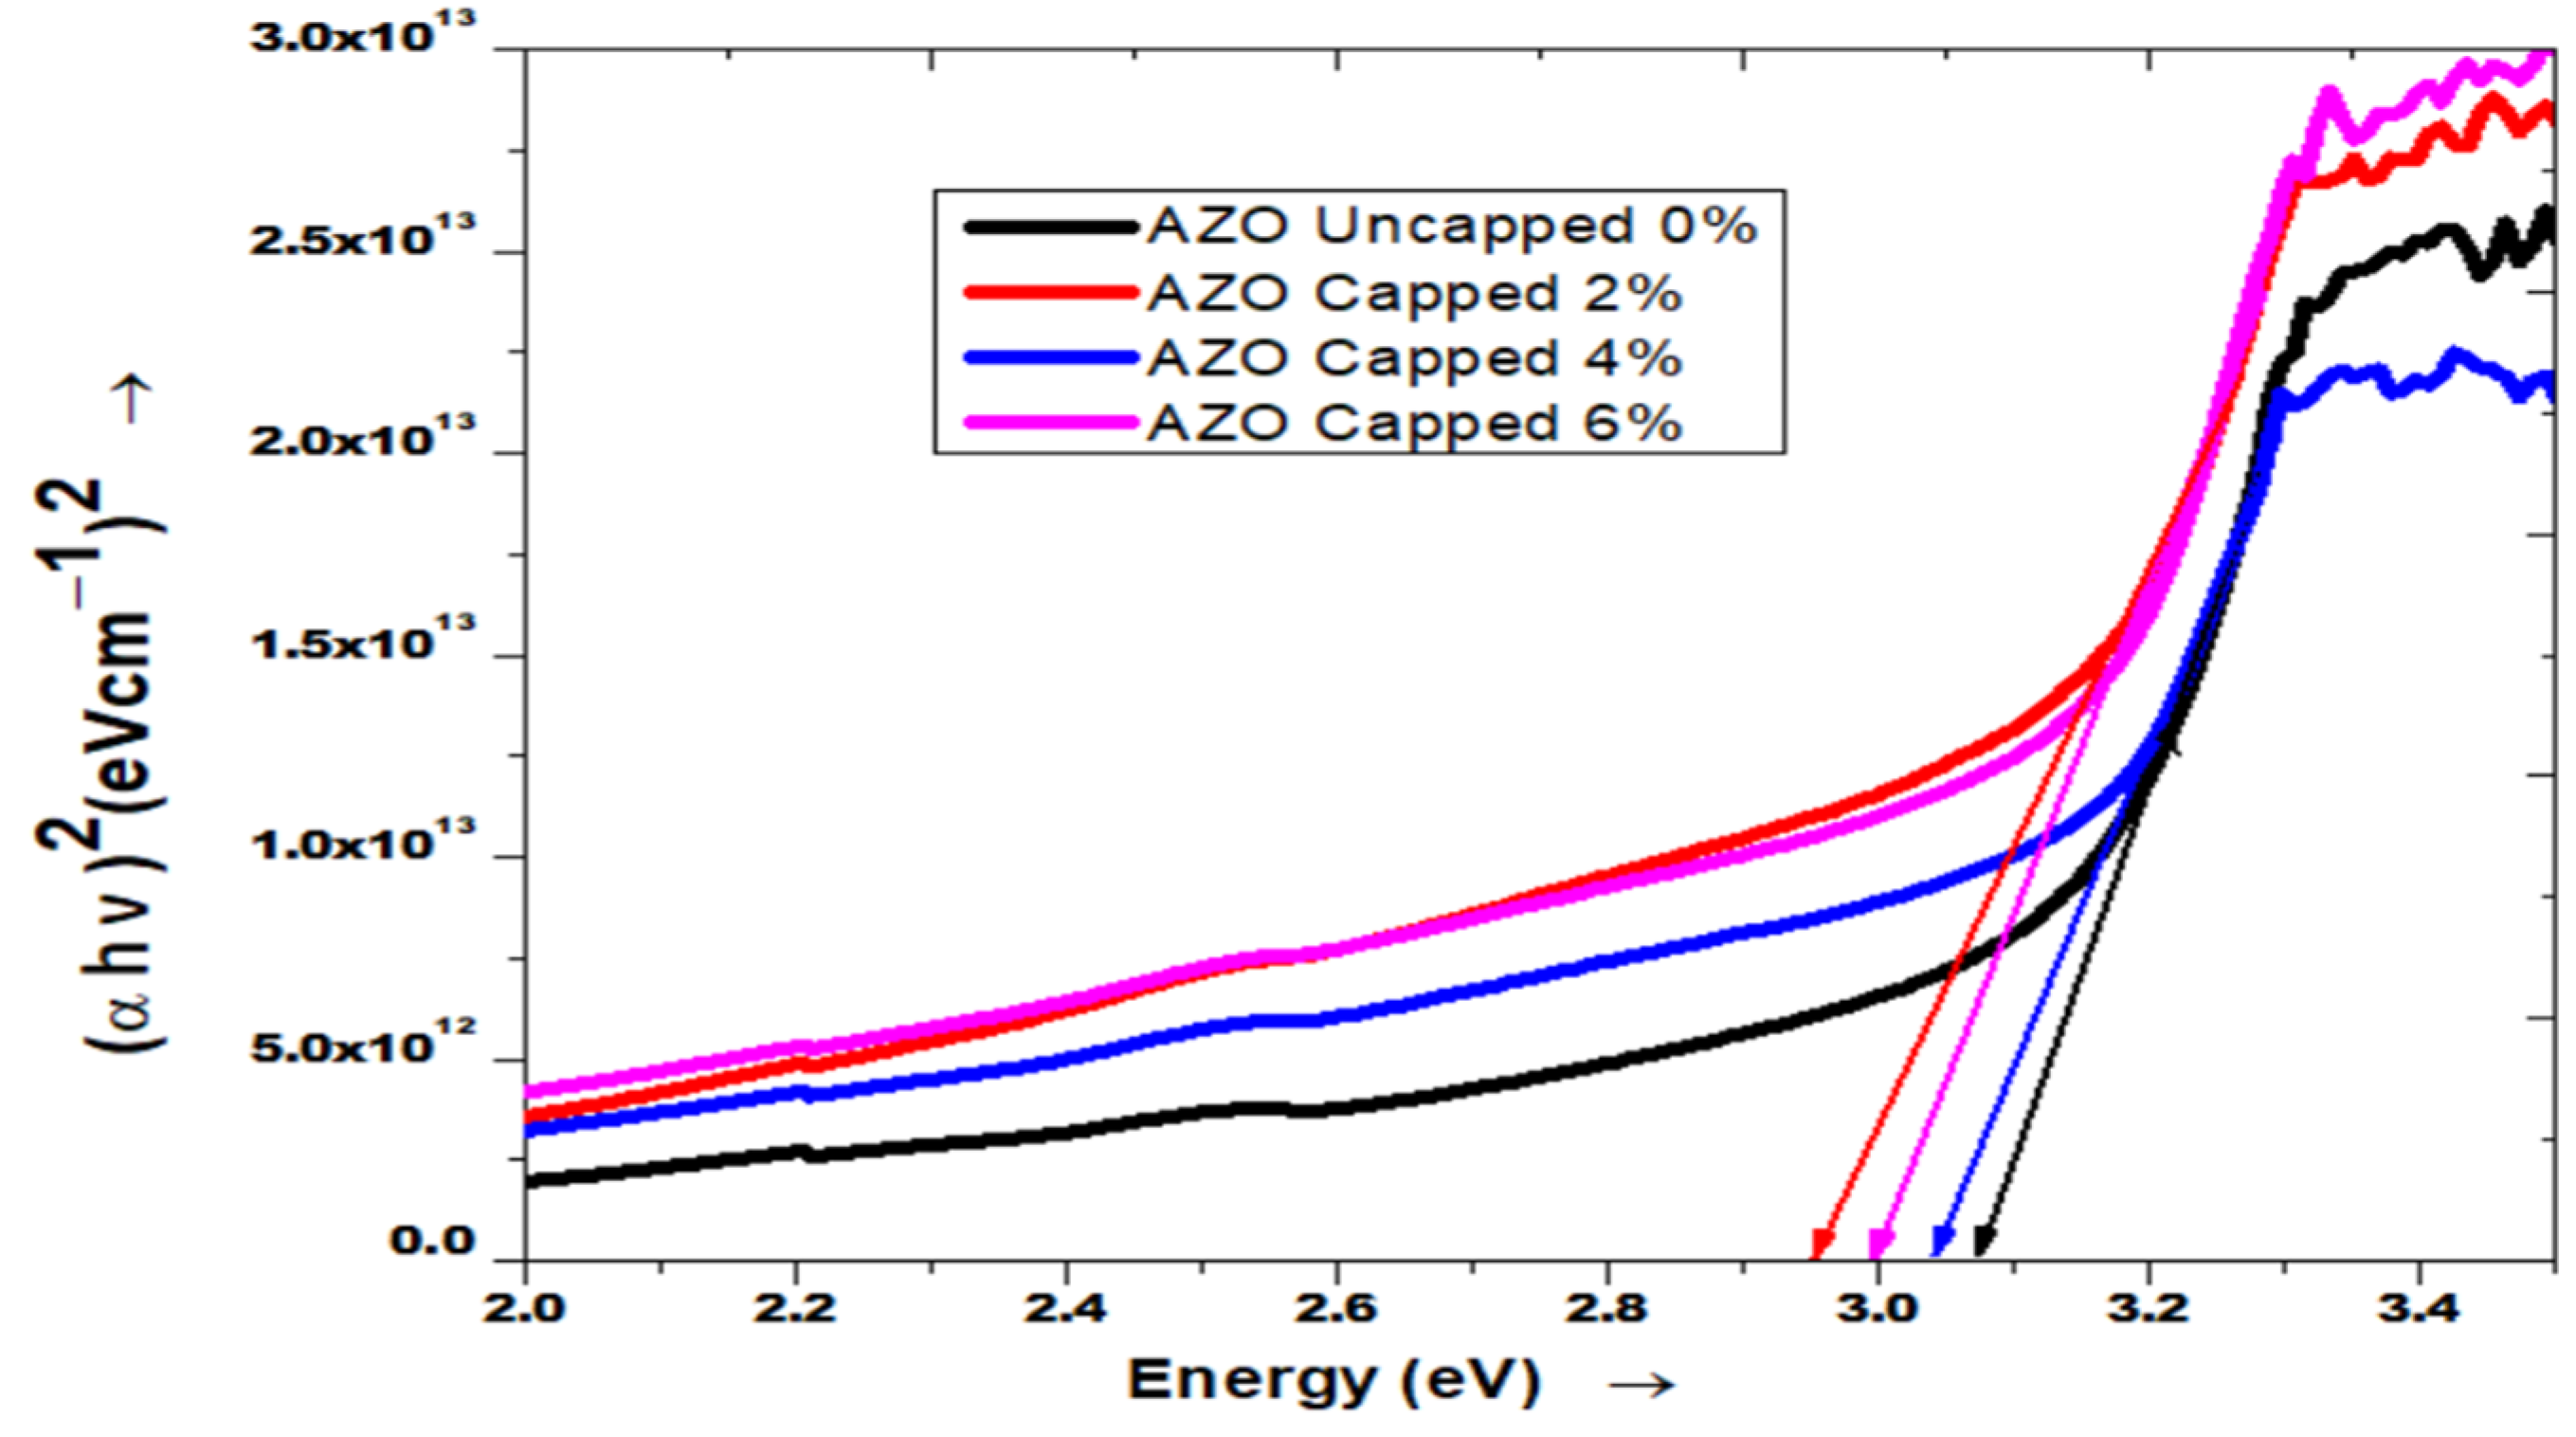
Figure 5.
Photoluminescence spectra of prepared pure and capped ZnO nanopowder with different temperatures.
Figure 5.
Photoluminescence spectra of prepared pure and capped ZnO nanopowder with different temperatures.

Figure 6.
Photoluminescence spectra of prepared pure and capped AZO nanopowder with different Al concentrations.
Figure 6.
Photoluminescence spectra of prepared pure and capped AZO nanopowder with different Al concentrations.


Table 1.
Variation in crystallite size and energy band gap of pure and capped ZnO at different temperatures.
Table 1.
Variation in crystallite size and energy band gap of pure and capped ZnO at different temperatures.
| Pure ZnO & Growth Temperature (°C) | Crystallite Size (nm) (From Scherrer Formula) | Band Gap (Eg) |
|---|---|---|
| Uncapped 500 | 14.19 | 2.97 |
| Capped 700 | 28.50 | 2.90 |
| Capped 750 | 34.17 | 2.84 |
Table 2.
Variation in crystallite size and energy band gap of AZO with different Al concentrations.
| Al Content (%) in AZO Nanopowder at 500 °C | Crystallite Size (nm) (From Scherer Formula) | Band Gap (eV) |
|---|---|---|
| 0% (Uncapped) | 35.05 | 3.10 |
| 2% (capped) | 24.03 | 3.02 |
| 4% (capped) | 24.57 | 3.08 |
| 6% (capped) | 18.89 | 3.09 |
Publisher’s Note: MDPI stays neutral with regard to jurisdictional claims in published maps and institutional affiliations. |
© 2022 by the authors. Licensee MDPI, Basel, Switzerland. This article is an open access article distributed under the terms and conditions of the Creative Commons Attribution (CC BY) license (https://creativecommons.org/licenses/by/4.0/).
Share and Cite
MDPI and ACS Style
Mishra, P.N.; Mishra, P.K.; Pathak, D. The Influence of Al Doping on the Optical Characteristics of ZnO Nanopowders Obtained by the Low-Cost Sol-Gel Method. Chemistry 2022, 4, 1136-1146. https://doi.org/10.3390/chemistry4040077
AMA Style
Mishra PN, Mishra PK, Pathak D. The Influence of Al Doping on the Optical Characteristics of ZnO Nanopowders Obtained by the Low-Cost Sol-Gel Method. Chemistry. 2022; 4(4):1136-1146. https://doi.org/10.3390/chemistry4040077
Chicago/Turabian StyleMishra, Pooja Nag, Pankaj Kumar Mishra, and Dinesh Pathak. 2022. "The Influence of Al Doping on the Optical Characteristics of ZnO Nanopowders Obtained by the Low-Cost Sol-Gel Method" Chemistry 4, no. 4: 1136-1146. https://doi.org/10.3390/chemistry4040077