Abstract
The properties of several hydrazon-diketone rotary switches with OH groups in the stators (2-(2-(2-hydroxy-4-nitrophenyl)hydrazono)-1-phenylbutane-1,3-dione, 2-(2-(2-hydroxyphenyl)hydrazono)-1-phenylbutane-1,3-dione and 2-(2-(4-hydroxyphenyl)hydrazono)-1-phenylbutane-1,3-dione) were investigated by molecular spectroscopy (UV-Vis and NMR), DFT calculations (M06-2X/TZVP) and X-ray analysis. The results show that, when the OH group is in ortho position, the E’ and Z’ isomers are preferred in DMSO as a result of a stabilizing intermolecular hydrogen bonding with the solvent. The availability, in addition, of a nitro group in para position increases the possibility of deprotonation of the OH group in the absence of water. All studied compounds showed a tendency towards formation of associates. The structure of the aggregates was revealed by theoretical calculation and confirmed by X-ray analysis.
1. Introduction
The hydrazone functional group has found extensive use in medicine [1,2,3,4,5,6], supramolecular chemistry (molecular switches and chelate ligands) [7,8,9,10] and in combinatory chemistry [11,12,13]. One important facet of hydrazine-group-containing compounds is the fact that upon appropriate substitution they can exist in solution as a mixture of isomers. 1,2,3-tricarbonyl-2-arylhydrazones are a typical example—they are presented in solution as an equilibrated mixture of intramolecularly H-bonded E and Z isomers [14,15,16]. The position of the isomerization equilibrium can be altered by catalytic amounts of acid or base. Upon external stimulation, a controlled switching between the isomers is possible through C-N bond rotation, giving the name “rotary switches”. The position of the equilibrium and the switching can be strongly affected by structural modifications, as has already been shown [17,18,19,20,21].
Recently, the spectral properties of 1 (Scheme 1 and Scheme 2) were studied in respect of the possible tautomerism and E/Z isomerization in solution [17,22]. The results show that the availability of the OH group in the stator does not lead to azo-hydrazone tautomerism as could be expected at a first glimpse. The compound exists as a mixture of isomers of the single ketohydrazone tautomer, as shown in Scheme 1. In DMSO, due to the specific stabilizing effect of the solvent, only the E’ and Z’ forms are presented [22,23]. Moreover, the availability of the OH group leads to some side effects, according to the spectral and crystallographic data [22,24]: compound 1 deprotonates at low concentrations in DMSO and aggregates at high concentrations (10−4 M and higher), forming linear (E’-E’) aggregates.
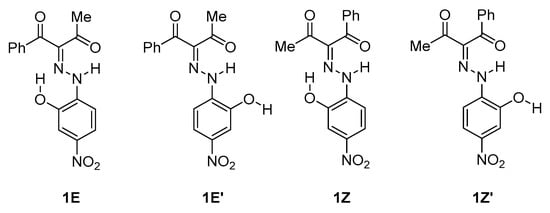
Scheme 1.
Conformational isomers of 1.
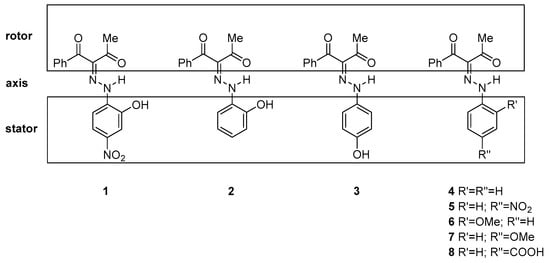
Scheme 2.
Sketch of the investigated compounds.
It is an interesting question whether the lack of tautomerism, the existence of the “ ‘ “ isomers (indicating E’ and Z’ forms) and the side effects could be attributed to the strong electron acceptor ability of the nitro group. To answer it, we have studied compounds 2 and 3, in which two effects could be clarified: the role of the existence of a nitro group (2 vs. 1) and of the position of the OH group by itself (2 vs. 3). A combined approach (theoretical calculation, UV-Vis and NMR investigations in solution, and X-ray analysis in solid state) was applied, and the results obtained are presented in the current communication. To best of our knowledge, no such comparative study of 1–3 has been performed before.
2. Results and Discussion
The 1,2,3-tricarbonyl-2-arylhydrazones are potentially tautomeric compounds even without an OH group in the stator. The possible tautomers include ketohydrazone, azoketone and azoenol forms, depending on the substitution [25]. The availability, in addition, of an ortho or para OH group in the stator makes the tautomeric situation even more complex. The possible tautomers of 2 are sketched in Scheme 3 as an example. Theoretical prediction of the stabilities of the individual forms is complicated by the large number of possible conformers. For instance, the tautomer I of 2 can be presented as 24 possible isomers (Scheme SI).
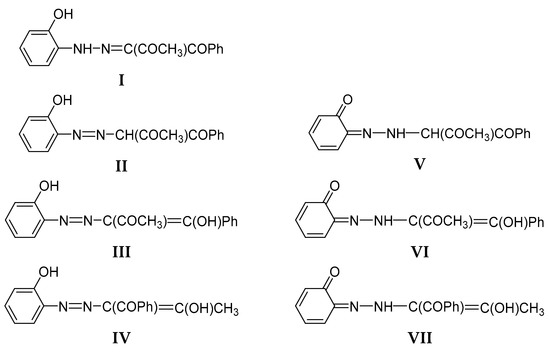
Scheme 3.
Sketch of the possible tautomeric forms of 2 (The same is valid for 1 and 3).
We have shown theoretically that, in the case of 1, only tautomer I could be present [22]. As shown in Table S1, the same conclusion can be drawn for 2 and 3. The theoretical calculations are in agreement with the NMR data in solution [22] and the recent crystallographic data [21]. In analogy, compounds 2 and 3 also should exist as the same single tautomeric form, stabilized as a mixture of E and Z conformers. The most stable isomers of 2 and 3, as predicted in DMSO as an environment, are shown in Figure 1 and Figure 2, respectively.
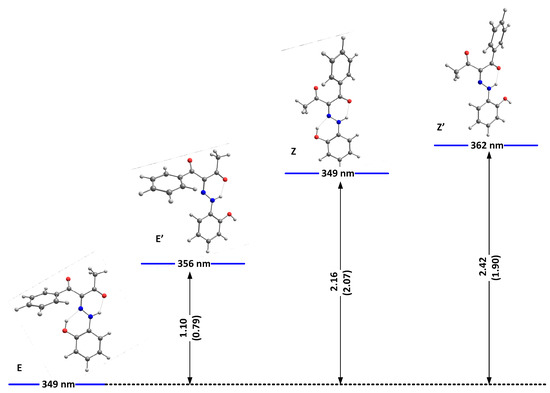
Figure 1.
Relative energies (in kcal/mole units) and predicted positions of the long-wavelength bands of the most stable isomers of 2(I) in DMSO. The corresponding relative energies for 1, taken from [24], are given in brackets.
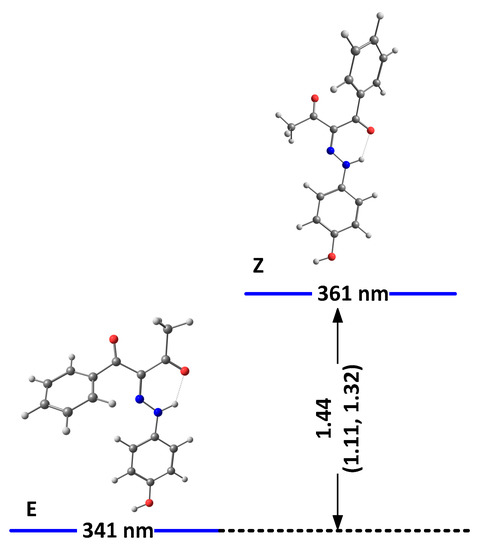
Figure 2.
Relative energies (in kcal/mole units) and predicted positions of the long-wavelength bands of the most stable isomers of 3(I) in DMSO. The corresponding relative energies for 5, taken from [24] and 4, are given in brackets.
As seen from the figures, the stabilization is a result of the strength of the formed intramolecular hydrogen bonds. While better proton-attracting ability of MeCO through the NH..OMe determines a better stabilization of the E isomer, additional stabilization through OH..N bonding makes the E/Z pairs more stable compared to E’/Z’ in 1 and 2. The effect of the nitro group in 1 leads to an overall weak stabilization in the E/Z forms and a more pronounced stability of the “ ‘ “ isomers. In the case of 3, the effect of the OH group is limited to a non-hydrogen bonding substituent and leads to stabilization of the Z isomer. The predicted stabilization effect in the series 5 [22], 4 and 3 follows the experimentally observed trend for a destabilization of the Z isomer (molar fractions of 15%, 10% and 5%, correspondingly) going from electron acceptor to electron donor substituents in para position in the stator [19]. Most probably, the absence of the OH..N hydrogen bonding in E’/Z’ of 2 and in 3 reduces the steric hindrance between the rotor and the stator, leading to an overall stabilization of the corresponding isomers.
The solvation model used so far describes the solvent as a dielectric medium and does not take into account the possible specific solute–solvent interactions. As known previously in the case of 1, the proton of the OH group interacts with proton-acceptor solvents (such as DMSO), when it is not involved in the intramolecular hydrogen bond with the rotor part, which leads to strong additional stabilization of the “ ‘ “ isomers. The model of this specific solvent effect is illustrated in Figure 3 and Figure 4, showing the most stable complexes with DMSO. As can be seen, the interaction between the solvent molecule and the free OH proton in E’ and Z’ leads to their stabilization. Moreover, in 2E and 2Z, there are no conditions for the formation of any OH..O = SMe2 hydrogen bond, and the formed NH…O = SMe2 is weak due to the low acidity of the NH proton and steric effect from adjacent functional groups (Figure 3). The changes in the case of 3 are caused by reducing the electron donor ability of the OH group and hence to a rise in the polarization of the N-H bond, leading finally to the stabilization of the Z isomer.
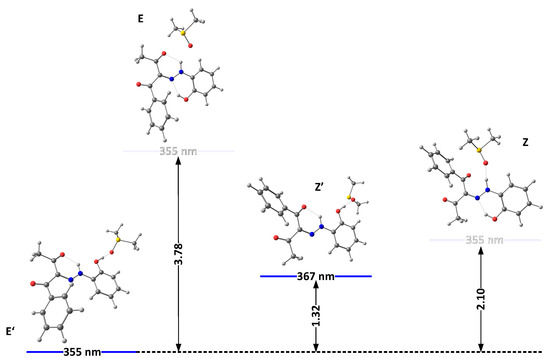
Figure 3.
Relative energies (in kcal/mole units) and predicted positions of the long-wavelength bands of the most stable isomers of 2(I) in DMSO, accounting for the specific solute–solvent interactions.
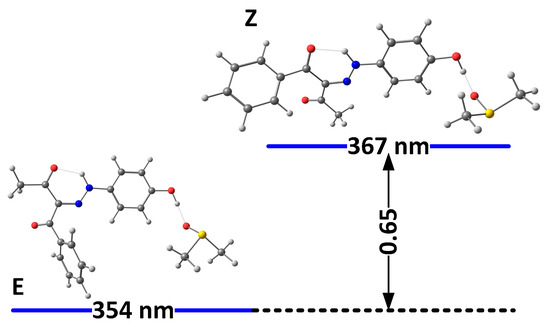
Figure 4.
Relative energies (in kcal/mole units) and predicted positions of the long-wavelength bands of the most stable isomers of 3(I) in DMSO, accounting for the specific solute–solvent interactions.
In addition to the relative stability of the isomers, the predicted positions of the long-wavelength bands in the absorption spectra are shown in Figure 1, Figure 2, Figure 3 and Figure 4 as well. The absolute values should be considered with care due to the systematic blue shift of the used M06-2X functional. The relative changes indicate, as expected, that it is practically impossible to distinguish between the most stable isomers by means of UV-Vis spectroscopy. The absorption spectra of 2 and 3, shown in Figure 5, indicate that there are no substantial changes in the spectral shape upon changing the solvent. This figure strongly supports the hypothesis, in analogy to 1; there is no tautomeric equilibrium, because the tautomers of 1–3 have different conjugated systems, and substantially different spectra could be expected upon changing the solvent [26]. It is seen that the observed long-wavelength absorption band consists of two sub-bands, whose intensity slightly varies with the solvent. They can be associated with the most stable isomers according to the theoretical predictions. However, the strong overlapping between them does not allow either precise estimation of the positions of the bands by derivative spectroscopy (Figure S1) nor a quantitative estimation of the isomers’ molar fractions [27].
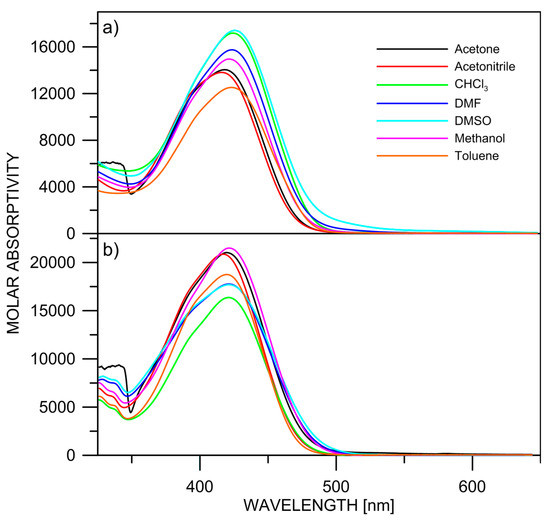
Figure 5.
Experimental absorption spectra of 2 (a) and 3 (b) in various solvents.
The conformational isomers existing in solution can be identified and quantified using NMR. Due to their low solubility in acetonitrile, the investigations were performed in DMSO-d6. The corresponding 1H NMR spectra of 2 and 3 in DMSO-d6 are shown in Figures S2 and S3. The data from the NMR measurements are summarized in Table 1. The obtained data for chemical shifts can be compared with those for 1 [22]. From the 1H NMR spectra of 2 and 3, it can be seen that, in both cases, two isomers are present in DMSO-d6. The chemical shifts in DMSO-d6 for NH for the major and minor form of 2 are at 14.55 ppm and 12.62 ppm, and for 3 at 14.48 ppm and 11.42 ppm. Based on the NH signals, the ratio between the isomers is 80%/20% and 45%/55%, respectively for 2 and 3 (65%/35% for 1), which corresponds to ∆G values (RT) of 0.36, 0.82 and −0.11 kcal/mol for 1–3.

Table 1.
1H and 13C chemical shiftsf of the major form (minor form) of 1, 2 and 3 in DMSO-d6.
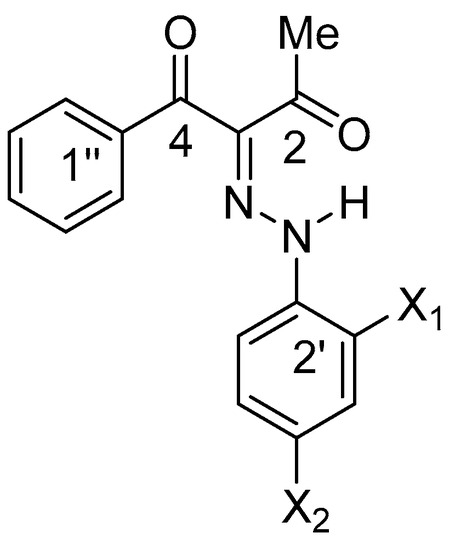
Scheme 4.
Numbering of the carbon atoms in 1 (X1=OH, X2=NO2), 2 (X1=OH, X2=H) and 3 (X1=H, X2=OH).
In analogy to 1 [22,24] and following the theoretically predicted relative stabilization, it can be concluded that in DMSO there is an equilibrium between E’ (major) and Z’ (minor) forms in 2 and between E and Z of 3. The theoretically predicted values for the chemical shifts of the NH proton of the major and minor form at 2 and 3, respectively, are 14.61 ppm (2E’) and 13.67 ppm (2Z’) and 14.51 ppm (3E) and 13.44 ppm (3Z), i.e., the theoretical results are consistent with the experimental ones. Although the NMR determined Gibb’s free energies are lower comparing the predicted relative energies (∆E), the latter correctly predict the general trend of stabilization of the Z’ isomers (3 > 1 > 2) with a good linearity (∆G = 1.28 × ∆E − 0.98, R2 = 0.92).
Three additional factors influence the conformational equilibrium in 2 and 3 in solution, namely the temperature, the concentration and the water content of the used solvent. As previously shown in the case of 1, a spontaneous deprotonation (loss of OH proton) occurs in diluted solutions of dry proton acceptor solvents [22], leading to a new red-shifted band. Actually, 1 is almost fully deprotonated in dry DMSO (Figure S4), while, as seen in Figure 5, deprotonation in 2 is weak and negligible in 3. Obviously, the effect of the nitro group is decisive in this case. Upon addition of water, the equilibrium is fully shifted towards the neutral isomers (Figure S5). According to the theoretical calculations (Table S2), deprotonation does not substantially change the isomers’ ratios.
The concentration is an essential factor determining the deprotonation of the investigated compounds. In 2, as in 1, the increase in the concentration leads to a decrease in the content of the deprotonated form, as shown in Figure 6. No such effect is observed in 3.
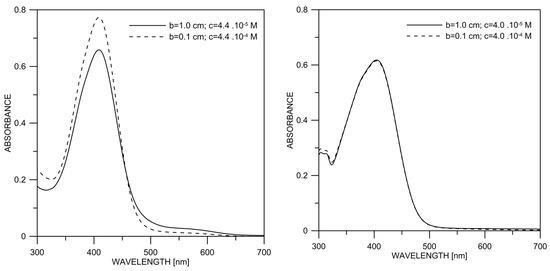
Figure 6.
Experimental absorption spectra of 2 (left) and 3 (right) in DMSO as a function of the concentration, keeping the cell thickness (b) × concentration (c) constant.
The results above indicate that the association is a possible reason for the observed changes. The theoretical calculations and X-ray data (Figure 7 and Scheme 5) suggest that cyclic aggregates are formed in the case of 2. In the solid state, compound 2 exists as an E’ conformer, stabilized via a cyclic dimer. The major difference with 1 is in the shape of the aggregate—again, the E’ form is stabilized in 1, but in form of a linear aggregate [24]. The stability of the E’-E’ cyclic dimer in 2 is probably due to the stronger proton acceptor properties of the CH3CO group compared to the PhCO moiety of 1. The formation of aggregates, as in 1 [22,24], limits the deprotonation, which explains the observed concentration effects.
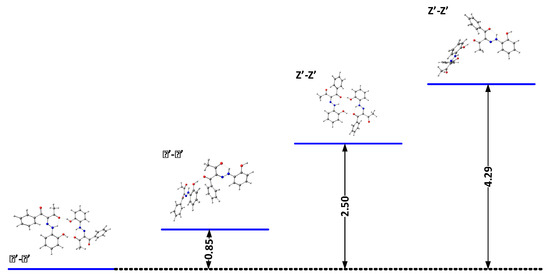
Figure 7.
Relative energies (in kcal/mol) of the most stable dimers of 2 in DMSO.
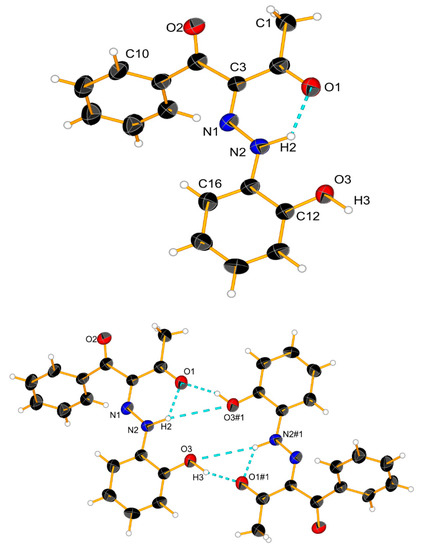
Scheme 5.
Crystal structure of 2 and a cyclic dimer model via an intermolecular hydrogen bond. Ellipsoids are drawn with a probability of 50% and H-bonds are represented as dashed blue lines, #1: 2 − x, 1 − y, 2 − z.
The increase in the concentration did not lead to significant spectral changes in 3 (Figure 6). This is also expected since the OH group is not polar enough in this particular case, but some linear aggregation cannot be excluded. According to the theoretical simulations (Figure S6) and the crystal structure (Scheme 6), linear E-E aggregates are expected in solution.
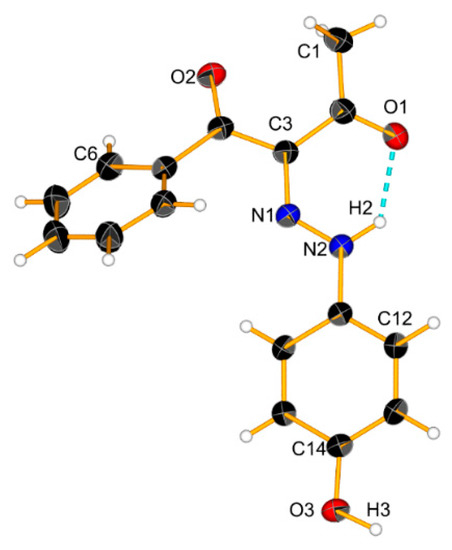
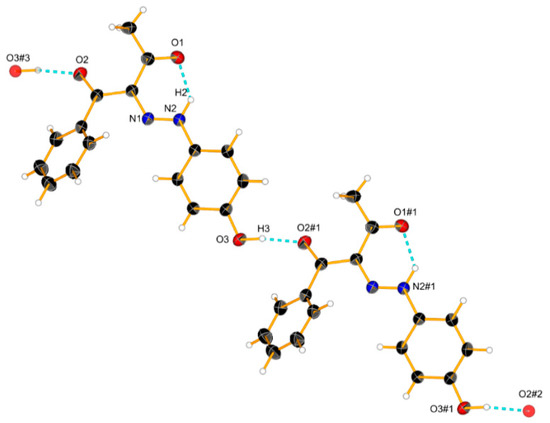
Scheme 6.
Crystal structure of 3 and a cyclic dimer model via an intermolecular hydrogen bond. Ellipsoids are drawn with a probability of 30% and H-bonds are represented as dashed blue lines, #1: x − 1, 1 + y, z; #2: x − 2, y + 2, z; #3: x + 1, y − 1, z.
The availability of crystallographic data for the series 1–8 allows qualitative estimation of the strength of the existing intra- and intermolecular hydrogen bonding according to Steiner [28] and Jeffrey [29]. The corresponding bond length and angles are collected in Table 2. According to the classification given in [28], the existing N-H…O hydrogen bonds are classified as moderate ones using the H…A and D….A distances and the D-H…A angle. It seems that the strength (at least in solid state) of this bond is almost independent on the substitution in the stator. In the cases where this bond is bifurcated, namely 1, 2 and 6, the contribution from N-H…O(=C) is the dominant one. This explains why, according to the theoretical calculations using the solvent only as media, the E and Z isomers are always more stable compared to the “ ‘ “ ones. The data in Table 2 show clearly that the formation of associates through intramolecular hydrogen bonding with strong directionality (D-H…A angle > 160°) has a noticeable stabilizing effect.
Table 2.
Parameters of the hydrogen bonds of the studied compounds, taken from their crystallographic data.
The absorption spectra of 2 and 3 in DMSO in the temperature range of 20–70 °C are shown in Figure 8 and Figure S7. In both compounds, it can be seen that with increasing temperature, the absorption maximum of the neutral form (~400 nm) decreases slightly, while the amount of the deprotonated form absorbing at ~500 nm increases.
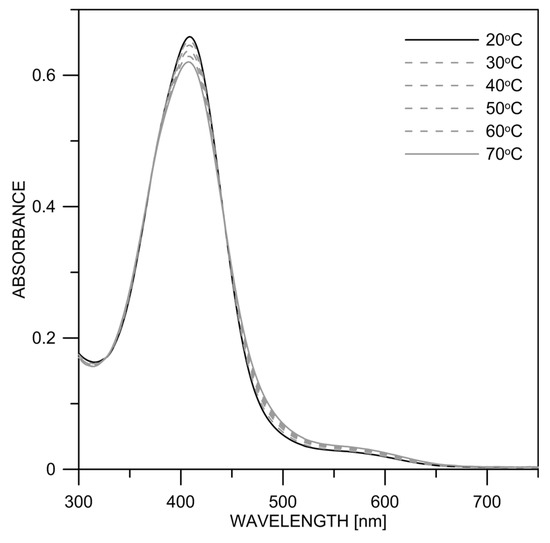
Figure 8.
Experimental absorption spectra of 2 in dry DMSO at different temperatures.
The result can be interpreted in analogy to 1 [22]. Increasing the temperature leads to the destruction of existing aggregates, which subsequently facilitates the deprotonation of the monomers. The temperature effect was strongest in 1 (Figure S8), followed by 2 (Figure 8) and lowest for 3 (Figure S7). This indicates that 1 has the highest tendency to aggregate again related to the effect of the nitro group. The percentage contents (in %) of the two neutral isomers were determined by measuring NMR spectra as a function of the temperature (Table S3). It could be thereby shown that the ratio does not change significantly (Figures S9–S11), which probably indicates that they exist in the form of associates in the concentration range used in NMR.
3. Materials and Methods
3.1. Synthesis
Reagents and solvents were analytical grade, purchased from Sigma-Aldrich Chemical Co. and used as received unless otherwise stated. Fluka silica gel/TLC-cards 60778 with fluorescence indicator 254 nm were used for TLC chromatography. Merck silica gel 60 (0.040–0.063 mm, Merck, Darmstadt, Germany) was used for flash chromatography purification of the products. LC/MS was carried out on a Bruker MicrOTOF-QIII-system with an ESI source with nebulizer 1.2 bar, dry gas 10.0 L/min, dry temperature 220 °C, capillary 4500 V, and end plate offset −500 V, Bruker, Hamburg, Germany. The title 2-(2(2-Hydroxy-4-nitrophenyl)hydrazono)-1-phenylbutane-1,2,3-trione 1, 2-[2-(2-Hydroxyphenyl)diazenyl]-1-phenyl-1,3-Butanedione 2 and 2-[2-(4-Hydroxyphenyl)diazenyl]-1-phenyl-1,3-Butanedione 3 were synthesized as follows.
3.1.1. 2-(2(2-Hydroxy-4-nitrophenyl)hydrazono)-1-phenylbutane-1,2,3-trione 1
The synthesis of the compound 1 has been described previously [22].
3.1.2. 2-[2-(2-Hydroxyphenyl)diazenyl]-1-phenyl-1,3-butanedione 2
A solution of 2-aminophenol (0.2728 g, 2.5 mmol) in concentrated hydrochloric acid (1.5 mL) was cooled in an ice bath for 30 min with stirring. Sodium nitrite (0.1725 g, 2.5 mmol) was added gradually in small portions over 30 min. The diazonium salt was left stirring in the cold for 45 min and added slowly over 30 min into a well-cooled stirred mixture of sodium acetate (1.5 g, 18.3 mmol) and 1-phenylbutane-1,3-dione (0.4061 g, 2.5 mmol) in absolute ethanol (15 mL). The mixture was stirred in an ice-bath for 3 h, and then left to warm to room temperature over 12 h. The solid was filtered off and washed with water (3 × 25 mL) to give a light brown solid. The ethanol portion was evaporated under reduced pressure to give dark brown solid. The combined solids were dissolved in dichloromethane (30 mL) and washed with water (3 × 50 mL) and the organic portion dried over anhydrous sodium sulfate, filtered and the solvent evaporated under reduced pressure to obtain a crude brown solid. This was purified by flash column chromatography using a silica flash column and ethyl acetate-dichloromethane (1:20) as eluent to give the pure compound as a light brown solid (0.48 g, 68%). HRMS-ESI (m/z): (M + H) calculated for C16H14N2O3, 282.1004; found 282.1084.
3.1.3. 2-[2-(4-Hydroxyphenyl)diazenyl]-1-phenyl-1,3-butanedione 3
A solution of 4-aminophenol (0.2728 g, 2.5 mmol) in concentrated hydrochloric acid (1.5 mL) was cooled in an ice bath for 30 min with stirring. Sodium nitrite (0.1725 g, 2.5 mmol) was added gradually in small portions over 30 min. The diazonium salt was left stirring in the cold for 45 min and added slowly over 30 min into a well-cooled stirred mixture of sodium acetate (1.5 g, 18.3 mmol) and 1-phenylbutane-1,3-dion (0.4061 g, 2.5 mmol) in absolute ethanol (15 mL). The mixture was stirred in an ice bath for 3 h, and then warmed to room temperature over 12 h. The solid was filtered off and washed with water (3 × 25 mL) to give a yellow solid. The ethanol portion was evaporated under reduced pressure to give a dark yellow solid. The combined solids were dissolved in dichloromethane (30 mL) and washed with water (3 × 50 mL) and the organic portion was dried over anhydrous sodium sulfate, filtered, and the solvent evaporated under reduced pressure to obtain a crude brown solid. This was purified by flash column chromatography using a silica flash column and ethyl acetate-dichloromethane (1:20) as eluent to give the pure compound as a light-yellow solid (0.52 g, 74%). HRMS-ESI (m/z): (M + H) calculated for C16H14N2O3, 282.1004; found 282.1066.
3.2. Spectral Measurements
Spectral measurements were performed on a Jasco V-570 UV-Vis-NIR spectrophotometer, equipped with a thermostatic cell holder (using Huber MPC-K6 thermostat with precision 1 °C), in spectral grade solvents.
The 1H-NMR and 13C-NMR spectra were recorded at 600 MHz and 150 MHz or 400 MHz and 100 MHz on a Bruker Avance II+ 600 or Bruker Avance III 400 spectrometer using CDCl3 or DMSO-d6 as a solvent and TMS as internal standard.
3.3. X-ray Measurements
Single crystals of C16H14N2O3 (2) were obtained from a mixture of ethanol:water (5:1) by slow evaporation. A suitable single crystal was selected and mounted on a loop with oil and measured on a STOE IPDS 2T diffractometer. The crystal was kept at 200 K during data collection. Using Olex2 [33], the structure was solved with the ShelXT [34] structure solution program using intrinsic phasing and refined with the ShelXL [35] refinement package using least squares minimization. All the crystal structures have been deposited at the CCDC 1858058 (1), 1993960 (2) and 1993961 (3).
Crystal Data for C16H14N2O3 (M = 282.29 g/mol): triclinic, space group P-1 (no. 2), a = 5.8853(12) Å, b = 8.0633(16) Å, c = 15.944(3) Å, α = 77.760(15)°, β = 88.887(16)°, γ = 68.978(15)°, V = 688.9(2) Å3, Z = 2, T = 200 K, μ(Cu Kα) = 0.785 mm−1, Dcalc = 1.361 g/cm3, 5325 reflections measured (14.428° ≤ 2θ ≤ 138.228°), 5365 unique (Rint = 0.0571, Rsigma = 0.0392) which were used in all calculations. The final R1 was 0.0712 (I > 4 u(I)) and wR2 was 0.2505 (all data).
Single crystals of C16H14N2O3 (3) were obtained from a mixture of ethanol:chloroform:water (10:1:2) by slow evaporation. A suitable single crystal was selected and mounted on a loop with oil and measured on a STOE IPDS 2T diffractometer. The crystal was kept at 298(2) K during data collection. Using Olex2 [33], the structure was solved with the ShelXT [34] structure solution program using intrinsic phasing and refined with the ShelXL [35] refinement package using least squares minimization.
Crystal Data for C16H14N2O3 (M = 282.29 g/mol): triclinic, space group P-1 (no. 2), a = 6.3843(4) Å, b = 8.0018(5) Å, c = 15.0129(10) Å, α = 96.235(5)°, β = 101.298(5)°, γ = 107.252(5)°, V = 706.78(8) Å3, Z = 2, T = 298(2) K, μ(MoKα) = 0.093 mm−1, Dcalc = 1.326 g/cm3, 8242 reflections measured (2.812° ≤ 2θ ≤ 52.618°), 2808 unique (Rint = 0.0164, Rsigma = 0.0146) which were used in all calculations. The final R1 was 0.0390 (I > 2σ(I)) and wR2 was 0.1142 (all data).
3.4. Quantum-Chemical Calculations
Quantum-chemical calculations were performed using the Gaussian 09 program suite [36]. M06-2X functional [37,38] was used with the TZVP basis set [39]. This fitted hybrid meta-GGA functional with 54% HF exchange has especially been developed to describe main-group thermochemistry and non-covalent interactions, showing very good results in the prediction of the position of the tautomeric equilibrium in azonaphthols possessing intramolecular hydrogen bonds [40] and in the description of the proton transfer reactions in naphthols [41,42]. All structures were optimized without restrictions, using tight optimization criteria and an ultrafine grid in the computation of two-electron integrals and their derivatives, and the true minima were verified by performing frequency calculations in the corresponding environment. Solvent effects are described by using the Polarizable Continuum Model (the integral equation formalism variant, IEFPCM, as implemented in Gaussian 09) [43]. The absorption spectra of the compounds were predicted using the TD-DFT formalism. TD-DFT calculations were carried out at the same functional and basis set, which is in accordance with conclusions about the effect of the basis set size and the reliability of the spectral predictions [44,45,46].
4. Conclusions
The effect of the position of the OH group and the availability of a nitro group substitution in the stator was investigated in solution by means of DFT calculations, NMR and UV-Vis spectroscopy. The results indicate that, when the OH group is in ortho position, the E’ and Z’ isomers are present in DMSO, stabilized by intermolecular hydrogen bonding with the solvent. The availability, in addition, of a nitro group in para position increases the possibility for deprotonation of the OH group in the absence of water. In all studied compounds, a clear tendency towards formation of associates is evident. The obtained X-ray data explain the types of the possible homo-aggregates and correspond very well to the theoretical predictions. The obtained results, revealing the effect of the structural modifications in the stator and the influence of the environment, could be useful in the design of new rotary switches.
Supplementary Materials
The following are available online at https://www.mdpi.com/2624-8549/2/2/24/s1. Figure S1: Second derivative spectra of a) 2 and b) 3 in various solvents, Figure S2: 1H NMR spectrum of 2 in DMSO-d6, Figure S3: 1H NMR spectrum of 3 in DMSO-d6, Figure S4: Absorption spectra of 1, 2 and 3 in dry DMSO and upon base (TEA) addition, Figure S5: Experimental absorption spectra of 1 and 2 upon water addition, Figure S6: Relative energies (in kcal/mol) of the most stable dimers of 3 in DMSO, Figure S7: Absorption spectra of 3 in DMSO in different temperatures, Figure S8: Absorption spectra of 1 in DMSO in different temperatures, Figure S9: 1H NMR spectrum of 1 in DMSO at a temperature range of 20 °C to 70 °C, Figure S10: 1H NMR spectrum of 2 in DMSO at a temperature range of 20 °C to 70 °C, Figure S11: 1H NMR spectrum of 3 in DMSO at a temperature range of 20 °C to 70 °C, Table S1: The most stable isomers of I-VII of 2 in gas phase, Table S2: Relative energies (M06-2X/TZVP) of the most stable neutral and deprotonated forms of 1, 2, 3 in kcal/mol units, Table S3: Ratio between E(E’)/Z(Z’) forms in 1, 2 and 3 in the temperature range of 293 K–343 K, Scheme SI: Possible conformers of I and their relative energies (in kcal/mol, according to quantum-chemical calculations) in acetonitrile.
Author Contributions
Conceptualization, L.A.; methodology, L.A. and N.V.; validation, S.H. and A.C.; formal analysis, S.H. and L.A.; investigation, S.H., F.S.K., N.V. and A.C.; resources, L.A., F.S.K. and K.M.F; data curation, L.A. and K.M.F.; writing—original draft preparation, S.H.; writing—review and editing, L.A., N.V. and K.M.F; supervision, L.A. and K.M.F.; project administration, L.A.; funding acquisition, K.M.F. and L.A. All authors have read and agreed to the published version of the manuscript.
Funding
This research was funded by The Swiss National Science Foundation, Institutional Partnership project IZ74Z0_160515, Bulgarian National Science Fund, project DN09/10 MolRobot, and Bulgarian Ministry of Educations, project DFNP-17-66/26.07.2017.
Acknowledgments
The financial support by Bulgarian Ministry of Educations (project DFNP-17-66/26.07.2017 for support of young scientists), Bulgarian National Science Fund (project DN09/10 MolRobot) and The Swiss National Science Foundation (SCOPES Institutional Partnership project IZ74Z0_160515 SupraMedChem@Balkans.Net) is gratefully acknowledged.
Conflicts of Interest
No conflict of interest.
References
- Vicini, P.; Zani, F.; Cozzini, P.; Doytchinova, I. Hydrazones of 1,2-benzisothiazole hydrazides: Synthesis, antimicrobial activity and QSAR investigations. Eur. J. Med. Chem. 2002, 37, 553–564. [Google Scholar] [CrossRef]
- Loncle, C.; Brunel, M.; Vidal, N.; Dherbomez, M.; Letourneux, Y. Synthesis and antifungal activity of cholesterol-hydrazone derivatives. Eur. J. Med. Chem. 2004, 39, 1067–1071. [Google Scholar] [CrossRef] [PubMed]
- Savini, L.; Chiasserini, L.; Travagli, V.; Pellerano, C.; Novellino, E.; Cosentino, S.; Pisano, B. New α-(N)-heterocyclichydrazones: Evaluation of anticancer, anti-HIV and antimicrobial activity. Eur. J. Med. Chem. 2004, 39, 113–122. [Google Scholar] [CrossRef] [PubMed]
- Cocco, T.; Congiu, C.; Lilliu, V.; Onnis, V. Synthesis and in vitro antitumoral activity of new hydrazinopyrimidine-5-carbonitrile derivatives. Bioorganic Med. Chem. 2006, 14, 366–372. [Google Scholar] [CrossRef]
- Masunari, A.; Tavares, C. A new class of nifuroxazide analogues: Synthesis of 5-nitrothiophene derivatives with antimicrobial activity against multidrug-resistant Staphylococcus aureus. Bioorganic Med. Chem. 2007, 15, 4229–4236. [Google Scholar] [CrossRef]
- Vicini, P.; Incerti, M.; La Colla, P.; Loddo, R. Anti-HIV evaluation of benzo[d]isothiazole hydrazones. Eur. J. Med. Chem. 2009, 44, 1801–1807. [Google Scholar] [CrossRef]
- Lehn, J. From supramolecular chemistry towards constitutional dynamic chemistry and adaptive chemistry. Chem. Soc. Rev. 2007, 36, 151–160. [Google Scholar] [CrossRef]
- Lehn, J. Constitutional Dynamic Chemistry: Bridge from Supramolecular Chemistry to Adaptive Chemistry; Barboiu, M., Ed.; Springer: Berlin/Heidelberg, Germany, 2012; Volume 322, pp. 1–32. [Google Scholar]
- Lehn, J. Perspectives in Chemistry-Steps towards Complex Matter. Angew. Chem. Int. Ed. 2013, 52, 2836–2850. [Google Scholar] [CrossRef]
- Lygaitis, R.; Getautis, V.; Grazulevicius, J.V. Hole-transporting hydrazones. Chem. Soc. Rev. 2008, 37, 770–788. [Google Scholar] [CrossRef]
- Rowan, J.; Cantrill, J.; Cousins, L.; Sanders, M.; Stoddart, F. Dynamic Covalent Chemistry. Angew. Chem. Int. Ed. 2002, 41, 898–952. [Google Scholar] [CrossRef]
- Corbett, T.; Leclaire, J.; Vial, L.; West, R.; Wietor, L.; Sanders, M.; Otto, S. Dynamic Combinatorial Chemistry. Chem. Rev. 2006, 106, 3652–3711. [Google Scholar] [CrossRef] [PubMed]
- Wilson, J. Dynamic Combinatorial Chemistry. In Drug Discovery, Bioorganic Chemistry, and Materials Science. Edited by Benjamin, L. Miller. Angew. Chem. Int. Ed. 2010, 49, 4011. [Google Scholar] [CrossRef]
- Courtot, P.; Pichon, R.; Le Saint, J. Determination du site de chelation chez les arylhydrazones de tricetones et D’ α-dicetones substituees. Tetrahedron Lett. 1976, 17, 1177–1180. [Google Scholar] [CrossRef]
- Courtot, P.; Pichon, R.; Le Saint, J. Photochromisme par isomerisation syn-anti de phenylhydrazones-2- de tricetones-1,2,3 et de dicetones-1,2 substituees. Tetrahedron Lett. 1976, 17, 1181–1184. [Google Scholar] [CrossRef]
- Pichon, R.; Le Saint, J.; Courtot, P. Photoisomerisation d’arylhydrazones-2 de dicetones-1,2 substituees en 2.: Mecanisme d’isomerisation thermique de la double liaison C=N. Tetrahedron 1981, 37, 1517–1524. [Google Scholar] [CrossRef]
- Mahmudov, K.T.; Rahimov, R.A.; Babanly, M.B.; Hasanov, P.Q.; Pashaev, F.G.; Gasanov, A.G.; Kopylovich, M.N.; Pombeiro, A.J.L. Tautomery and acid–base properties of some azoderivatives of benzoylacetone. J. Mol. Liq. 2011, 162, 84–88. [Google Scholar] [CrossRef]
- Kuznik, W.; Kopylovich, M.N.; Amanullayeva, G.I.; Pombeiro, A.J.L.; Reshak, A.; Mahmudov, K.T.; Kityk, I. Role of tautomerism and solvatochromism in UV–VIS spectra of arylhydrazones of β-diketones. J. Mol. Liq. 2012, 171, 11–15. [Google Scholar] [CrossRef]
- Mitchell, A.; Nonhebel, D.C. Spectroscopic studies of tautomeric systems—III. Tetrahedron 1979, 35, 2013–2019. [Google Scholar]
- Su, X.; Aprahamian, I. Hydrazone-based switches, metallo-assemblies and sensors. Chem. Soc. Rev. 2014, 43, 1963–1981. [Google Scholar] [CrossRef]
- Gurbanov, A.V.; Kuznetsov, M.L.; Demukhamedova, S.D.; Aliyeva, I.N.; Godjaev, N.M.; Zubkov, F.I.; Mahmudov, K.T.; Pombeiro, A.J.L. Role of substituents on resonance assisted hydrogen bonding vs. intermolecular hydrogen bonding. CrystEngComm 2020, 22, 628–633. [Google Scholar] [CrossRef]
- Hristova, S.; Kamounah, F.S.; Molla, N.; Hansen, P.E.; Nedeltcheva, D.; Antonov, L. The possible tautomerism of the potential rotary switch 2-(2-(2-Hydroxy-4-nitrophenyl)hydrazono)-1-phenylbutane-1,3-dione. Dye. Pigment. 2017, 144, 249–261. [Google Scholar] [CrossRef]
- Lycka, A. 15 N NMR study of (E)- and (Z)-2-(2-(2-hydroxy-4-nitrophenyl)hydrazono)-1-phenylbutane-1,3-diones. A suitable method for analysis of hydrazone isomers. Dye. Pigment. 2018, 150, 181–184. [Google Scholar] [CrossRef]
- Hristova, S.; Kamounah, F.S.; Crochet, A.; Hansen, P.E.; Fromm, K.M.; Nedeltcheva, D.; Antonov, L. Isomerization and aggregation of 2-(2-(2-hydroxy-4-nitrophenyl)hydrazono)-1-phenylbutane-1,3-dione: Recent evidences from theory and experiment. J. Mol. Liq. 2019, 283, 242–248. [Google Scholar] [CrossRef]
- Gawinecki, R.; Kolehmainen, E.; Janota, H.; Kauppinen, R.; Nissinen, M.; Osmialowski, B. Predominance of 2-arylhydrazones of 1,3-diphenylpropane-1,2,3-trione over its proton-transfer products. J. Phys. Org. Chem. 2001, 14, 797–803. [Google Scholar] [CrossRef]
- Antonov, L. Absorption UV-Vis Spectroscopy and Chemometrics: From Qualitative Conclusions to Quantitative Analysis. In Tautomerism; Antonov, L., Ed.; Wiley-VCH Verlag GmbH & Co. KGaA: Weinheim, Germany, 2013; pp. 25–47. [Google Scholar]
- Nedeltcheva, D.; Antonov, L.; Lycka, A.; Damyanova, B.; Popov, S. Chemometric Models For Quantitative Analysis of Tautomeric Schiff Bases and Azo Dyes. Curr. Org. Chem. 2009, 13, 217–240. [Google Scholar] [CrossRef]
- Steiner, T. The Hydrogen Bond in the Solid State. Angew. Chem. Int. Ed. 2002, 41, 48–76. [Google Scholar] [CrossRef]
- Jeffrey, G. An Introduction to Hydrogen Bonding; Oxford University Press: Oxford, UK, 1997. [Google Scholar]
- Kopylovich, M.N.; Mahmudov, K.T.; Haukka, M.; Luzyanin, K.V.; Pombeiro, A.J.L. (E)-2-(2-(2-hydroxyphenyl)hydrazono)-1-phenylbutane-1,3-dione: Tautomery and coordination to copper(II). Inorg. Chim. Acta 2011, 374, 175–180. [Google Scholar] [CrossRef]
- Bertolasi, V.; Nanni, L.; Gilli, P.; Ferretti, V.; Gilli, G.; Issa, Y.; Sherif, O. Intramolecular N-H. O=C hydrogen-bonding assisted by resonance—Intercorrelation between structural and spectroscopic data for 6 beta-diketo-arylhydrazones derived from benzoylacetone or acetylacetone. New J. Chem. 1994, 18, 251–261. [Google Scholar]
- Eliseeva, S.V.; Minacheva, L.K.; Kuz’Mina, N.P.; Sergienko, V.S. Crystal structure of p-carboxyphenylhydrazone benzoylacetone. Crystallogr. Rep. 2005, 50, 85–88. [Google Scholar] [CrossRef]
- Dolomanov, O.; Bourhis, L.J.; Gildea, R.; Howard, J.A.; Puschmann, H. OLEX2: A complete structure solution, refinement and analysis program. J. Appl. Crystallogr. 2009, 42, 339–341. [Google Scholar] [CrossRef]
- Sheldrick, G.M. SHELXT - integrated space-group and crystal-structure determination. Acta Crystallogr. Sect. A Found. Adv. 2015, A71, 3–8. [Google Scholar] [CrossRef] [PubMed]
- Sheldrick, G.M. Crystal structure refinement with SHELXL. Acta Crystallogr. Sect. C Struct. Chem. 2015, C71, 3–8. [Google Scholar] [CrossRef] [PubMed]
- Frisch, M.; Trucks, G.; Schlegel, H.; Scuseria, G.; Robb, M.; Cheeseman, J.; Scalmani, G.; Barone, V.; Mennucci, B.; Petersson, G.; et al. Gaussian 09 Revision D.01; Gaussian, Inc.: Wallingford, CT, USA, 2013. [Google Scholar]
- Zhao, Y.; Truhlar, D. Density Functionals with Broad Applicability in Chemistry. Acc. Chem. Res. 2008, 41, 157–167. [Google Scholar] [CrossRef] [PubMed]
- Zhao, Y.; Truhlar, D. The M06 suite of density functionals for main group thermochemistry, thermochemical kinetics, noncovalent interactions, excited states, and transition elements: Two new functionals and systematic testing of four M06 functionals and 12 other functionals. Theor. Chem. Acc. 2008, 120, 215–241. [Google Scholar] [CrossRef]
- Weigend, F.; Ahlrichs, R. Balanced basis sets of split valence, triple zeta valence and quadruple zeta valence quality for H to Rn: Design and assessment of accuracy. Phys. Chem. Chem. Phys. 2005, 7, 3297–3305. [Google Scholar] [CrossRef]
- Kawauchi, S.; Antonov, L. Description of the Tautomerism in Some Azonaphthols. J. Phys. Org. Chem. 2013, 26, 643–652. [Google Scholar] [CrossRef]
- Manolova, Y.; Kurteva, V.B.; Antonov, L.; Marciniak, H.; Lochbrunner, S.; Crochet, A.; Fromm, K.M.; Kamounah, F.S.; Hansen, P.E. 4-Hydroxy-1-naphthaldehydes: Proton transfer or deprotonation. Phys. Chem. Chem. Phys. 2015, 17, 10238–10249. [Google Scholar] [CrossRef]
- Manolova, Y.; Marciniak, H.; Tschierlei, S.; Fennel, F.; Kamounah, F.S.; Lochbrunner, S.; Antonov, L. Solvent control of intramolecular proton transfer: Is 4-hydroxy-3-(piperidin-1-ylmethyl)-1-naphthaldehyde a proton crane? Phys. Chem. Chem. Phys. 2017, 19, 7316–7325. [Google Scholar] [CrossRef]
- Tomasi, J.; Mennucci, B.; Cammi, R. Quantum Mechanical Continuum Solvation Models. Chem. Rev. 2005, 105, 2999–3094. [Google Scholar] [CrossRef]
- Improta, R. UV-Visible Absorption and Emission Energies in Condensed Phase by PCM/TD-DFT Methods. In Computational Strategies for Spectroscopy; Barone, V., Ed.; John Wiley & Sons, Inc.: Hoboken, NJ, USA, 2011; pp. 37–75. [Google Scholar]
- Antonov, L.; Kawauchi, S.; Okuno, Y. Prediction of the Color of Dyes by Using Time-Dependent Density Functional Theory. Bulg. Chem. Commun. 2014, 46, 228–237. [Google Scholar]
- Jacquemin, D.; Mennucci, B.; Adamo, C. Excited-state calculations with TD-DFT: From benchmarks to simulations in complex environments. Phys. Chem. Chem. Phys. 2011, 13, 16987–16998. [Google Scholar] [CrossRef] [PubMed]


© 2020 by the authors. Licensee MDPI, Basel, Switzerland. This article is an open access article distributed under the terms and conditions of the Creative Commons Attribution (CC BY) license (http://creativecommons.org/licenses/by/4.0/).