1. Introduction
The poultry industry faces significant challenges due to the need for precise environmental control to ensure optimal bird welfare and productivity. Factors such as temperature, relative humidity, carbon dioxide, and ammonia levels must be consistently managed to reduce heat stress, enhance feed efficiency, and minimize disease risks. These parameters directly affect poultry growth, egg production, and farm profitability [
1]. Technological advancements, especially in wireless sensor networks (WSNs) and the Internet of Things (IoT), have opened new possibilities for automating environmental monitoring and control in poultry houses. Traditional wired systems have limitations like high installation costs, signal degradation, and maintenance challenges over long distances. Wireless systems, by contrast, offer scalable, cost-effective, and flexible solutions [
2].
Sustainable growth, characterized by a continual increase in gross world product (GWP) or per capita consumption over an infinite or very long period, is unattainable. This impossibility arises because economic growth is constrained by the finite, non-growing, and materially closed nature of Earth’s ecosystem [
3]. Resources are finite; some cannot be augmented through investment or new technologies. While new technologies can enhance resource utilization, such as improving irrigation systems to boost crop yields, they cannot increase water availability [
4]. Since the 1950s, commercial poultry production practices have undergone significant changes. Nowadays, most commercial poultry are raised exclusively indoors, in buildings with full or partial environmental control [
5]. Egg consumption has remained relatively stable, while the demand for poultry meat has significantly increased. Poultry meat has become the primary source of meat-based protein in many countries. For example, in 2011, poultry meat made up 31% of all meat consumption in the UK and 43% in the USA [
6,
7]. Facilities are built and managed to optimize production by providing tailored diets that meet the birds’ nutritional needs at different stages of their growth or egg-laying cycles. Additionally, controlled photoperiods and light intensities promote growth or egg production. Variations in environmental factors such as sunlight, temperature, relative humidity, and the characteristics of animal metabolism and thermoregulation mechanisms can lead to imbalances in the animal’s body [
8]. After World War II, poultry production in Portugal began incorporating scientific advancements, including genetic improvement, nutrition, disease prevention, and environmental control. Genetic enhancements aimed at increasing production efficiency, and thus reducing costs [
9]. Ensuring optimal environmental conditions, particularly maintaining ideal body temperatures for birds, became a significant focus. The thermal comfort zone, where birds neither feel hot nor cold, requires ambient temperatures to stay within certain limits, to support efficient thermoregulation and productive performance [
10].
Heat stress significantly impacts poultry production, manifesting in reduced feed intake and poor feed conversion efficiency, which directly hampers body weight gain and overall growth performance. Laying hens are particularly affected, with noticeable declines in egg production, quality, and fertility rates. Beyond production, heat stress weakens the immune response, leaving birds more susceptible to disease and increasing mortality rates in severe cases [
11]. It also disrupts gut health, impairing nutrient absorption and compromising overall well-being. Behaviorally, birds exhibit reduced activity levels, decreased social interactions, and altered feeding patterns, often seeking cooling sources to alleviate discomfort. The economic implications of heat stress are profound, leading to significant financial losses due to reduced productivity, increased veterinary costs, and elevated mortality rates [
11]. When birds consume protein, they produce uric acid, ultimately converted to ammonia under favorable conditions [
12]. Prolonged exposure often results from poor ventilation or an imbalanced, high-protein diet. Exposure to high ammonia levels harms birds by impairing their immune system development and increasing susceptibility to respiratory and eye infections due to respiratory damage. Even brief exposure to high ammonia concentrations can trigger molecular changes, irritation, and inflammation, causing significant discomfort [
13].
Data and power cables are often routed through cable trays in industrial settings. However, their proximity can lead to electromagnetic interference, including crosstalk and impedance variations, resulting from the unintended electromagnetic coupling between adjacent cables in a bundle [
14]. These challenges can be mitigated by adopting digital, wireless Wi-Fi transmission. Wireless IoT sensors present numerous advantages over wired sensors for long-distance applications. They eliminate the need for expensive physical infrastructure, such as cables, connectors, and conduits. Protocols like LoRa enable reliable long-range communication, often spanning several kilometers without requiring additional hardware, unlike wired sensors, which rely on continuous power delivered through cables, which is usually impractical for extended distances. IoT sensors can operate on batteries or solar power with low energy consumption, making them ideal for prolonged data transmission. IoT sensors in poultry farms and housing are highly scalable, allowing seamless integration or relocation, without altering existing infrastructure. As with any wireless system, the router’s placement is crucial to ensure connectivity with all measurement nodes. Similarly, the nodes should ideally be positioned near a power source or, in battery-powered cases, in easily accessible locations to facilitate battery replacement.
This work describes a Wireless Monitoring and Control System designed to maintain optimal conditions within established parameters, ensuring appropriate bird growth, without issues.
The main contributions of this paper are as follows:
Development of a Comprehensive IoT-based Monitoring and Control System: This work presents the design and implementation of an advanced Wireless Monitoring and Control System for poultry houses, utilizing a network of distributed measurement nodes that wirelessly transmit data to a centralized control node. The system effectively monitors critical environmental parameters, such as temperature, relative humidity, carbon dioxide, and ammonia, essential for poultry welfare. By leveraging wireless communication, the system addresses the limitations of traditional wired approaches, which are prone to electromagnetic interference and signal degradation over long distances. This IoT-based solution enables real-time environmental monitoring and management, enhancing poultry production efficiency.
Evaluation of System Reliability and Communication Performance: The system’s communication capabilities were rigorously tested under various conditions to evaluate the reliability of the Wi-Fi network in transmitting sensor data. The results confirmed that the system could maintain stable environmental conditions within the desired setpoints, despite potential interference or varying distances between nodes. By integrating wireless communication, the system ensures accurate, real-time data transmission and effective management of environmental factors such as temperature and ammonia levels.
Centralized Environmental Management via Web-based Dashboard: A key innovation of this work is the integration of a user-friendly, web-based dashboard that provides real-time visualization and control of environmental parameters. This dashboard allows users to remotely monitor conditions within poultry houses and make necessary adjustments to maintain optimal conditions. The centralized nature of the system simplifies management, enabling adjustments to actuators (e.g., fans and ventilation systems) based on live data. Monitoring and controlling multiple environmental factors through a single interface significantly enhances the efficiency and ease of poultry farm management.
The remainder of the paper is composed as follows:
Section 2 presents and discusses related work, and
Section 3 presents poultry production challenges.
Section 4 presents the proposed system.
Section 5 provides insights about the software and firmware development, and
Section 6 presents the tests and results, to prove the concept;
Section 7 finishes the paper with conclusions and future directions.
2. Related Work
Intensive production systems, often associated with higher stocking densities per square meter of floor area, can lead to bird discomfort and challenges in maintaining suitable conditions.
Ben Sassi et al. [
15] studied technology and poultry welfare, and the authors emphasized using monitoring systems to ameliorate the well-being of broiler and laying hens. This involves using environmental sensors to track temperature, humidity, and gas levels, and acoustic and movement sensors that measure stress and range of movement. Imaging technologies encompass infrared thermal imaging and optical flow analysis, allowing non-invasive monitoring of birds’ movements, health status, and active behaviors in their environment. Mobile applications can capture a farm-based welfare assessment by enhancing the data-gathering process. The authors noted that the amalgamation of these technologies has the potential to improve the welfare of the animals, due to the capacity to monitor, identify problems, and make management decisions within a short period. However, other factors, such as the cost of implementation and more sophisticated data interpretation systems, could pose a challenge.
George et al. [
16] addressed the optimization of poultry production by integrating sophisticated monitoring, automation, and AI-driven systems, focusing on improvements in animal welfare, sustainability, and economic viability. Sensors track environmental parameters and avian health, while automated systems oversee climate control, feeding, and processing operations. AI-driven models forecast results and allow immediate modifications, decreasing death rates and enhancing feed efficiency. The principal advantages encompass heightened productivity, lower environmental impacts, and improved profitability. Nonetheless, obstacles include substantial initial expenses, data security vulnerabilities, integration issues stemming from proprietary systems, and workforce adaptability.
Subramani et al. [
17] reviewed how machine learning (ML) and deep learning (DL) techniques are utilized in various aspects of poultry management, including health monitoring, behavior analysis, and disease detection. The authors conducted an extensive literature review to identify current trends, challenges, and future directions. For the large-scale chicken production industry, researchers suggested a DL technique that can improve the accuracy and efficiency of these tasks. By examining the current state of ML in the poultry industry, the researchers intended to evaluate the effectiveness and limitations of these techniques for managing poultry tasks.
Jayarajan et al. [
18] devised an automated poultry farming system utilizing a wireless sensor network (WSN) and the Internet of Things (IoT), incorporating sensors such as gas detectors, temperature and humidity sensors, and infrared sensors, all controlled by an Arduino UNO. It automates environmental regulation, nourishment, and garbage disposal with a conveyor system, exhaust fans, and GSM-based notifications. The authors claimed it enhances poultry health, minimizes manual work, and increases output by sustaining ideal farm conditions and offering real-time monitoring via a cloud-based web interface. Nevertheless, while delivering economic and environmental benefits, its constraints include the initial setup costs, technical skill requirements, and dependency on Internet access. The evaluations were only conducted in a laboratory setting, limiting the applicability.
Astill et al. [
19] introduced poultry management that incorporates sensors, big data, and the IoT to boost production, animal welfare, and biosecurity in poultry farming. Environmental sensors monitor temperature, humidity, and gas levels, while precision feeding systems optimize nutrition, depending on individual bird weights. Monitoring techniques, including digital imaging, infrared cameras, and biosensors, offer real-time health evaluations and early illness diagnosis. Automated technologies backed by data analytics alter farm operations, decreasing work and enhancing efficiency. The primary constraints are the requirement for sensor calibration, data governance, and high initial costs.
Sinduja et al. [
20] created an automated control system for chicken farms, employing embedded technology to monitor and regulate environmental factors such as temperature, water level, and food supply. It featured sensors like an LM35 for temperature, LM741 for water level sensing, and load cells for food measuring, controlled by an Arduino ATmega2560 microprocessor. Data were processed and presented using LabVIEW, with alarms provided via SMS for remote monitoring. The technology saved manual work, boosted farm output, and eliminated expenses, while guaranteeing ideal living circumstances for chickens. Despite its efficiency, limitations include a 30-mile operational range and dependency on GSM connectivity. The advances were solely accomplished in a laboratory context.
Thomas et al. [
21] developed an automated poultry farming system using microcontroller-based monitoring and control mechanisms to enhance productivity, reduce labor dependency, and maintain optimal farm conditions. Key features include automated egg collection and manure removal using conveyor belts, environmental monitoring with temperature, humidity, and ammonia gas sensors, and a solar-powered incubator with an egg-turning mechanism. The system minimized human intervention, improved farm hygiene, and increased hatching efficiency, although its use was limited to automatic egg collection.
Klimiashvili et al. [
22] compared the performance of WiFi, Ad Hoc, and LoRa networks in terms of energy consumption and transmission delay for file transfers. Simulation results showed that WiFi offered lower delay for large files and was more energy efficient over short, single-hop distances. In contrast, LoRa was more energy efficient over longer distances and provided a lower delay for small packets beyond WiFi’s range. On the other hand, Gracia et al. [
23] concluded that although LoRa is generally expected to consume less power than WiFi, this advantage is not significant without adjusting its settings, such as reducing the transmission power, lowering the spreading factor, and increasing bandwidth. Both technologies, on devices such as the Heltec WiFi LoRa 32, showed similar power usages with default settings and a 5 s transmission interval, while WiFi outperformed LoRa at a 30 s interval.
Rahman et al. [
24] concluded that IoT short-range protocols like Zigbee and Bluetooth Low Energy (BLE) operate efficiently at lower transmitted power levels, offer modest bit rates, and are optimized for low energy consumption, making them ideal for dense environments with many battery-powered sensors. In contrast, long-range protocols such as LoRaWAN and Sigfox have lower bit rates, narrower bandwidths for extended transmission ranges, and minimal power requirements, suitable for sparse, remote deployments. On the other hand, high-bandwidth protocols like Wi-Fi and cellular IoT support greater data throughput and wider bandwidths, enabling high-speed applications, but at the cost of a significantly higher energy consumption and transmitted power.
Iqbal et al. [
25] studied three prominent Low-Power Wide-Area Network (LPWAN) technologies—NB-Iot, LoRa, and Sigfox—within the context of Internet of Things (Iot) applications. The study concluded that no single LPWAN technology is universally superior; each has distinct advantages tailored to specific application requirements, noting that LoRa offers a balanced solution with moderate data rates, extensive range, and low power consumption, making it suitable for many Iot applications.
Sahu et al. [
26] analyzed LPWAN technologies, specifically Sigfox, LoRaWAN, and NB-Iot, and their applicability in large-scale smart agriculture settings. The study concluded that while Sigfox and LoRaWAN are favorable choices for large-scale smart agriculture due to their cost-efficiency and extended battery life, NB-Iot stands out in scenarios where low latency and high quality of service are critical. The selection of an appropriate LPWAN technology should be based on specific application requirements, considering factors such as data transmission needs, coverage area, power consumption, and cost constraints.
Becoña et al. [
27] presented a practical evaluation of three Low-Power Wide-Area Network (LPWAN) technologies (Sigfox, LoRaWAN, and NB-Iot) within agricultural settings. The study focused on developing and testing custom battery-powered Iot sensor nodes tailored for specific agribusiness applications. The researchers concluded that LPWAN technology in agribusiness should be guided by particular application requirements, considering data transmission frequency, energy efficiency, and infrastructure availability.
Ahmed et al. [
28] developed and evaluated a flexible, low-cost Internet of Things (Iot) platform utilizing LoRaWAN technology to remotely monitor extensive agricultural farms in Chile. The study concluded that the developed LoRa-based Iot platform offers a viable solution for the remote monitoring of large-scale agrarian farms. Its low cost, energy efficiency, and scalability make it suitable for deployment in rural and resource-constrained settings. The platform facilitates real-time data collection and analysis, enabling informed decision-making, to enhance farm management practices.
Finally, Vaarst et al. [
29] explored sustainable poultry production from environmental, social, economic, and institutional aspects. They demonstrated poultry’s effectiveness in transforming feed into food with minimum ecological impact compared to other animals. Key issues include biodiversity loss, antibiotic misuse, and environmental degradation from large-scale activities. The research proposed integrating chicken into diversified agricultural systems with local feed procurement, avoiding food waste, and assuring animal welfare for a more resilient and sustainable poultry economy.
Current research on poultry farming systems exhibits considerable breakthroughs in using WSN, IoT, AI-driven models, and automated control methods. Some automated systems ([
18,
20]) applied environmental sensors, feeding controls, and remote monitoring features, but their implementations were confined to laboratory situations. Similarly, Astill et al. [
19] and George et al. [
16] suggested merging big data, AI, and precision monitoring for enhanced production and well-being. However, high initial costs, technical complexity, and integration issues with proprietary systems remain significant impediments to real-world implementation. Despite technological advances, substantial research gaps persist. Limited field applications, network restrictions, and the necessity for advanced data governance mechanisms hinder scaling. Additionally, specific systems focus on limited farm operations, including egg collecting (Thomas et al. [
21]), rather than complete farm management. The sustainability-focused research by Vaarst et al. [
29] addressed environmental and economic problems but lacked integration with modern monitoring systems. Bridging these gaps requires scalable, cost-effective, and field-tested technologies that integrate precision farming with sustainable and flexible techniques.
Two research questions arise from the previous analysis:
RQ1: How can wireless-based technological trends be applied in poultry farming facilities?
RQ2: What are the practical considerations for deploying IoT-based systems in real-world poultry farming environments?
The proposed Wireless Monitoring and Control System for Poultry Houses (WiMoCoSPH) is distinguished from the current alternatives. First, it consolidates the control of several environmental parameters (temperature, humidity, carbon dioxide, and ammonia) through a centralized system, in contrast to traditional configurations that address these aspects independently. Second, its Wi-Fi-based IoT design eliminates the need for substantial wiring, overcoming typical difficulties like power dips and signal interference over long distances. Third, it incorporates a user-friendly online dashboard that enables remote real-time monitoring and the parameterization of reference values necessary for the local control performed by the control nodes (this parameterization is a considerable advance over systems without accessible interfaces). Its sophisticated power management incorporates multi-voltage regulation and noise filtering, ensuring dependable operation even in demanding industrial situations. Finally, the custom firmware permits real-time modifications based on sensor data, delivering a dynamic system response that transcends preset or manually modified systems.
The WiMoCoSPH system provides four essential advances that improve poultry house management. First, it was tested and validated in a real-world scenario, to ensure dependability and performance in an operational setting. Second, it incorporates automatic control of curtains and fans based on actual environmental data, enhancing airflow and temperature regulation beyond static or manual systems. Third, its enhanced sensor integration includes modern devices such as an HDC1080 for humidity and temperature, CCS811 for carbon dioxide, and MQ-135 for ammonia, providing accurate environmental monitoring optimized for chicken farming. Lastly, its dynamic system adaptability employs real-time data to automatically alter environmental settings, surpassing traditional time-based or static adjustment methods.
3. Poultry Production Challenges
One of the biggest concerns is the environmental conditions necessary for the birds’ comfort and maintaining their ideal body temperature. The thermal comfort zone, where there is no cold or heat sensation, is the effective environmental temperature range in which a bird maintains a constant body temperature, with minimal effort from the thermoregulatory mechanisms [
11]. Additional factors were considered, such as the relative humidity and the presence of specific components, such as carbon dioxide and ammonia, related to the immune response and the well-being of broilers in poultry production [
30,
31,
32,
33]. For this to be efficient, the ambient conditions must be within certain limits, as depicted in
Table 1.
In this sense, improving facilities for thermal comfort can overcome the detrimental effects of climatic conditions, making it possible to achieve good productive performance in poultry [
34]. The production of heat and the volume of carbon dioxide expelled by the birds vary according to the ambient temperature, especially during the summer [
35]. Two types of heating are used to maintain the ambient temperature within the poultry’s thermal comfort zone: central heating and local heating. Central heating is used to achieve suitable temperatures in poultry houses based on the homogeneous heating of the entire space surrounding the house. This process is widely used in air-conditioned poultry houses and icy regions [
36]. By reducing electricity or gas consumption, the birds are kept in specific parts of the poultry house using partitions to reduce the air volume to be heated [
37]. The second heating method is local heating, which is based on heating the surface where the birds are located. This process is more economical than central heating and is common in conventional poultry houses, which do not use a lot of technology [
38]. Various types of heating have been developed to provide greater thermal comfort for birds, with lower energy consumption. This equipment is becoming increasingly functional and efficient. Several types of heating equipment have been analyzed:
Wood heaters;
Electric heaters;
Gas heaters.
Wood heaters were one of the first devices used to heat poultry, and they used wood as fuel. Wood as a heat source does not produce a constant temperature and often exceeds what is necessary, making it difficult to control the temperature [
39]. Pellets are used as fuel to correct this problem. This fuel makes temperature control more accessible, because the heat source can produce more constant temperatures, within the comfort zone [
40]. Other heating methods are also controlled similarly, with wood heaters most commonly used for local heating. The gas heater is the most common, because it can emit several small pockets of heat into specific zones. Since the temperature can sometimes rise well above the comfort zone, fans are usually used to lower the temperature. A fan consists of a motor that moves a set of propellers. The birds drink less water on hot days when using fans, because they feel more comfortable. If they are switched off, the animals become more agitated. Another concern is high ammonia concentrations. Ammonia is a volatile chemical compound that generates a suffocating, toxic odor and irritates the respiratory tract. As the concentration increases, so does the irritability. Uric acid is the primary source of ammonia formation in poultry, predominantly occurring in the ceca, two small pouches located at the junction of the small and large intestines in birds. The microbial decomposition of uric acid in feces and urine produces urea, facilitated by the enzyme uricase, which is eventually converted into ammonia [
12,
41].
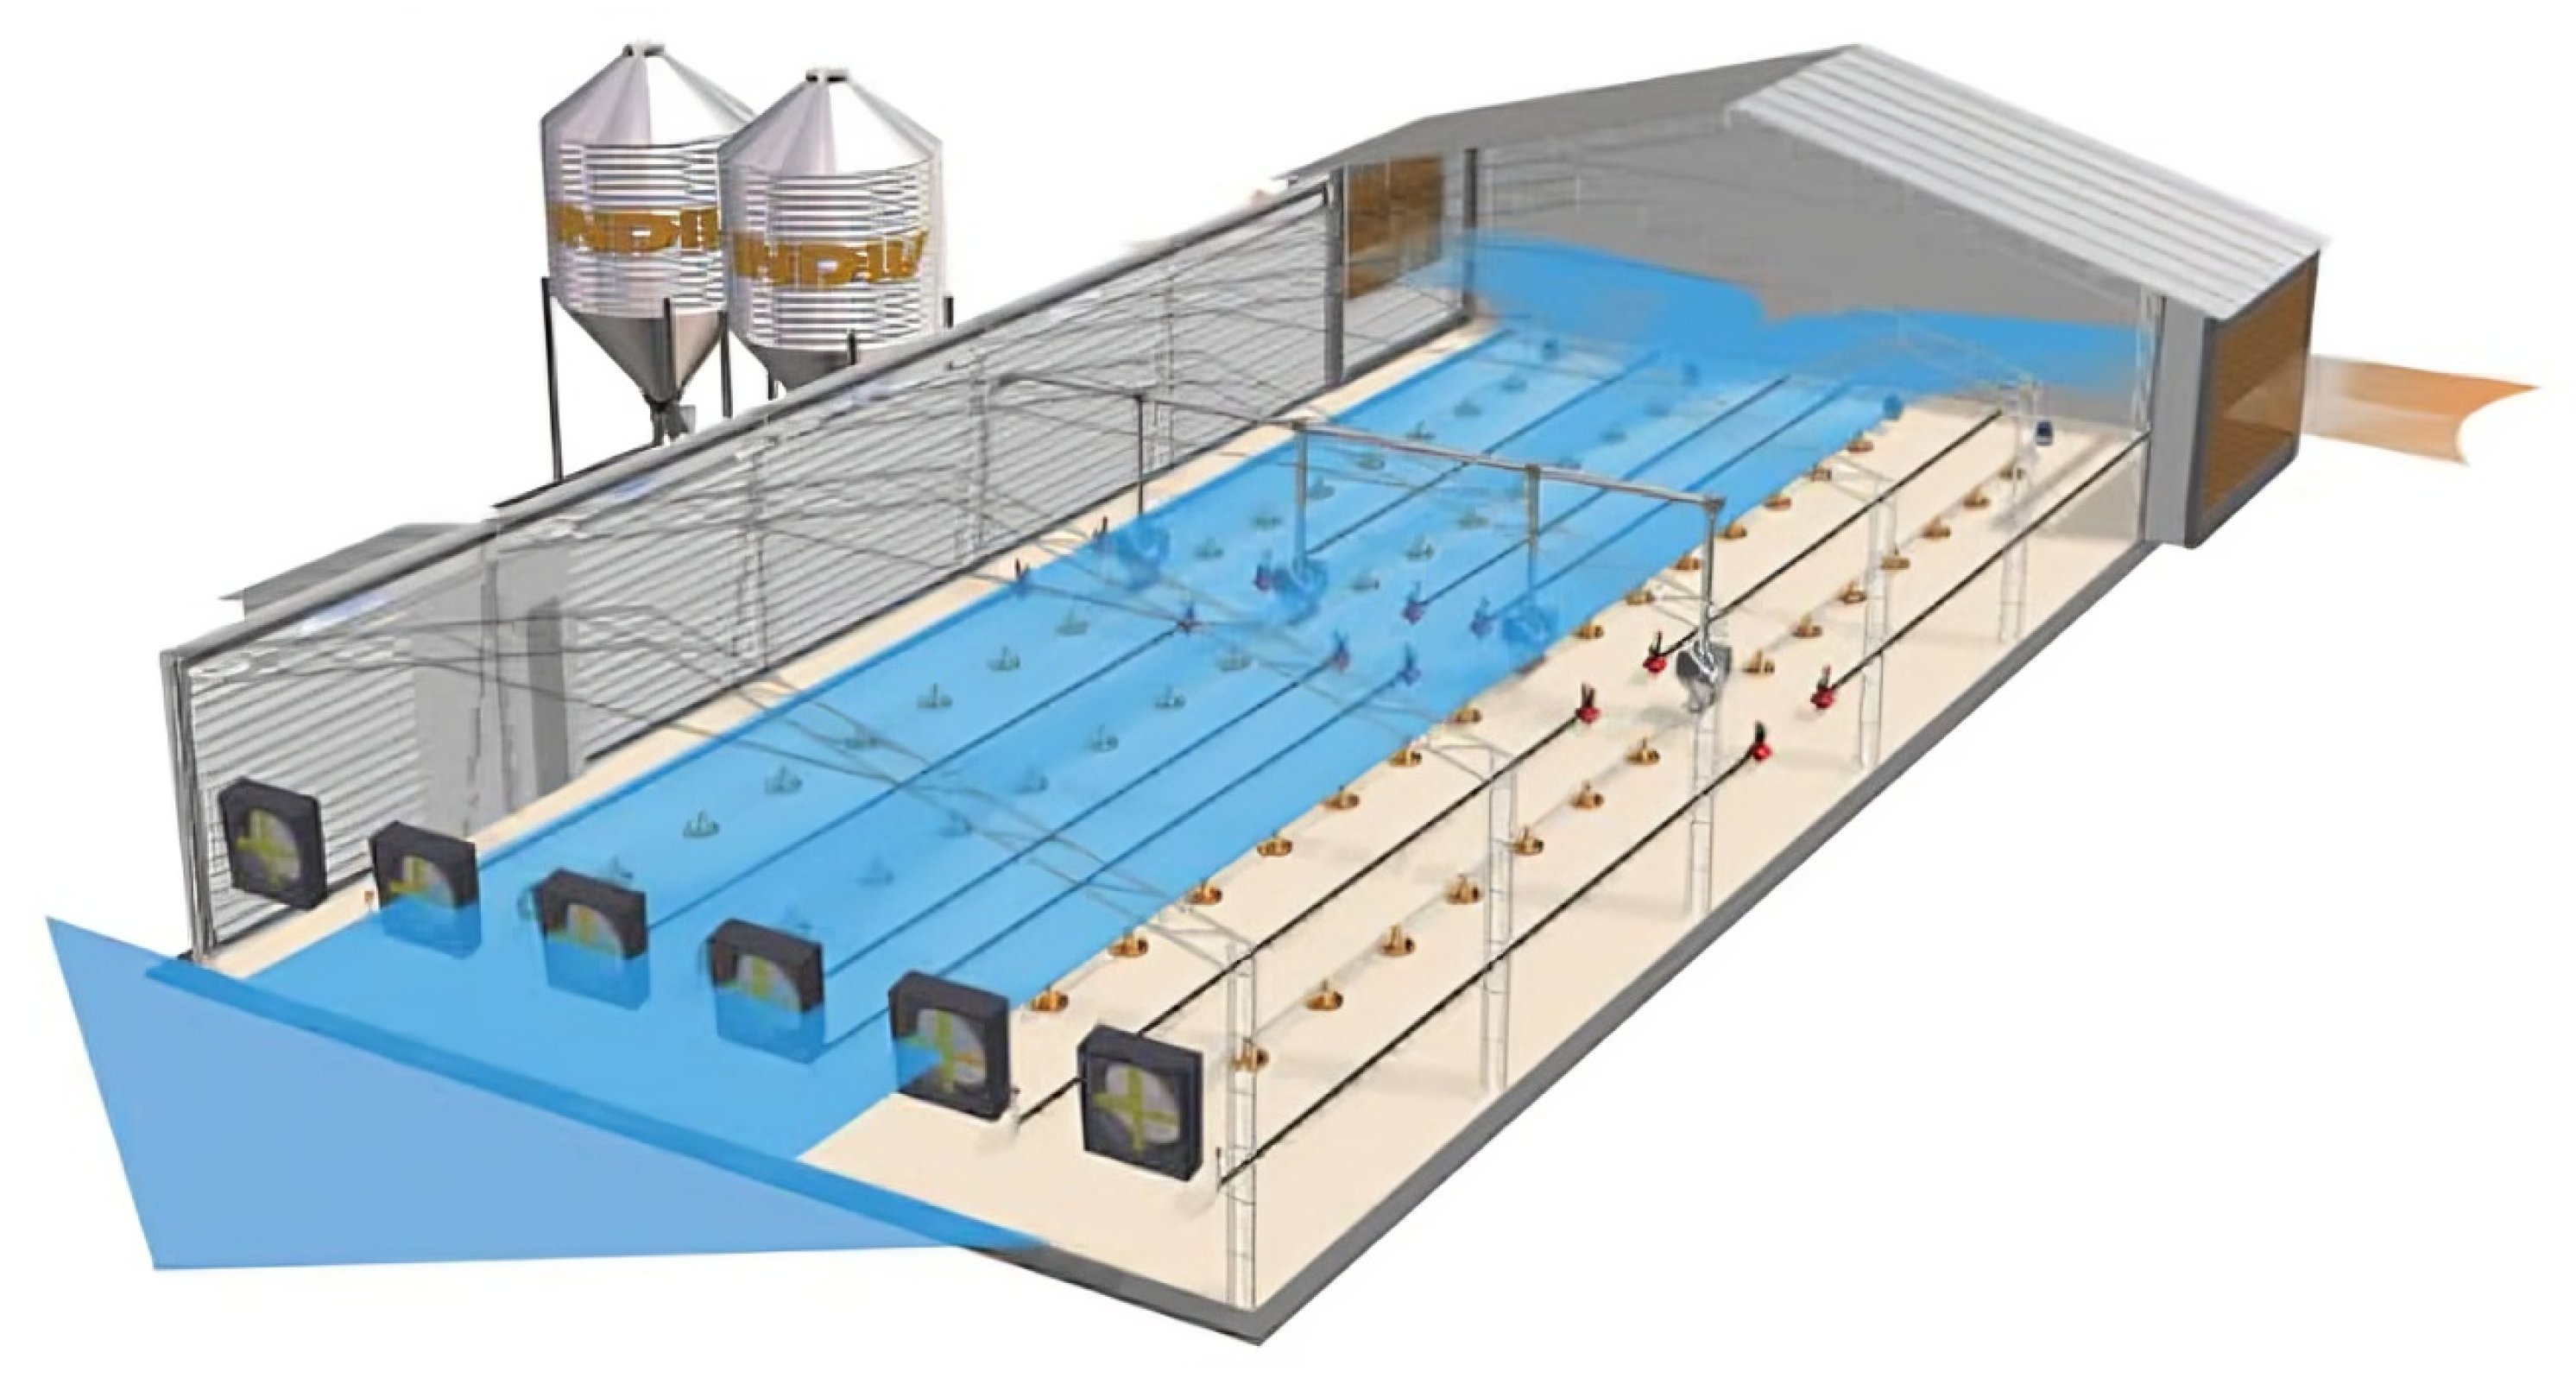
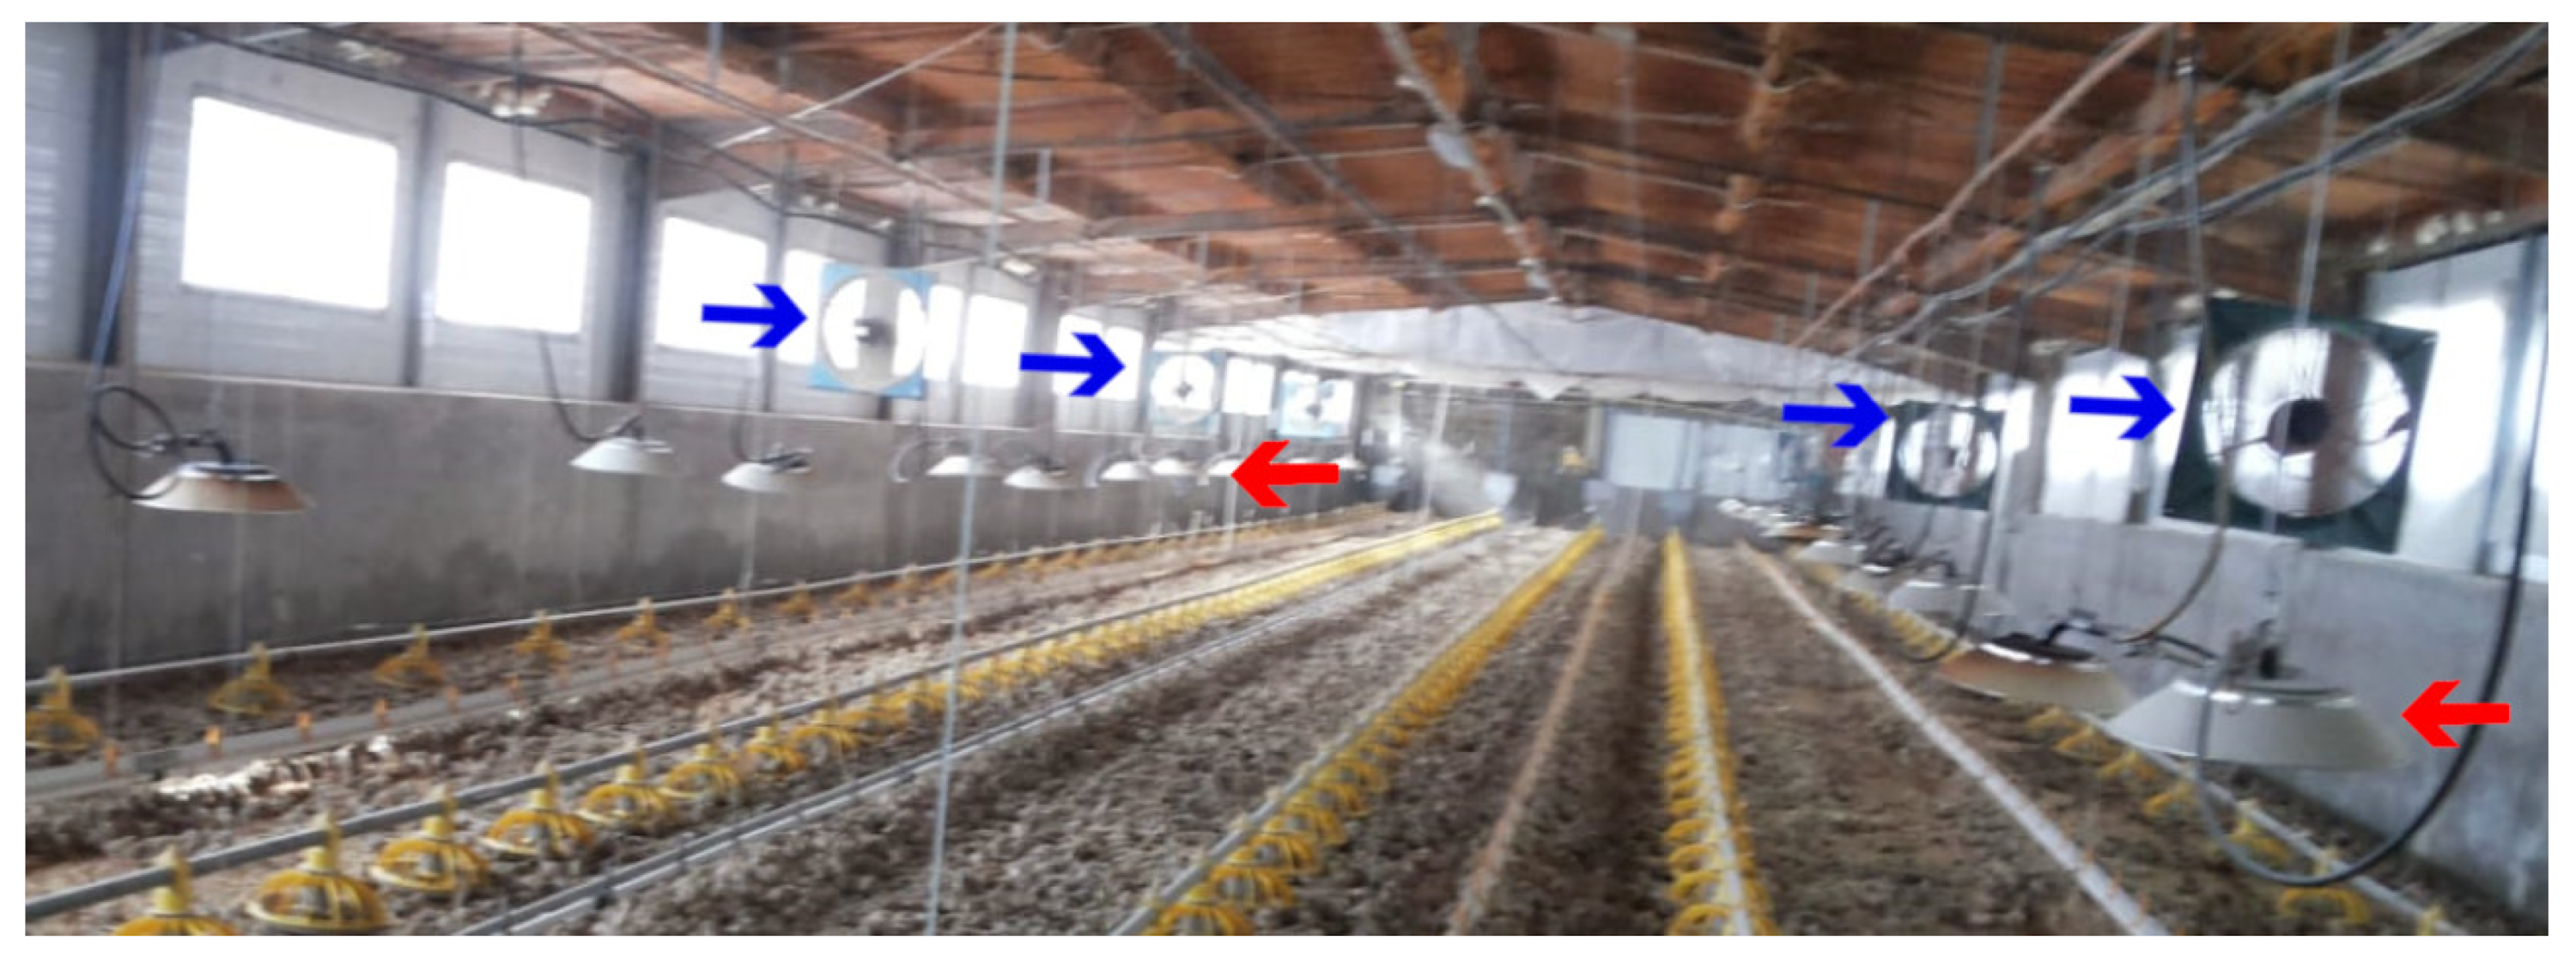
The fans in these installations also disperse the high concentrations of ammonia, relative humidity, and heat in the environment. A system can use fans positioned at one end of the poultry house to create a flow that enters and then exits at the other end, forming a wind tunnel, one of the typical configurations, as depicted in
Figure 1. Side curtains may be kept closed to allow the formation of a wind tunnel or may be opened to prevent this, thereby maintaining a comfortable temperature, as shown in
Figure 2. These two methods are used seasonally: the wind tunnel approach is typically used in summer, while the system without a wind tunnel is preferred in winter [
42].
These fans are powered by voltage from a Variable Speed/Frequency Drive (VFD), generally three-phase. They are controlled using a voltage range from 0 V to 10 V or sometimes using current from 4 mA to 20 mA. This control is used to better manage the comfort temperature, consequently reducing costs. The side curtains prevent sunlight and rain from entering the poultry house and control the ventilation inside. The curtains are usually operated by a system of steel cables suspended near the roof of the poultry house, which can open or close them. A motor, controlled by voltage from a VFD, is used to operate this system. The motor has an integrated potentiometer to detect the position of the curtains, providing an analog signal.
In summer, when the temperature and relative humidity are higher, a system used in more advanced poultry houses increases moisture and lowers the temperature. This system uses high-pressure water from a high-pressure pump. The water, under high pressure and dispersed through small sprinklers (see
Figure 3), creates a mist that helps increase moisture and reduce the temperature. This system is combined with fans for better overall efficiency. The misting system is controlled by an On/Off method with hysteresis. Constant system use is not recommended, as the mist could turn into rain [
43].
Studying the systems used in poultry houses revealed that most have a controller, for each system to monitor and control the temperature, relative humidity, ventilation, and curtains. Some existing systems have independent controls for each situation, and the temperature control is the most commonly used in most systems. In the case of using fans, VFDs are used with manual control, requiring the system manager to manage them. Only the most advanced poultry houses have an automatic control system for the fans; typically, the fan control is controlled by voltage, which increases with temperature, starting at 20 °C with a small percentage and reaching maximum speed at 30 °C [
44]. Curtains are controlled manually; the system manager decides whether to open or close them. Misting control is only used in more advanced poultry houses, typically in warmer climates [
45]. This system is only activated in extreme cases, when the temperature exceeds 30 °C. Otherwise, the system remains off.
Ammonia production in poultry houses primarily results from the microbial breakdown of uric acid in poultry manure. Environmental factors such as temperature, humidity, ventilation efficiency, and manure management practices significantly influence ammonia levels. High ammonia concentrations, typically above 25–30 ppm, pose serious health risks to poultry. These include respiratory irritation, weakened immune responses, and increased vulnerability to respiratory infections [
46]. Prolonged exposure can cause eye irritation, reduced growth performance, and even increased mortality rates in severe cases. Therefore, maintaining ammonia concentrations is essential for poultry welfare, as established poultry farming guidelines recommend.
4. WiMoCoSPH—System Attributes
The purpose of the system is to monitor and control the temperature, relative humidity, and ammonia inside a poultry house. The system enables users to monitor physical quantities in real time and other parameters, such as the position of poultry house curtains, through an Internet connection and a browser, for easy access and visualization. The general architecture of the system (named Wireless Monitoring and Control System for Poultry Houses—WiMoCoSPH) consists of several measurement nodes, which are placed at specific points in the poultry house and which, via a wireless communication network, are connected to a central processing unit—the control node—which collects data from all the measurement nodes and performs all the necessary management and control actions.
Figure 4 represents the architecture of the WiMoCoSPH.
Wi-Fi is the technology chosen for WiMoCoSPH due to its broad coverage, high data throughput, and compatibility with various IoT devices. It supports real-time monitoring, enabling automated processes like climate control, feeding, and surveillance. Wi-Fi ensures seamless communication across large areas compared to protocols like Bluetooth and Zigbee (which may be better for low-power, long-range applications but lack the speed and real-time capabilities), which have shorter ranges and lower data rates. Its ability to connect many devices simultaneously makes it scalable for expanding operations, while providing robust security protocols for data protection. Additionally, this was a request from the facility owner, since the infrastructure was already available. The Wi-Fi communication used a private network that was used only for this purpose.
MQTT (Message Queuing Telemetry Transport) is a lightweight, publish–subscribe protocol designed primarily for resource-constrained environments, making it highly effective for Internet of Things (IoT) applications. It has a relatively minimal overhead and can keep connections open, making sending data in real-time practical. This is particularly useful for mobile and IoT apps, such as notification services [
47]. HTTP is a typical technique for connecting to the web. Nevertheless, it utilizes a more complex TCP header structure that is not always necessary and can slow things down for many IoT applications. HTTP is widely employed when a customer needs data to be delivered regularly, such as in weather or pollution tracking [
48].
Despite MQTT’s virtues, HTTP (in particular, HTTPS) was chosen for the present implementation, because it is compatible with the Google API, which is crucial for integrating sensor data into Google Sheets. The WiMoCoSPH system uses Google Sheets to store and visualize data. This makes it easy to view from any browser and share using Google Drive. Because the Google API requires secure communication over HTTPS, HTTP was ultimately the best option, fulfilling all these standards.
The poultry production facility is about one hundred meters long and twenty meters wide. Six measurement nodes were distributed, arranged in a rectangular shape, about thirty meters apart. Clearance was also left between the nodes and the facility’s walls. The control node was placed in one of the extremities next to the equipment to be controlled.
4.1. Measurement Nodes
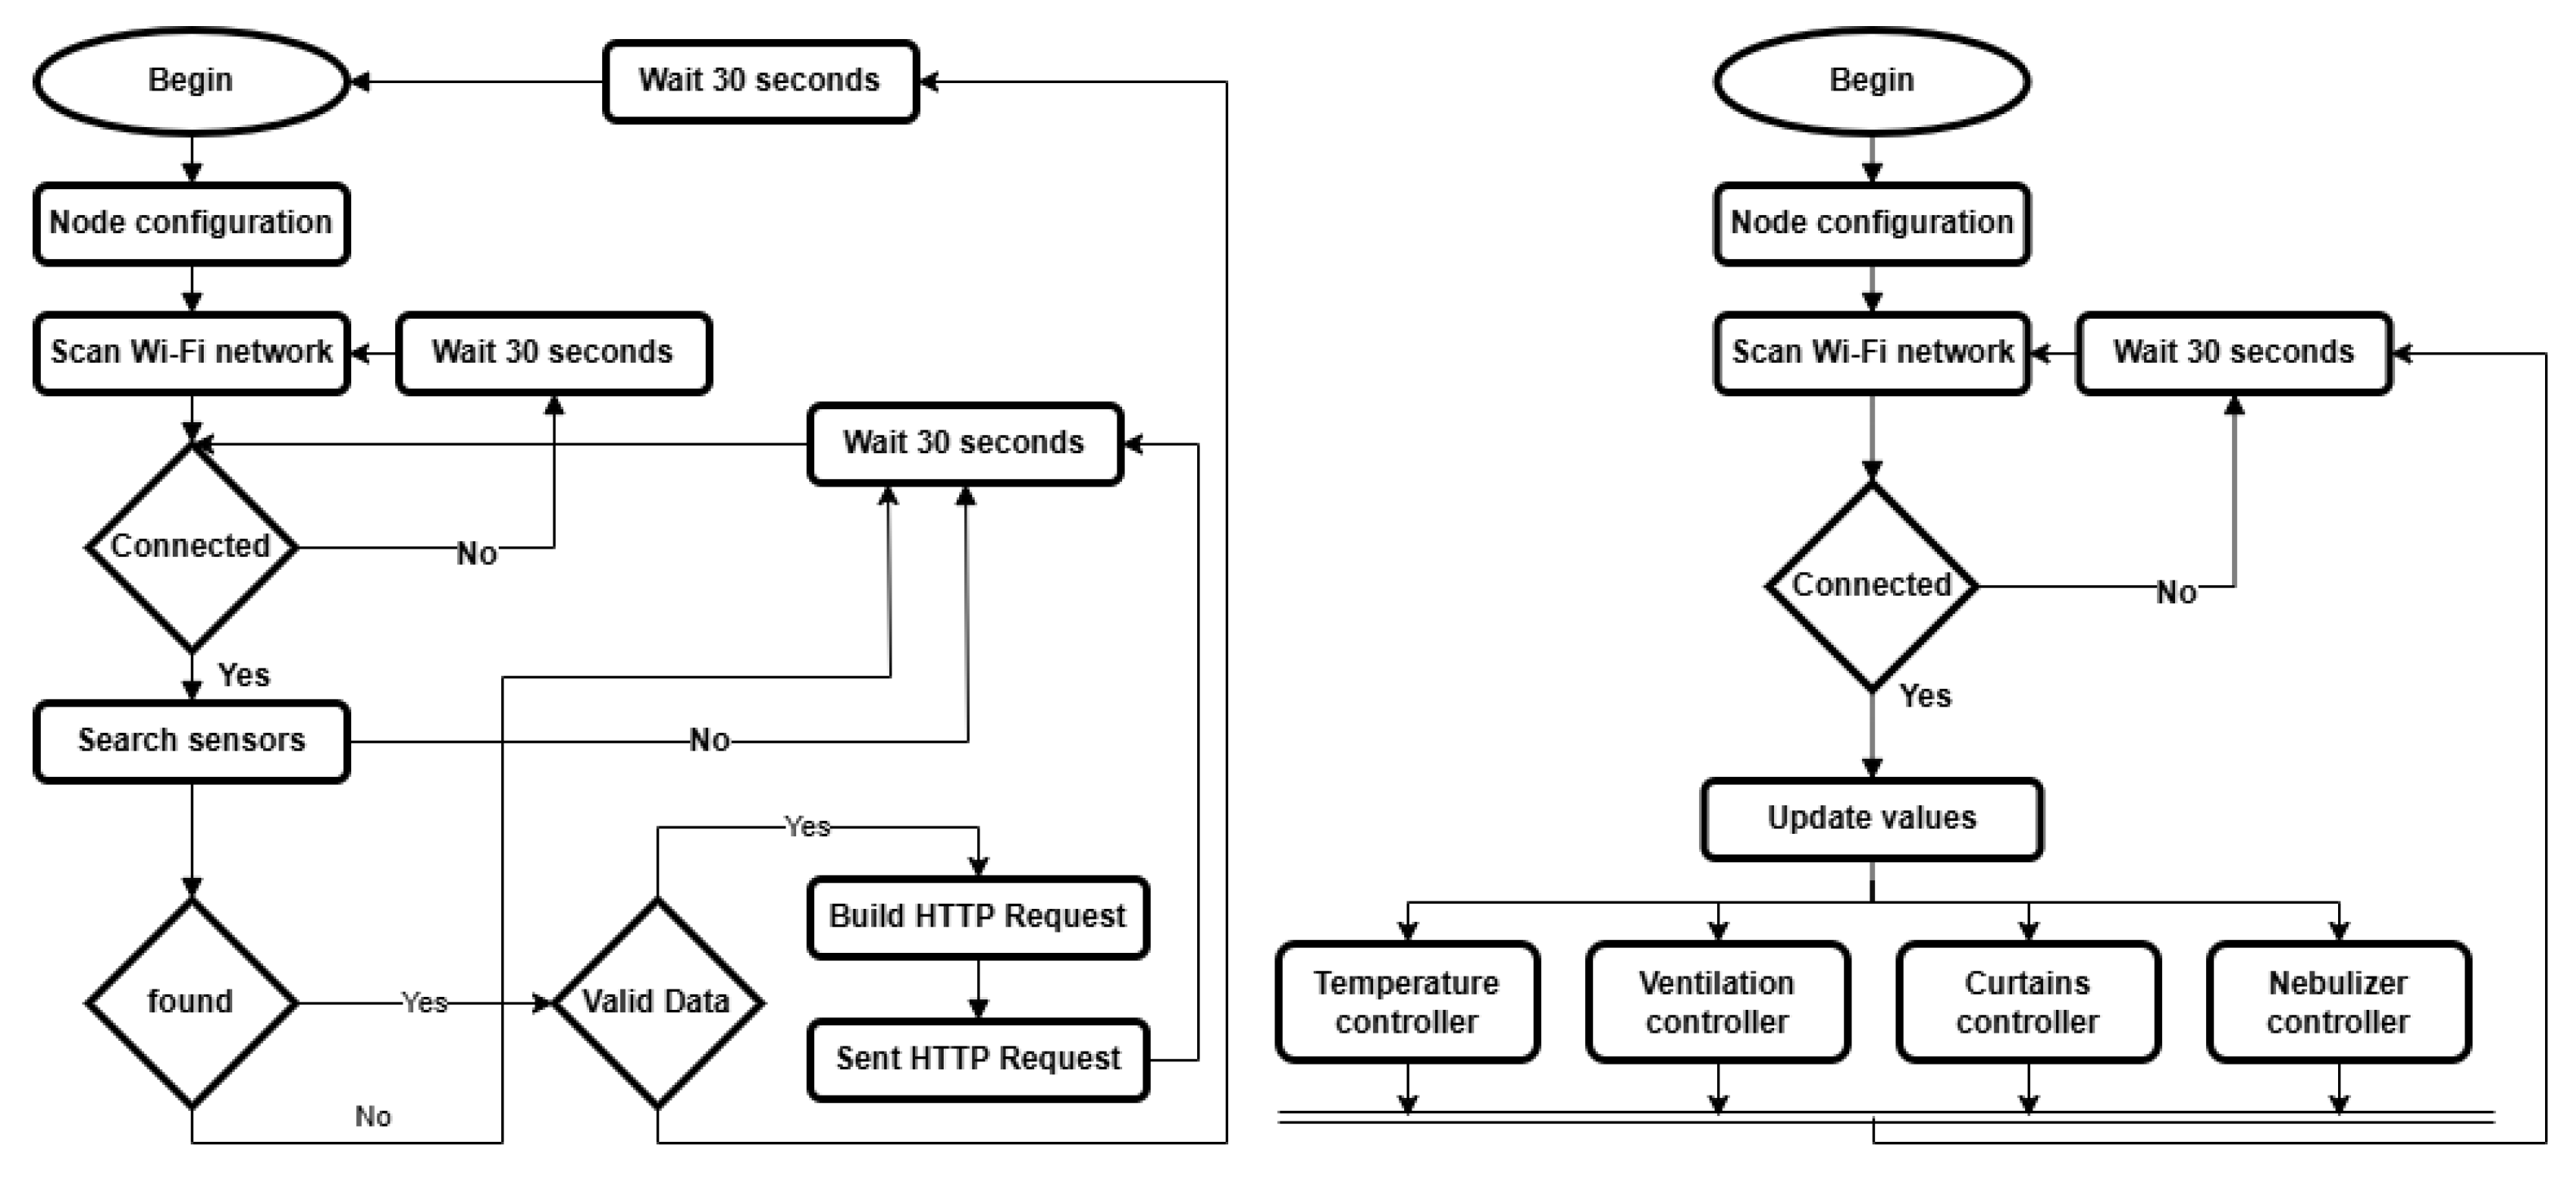
The measurement nodes of the WiMoCoSPH system are modules installed throughout the poultry house and linked via a wireless network. These nodes periodically collect temperature, relative humidity, and ammonia data, transmitting this information simultaneously to the control node and the web server. Each measurement node has the following characteristics/functionalities:
It is a system enclosed in a robust protective case;
It is connected to the control node via a wireless link;
It automatically transmits data measurements to the control node and the web server via HTTP requests;
It receives updates over the wireless link;
It is remotely re-parameterized with different remote sending times.
Figure 5 illustrates the generic architecture for the measurement nodes, comprising the following components:
Mainboard: contains the power supply, a microcontroller (ESP32-S2-WROVER);
Input/Output: general-purpose interface ports and specific ones to connect sensors;
Sensors: devices to measure temperature, relative humidity, carbon dioxide, and ammonia;
The ESP32-S2-WROVER provides the wireless network connection.
Figure 5.
Architecture of the measurement nodes.
Figure 5.
Architecture of the measurement nodes.
For this practical application, it was established that the microcontroller should meet the following minimum requirements: at least 128 kB of memory, four ADC ports, one I2C interface, one SPI interface, wireless communication capability, and Real-Time Operating System (RTOS) support. Based on these criteria, the ESP32-S2-WROVER was selected, offering 512 kB of RAM, wireless and Bluetooth connectivity, and 38 I/O ports.
Regarding sensors, it was decided to use the HDC1080 from Texas Instruments for temperature and relative humidity, the Adafruit CCS811 for carbon dioxide and the MQ-135 from Hanwei Electronic for ammonia.
4.2. Control Node
The control node, which is the central hub of the Wireless Monitoring and Control System, performs the following functions:
Manages all the communication within the wireless network;
Wireless network connection for updates over the wireless link;
Gathers data measurements from all the measurement nodes and relays it to the web server API;
Send updates to the measurement nodes;
Controls appropriately all the actuators (ventilation actuators, heaters, sprinklers, and curtains).
Figure 6 illustrates the generic architecture of the control node, composed of the motherboard, which contains the power supply, a microcontroller, interfaces for input/output, wireless network communication, and the web server.
The output circuit is electrically isolated from the control system by means of opto-triacs, the MOC3021, and relays, the G5V-2 12DC. To ensure that the microcontroller’s digital lines are protected against electrostatic discharges and voltage transients, diodes are needed in parallel with the relays. These diodes and the transistors are included in the integrated circuit, the ULN2803.
4.3. Prototype—Control Node
The prototype of the control node includes the power supply unit and multiple interfaces designed for controlling actuators.
Several protection measures were implemented in the control node’s power supply, to ensure maximum reliability and protection of the equipment, from filtering the input power supply to increase stability, to noise filtering to eliminate the current or voltage spikes that typically occur in industrial environments. For the control node, a power supply providing three voltage lines was decided upon:
A 12 V line for supplying the power circuit and the Digital to Analog Converter (DAC) for the analog output;
A 5 V line dedicated to transistor–transistor logic (TTL) circuits;
A 3.3 V line for supplying the microcontroller and the digital electronics of the control node.
The maximum necessary current was estimated as 300 mA for the 3.3 V line, 100 mA for the 5 V line, and 100 mA for the 12 V line, resulting in a total power of 2.7 W, as shown by (
1).
To implement these three voltage lines, with a safety margin for power concerns, a Hi-Link HLK-PM12 was used to convert the AC voltages (from 85 V to 350 V) to a 12 V DC output, an LM2575-5.0 voltage regulator to output 5 V from 12 V, and an LM3940 voltage regulator from Texas Instruments, to convert a 5 V input to a 3.3 V output. The control node power supply circuit is based on these three components and is shown in
Figure 7.
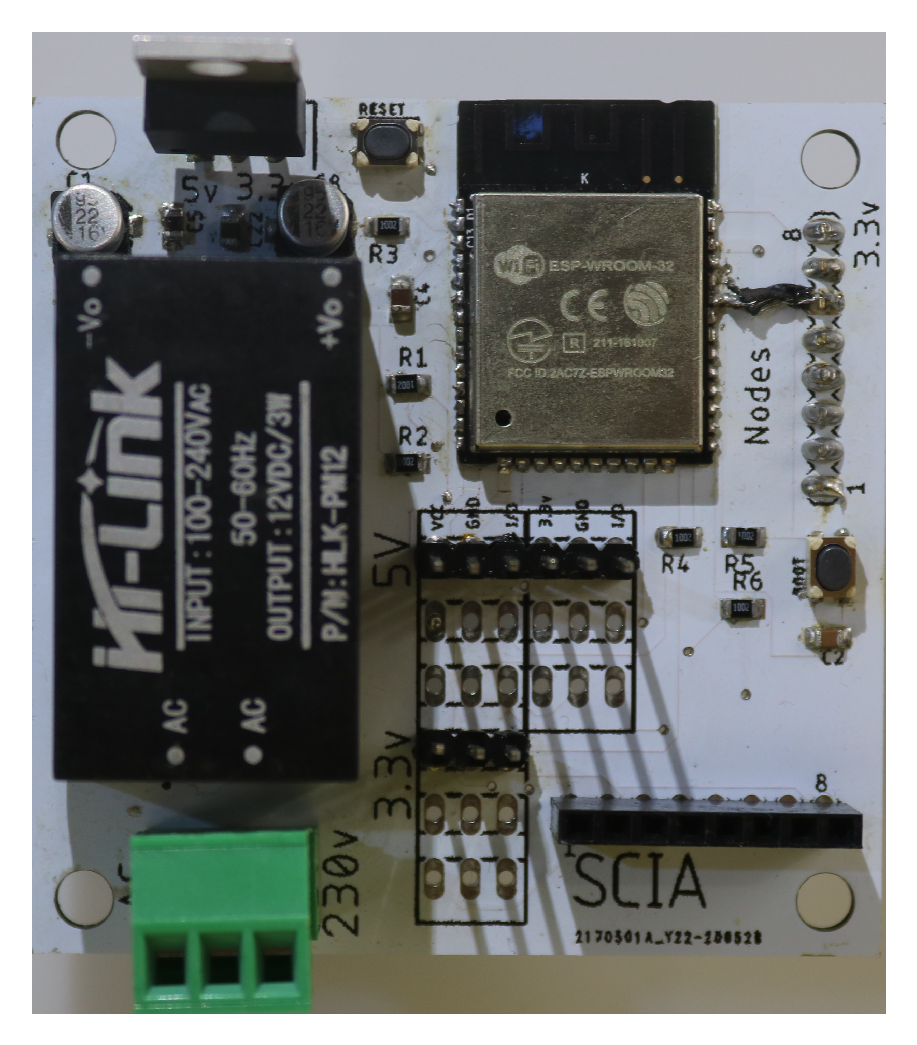
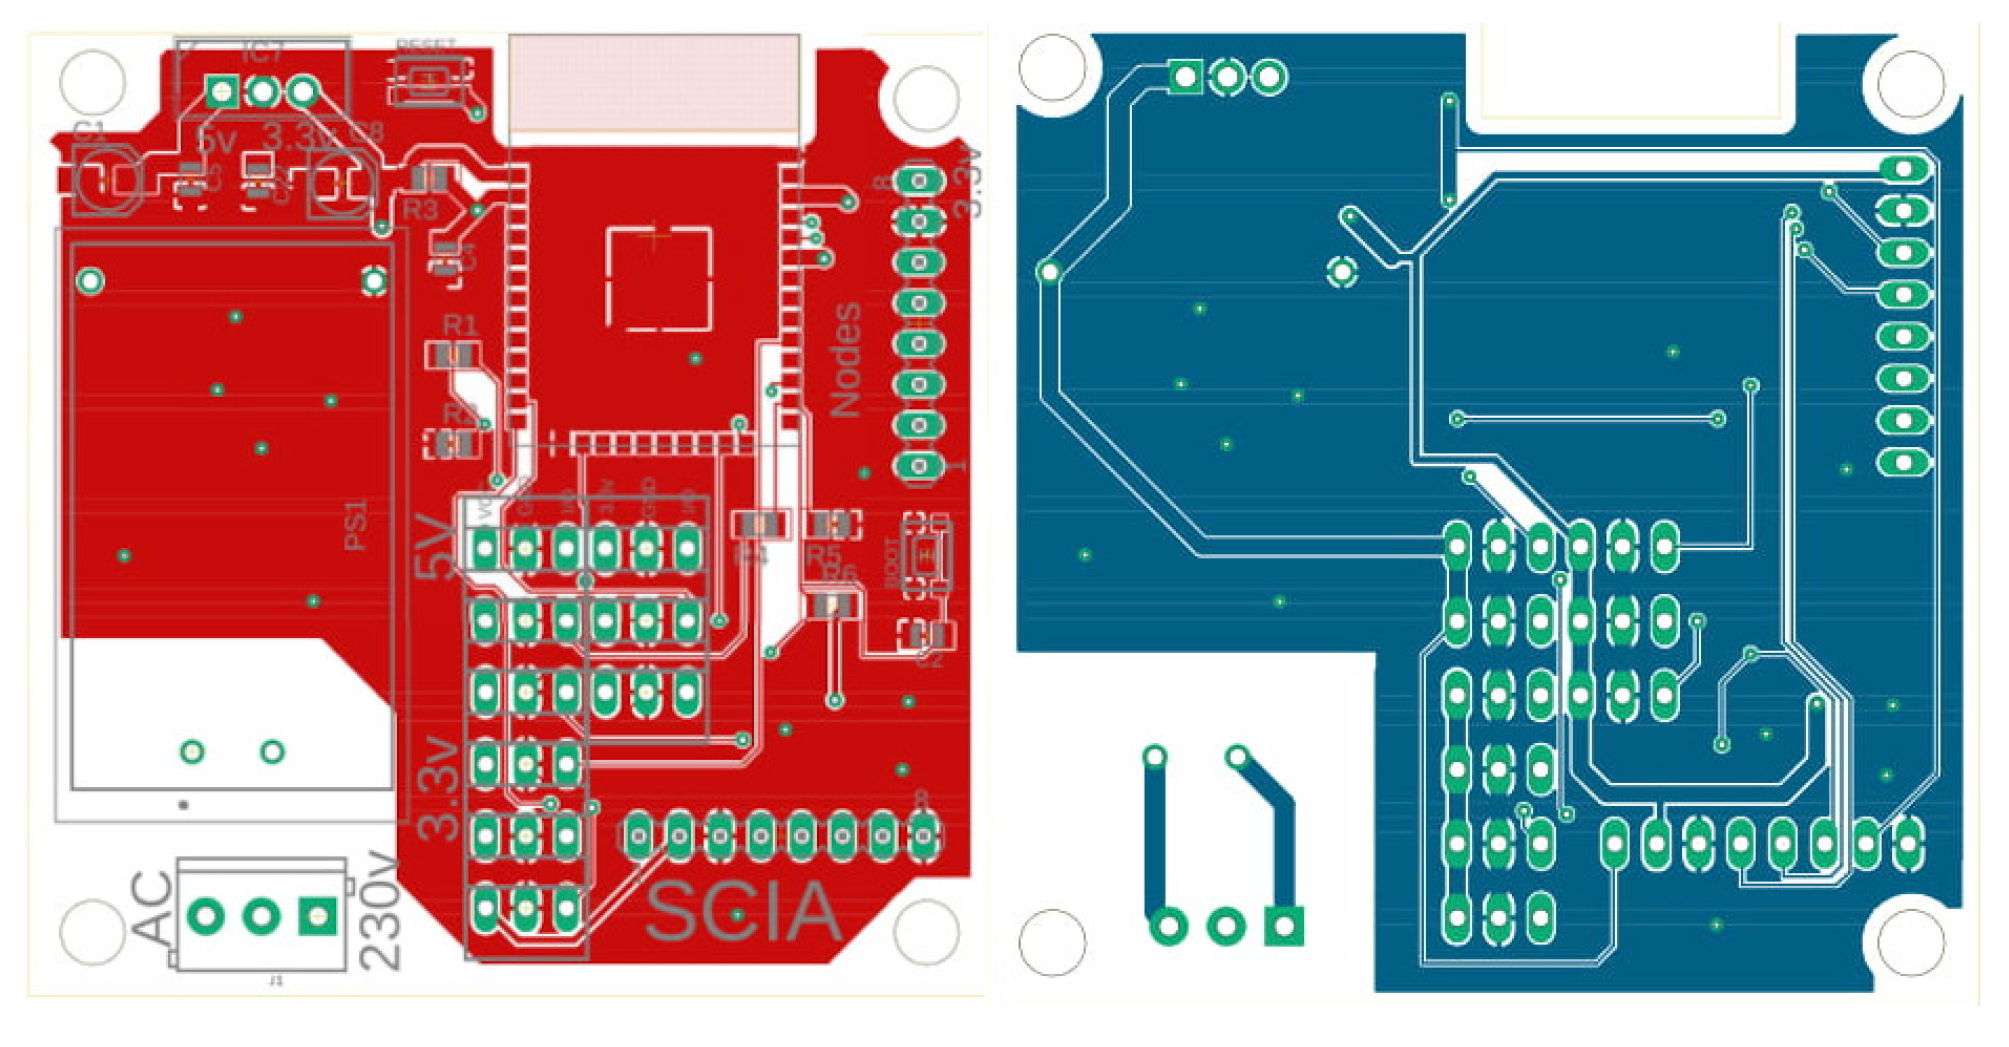
Typically, the power supply, inputs/outputs, and switching of digital circuits generate noise throughout the system, particularly in the power and ground lines, which serve as the common return points for the entire circuit. The power supply lines were equipped with filters of sufficient capacity to smooth out current peaks and minimize noise in the circuit. In addition, the overall PCB was designed with ground planes to enhance the electrical conductivity in the ground line, serving as the common point for all the current flowing in the control node. Additionally, contact points between PCB layers were implemented. Images of the PCBs are shown in
Figure 8 and
Figure 9.
In
Figure 8 showing the control node, in the top right-hand corner (yellow rectangle), it is possible to observe the analog outputs connecting to the fans’ PWM. In this case, we need analog outputs, in the case of 0–10 v. The DAC5574IDGS carries out this control. As the device is powered by 3.3 v, an amplifier must triple the voltage to reach the required voltage using the TL084. About halfway down (blue rectangle), it is possible to see the ZFHA.002.12 and G5V-2-H1 relays, which control the opening of the windows. On the left of the ESP32 in the red rectangle is a PCF8574 module, providing the digital output that turns the heaters on and off.
The tests confirmed the prototype’s effectiveness in controlling the various actuators, and the power supply proved to be more than sufficient, with a comfortable safety margin.
4.4. Prototype—Measurement Node
The prototype of the measurement node includes a power supply unit and multiple interfaces for the connected sensors. The power supply of the measurement node is like that of the control node (
Figure 10), as it uses the same components to derive three voltage lines from a 230 VAC input. However, in this case, the 12 V line is exclusively used to supply the 12 V-to-5 V converter and is not intended to power any additional devices. Therefore, the total power available for the ESP32 microcontroller and the various sensors is, as shown by (
2).
The assembled PCB and its corresponding layout design are shown in
Figure 11 and
Figure 12. The tests confirmed the prototype’s effectiveness in sensory data acquisition, and the power supply proved to be more than sufficient, with a comfortable safety margin.
7. Conclusions
Poultry production is challenging, requiring the creation of an optimal environment with specific bird conditions. This work focused on monitoring and controlling key parameters in poultry houses, including the temperature, relative humidity, carbon dioxide, and ammonia levels. Any effective solution must ensure these parameters remain within acceptable ranges, as detailed in
Table 1 and
Table 2. Existing solutions in poultry houses often rely on a central module connected to sensors via cables that transmit analog signals, which can lead to accuracy issues over large distances. IoT devices connected through a wireless network offer a more reliable alternative to address these challenges.
This work presented a system consisting of a mesh of measurement nodes connected to a centralized control node. The control node interfaces with a web server that hosts a dashboard, enabling users to access real-time information and configure desired parameters for poultry houses. The system was fully developed and tested in real-world conditions, demonstrating its effectiveness in maintaining optimal environmental conditions by regulating key factors essential in poultry houses, such as temperature, relative humidity, carbon dioxide, and ammonia levels. While the tests focused on temperature and ammonia, the system is designed to monitor and control all these parameters, which are critical for poultry welfare.
We now consider the previously presented research questions:
RQ1: How can wireless-based technological trends be applied in poultry farming facilities?: Wireless-based technological trends can be effectively applied in poultry farming facilities by leveraging IoT-based systems like the one proposed. This system uses Wi-Fi-enabled sensors to monitor environmental parameters such as temperature, humidity, carbon dioxide, and ammonia. Measurement nodes distributed across the facility wirelessly transmit data to a central control node. This node processes the data, enabling automated adjustments to ventilation, heating, and misting systems, ensuring optimal conditions for poultry welfare. Integrating real-time monitoring through a web-based dashboard allows facility managers to remotely oversee and adjust environmental conditions. By eliminating the limitations of traditional wired systems (such as high installation costs, signal degradation over distances, and electromagnetic interference between signal and power signals), this wireless approach enhances scalability, reliability, and ease of management, making it a promising solution for modern poultry farming environments. Our system effectively provides a case study solution in a real scenario, presenting a solution to be considered at an industrial level.
RQ2: What are the practical considerations for deploying IoT-based systems in real-world poultry farming environments?: Deploying IoT-based systems in real-world poultry farming environments requires addressing practical considerations such as infrastructure compatibility, environmental resilience, and scalability. Facilities must support reliable power supplies and Wi-Fi connectivity to accommodate IoT devices like measurement nodes and control hubs. Using robust hardware and protective casings, these systems must be designed to withstand harsh conditions, including high humidity and ammonia levels. Accurate sensors and real-time monitoring dashboards are essential for effective environmental management, allowing automated control of temperature, humidity, and ventilation. Strategic node placement ensures optimal data collection, while maintaining scalability for large operations. While the initial setup costs and training may pose challenges, the long-term benefits of enhanced productivity, reduced manual intervention, and improved animal welfare may make IoT-based systems a transformative solution for modern poultry farming.
As future directions, the authors are considering integrating external temperature and relative humidity data into poultry facility management to optimize environmental control, energy efficiency, and animal welfare. By leveraging real-time outdoor conditions, facilities can adjust ventilation, heating, and cooling systems to align with natural conditions, reducing reliance on mechanical interventions and lowering operational costs. Additionally, monitoring external conditions supports proactive adjustments to mitigate environmental stressors, ensuring consistent animal comfort and productivity. By incorporating weather forecasts and seasonal trends, facilities can anticipate changes and adapt systems accordingly, reducing disease risks and enhancing long-term sustainability. This data-driven approach supports optimal poultry growth and welfare and aligns with economic and environmental goals, by improving efficiency and reducing the facility’s energy footprint.


