1. Introduction
During the 21st century, the proliferation of data sources, eminently driven by the omnipresence of the Internet, has led to the generation of an unmanageable amount of data. However, the processing of these data in order to extract, firstly, information and, subsequently, knowledge, is one of the greatest technological challenges faced by human beings in the last decade.
In this context, Big Data has been by far the most developed concept with the aim of processing and extracting value from this huge amount of data. However, the term Big Data is not exactly new, the first time it was used as such was in an article published in 1997 [
1], in which the authors pointed out the problem of storing in main memory, or even on disk, the data sets obtained (for visualization in this case) due to the size of the data and called the problem Big Data.
However, the Big Data concept has become more relevant in recent years mainly due to the strong sensorization of systems [
2] and the growth of data led by the proliferation of the Internet at all levels: leisure (social networks), business (online buying and selling), research, and so forth.
There are many sources that predict exponential data growth toward 2020 and beyond. Most of these sources agree that the size of the digital
universe will double at least every two years. Data generated as a result of human-machine interactions are growing 10 times faster (4.4 ZB to 44.4 ZB) than data associated with traditional business information sources, with device-generated data growing approximately 50 times faster (0.09 ZB to 4.4 ZB) [
3].
One of the sectors [
4] in which Big Data can bring great benefits is the agri-food industry. In this sector, many efforts are being made to apply Big Data techniques, for example, crops can be chosen according to the area in which they are to be grown and the available data (previous crops, performance, climate, etc.).
This field of application of Big Data is essential for a region like Extremadura (Spain) and is the reason why the CultivData project has been developed.
This project has developed an information system, supported by a computer platform of the same name, whose purpose is the open data cultivation to extract knowledge from them and support the decision making of stakeholders so that it is possible to improve the quality of products and the productivity of farms.
The resulting system seeks to integrate, in a single place, access to data provided by Internet of Things (IoT) devices used in the so-called precision agriculture and the data sources publicly available under the umbrella of the Open Data [
5].
The platform has been designed with the intention of being useful for agricultural decision makers in terms of planning which species and crops to authorize based on data such as, for example, available water; expected weather; prices and market demands [
6].
In addition, the platform provides access to historical climate data to agricultural producers; climate forecasts to anticipate times of drought or disasters; pest situations or monitoring of their plantations with sensorization and orthophotographs.
The growth and rise of the internet of things over the last few years has also covered an essential sector, agriculture. The first phase of a precision agriculture process is exactly this, the application of IoT to crops or farms, through the use of sensors [
7] or drones [
8]. The process ends after carrying out a task of analyzing the collected data and making the right decisions after understanding what the data means.
Many studies related to precision agriculture get stuck in this part of data analysis, resulting in a monitoring of the farm [
9] without extracting real knowledge from the data. Those that do manage to carry out analysis tasks [
10] have the problem of data scarcity. The CultivData project brings together data extracted through IoT techniques and those from open data sources, avoiding this problem.
2. Methodology
2.1. Public Data Sources
The first step in the development of the information system is the identification and analysis of open data sources that may be of interest. In this way, their suitability for inclusion in the system can be assessed.
2.1.1. Identification of Sources
For the identification of sources, a selection process divided into a series of phases is specified, the result of which will be a list of those that are potentially interesting: elaboration of a catalog of keywords that allow a precise search, Internet search of data sources based on the terms included in the previous catalog, identification of available public and private organizations that offer open data sources, identification of potentially relevant sources for the system and categorization of the data provided by the sources according to their type.
2.1.2. Rating and Selection of Identified Sources
Once a first list of sources resulting from the previous phase has been obtained, and after an initial analysis, various characteristics inherent to the data sources that can be used for their selection are identified:
Way to access: set of techniques that allow data to be located, categorized, modified and accessed. Three ways to access are identified: through APIs and HTTP requests (more advantageous as it allows access automatically and in reusable formats), through web forms, and through a map viewer (the latter requires a person to enter the filtering parameters).
Data format: the data formats in which the data are provided by the sources (JSON, RDF, XLS, CSV, HTML and PDF) are identified.
The reuse of open data is considered essential, so each identified source is evaluated according to the degree of openness of the data available, using the criteria shown in the
Table 1.
Update frequency: a source that provides near real-time data may be more useful than one that is updated over longer periods. In addition, the date of the last update should also be kept in mind.
Data volume: this is a complementary characteristic since a large volume of data, being irrelevant or unstructured, may not be interesting.
Filtering parameters: it is important that the information source allows data filtering according to different parameters.
Data types: the same source may offer a wide variety of data types to be used.
2.2. Sources of Captured Data: Sensorization
One of the objectives of the project is the proposal of the methodology as a pilot project for the sensorization of farms. This sensorization data will complement those coming from open data sources so that 6 farms can use the platform we have built to incorporate historical data for decision making.
The process followed for obtaining, starting up and deploying the sensorization devices comprises the phases indicated below.
2.2.1. Analysis of Available Technologies
Before the start of the project, there are already on the market complete and proprietary solutions focused on agricultural sensorization and intelligent agriculture. In addition, there is also the possibility of developing a system based on the
Open Hardware [
11] movement and following the
Do It Yourself [
12] philosophy. The advantages and disadvantages of using each of the alternatives are therefore analyzed first.
2.2.2. Analysis of the Components That Will Form the System
Once the solution to be used for the sensorization devices has been chosen, the different components that can be part of the system and that are necessary to obtain a functional system are studied.
2.2.3. Development of the First Prototype
Once the available components have been analyzed, a first prototype device is assembled and put into operation. To this end, several independent areas to be developed and studied are identified in order to achieve an assembly that allows its deployment in real environments:
Collection of data on the different selected variables.
Communications and data forwarding to storage servers.
Power supply and system autonomy.
Component strength and assembly.
2.2.4. Functional Tests
Once the first complete prototype for the sensor network is available, various operational tests are performed to identify potential problems in a controlled environment previous to the actual deployment on farms.
2.2.5. First Deployments
Once a complete sensor network system has been obtained and is ready for real deployment based on the results obtained from the first operational tests, the first deployments are carried out.
These will also allow the system to be tested and improved and, thanks to the agile methodology, to incorporate new improvements and adjustments for the following deployments.
2.2.6. Implementation of Improvements
Based on the results obtained from the first operational tests carried out in controlled environments and the first deployments in real environments, several improvements and operational adjustments are made to optimize the system’s performance in order to continue with the deployments.
2.3. Web Platform
The web platform is the part of the developed system intended to have the greatest impact on the system. It is designed with the objective of providing access to information from different sources and facilitating its analysis.
The process of analysis and planning of the platform is designed with the following phases:
Definition of general requirements: so that the adopted solution meets the project’s objectives.
Software Requirements Specification: to provide the necessary support information to the software developers, following the ISO/IEC/IEEE standard 29148:2011 [
13].
Design: a study of the design criteria and decisions to be followed for the first implementation.
Implementation: software development process of the platform, following an agile methodology in iterations, which allows the verification of the adaptation to the objectives set without having fully completed the development.
Deployment: design and execution of a deployment and production start-up process of the platform that guarantees a functional result.
Testing: design and execution of a battery of tests whose objective is to validate the correct functioning of the developed platform.
Maintenance: once the first version of the platform has been put into production, the tasks of updating and resolving operating incidents.
2.4. Data Analytics
The project also aims to translate and apply the knowledge extracted from the data into actions and information understandable to the stakeholders of the agri-food sector and make it available to them through the web platform.
The objective, therefore, is the design and development of data models and algorithms that allow extracting knowledge from data available from external sources (open data sources) and internal sources (sensors and generated information).
The CRISP-DM (
Cross Industry Process for Data Mining) [
14] methodology is used to develop these models. This methodology divides the data mining process into six main phases:
- 1.
Understanding the business: sets the final objectives followed with the analysis itself.
- 2.
Understanding the available data: this involves a thorough review of the data available for the analysis itself. It involves accessing and exploring the data.
- 3.
Data preparation: necessary to refine the available data before it can be used in the analysis. It includes five subtasks: data selection, cleaning, construction, integration and formatting.
- 4.
Model creation: defines the actions to be performed on the data selected and prepared in previous phases.
- 5.
Evaluation of the models: designed to take stock of the analysis process, as well as a feedback process.
- 6.
Deployment of the models: integration of the models in the platform for access and use by the platform users.
In summary, the design of the research and development that we propose in this work has focused on evaluating the potential of the sensorization of agricultural holdings, counting on the collaboration of farmers to obtain the data that are crossed with data sources. open and public. Through the CultivData platform developed, it will be possible to obtain the necessary knowledge once there is data from several harvests.
3. System Architecture
Extraction of knowledge from open and public farm data, as well as any other relevant source related, directly or indirectly, to farms.
Support for decision making related to products derived from farms.
Sharing of data and information among the agents involved in the agricultural sector and, in general, in the process of obtaining final products derived from farms.
Incorporation of new sources of information coming from the deployment of sensor networks in farms (
Figure 1).
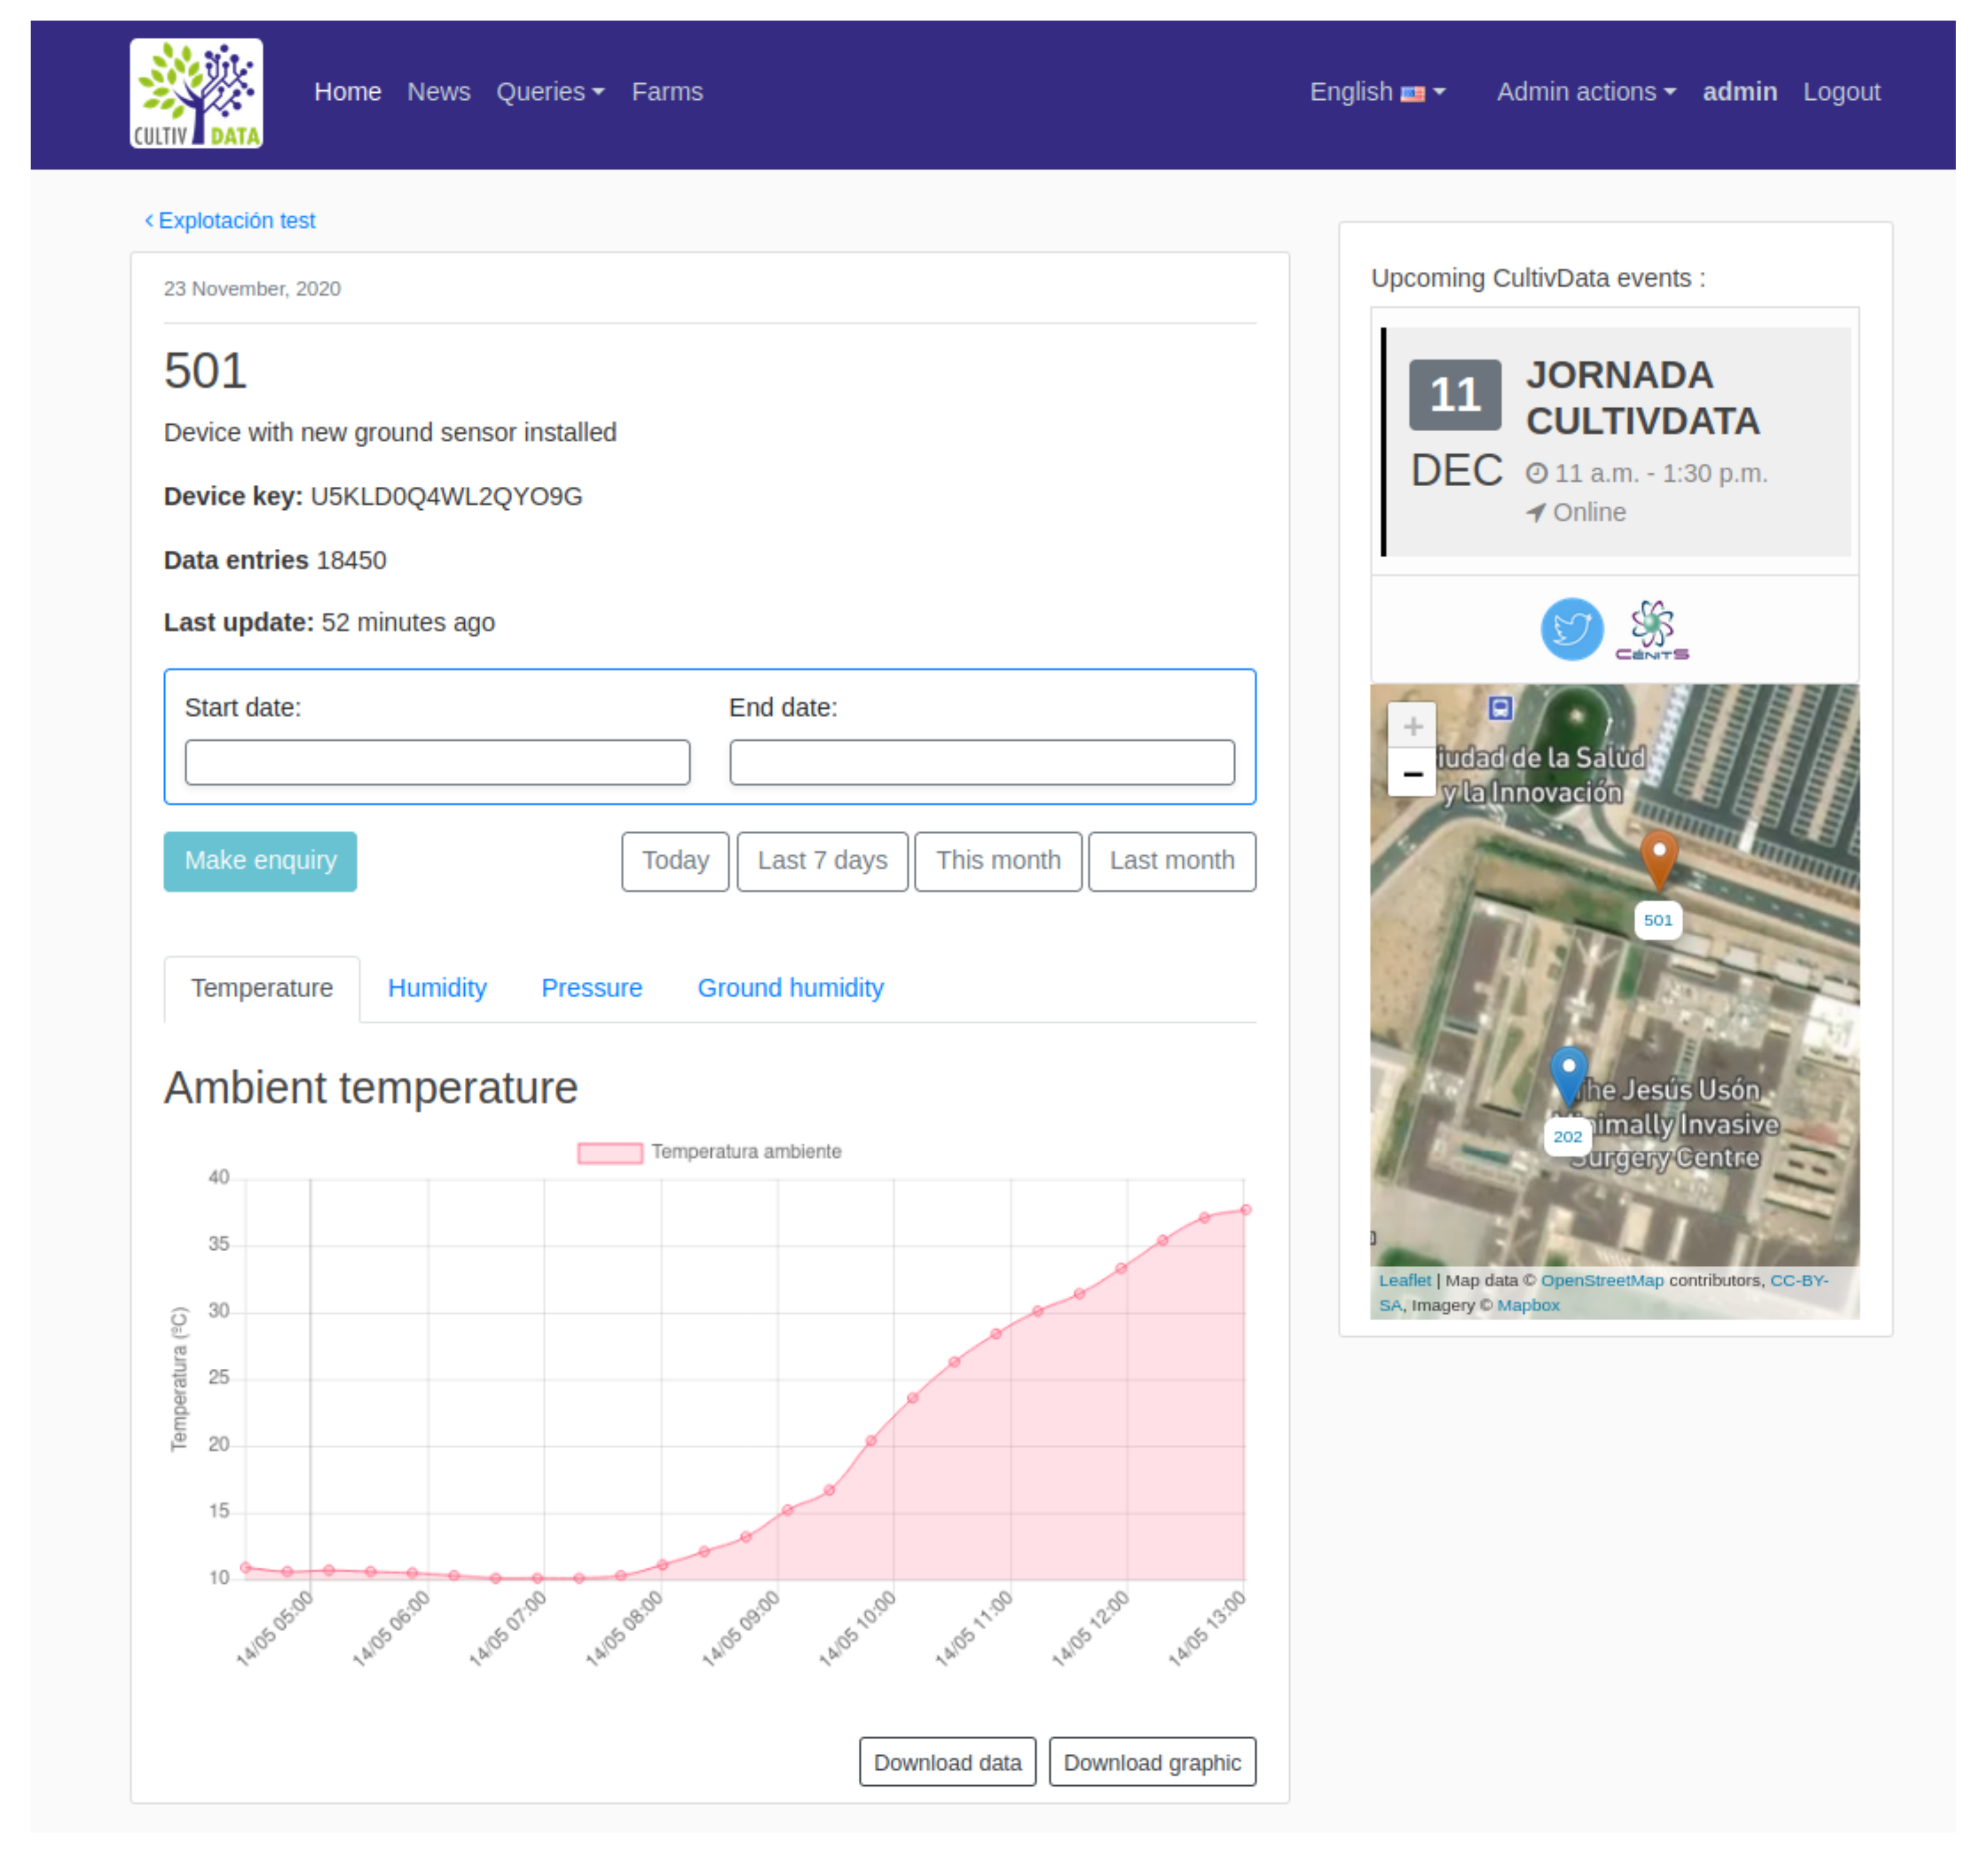
The system consists mainly of a web portal that offers multiple services depending on the type of user. Anonymous users of the platform can access news and information relevant to the sector from a variety of sources with open data. Users participating in the project can access a restricted area where they can consult data from their sensorized farms and make queries to obtain information to support their decision making.
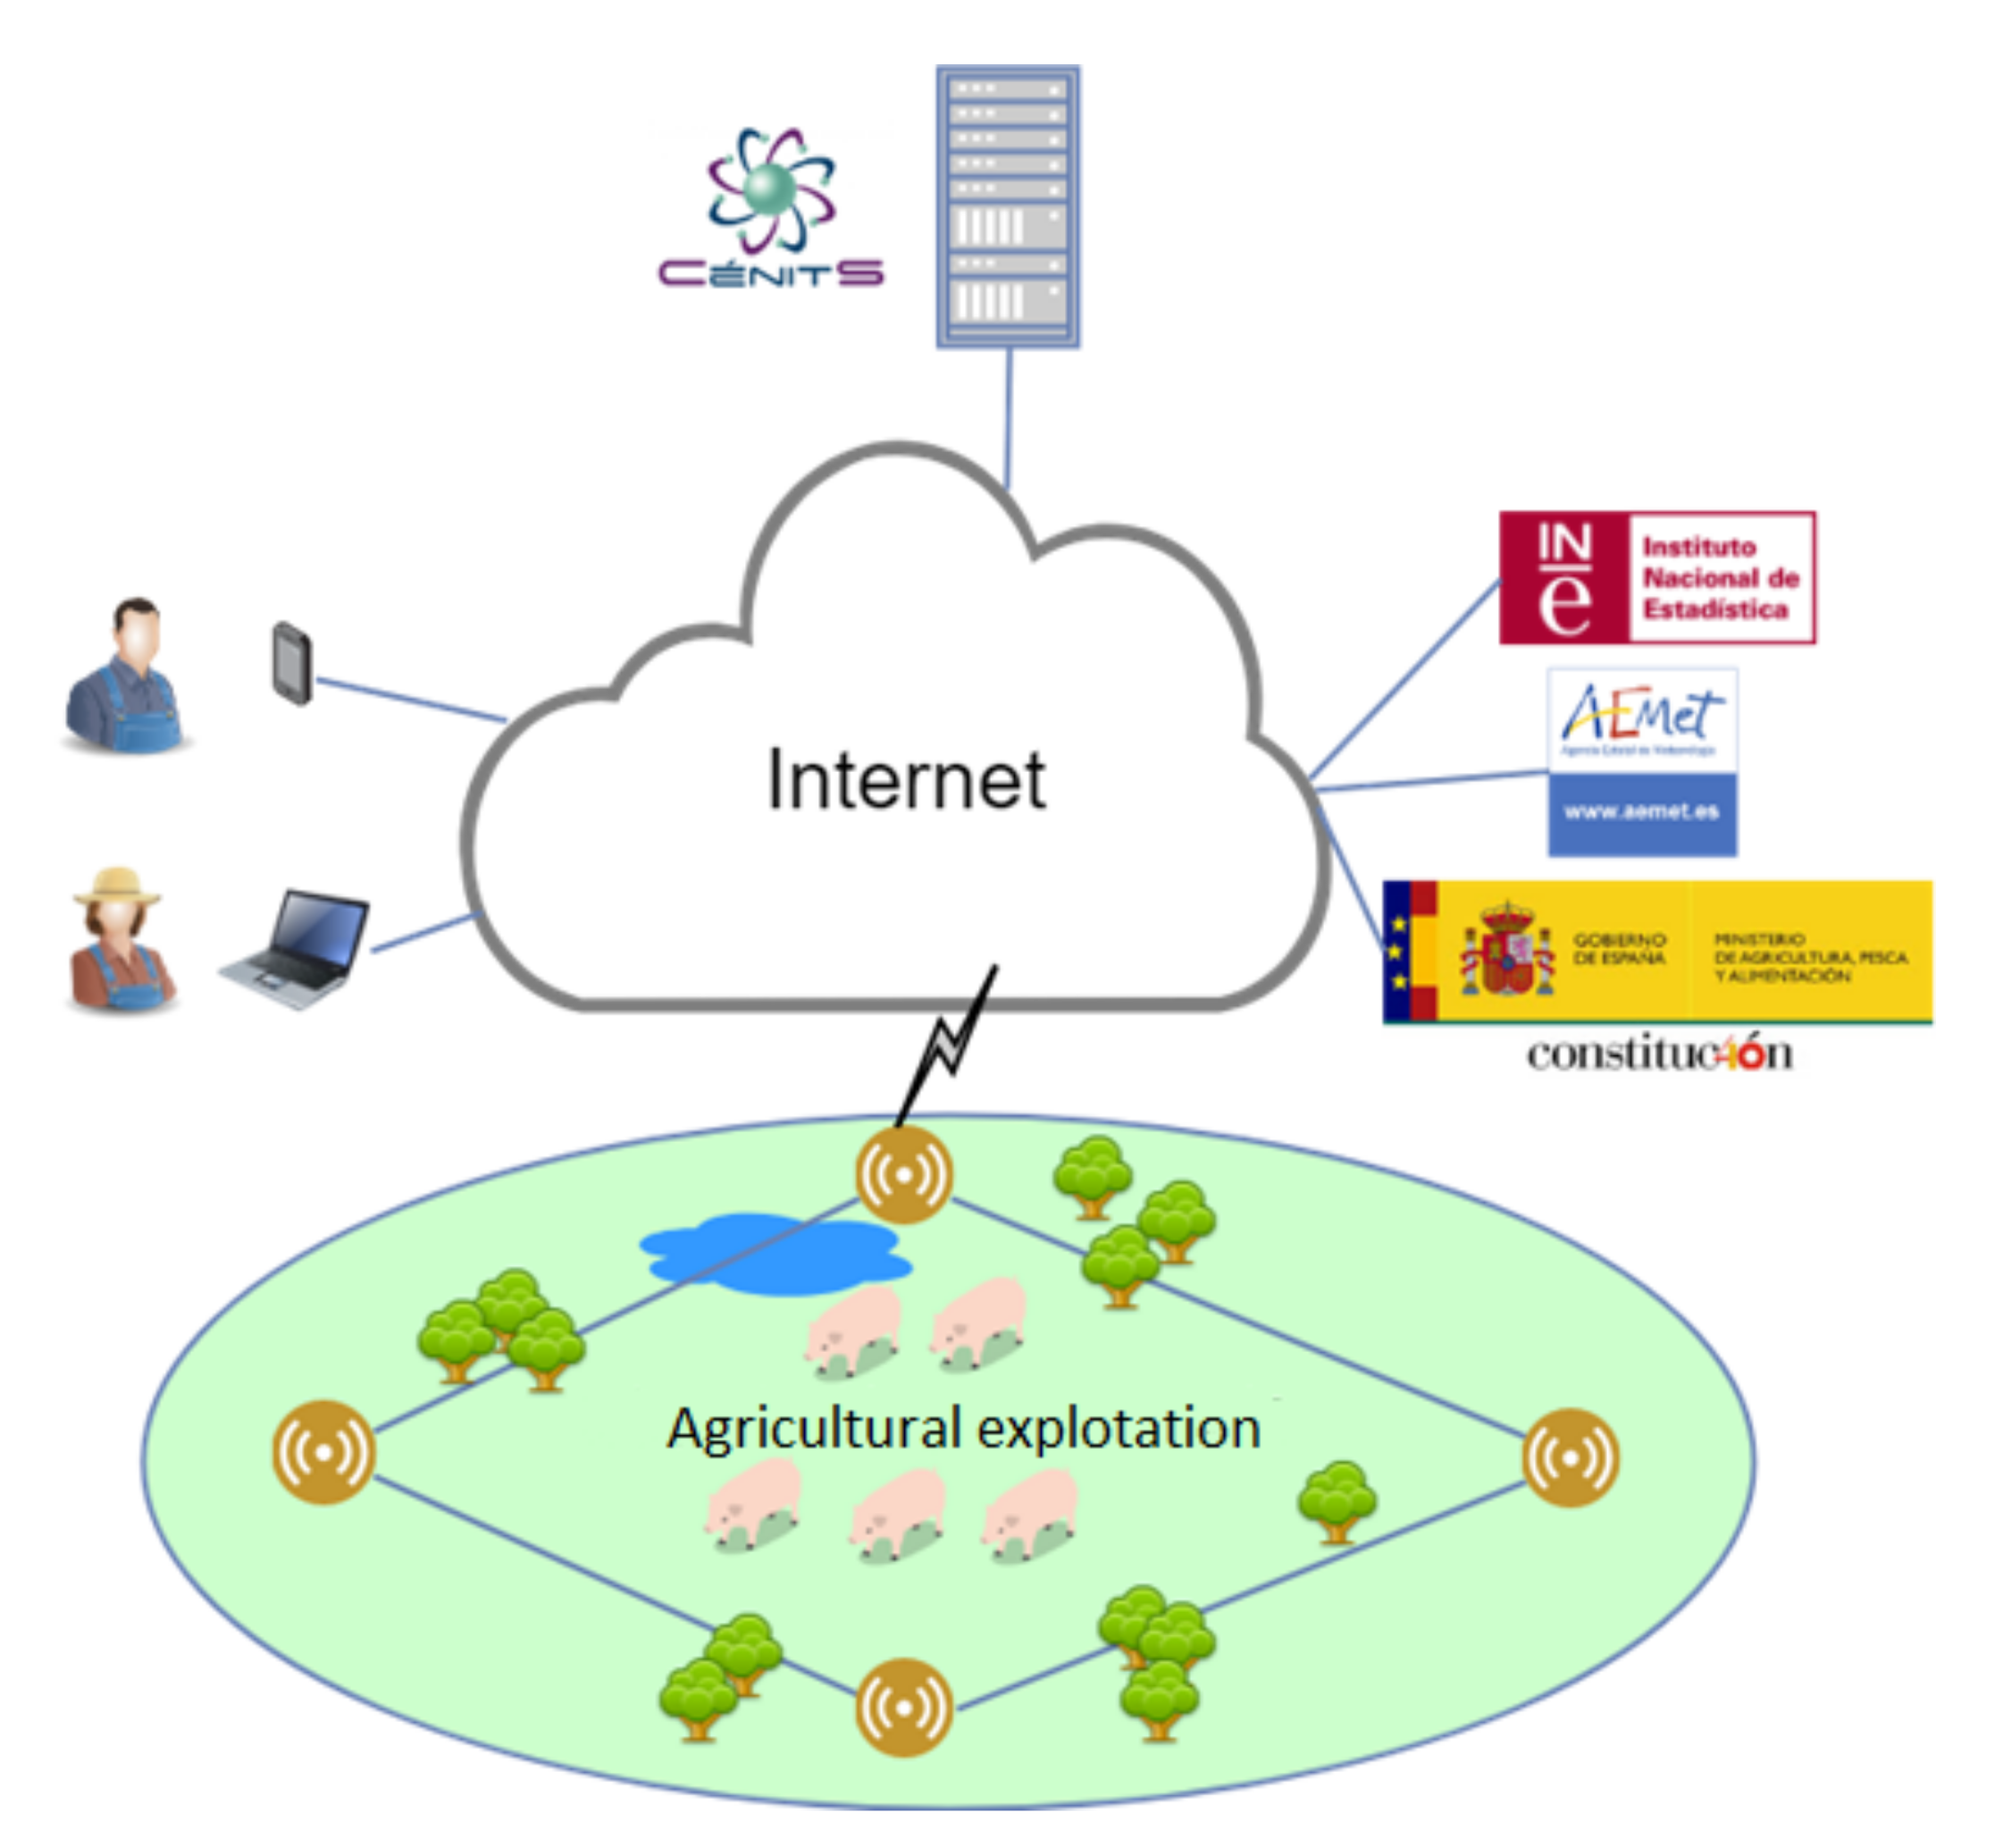
Figure 2 shows the complete system schematically.
The resulting system needs to communicate with the different industry relevant data sources available on the Internet. Therefore, it performs periodic or on-demand queries to these data sources in order to display the most updated information possible. In addition, it handles connections, initially one-way, through the Internet, from the data sources created in the project (sensor networks).
The system also stores project data. On the one hand, those extracted from the available sources and intended to be used for the generation of the data models and algorithms and, on the other hand, the data generated by the sources created in the project itself. In this context, both the web portal and the sensor networks have to communicate with the database via an application server.
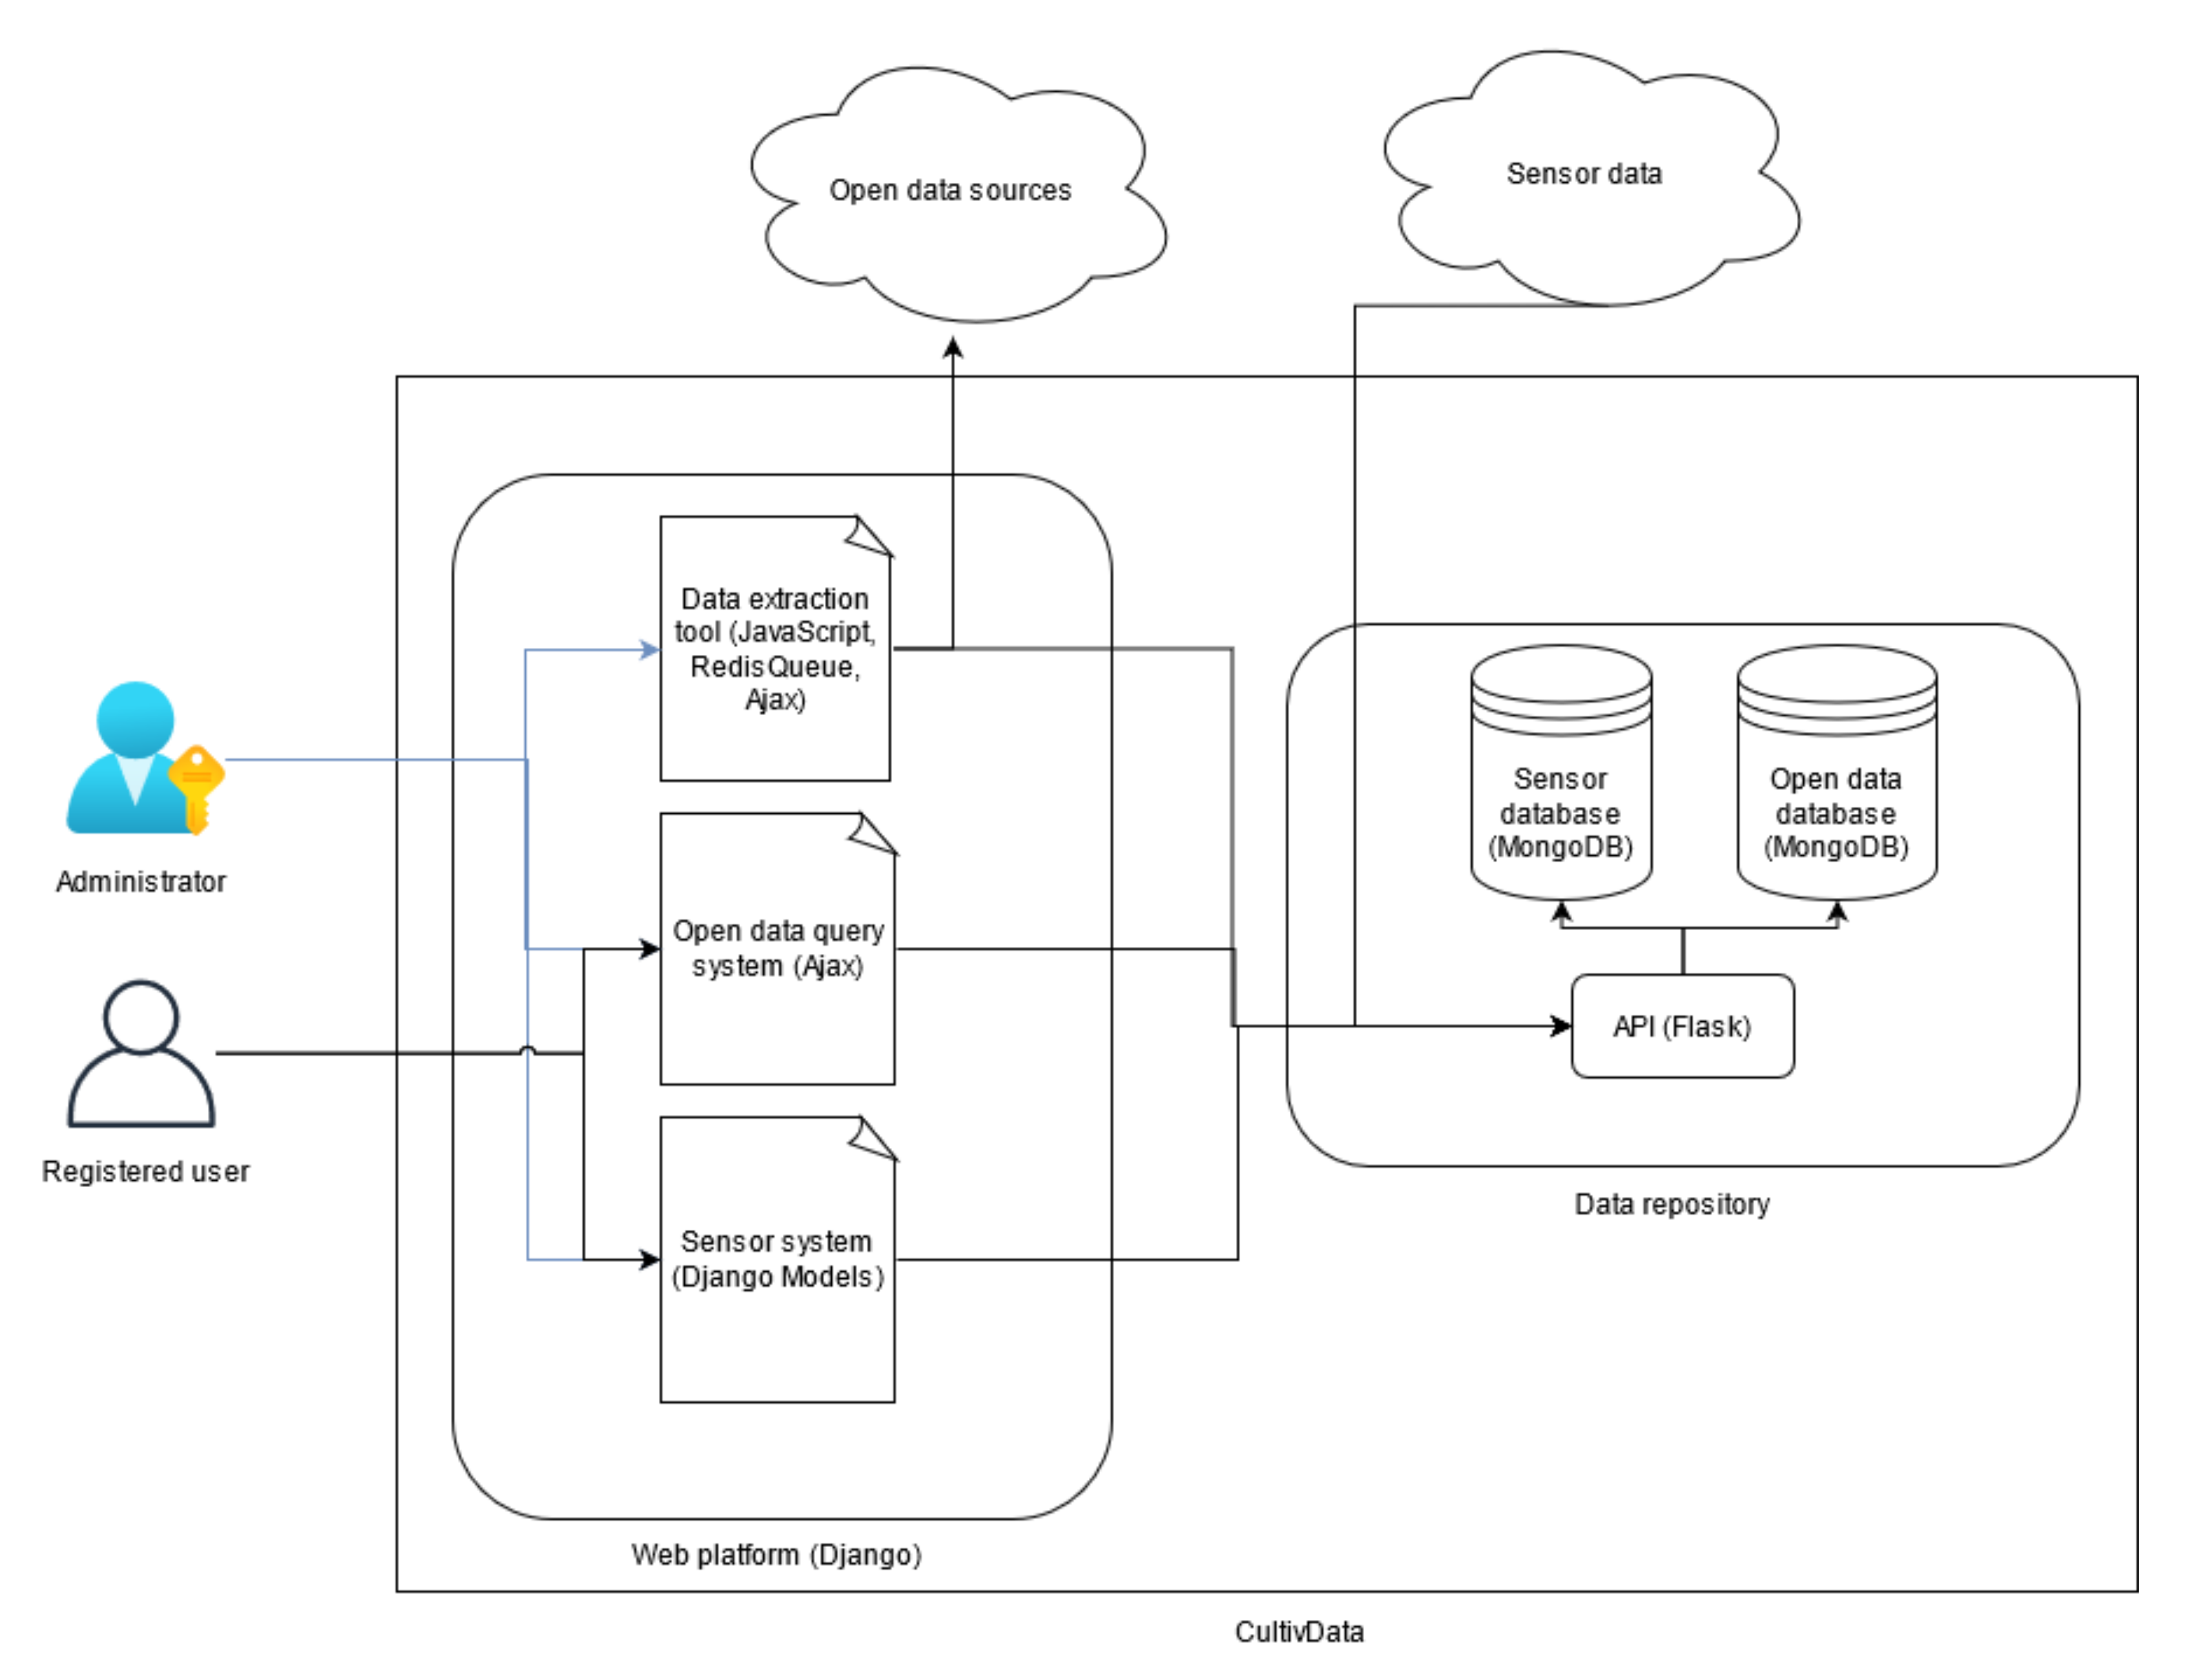
The system architecture and all the components and technologies that compose it can be seen in more detail in
Figure 3. It can be divided into two subsystems: on the one hand, data from open data sources that are extracted through a data extraction tool that can be accessed by administrators from the web portal and can be queried by any user who accesses the platform; on the other hand, data from sensors installed on farms that can be queried by the farm owner.
4. Results and Analysis
4.1. Selection and Capture of Public Data
The process of selection and characterization of public data sources described in
Section 2.1.1 allows, in the first instance, to identify a total of 19 agencies with data sources that could be useful.
These agencies provide a total of 86 sources with data that, in advance, could be relevant. Of these sources, a first brief analysis is performed that results in the discarding of 12 of them, due to the fact that they present closed data or whose format is difficult to reuse. This results in 74 sources identified and selected for the next phase.
These 74 sources, identified and assessed in principle as suitable for the project, are analyzed more exhaustively following the procedure described in
Section 2.1.2 as a previous step to their incorporation in the information system.
The main criterion used is the evaluation of the source according to the degree of openness of its data, since it facilitates interactions with the system to be developed. For this purpose, it is established that the sources to be worked with are those that have obtained a rating equal to or higher than three in this aspect.
The chosen criterion reduces the number of information sources to 43, belonging to the INE (National Statistics Institute) [
15], AEMET (State Meteorological Agency) [
16], REDAREX (Irrigation Advice Network of Extremadura (Spain)) [
17] and Eurostat (European Statistical Office) [
18]. The rest of the sources are not discarded and are reserved as support for the data analysis work.
4.2. Development of Sensorization Devices
4.2.1. Choice of the System to Be Used
Firstly, the option of using an already manufactured and proprietary system or, on the contrary, developing your own system based on the Open Hardware movement and the Do It Yourself philosophy is evaluated.
Based on the study of the criteria set out in the
Section 2.2.1, the choice is to develop the devices using open hardware boards, mainly due to the following reasons:
Cost: the cost is one of the characteristics that marks the viability of the project. A proprietary system would reduce the time and facilitate its implementation, but at a very high cost (estimated at about 16,500 euros). On the other hand, a developed system considerably reduces the cost (estimated at around 3500 euros), but requires an investment of resources for its development;
Flexibility: a system developed with open hardware boards can be adapted to specific and even changing requirements when deploying a network;
Aviability of data: most proprietary systems are closed systems that do not allow free availability of data, using predefined formats and closed systems.
4.2.2. Choice of System Components
Once the analysis has been carried out and the decision has been made to use our own development for the implementation of the devices, a study of the rest of the components necessary to obtain a functional system is also carried out.
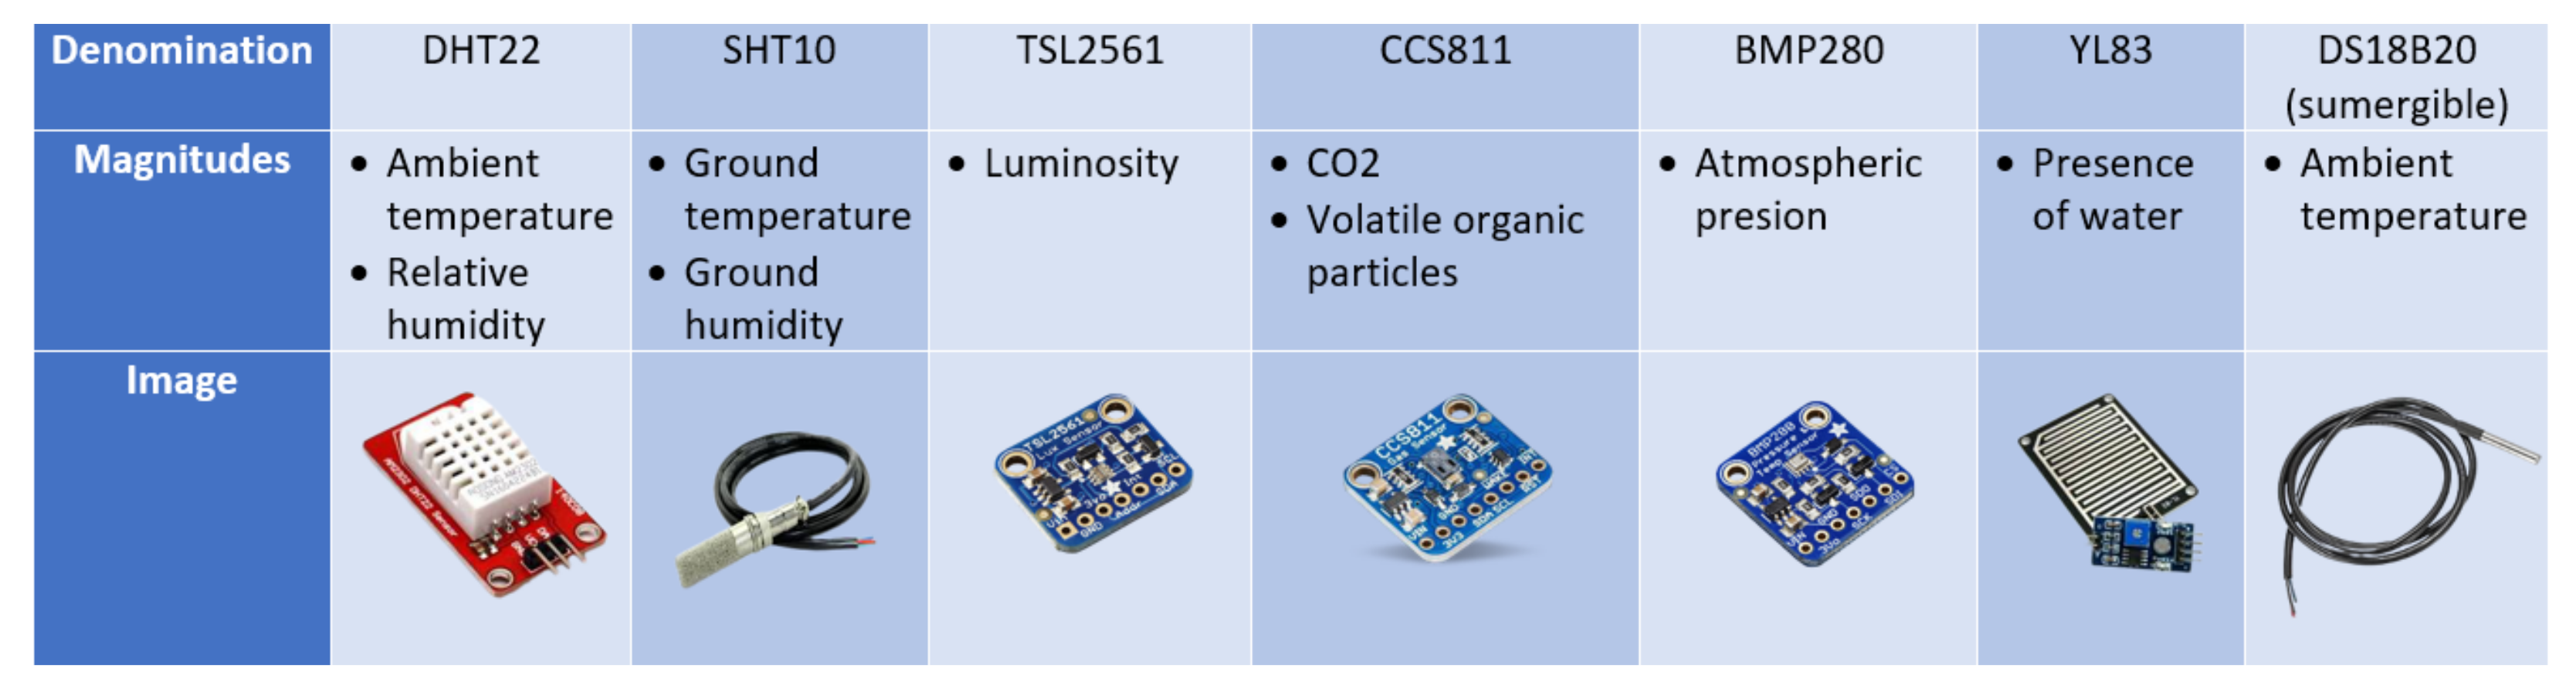
First of all, the different electronic devices responsible for taking measurements for the magnitudes to be studied are analyzed. Those finally selected are shown in
Figure 4.
Another of the components analyzed is the communication protocols to be used. This defines a network topology where two types of devices are differentiated. First, the network will have a coordinator node, which acts as a link between sensor networks and storage services. On the other hand, there are also sensorization end nodes that have to exchange information with the first ones.
For the communication of the network with the servers, alternatives are contemplated to provide the system with greater flexibility in terms of the existing installations on the farms. For this purpose, we have: a
ESP8266 [
19] module that allows connection via WiFi, an
Ethernet Shield [
20] module that provides the Arduino board with an Ethernet port and, finally, connection to the GSM network by means of a
SIM900 [
21] module.
For the interconnection between the different devices of the network, we work with XBee [
22] modules, manufactured by Digi, which use the ZigBee [
23] protocol based on low-power broadcasting communications.
4.2.3. First Prototype
The work to obtain the first network prototype is developed in several areas, resulting in a deployable system:
Use of the different sensors with the Arduino board: the work consists of the individual connection of each of the sensors to the Arduino UNO [
24] board, developing the individual code for its operation. Subsequently, they are incorporated in a staggered way on the same board to test their operation as a whole;
Communications and data transmission: on the one hand, the XBee modules must be configured with the network identifier and other parameters that define their role in the network, and connected to the Arduino board. On the other hand, the module for the connection between the coordinator and the data servers must also be connected;
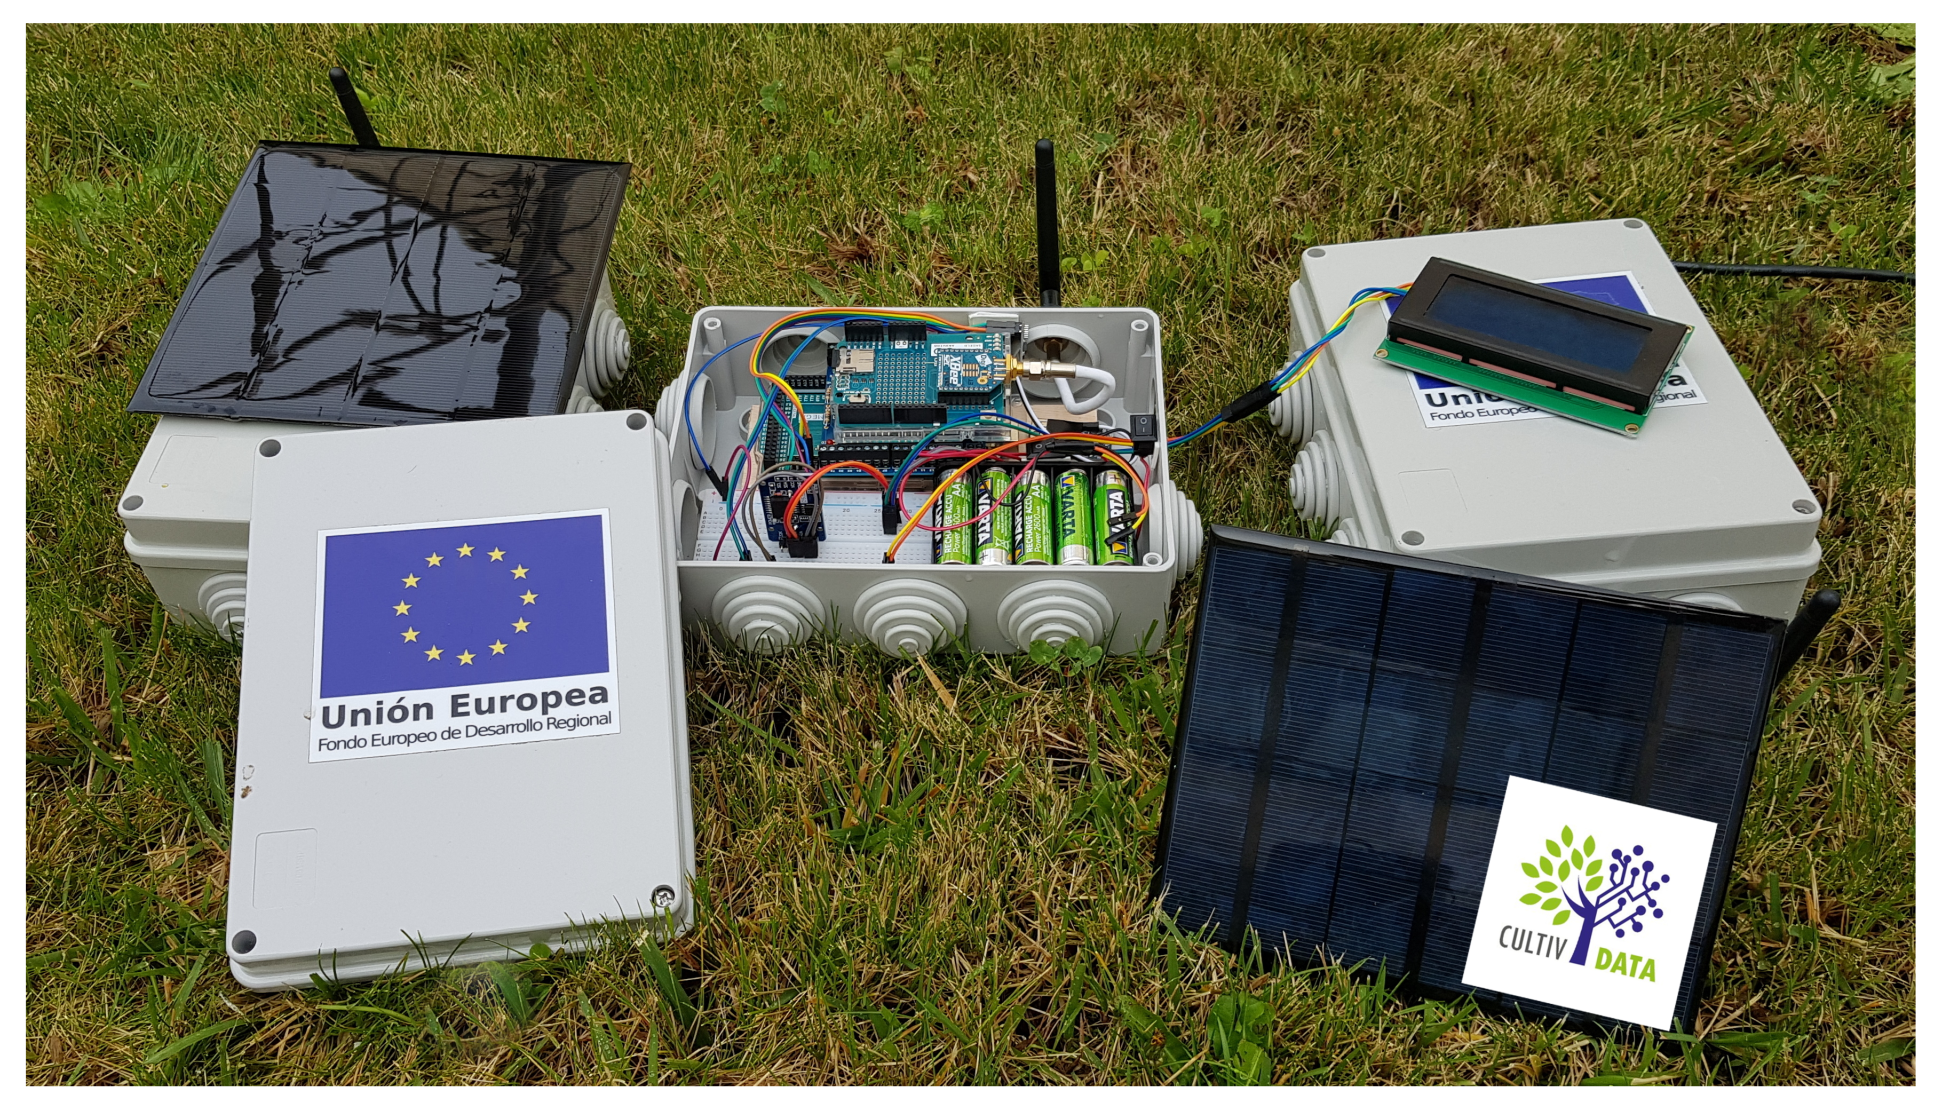
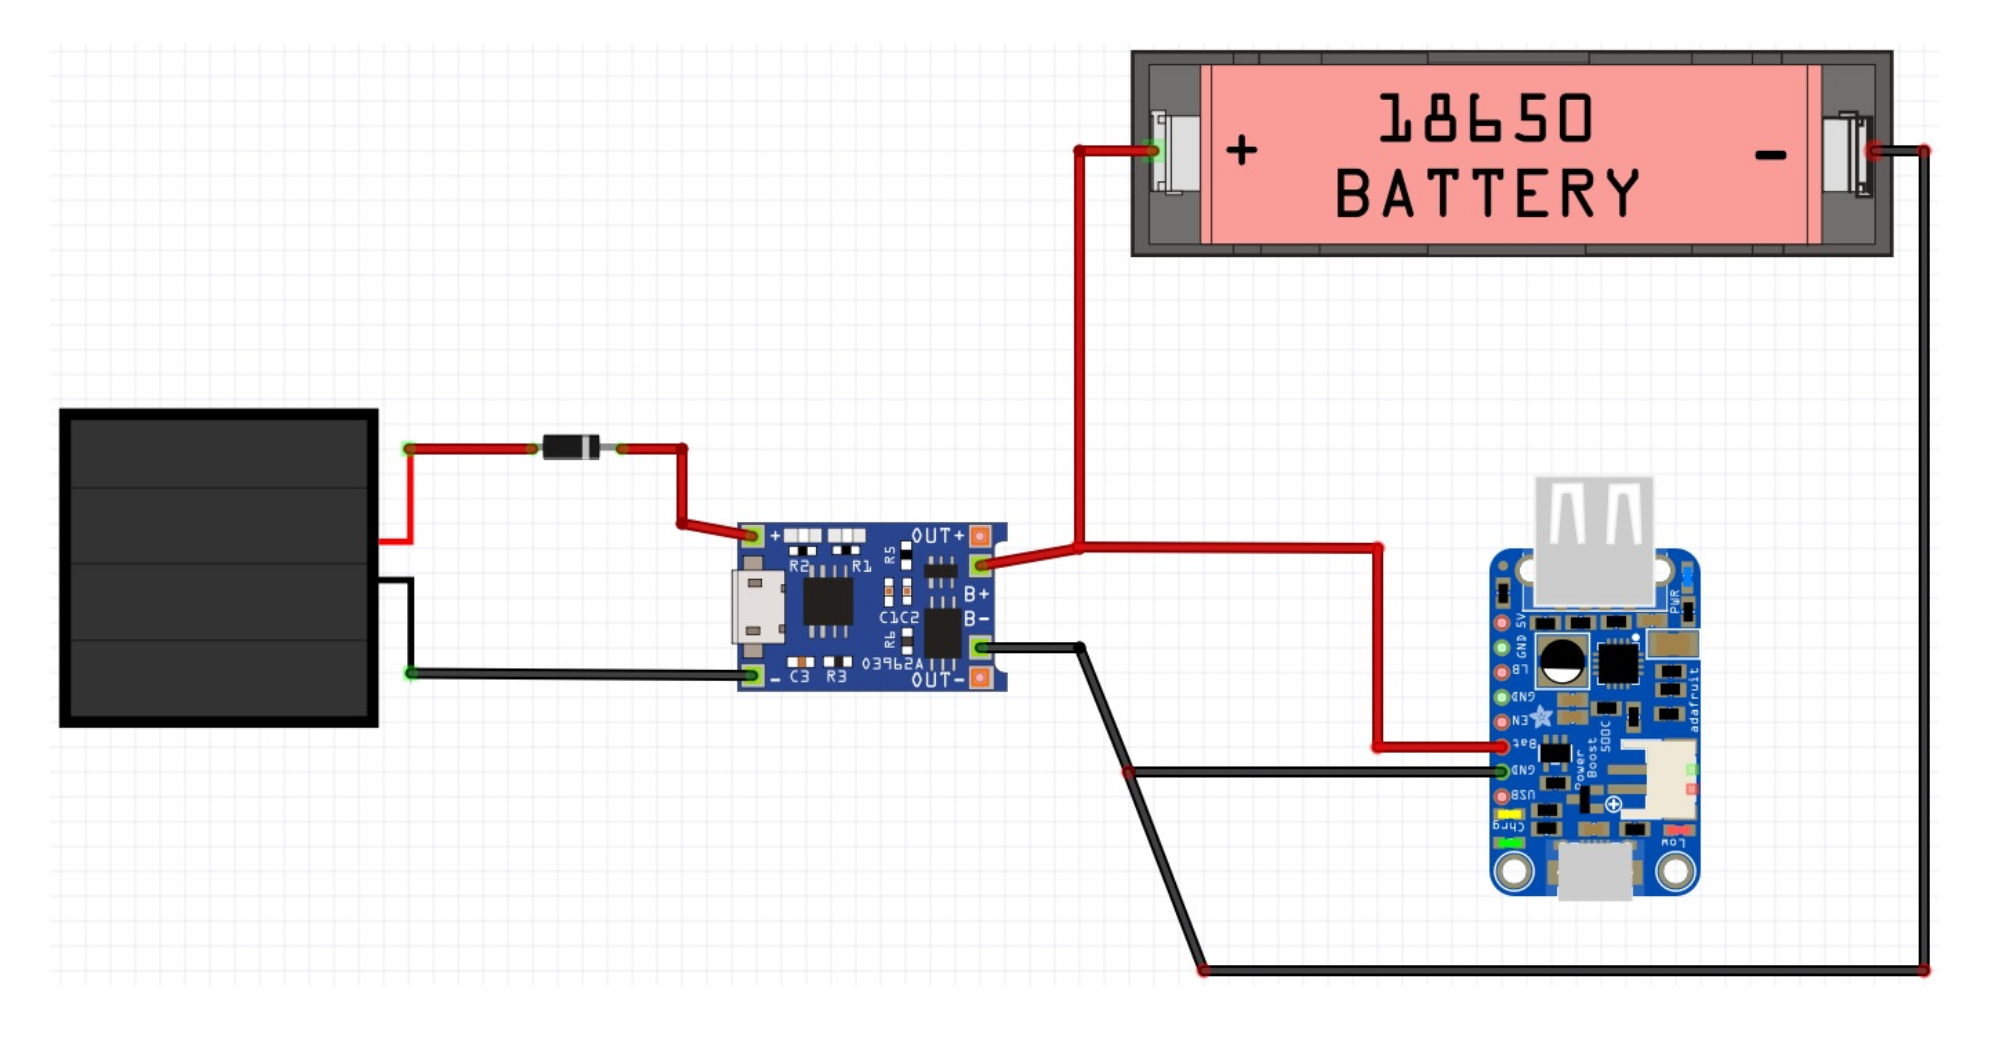
Power supply and autonomy: autonomy is one of the challenges of the viability of sensorization devices. The aim is to achieve an autonomy that reduces the need for maintenance, so a solar panel and 18,650 lithium batteries of 3.7 V are incorporated into the system. The power supply circuit (
Figure 5) is made up of a solar panel, a battery charger module, the battery itself and a transformer that raises the voltage to the 5V necessary for the Arduino board to work.
Resistance and assembly of the components: it is necessary for the devices to have a case that provides rigidity and resistance, as well as protecting the electronic components from weather conditions. For this purpose, watertight electrical boxes are used, which also have a system of side covers for the module wiring (
Figure 6).
4.2.4. Architecture of the Designed Sensor Network
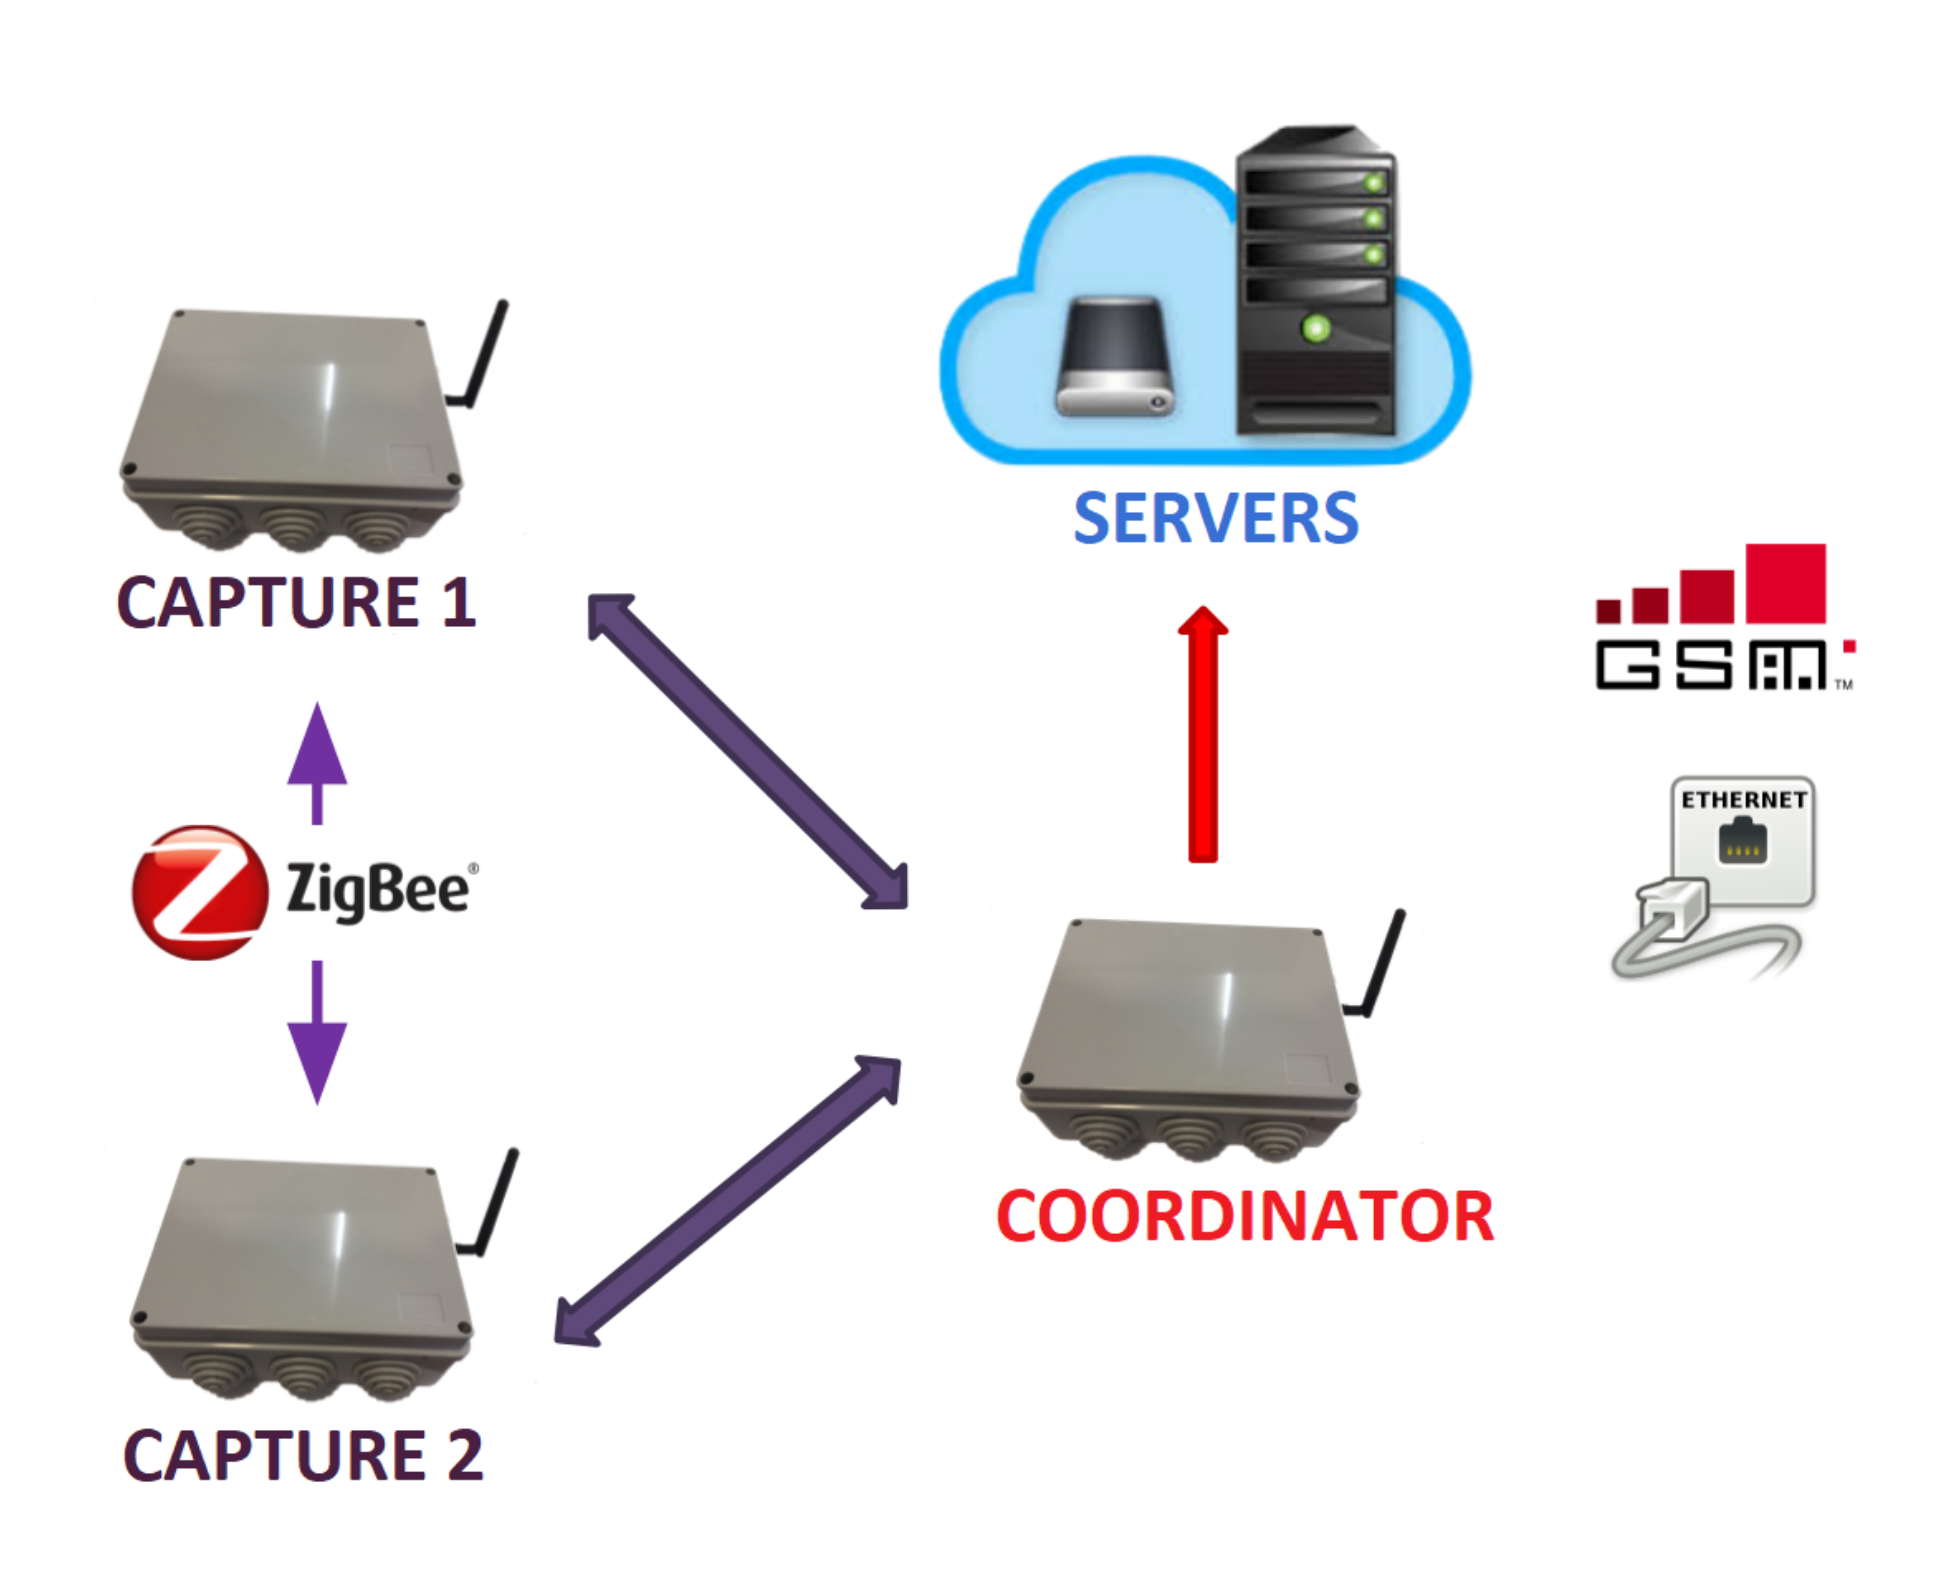
The complete system developed finally conforms to the architecture described below and represented in
Figure 7.
Coordinator node: in charge of managing a network formed by sensorization nodes, as well as of receiving the data coming from them to adapt their format and send them to the project servers.
Sensor nodes: in charge of capturing the data of the magnitudes to be studied thanks to the different sensors they incorporate.
In terms of the communications used and their interfaces, it includes the following:
ZigBee network: low-energy radio frequency network used by the XBee modules that incorporate all the devices, both coordinator and sensors, to exchange information between them.
WiFi connection: option available for coordinator nodes, so that they can send the data collected by the sensor nodes through the Internet.
Ethernet connection: option also available for coordinator nodes. Its use is the same as in the previous case.
GSM connection: last communication option for coordinator nodes that can replace any of the two previous ones.
4.2.5. Operation Tests
The following is a description of the different operational tests carried out with the designed network prototype, as well as the results obtained and the conclusions reached.
Test Scenario 1
A network consisting of a coordinator node and two sensorization end nodes is deployed. The coordinator node has a WiFi connection that allows to send data to the storage server, as well as a power supply by means of 5 AA batteries. It is located indoors, where there is no solar power supply. The sensor nodes are configured to obtain readings at 10-min intervals, with the rest of the time in low-power mode. Power is supplied by a 2300 mAh 18,650 lithium battery. These nodes are installed outdoors, about 10 m apart.
After 5 h of operation, the coordinator node shuts down due to a low battery charge because it has no solar power supply circuit. In this way, the autonomy can be checked in the worst case scenario. It is put back into operation using electrical power supply.
As for the sensor nodes, they are powered off after 12 h of operation. Due to the low solar radiation during the operating period, the solar panels have not been able to provide much energy to the system. In addition, the presence of abundant rains caused a slight water infiltration inside the case of one of the devices, which did not affect the operation. The batteries were replaced and, on the following day, with more solar contribution, an autonomy of 19 h was achieved.
The conclusions obtained after this test are as follows:
- 1.
The case is working properly, having withstood heavy rains without water infiltration affecting the electronic components;
- 2.
Temperature readings are affected if the device is placed under direct sunlight;
- 3.
The solar power supply does not provide sufficient charge to power the node and simultaneously recharge the batteries;
- 4.
The power requirements of the nodes in general are high.
Test Scenario 2
This test quantifies the coverage and range of the XBee modules. To do this, a coordinator node is deployed in a fixed location, and an end node that will move to different locations. At each location, using the XCTU application provided by the manufacturer, the signal strength is measured and the percentage of packet loss is calculated. The results obtained are shown in
Table 2.
The conclusions obtained from this test are as follows:
- 1.
The obtained range of 700 m is higher than the theoretical value, although the environmental conditions can be considered favorable since there were no intermediate obstacles;
- 2.
The received signal strength increases considerably by elevating the communications antennas;
- 3.
Packet loss remains constant.
Test Scenario 3
Due to the autonomy results achieved in the prototype, a new specific test is performed to check this operating parameter. For this purpose, a network configured with three different measurement intervals (1, 5 and 10 min) is deployed, which is kept in operation until the nodes are turned off due to the battery depletion.
Table 3 summarizes the results obtained.
The conclusions obtained from this test are:
The 18650 lithium battery provides greater autonomy and more effective charging;
The coordinator node offers an excessively low autonomy, due to its high consumption and the difficulty to charge 5 batteries simultaneously with the solar panel;
The autonomy of the sensor nodes is too low. At least values of several days should be reached, ideally they should be self-sufficient thanks to solar energy;
The measurement interval affects the autonomy;
It was necessary to reduce the consumption of the nodes and to increase the power of the solar power supply circuit.
4.2.6. Performed Deployments
The sensor networks deployed for data collection, as well as the farms where they are located, are described below.
Farm 1
This is the first deployed network used as a prototype for the development of the devices and the implementation of modifications and improvements. It is composed of a coordinator with WiFi connection located inside the building and two sensor nodes located in the gardens of the center.
Farm 2
This is a 25-hectare farm with a rectangular plot of land and a building located on one side of it. The orography of the land has an upward slope towards one of the sides.
The design of the deployed network (
Figure 8) contemplates a coordinator node located in the building and four sensor nodes located trying to cover the whole plot. The placement of the building means that on one side, the distance to be covered is greater than on the other. In this case, the connection with the servers is made through the GSM network.
As for the sensor nodes, they collect measurements for temperature and humidity, both ambient and soil, as well as atmospheric pressure.
Once the network is deployed, coverage problems are detected, both for the GSM network and the radiofrequency network. To try to minimize the impact, external bases for the antennas are incorporated, so that they can be located in elevated and clear areas, avoiding the plant in the sensor nodes and the buildings in the coordinator. In addition, a memory card reader is installed in the coordinator to allow data to be stored locally in case it cannot be sent over the network.
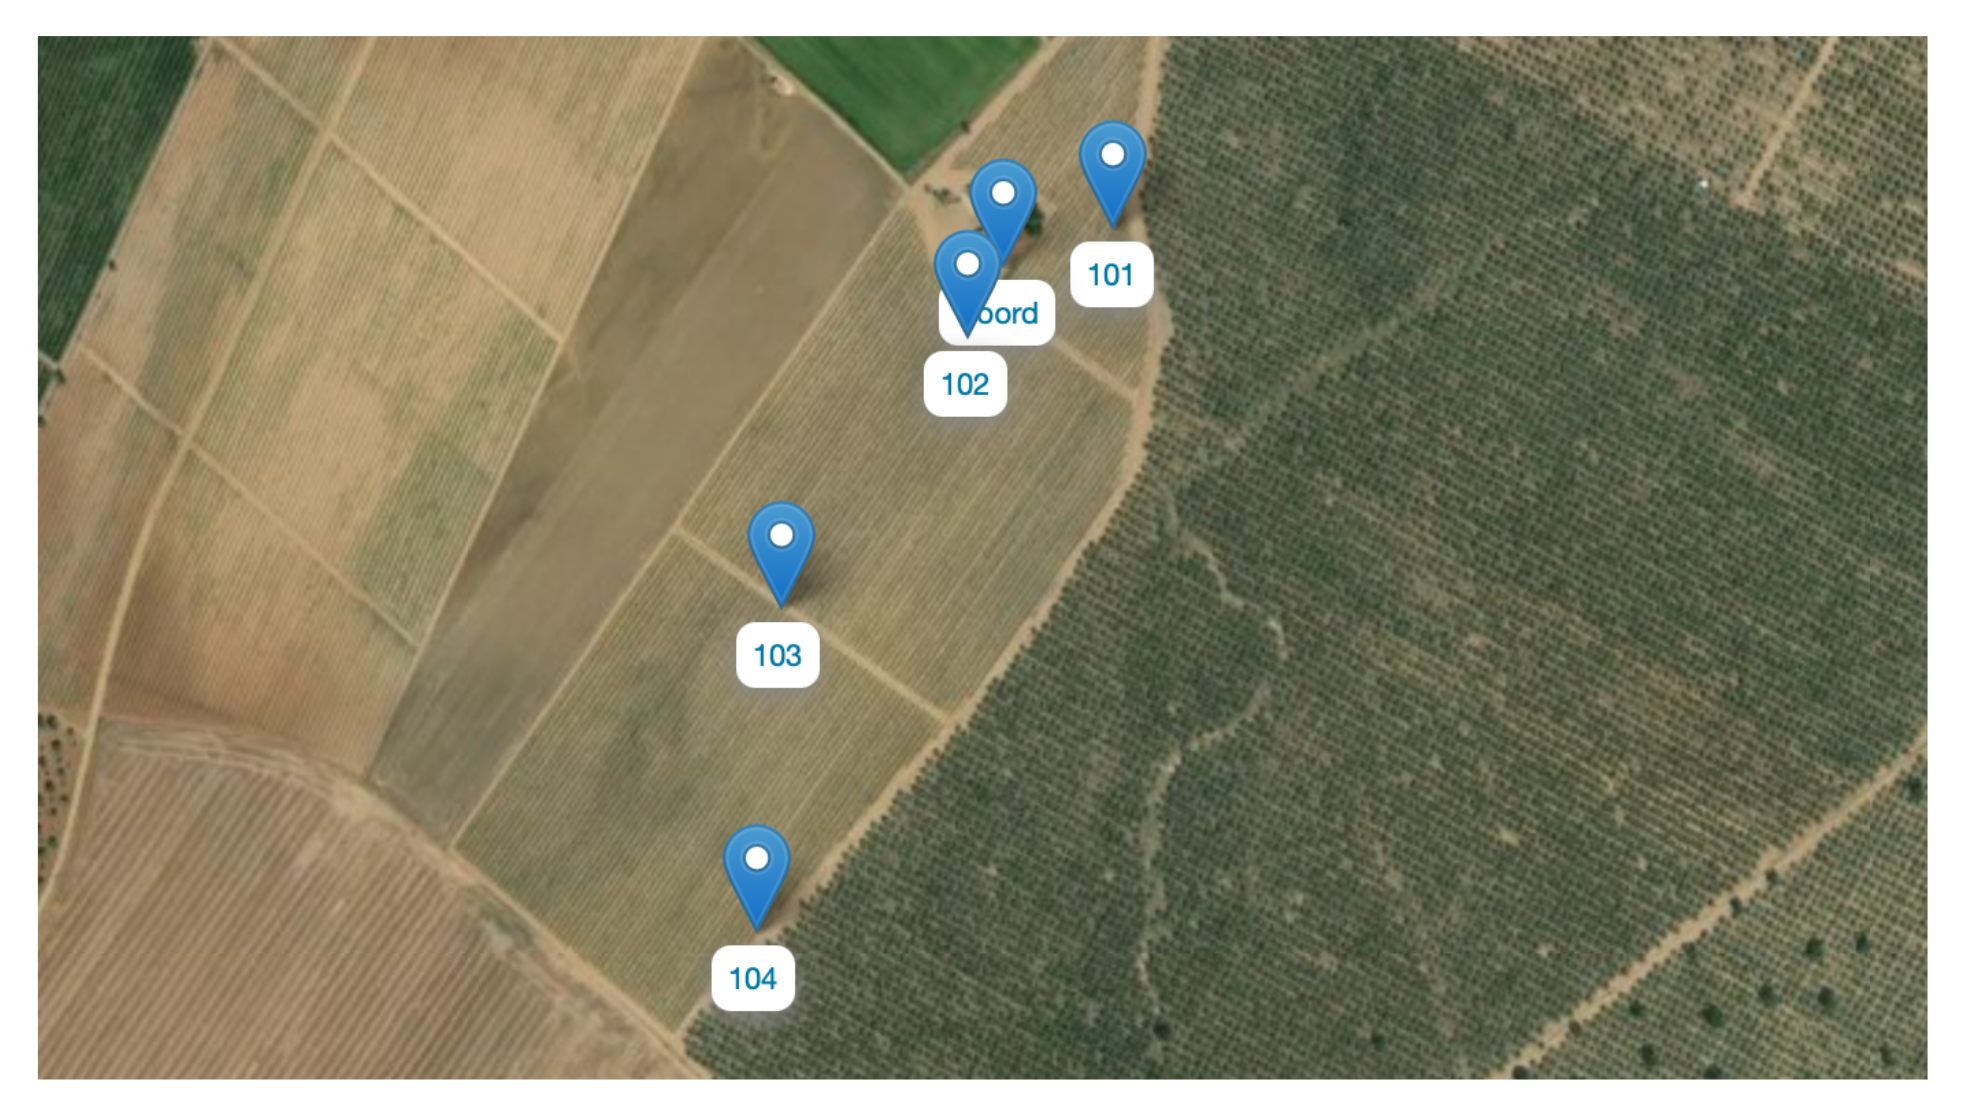
Farm 3
This is the first network in which the aim is to promote the Do It Yourself philosophy. In this case, the farmer is provided with the equipment and advice, but it is the farmer himself who deploys and maintains the network.
The farm has a building with power and data connection, so the coordinator is located inside and has an Ethernet connection for sending data. A sensor node is also deployed to measure ambient and soil temperature and humidity, as well as atmospheric pressure.
The farmer is able to successfully deploy the network, performing the required maintenance so that it can operate uninterruptedly capturing data.
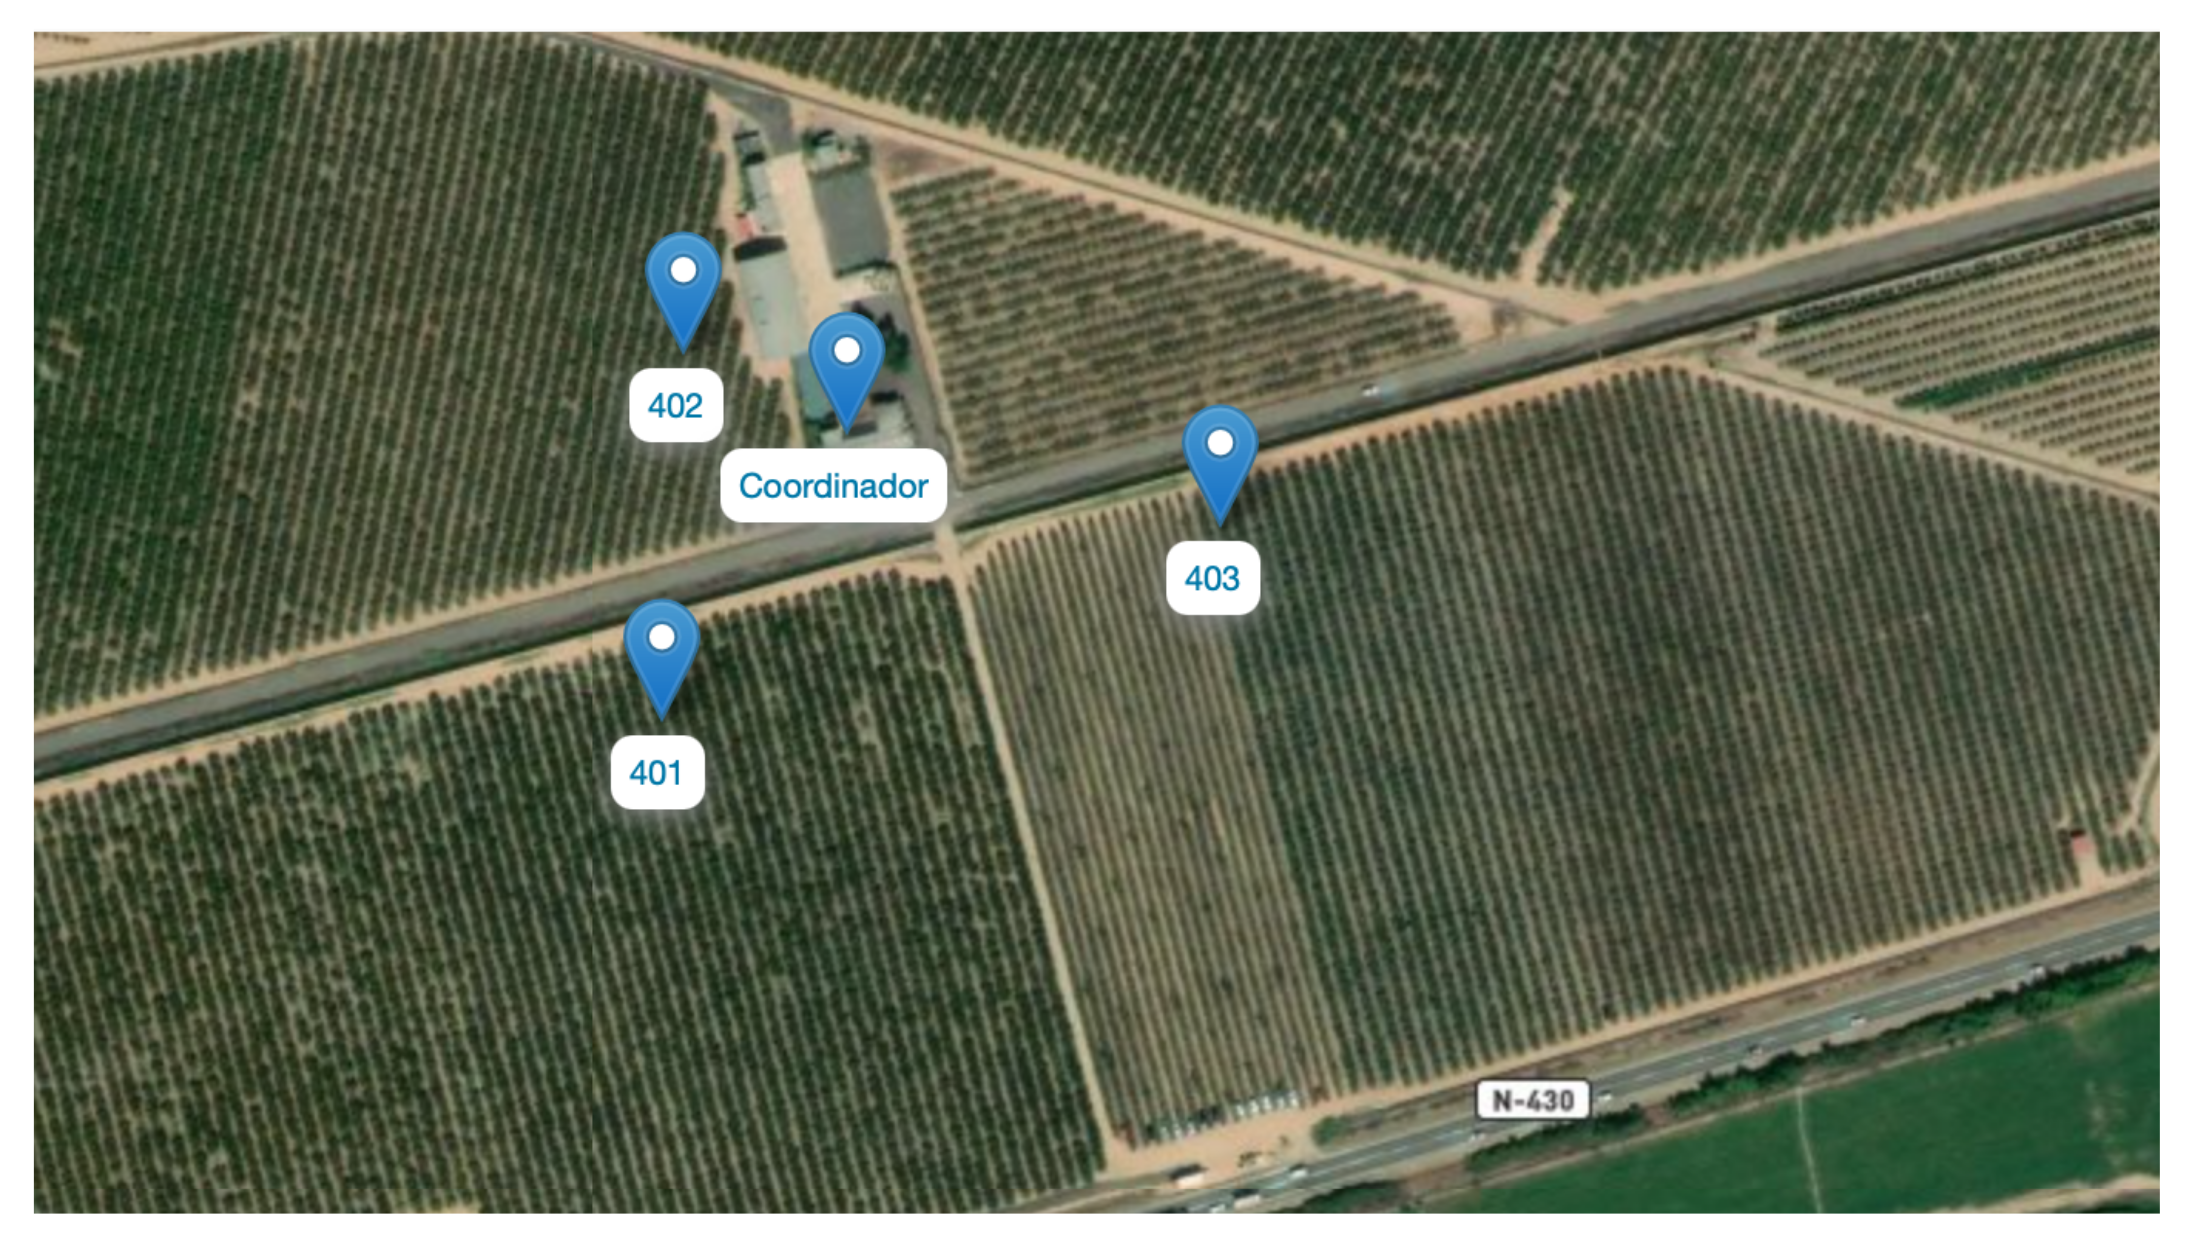
Farm 4
Deployment that has the particularity that three different farms are sensorized with the same network and a single coordinator. The plots are located surrounding a building where the coordinator node can be installed, with electrical installation. Data are sent via GSM connection.
Three sensor nodes are deployed (
Figure 9), which collect data of temperature and humidity, both ambient and soil, and atmospheric pressure. Each node is located on a different plot, corresponding to three different crops: Paraguayan, peach and apricot.
In this network, the radio frequency network coverage problems have also been repeated, mainly in the sensors placed at the furthest points from the coordinator. In addition, in the case of fruit trees, the density of the plant varies substantially throughout its growth period, which causes serious communication problems at certain times of the year, when it is very dense and tall.
Farm 5
Due to the communications problems observed in the previously deployed networks, in this case it was decided to store the data locally in the coordinator node. In this way, the real-time availability of the data is lost, but reliability is increased.
The plot has a large surface area and a steep slope. In the center, there is a building with electrical installation, where the coordinator is located. The sensor nodes are installed in two different areas, but close to the building, to guarantee the operation of the radiofrequency network. Both take measurements of temperature and humidity, both ambient and soil, as well as atmospheric pressure.
In addition, the previously used soil sensor suffers from long-term durability problems as it is continuously buried in the ground. Because of this, it is replaced in this network by another model whose test results have been positive. It is also found that GSM coverage problems in the other networks blocked the system on numerous occasions, as the system is much more reliable in this case.
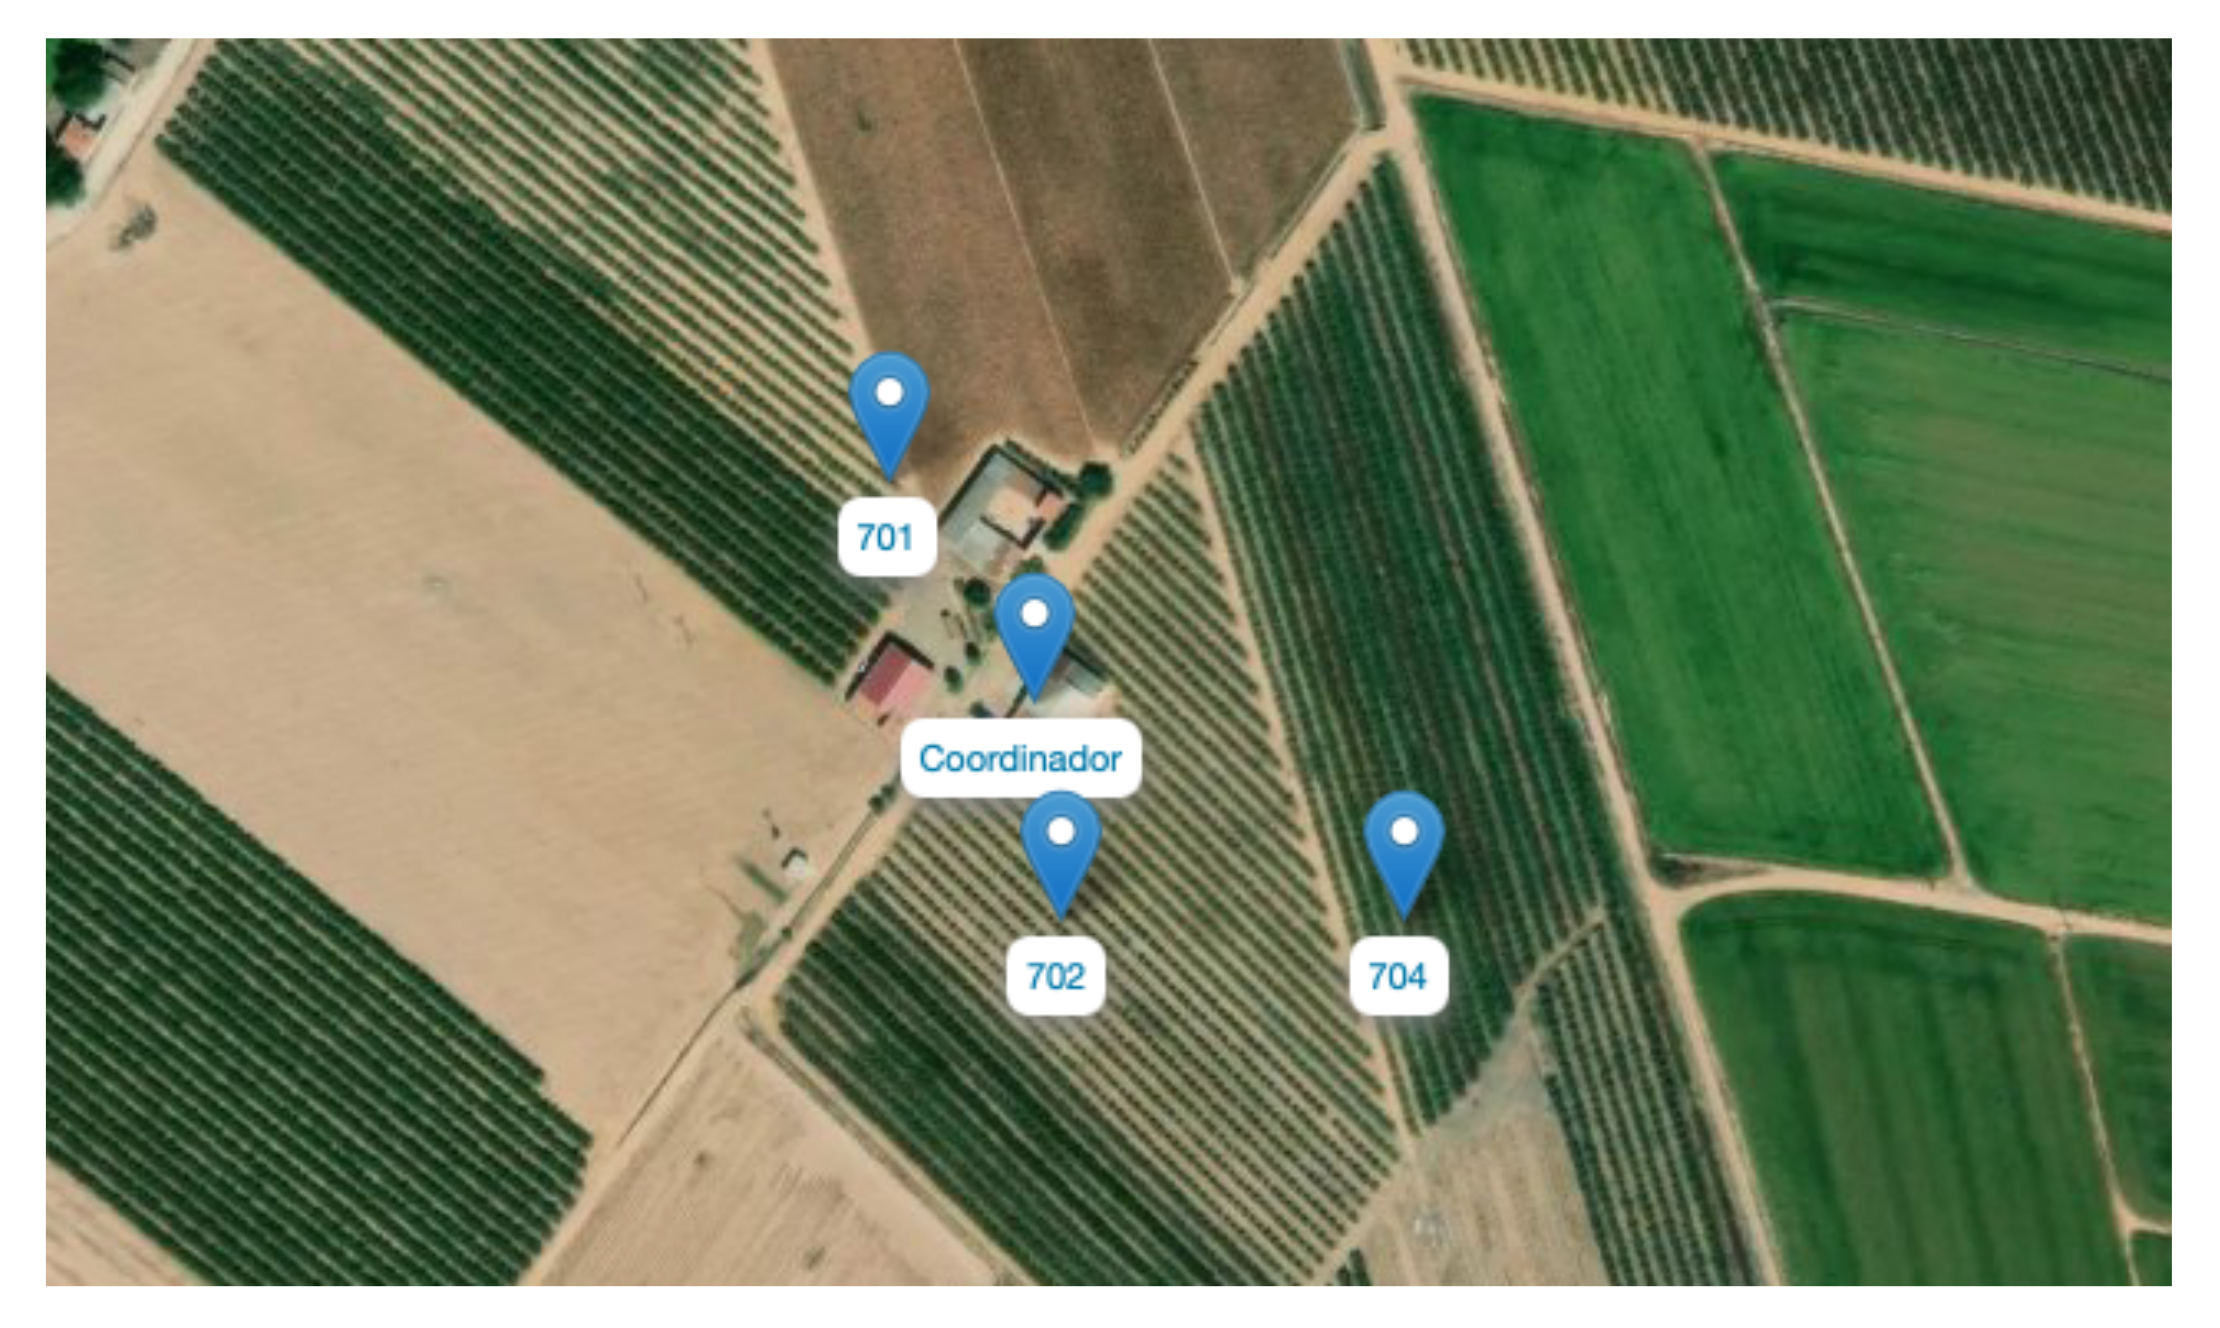
Farm 6
In this case, as in the network deployed in Farm 4, a coordinator node is deployed to cover several farms surrounding a building. The coordinator is installed in this building and has its own electrical installation and data connection.
As for the sensor nodes, a total of three are installed (
Figure 10), each one in a different nectarine farm. All have sensors to measure temperature and humidity, both ambient and soil, and atmospheric pressure. The soil sensor is the new model used, which is showing good durability and reliability values and also measures the electrical conductivity of the soil.
4.2.7. Implemented Improvements
During the prototype tests, and once the first deployments had been carried out, different problems related to the operation of the system appeared, for which improvements and modifications had to be made, including the following:
Incorporation of several alternatives for data connection of the coordinators, including Ethernet port, WiFi connection and GSM connection so that more alternatives for their deployments were available;
Incorporation of external antenna bases, both for the radiofrequency network and GSM, so that the antennas could be placed in clear and elevated areas to facilitate connections;
Replacement of the Arduino UNO board by the Arduino Nano [
25], which reduces the power consumption of the set considerably;
Incorporation of a low power consumption timer TPL5110 [
26], which allows to turn off the system at the configured intervals, thus increasing the autonomy;
Installation of a micro SD card slot in the coordinator node to store data locally when communications fail;
Replacement of the SHT-10/20 soil sensor with a new model based on the RS485 bus that provides greater durability, as well as the possibility of measuring soil electrical conductivity.
4.3. Development of Web Platform
4.3.1. Definition of General Requirements
The requirements set for the resulting information system are as follows:
- 1.
Ubiquity: users must be able to access the system regardless of their geographical location;
- 2.
Accessibility: the system must be accessible from any type of device;
- 3.
Intuitive: easy to use and useful, considering that it is aimed at agents of the agri-food sector;
- 4.
Integration of open data sources: especially the most relevant ones for the agri-food sector;
- 5.
Creating data sources: through the deployment of sensors in farms in the region to fulfill open data;
- 6.
Having data models: by means of Big Data techniques to make predictions and extract knowledge from the data collected.
The proposed solution consists of a web platform, since it provides an answer to each of the requirements set, as opposed to a standalone application solution.
4.3.2. Software Requirements Specification
The system consists mainly of a web portal that offers multiple services depending on the type of user. Anonymous users of the platform can access news and information relevant to the sector from a variety of sources with open data. Users participating in the project can access a restricted area where they can consult data from their sensorized farms and make queries to obtain information to support their decision making.
The resulting system needs to communicate with the different sources of data relevant to the sector available on the Internet. Therefore, it must perform periodic or on-demand queries to these data sources in order to display the most up-to-date information possible. In addition, it needs to initially service one-way connections over the Internet from the data sources created in the project (sensor networks).
The system also needs to store project data; specifically, those data extracted from available public sources and the data generated by sources created in the project itself. All these data will be used by the system to generate the data models and algorithms. In this context, both the web portal and the sensor networks must communicate with the database through an application server.
4.3.3. Design
The most outstanding aspect derived from the requirements specification is the existence of two well differentiated parts within the platform: one for consulting information on the Extremadura agricultural sector, with free access, and the other for managing information on agricultural farms, for users registered in the system.
The platform was designed considering each of the elements that make up the final system:
- 1.
Architecture
- 2.
Modules: consider the existence of modules for portal access, user management, sensor data capture, data query and administration tasks;
- 3.
Interfaces: sketches are made for each of the main interfaces of the platform, including access to the project website, access to the platform, user registration and login;
- 4.
Data: the design of the database that would store user, farm and sensor data was carried out.
4.3.4. Implementation
The implementation of the platform consists of a web development using the Python programming language, together with the Django [
27] frameworks for the web development itself and Flask [
28] for the implementation of data access APIs. The web design is completed using HTML, CSS and Javascript.
The database management system used is MongoDB [
29], which is document-oriented. In this way, it is not necessary for the data to follow a schema, which provides flexibility and scalability to the system. In addition, it also offers the possibility of storing geolocated data and performing positioning-based queries.
In addition, for various data sources that do not offer data in open formats, such as HTML, the
web scraping technique is used to capture them automatically. For this purpose, the Selenium 2.0 [
30] framework is used.
4.3.5. Deployment
The platform was deployed using the Nutanix [
31] hyperconverged cloud system available at the CénitS [
32] center. This allows virtual machines to be deployed on real nodes and all the necessary configurations (network, storage, software, etc.) to be carried out easily.
The operating system is GNU/Linux, specifically the Ubuntu 20.04 distribution.
4.4. Data Models Obtained
4.4.1. Business Understanding
Since the analysis does not consider a single organization, but an entire sector, the agri-food industry, it is necessary to take a generalized approach to the problem.
The objective is to try to answer whether there is any relationship between climatology and the performance of a crop, whether it is possible to analyze and understand the temporal evolution of a farm, whether there is a type of soil more suitable for a certain crop, whether a crop should be planted according to the available soil, whether it is possible to establish a relationship between production, quality and irrigation, whether it is possible to design an optimal irrigation system or whether it is possible to detect diseases early.
4.4.2. Understanding the Available Data
This second phase is divided into four tasks:
- 1.
Data collection: the data used come from various sources classified as: general use data, geographic and spatial information systems data, and crop-specific data.
In order to meet the objectives of the analysis process, additional criteria are established to measure the suitability of their use in the process, which refer to the type of data, time range and data format. An analysis of each of the sources is then elaborated, resulting in the identification of 24 data sources that, a priori, meet the requirements to be used in the data mining process.
- 2.
Data description: schemes are elaborated with the data of interest of each of the sources selected in the previous task;
- 3.
Data exploration: once the data are described, they are explored. It consists of performing basic statistical tests that may reveal properties. The result of this task is 126 graphs that allow to have a general and particular view of the data provided by the selected sources;
- 4.
Data verification: the data that are suitable for achieving the objectives of the analysis are selected. Three categories are established for the data sources according to their usefulness in the analysis to be performed: usable, support or not usable. The result of this task is the identification of 17 usable sources for the analysis, five that serve as support and two that are discarded.
4.4.3. Data Preparation
The data preparation work is divided into five subtasks:
- 1.
Data selection: of the external data sources identified as usable, the following have been finally used:
Daily agrometeorological information data collected by the 37 REDAREX stations distributed throughout Extremadura (Spain) [
17]. In this case, the data selected are those related to temperature and relative humidity;
Data of meteorological episodes that exceeded certain thresholds and are considered “extreme”;
Daily climatological variables by station provided by AEMET;
Multispectral images with 13 bands in the visible spectrum, near infrared and shortwave infrared in addition to the electromagnetic spectrum. Provided by the European Space Agency;
Data related to cultivated area, performance in tonnes per hectare and timing thereof, provided by the Ministry of Agriculture, Fisheries and Food (MAPA).
On the other hand, data generated internally in the project have also been selected. Specifically, the data collected by the sensor node of the almond tree farm are used, since the identification of an undesirable development of the crop in the 2020 campaign led to the need for an analysis of the circumstances that caused it.
- 2.
Data cleaning: an adaptation of the raw data collected is carried out, filtering those that are redundant or whose information is not going to be used;
- 3.
Data construction: new fields are defined and the format of others is modified in order to adapt them as best as possible to be able to work with them in the subsequent analysis;
- 4.
Data integration: meteorological data are organized on a daily way to adapt them to the rest of the collected data, integrating all the sources in the same database. Multispectral images obtained from the Copernicus Open Hub platform are organized by date and location;
- 5.
Data formatting: each of the records, whether meteorological, production or price values, have been included in JSON format in a non-relational MongoDB database. All dates are divided into day, month and year as independent fields in order to exercise temporal correlations in an easier way. Moreover, all numeric values are transformed to float variable types to allow mathematical operations that generate decimal results. Finally, the data are stored in different collections according to their subject for simple and fast access. Multispectral images are preprocessed and transformed into a more manageable format.
4.4.4. Model Creation
Using the data available, both from open data sources and those generated in the project, we proceed to perform the analysis process that aims to answer some of the questions that motivated the realization of the process itself.
Even so, the data available in the open data sources identified in the project are not very specific and, therefore, the results could easily be distorted. The addition of the developed sensors was intended to mitigate this effect, but the data provided by these sensors cannot be used in the short term, since data from several years are needed to be considered valid as the basis for an analysis. Initially, the sensors can be used as a verification and projection measure of the analysis.
In this regard, work has focused on three analyses.
Analysis of the Relationship between Climatology and Crop Performance
The objective is to determine if there is a relationship between meteorological variables and crop performance, specifically focused on olive and cherry trees.
The study is focused on two specific geographical areas: the central area of the Autonomous Community of Extremadura (Spain), in the province of Badajoz, and the area surrounding La Vera Valley in the province of Cáceres, as these are the areas with the highest concentration of areas devoted to olive and cherry trees, respectively. For the analyses carried out, only the temperature data from the stations considered to be close to the main geographical area of each of the crops were used.
In the case of the olive tree, the area of cultivated areas dedicated to this crop was geographically delimited. For this purpose, both FU-73 and the System of Geographic Information of Agricultural Data (SIGA) [
33] were consulted. Based on this information, temperature data from meteorological stations located in the study area were selected.
From them, the medium daily temperature between the years 2015 and 2018 of the region and the area under study is obtained. It is observed that the deviation of the medium temperature of the study area with respect to that of the regional medium reaches a maximum of 1.5 °C, the medium deviation is 0.5 °C. It is observed that there is a greater difference in the last year of study (2018).
The temperature conditions considered ideal for this crop with respect to its sowing, growth and ripening are also established (
Table 4), which are confronted with the performance and production data (
Table 5), obtaining the time interval in which the temperature is maintained within the optimal range for the crop (
Table 6).
It is observed that those years in which the average temperature has been more days in the range considered ideal and the number of days that have reached very high temperatures is reduced, are years with higher performance. The comparison between 2017 and 2018 is particularly indicative, as they have practically the same days in which dangerous temperatures have been reached for the crop, but 2017 was six days more in ideal conditions and resulted in a higher performance. A relationship between temperature and olive performance is therefore apparent, although further analysis is needed as there are many more factors that influence (other climatic variables, irrigation, treatments, etc.) on the final crop performance.
As for the cherry tree, we proceeded in a similar way in terms of data capture, obtaining the data collected in the
Table 7.
The results obtained do not show any pattern of relationship between temperature and cherry crop performance during the selected period. Thus, considering the assumptions made, it is possible to conclude that there is no clear relationship between temperature and performance in the case of cherry.
Analysis of the Evolution of the Remote Sensing Indexes of Collaborating Farms
During 2020, a study of the farms collaborating in the CultivData project was carried out based on what is known as remote sensing. To do so, images obtained from the satellites of the Sentinel-2 mission of the Copernicus [
34] program for the years 2019 and 2020 were used. The processing of these images allowed the extraction of a series of indices. From these indices it was possible to perform a first analysis of the evolution of three partner farms of the project. The farms, in particular, were the following:
Olive grove exploitation, Don Benito, Badajoz;
Exploitation of stone fruit trees, Valdivia, Badajoz;
Exploitation of almond trees, Villanueva de la Serena, Badajoz.
The indexes used are:
- 1.
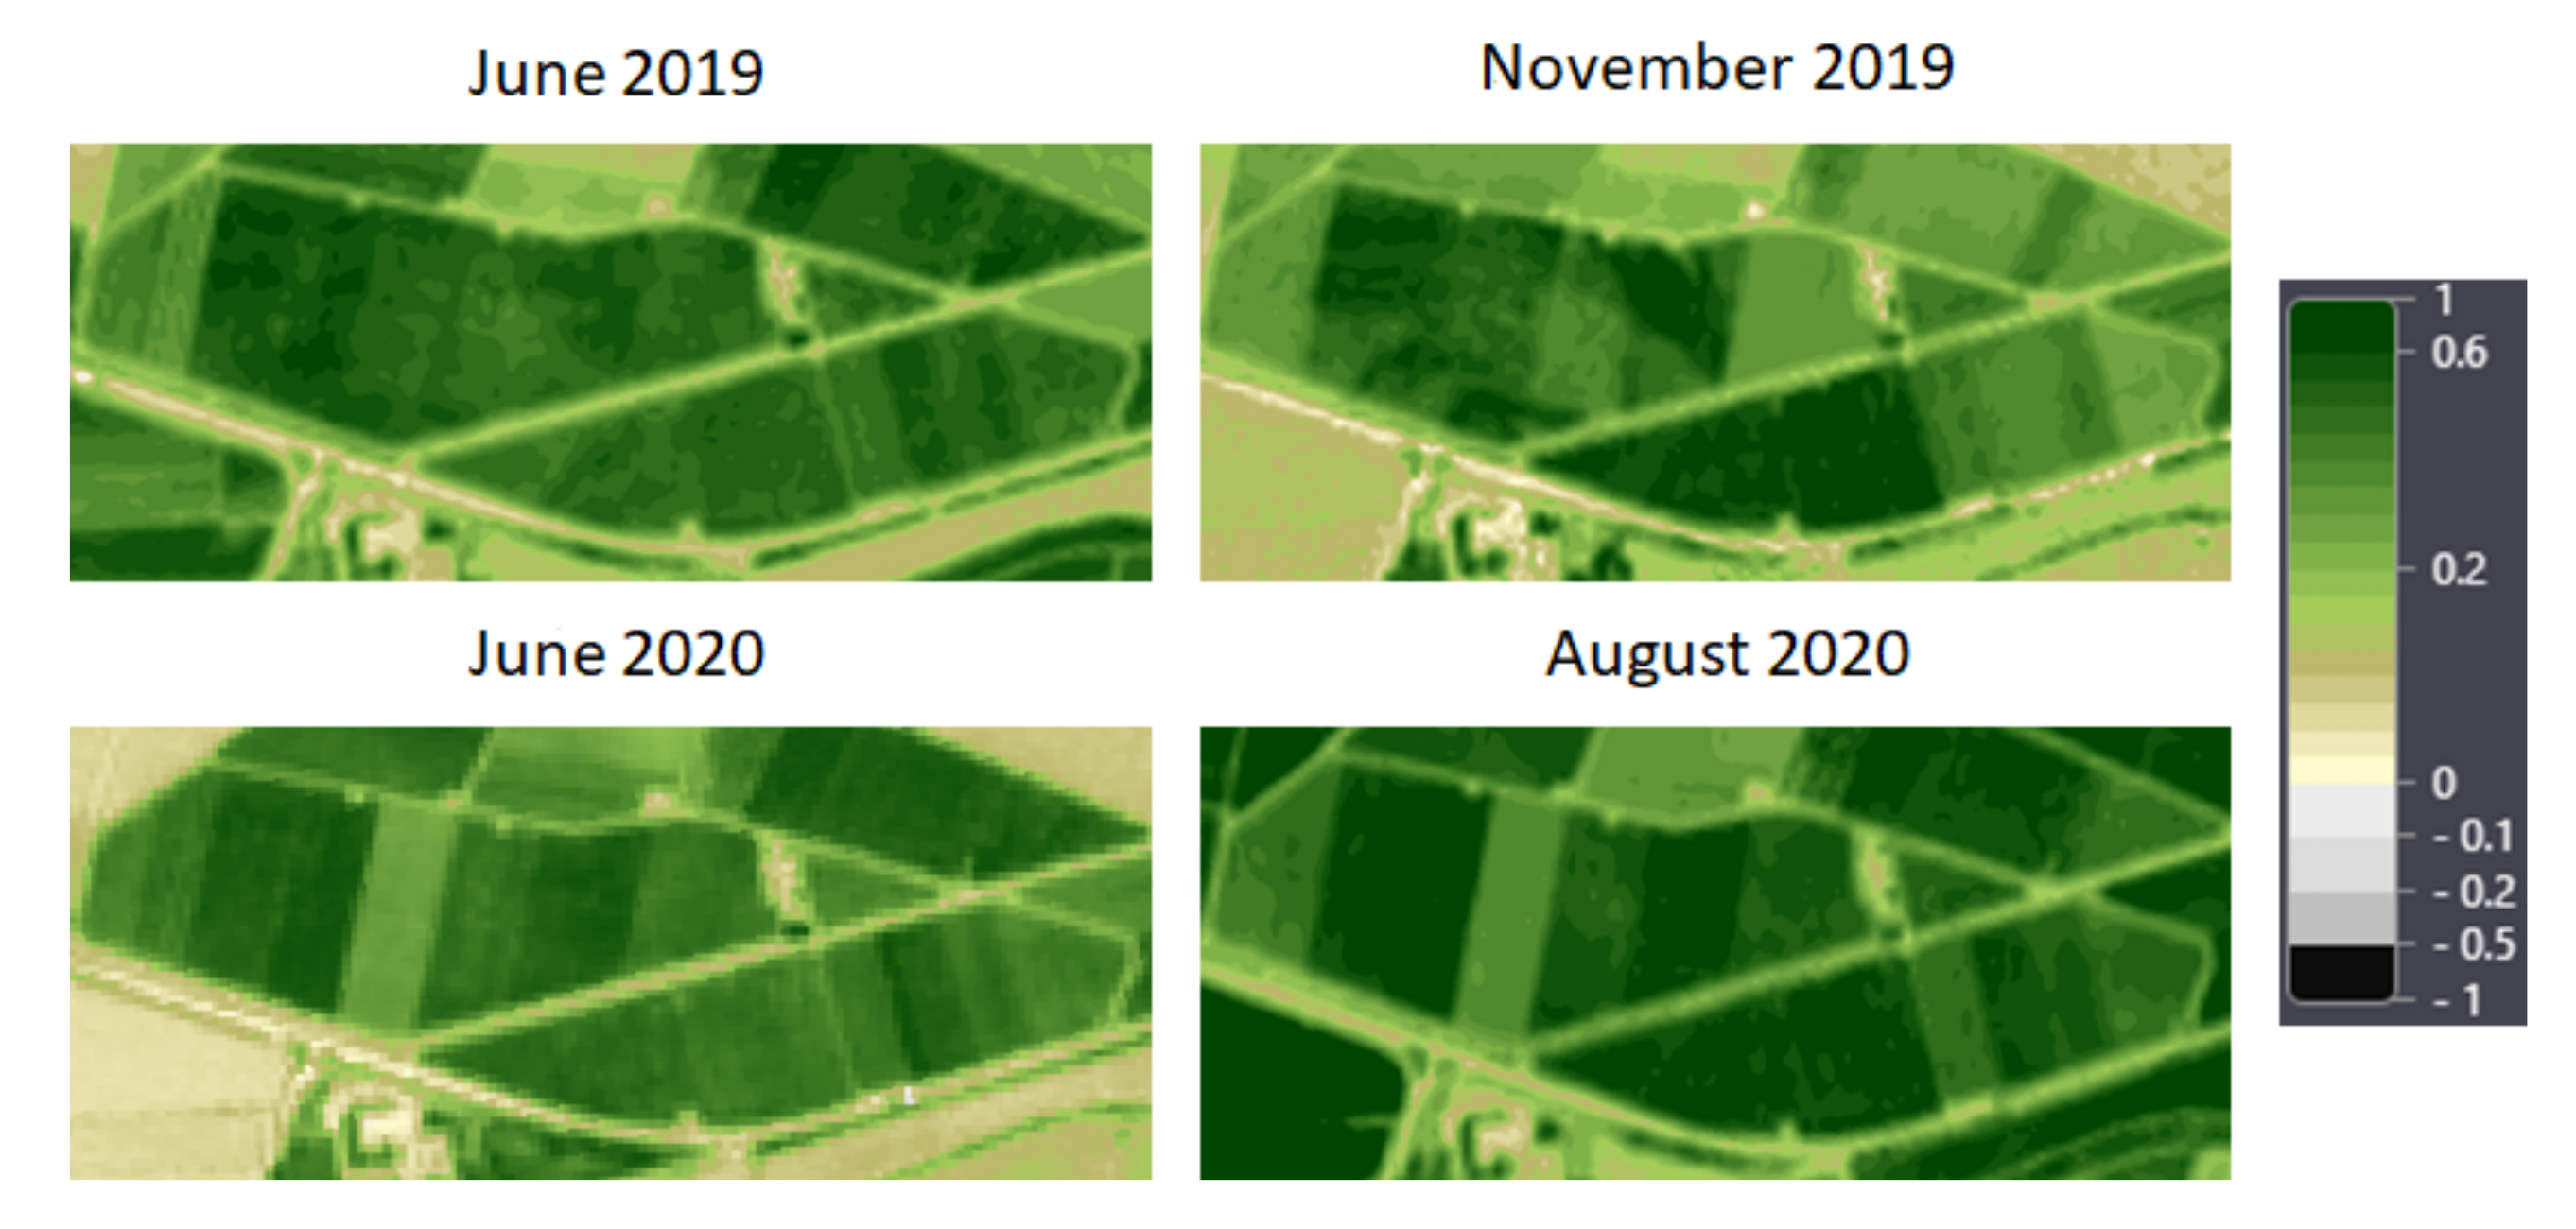
Normalized Difference Vegetation Index (NDVI) [
35]. This index defines values from −1.0 to 1.0, where negative values consist mainly of clouds, water and snow, and negative values close to zero consist mainly of rocks and bare soil. Very small values (0.1 or less) of the NDVI function correspond to areas without rocks, sand, or snow. Moderate values (0.2 to 0.3) represent bushes and grasslands, while large values (0.6 to 0.8) indicate warm and tropical forests.
In simple terms, NDVI is a measure of plant health based on the way a plant reflects light at certain frequencies.
- 2.
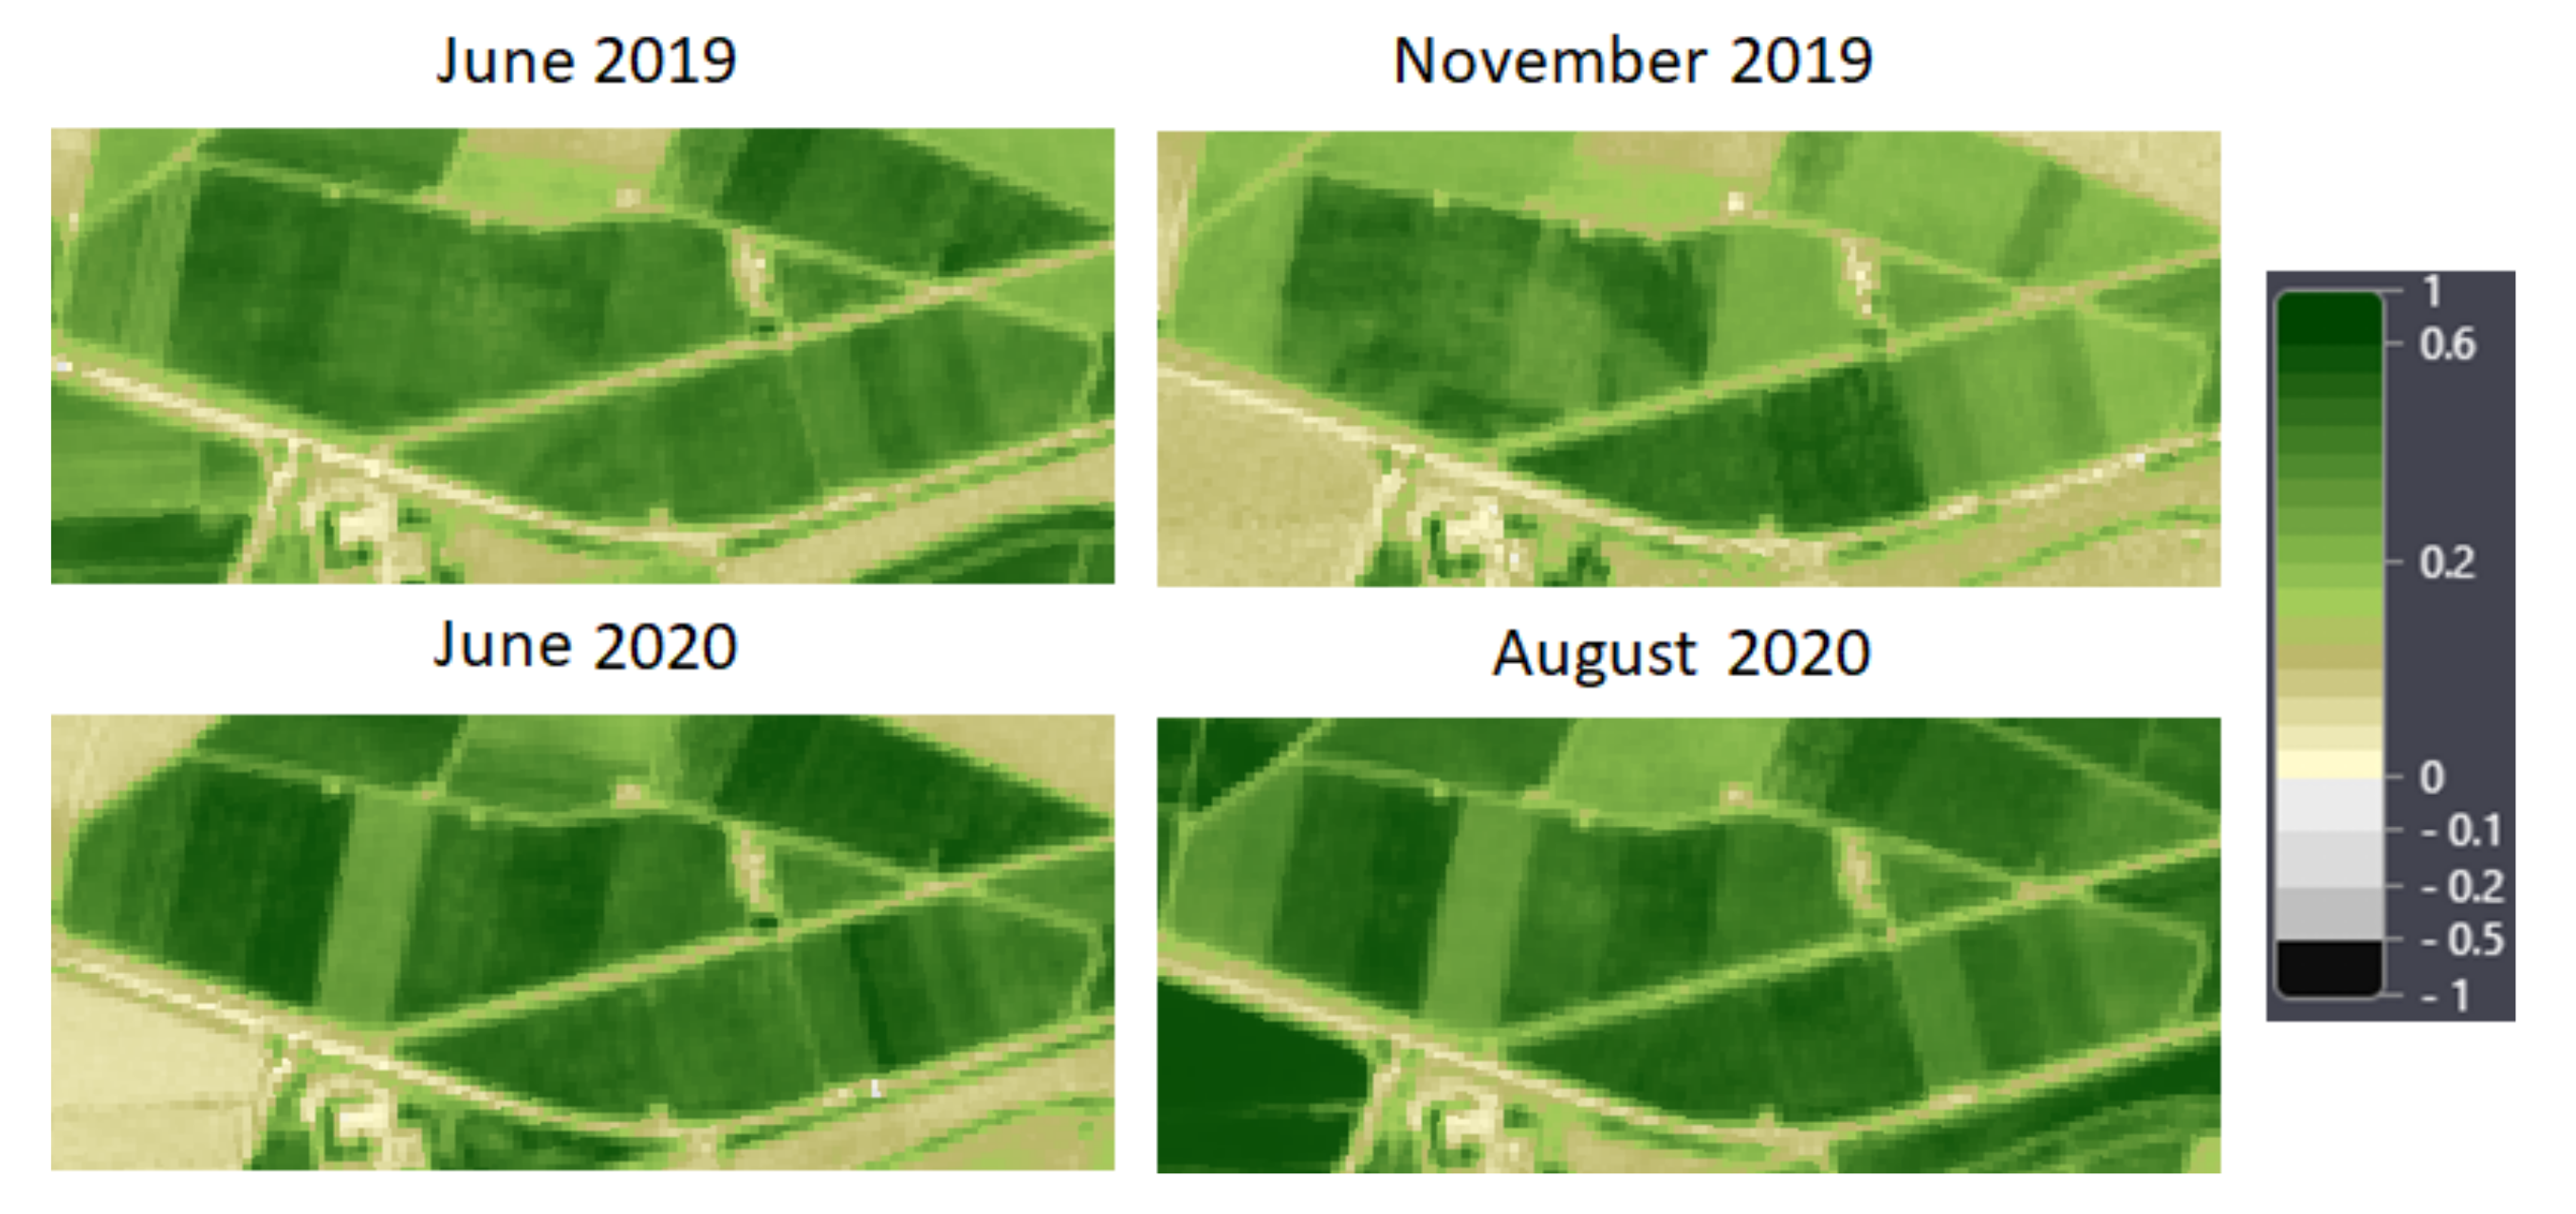
Soil-Adjusted Vegetation Index (SAVI) [
36]. This index is used to correct the NDVI for the influence of soil brightness in areas where vegetative cover is low. The SAVI derived from area reflectance is calculated as a ratio of the R and NIR values with a soil brightness correction factor (L) defined at 0.428, in this case, to accommodate most land cover types.
- 3.
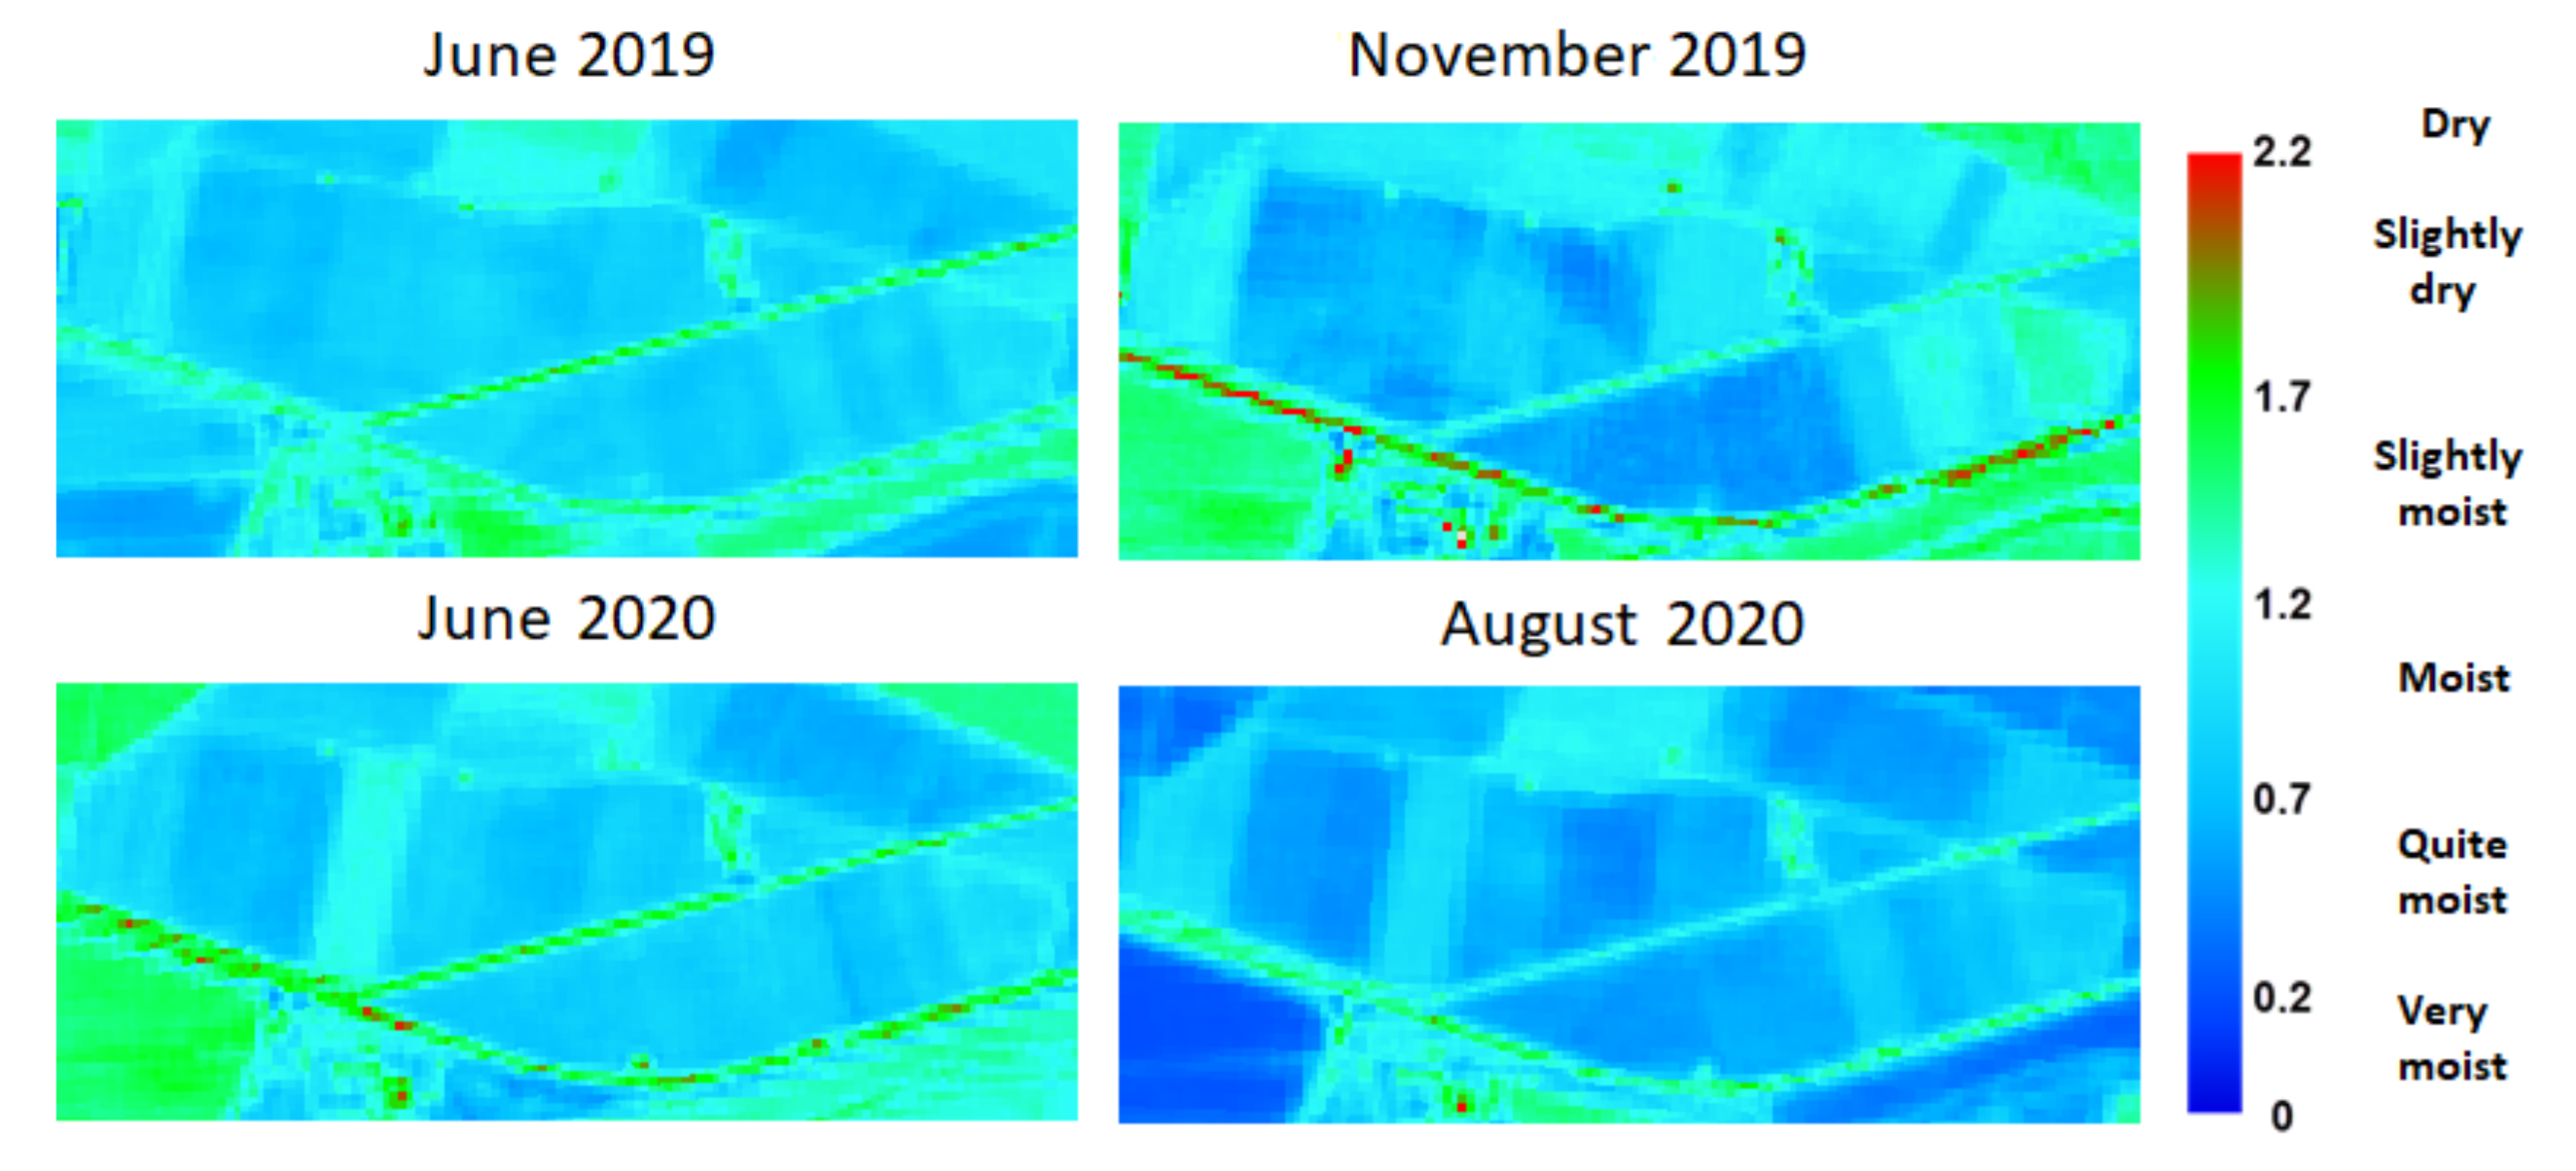
Moisture Stress Index (MSI) [
37]. This index is used for the analysis of canopy stress, productivity prediction, and biophysical modeling. The interpretation of the MSI is reversed relative to other aquatic vegetation indexes; therefore, higher values of the index indicate higher plant water stress and, in inference, lower soil moisture content. Values of this index range from 0 to greater than 3, with the common range for green vegetation being 0.2 to 2. As vegetation dries out, MSI increases. MSI is related to plant temperature and usable soil moisture.
Table 8 shows the established ranges for MSI.
- 4.
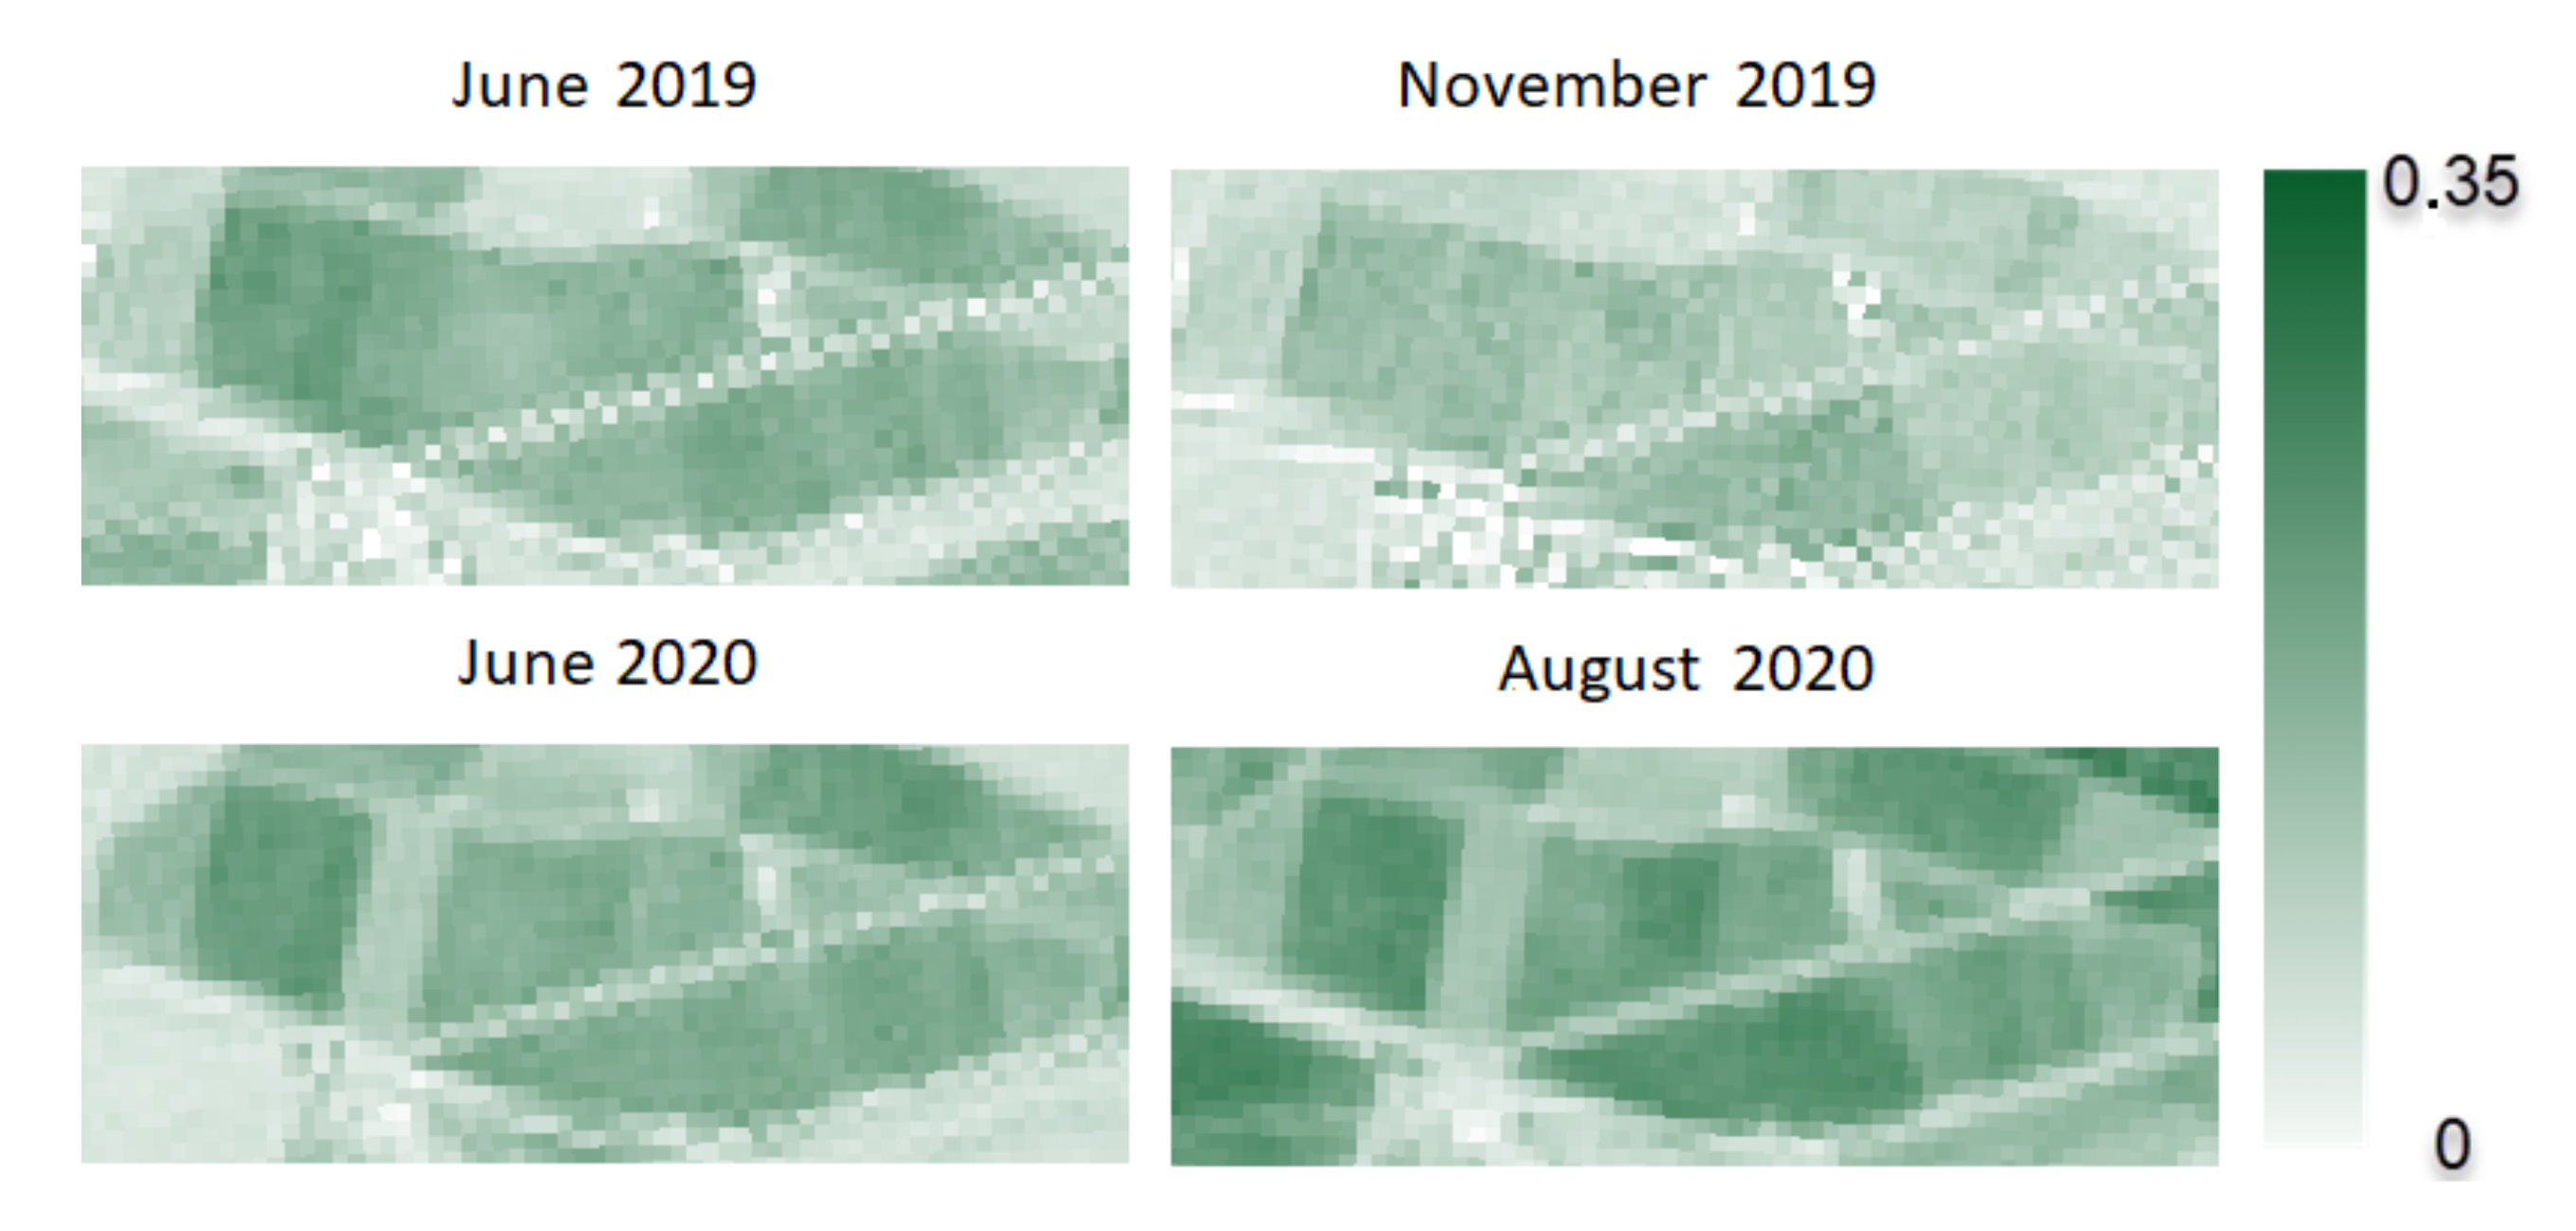
VOG index [
38]. This index is used to know the chlorophyll concentration, the VOG-2 Index is a version of VOG normalized to a range of values between 1 and −1.
- 5.
Bare Soil Index (BSI). It is a numerical indicator that combines blue, red, near infrared and shortwave infrared spectral bands to capture soil variations. These spectral bands are used in a standardized manner. The shortwave infrared and red spectral bands are used to quantify the mineral composition of the soil, while the blue and near infrared spectral bands are used to enhance the presence of vegetation. Low BSI values are associated with soils covered with vegetation, water, among other coverages, while high values signify areas corresponding to bare soil.
The analysis consisted of extracting these five indices for three of the collaborating farms, using four images, two from 2019 and two from 2020. These years were chosen in order to establish a correlation between the analysis performed and the data provided by the sensors.
The following is a brief analysis of those carried out for one of the farms.
Stone Fruit Tree Farm
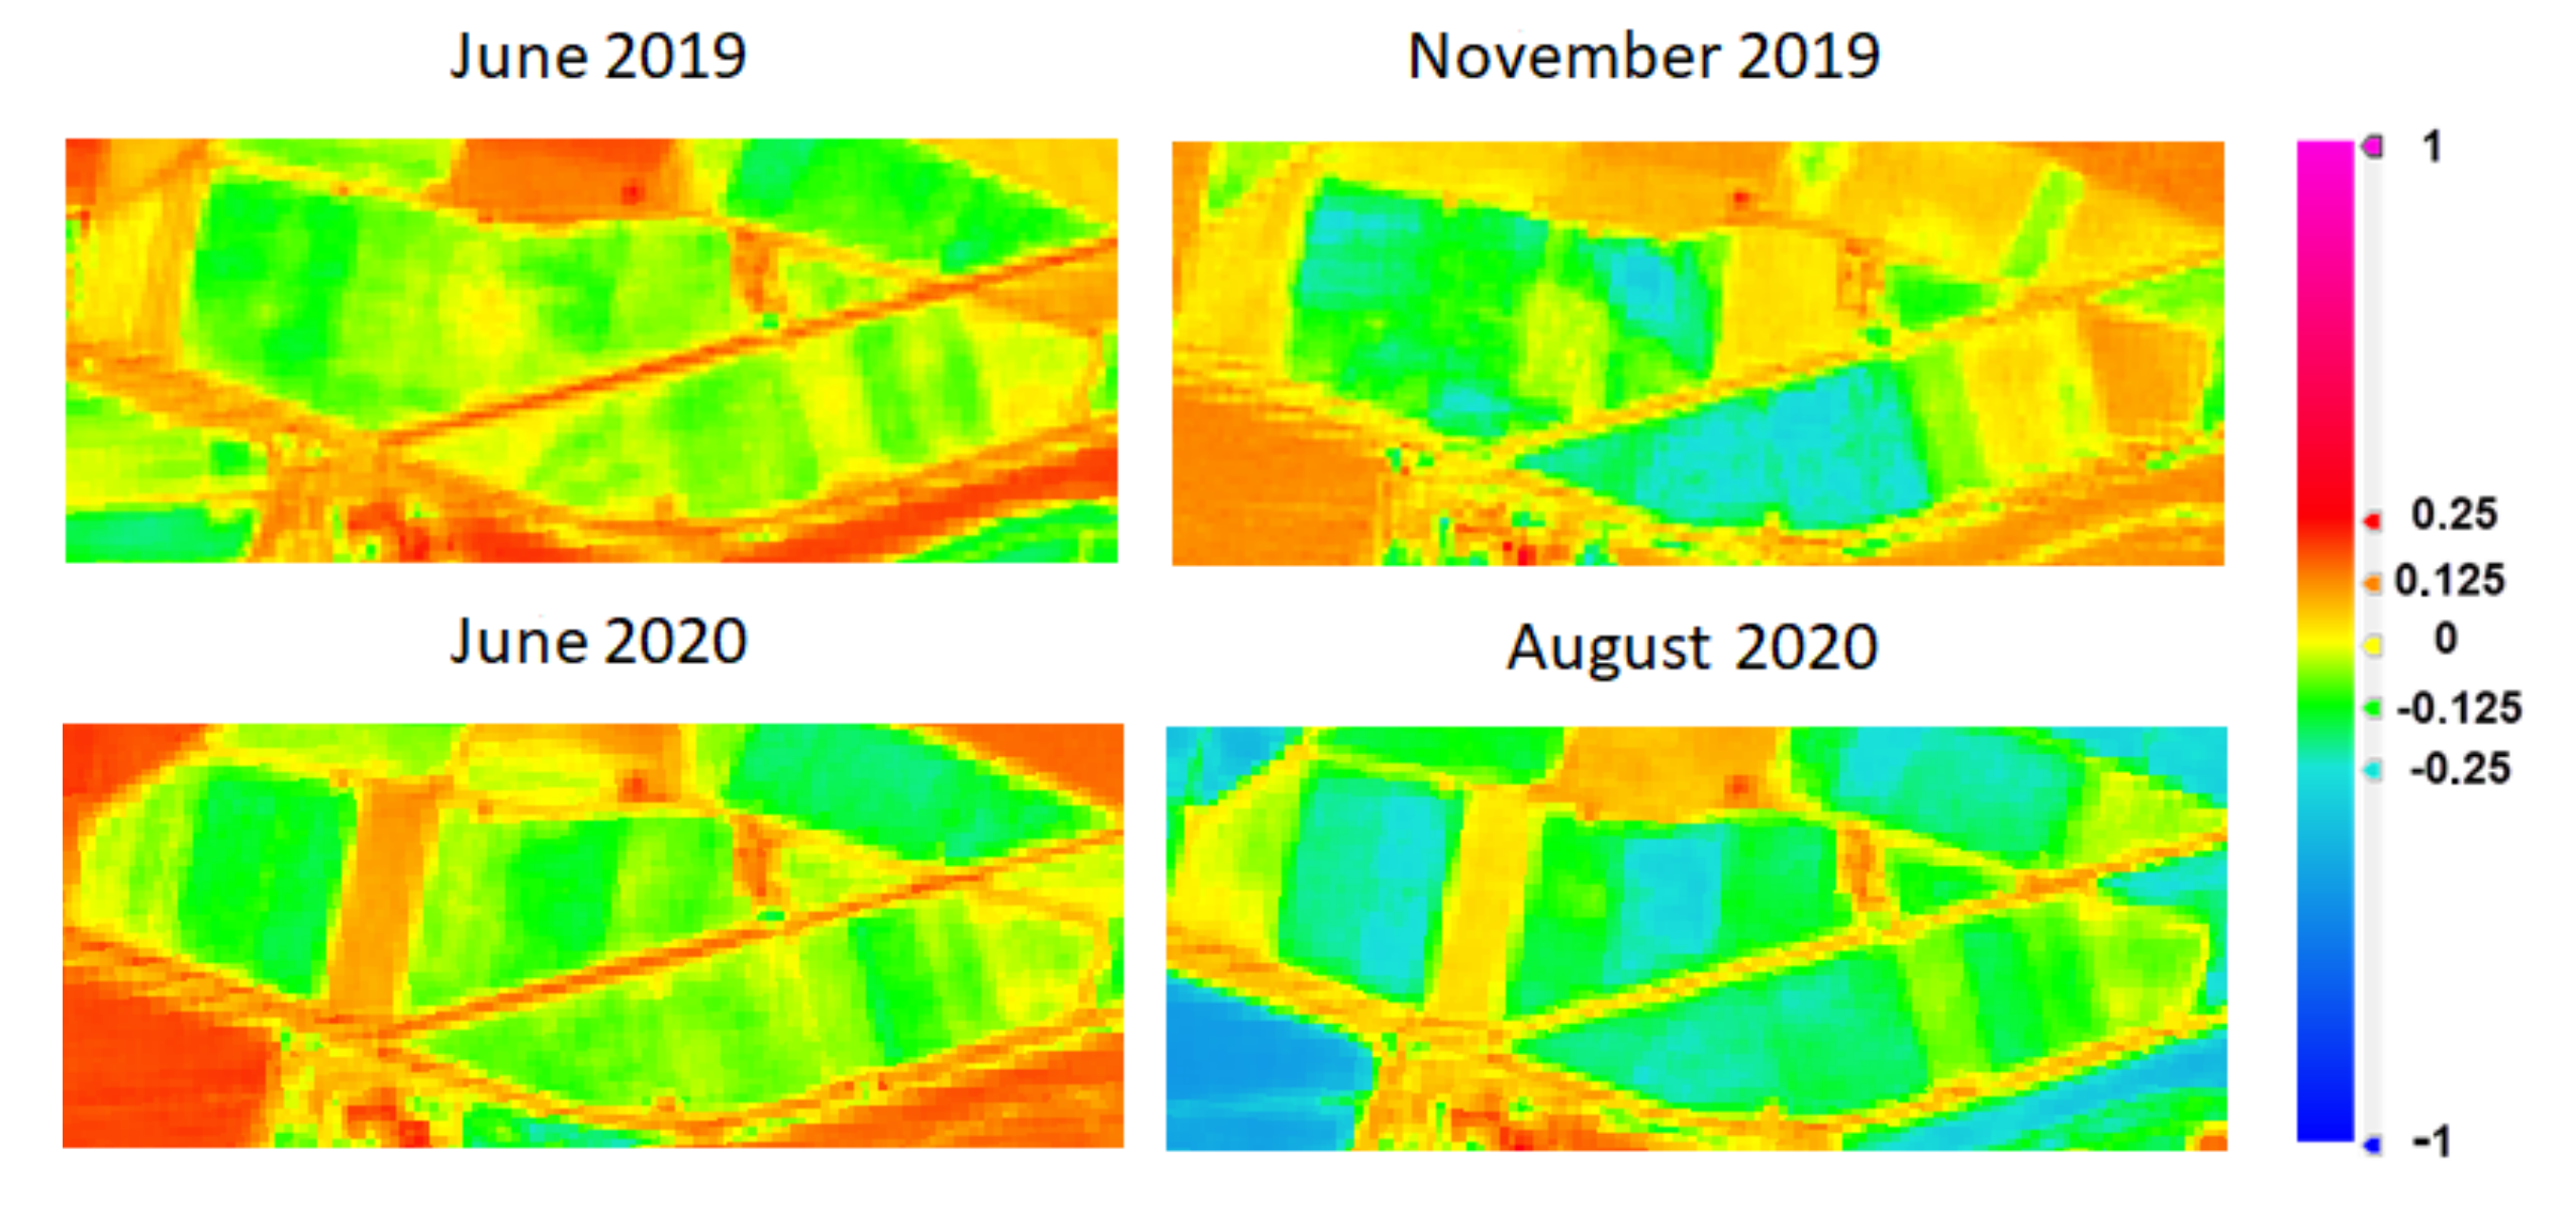
Evolution of the NDVI index (
Figure 11): in the first images it is observed that the values of this index take values between 0.5 and 0.8, indicating an optimal state of vegetation, possibly due to being in the harvesting season. Subsequently, the farms show evident changes between them, which may indicate that, being deciduous plants, some have lost their leaves and others have not. In June 2020, on the contrary, lower values are observed in some areas, which could indicate a high incidence of pest or disease;
Evolution of the SAVI index (
Figure 12): the evolution of the SAVI index is analogous to that observed in the case of NDVI. The same irregular behavior is evident in some areas of the farm, possibly due, as indicated above, to the existence of several types of crops or to the presence of some disease or pest;
MSI index evolution (
Figure 13): in general, this index shows that farms are in the moist/quite moist category, with the exception of some areas in June 2020 that may have been affected by a pest or disease;
VOG index evolution (
Figure 14): in the images corresponding to 2019, a heterogeneous behavior is observed in the chlorophyll content, which decreases in November, as these are deciduous plantations. In June 2020, as in the other indices, areas with low or no development appear;
BSI index evolution (
Figure 15): in 2019, it reflects a normal development of deciduous farms, as the value rises when the plant loses the leaf. In June 2020, the plant cover increases, except for the areas already identified as having no development.
Analysis results: It can be concluded that the plantation is in good condition, although there are areas without cultivation or in a critical situation. Moisture content is high, and chlorophyll content is optimal in areas where there is crop in good condition. An improvement in tree density can be seen from 2019 to 2020, although there are still very differentiated areas. This may be due to different crops, the age of the trees, different varieties, that the state of the plantation is not optimal, or that the specific area is fallow.
Integration of Previous Analysis and Sensor Data
The present analysis was carried out with the intention of demonstrating how the previous analyses and the data provided by the sensors deployed in the project could be combined. This analysis is based on those previously carried out, related to the correlation between different crops and temperature, but focused on one of the farms where the evolution of the remote sensing indices extracted from satellite images has been analyzed.
The farm chosen for the analysis is the almond farm, located on the edge of Villanueva de la Serena and whose last harvest took place in October 2020. It is considered interesting that the study period covers the year prior to that harvest, from 1 October 2019 to 30 September 2020. During the aforementioned period, the time intervals for which data from sensors are not available are replaced by data from open sources.
Table 9 shows the ideal and critical thresholds for almond tree cultivation, these data have been extracted from the Manual of the Almond Tree elaborated by the Ministry of Agriculture, Fisheries and Rural Development of the Junta of Andalucía [
39].
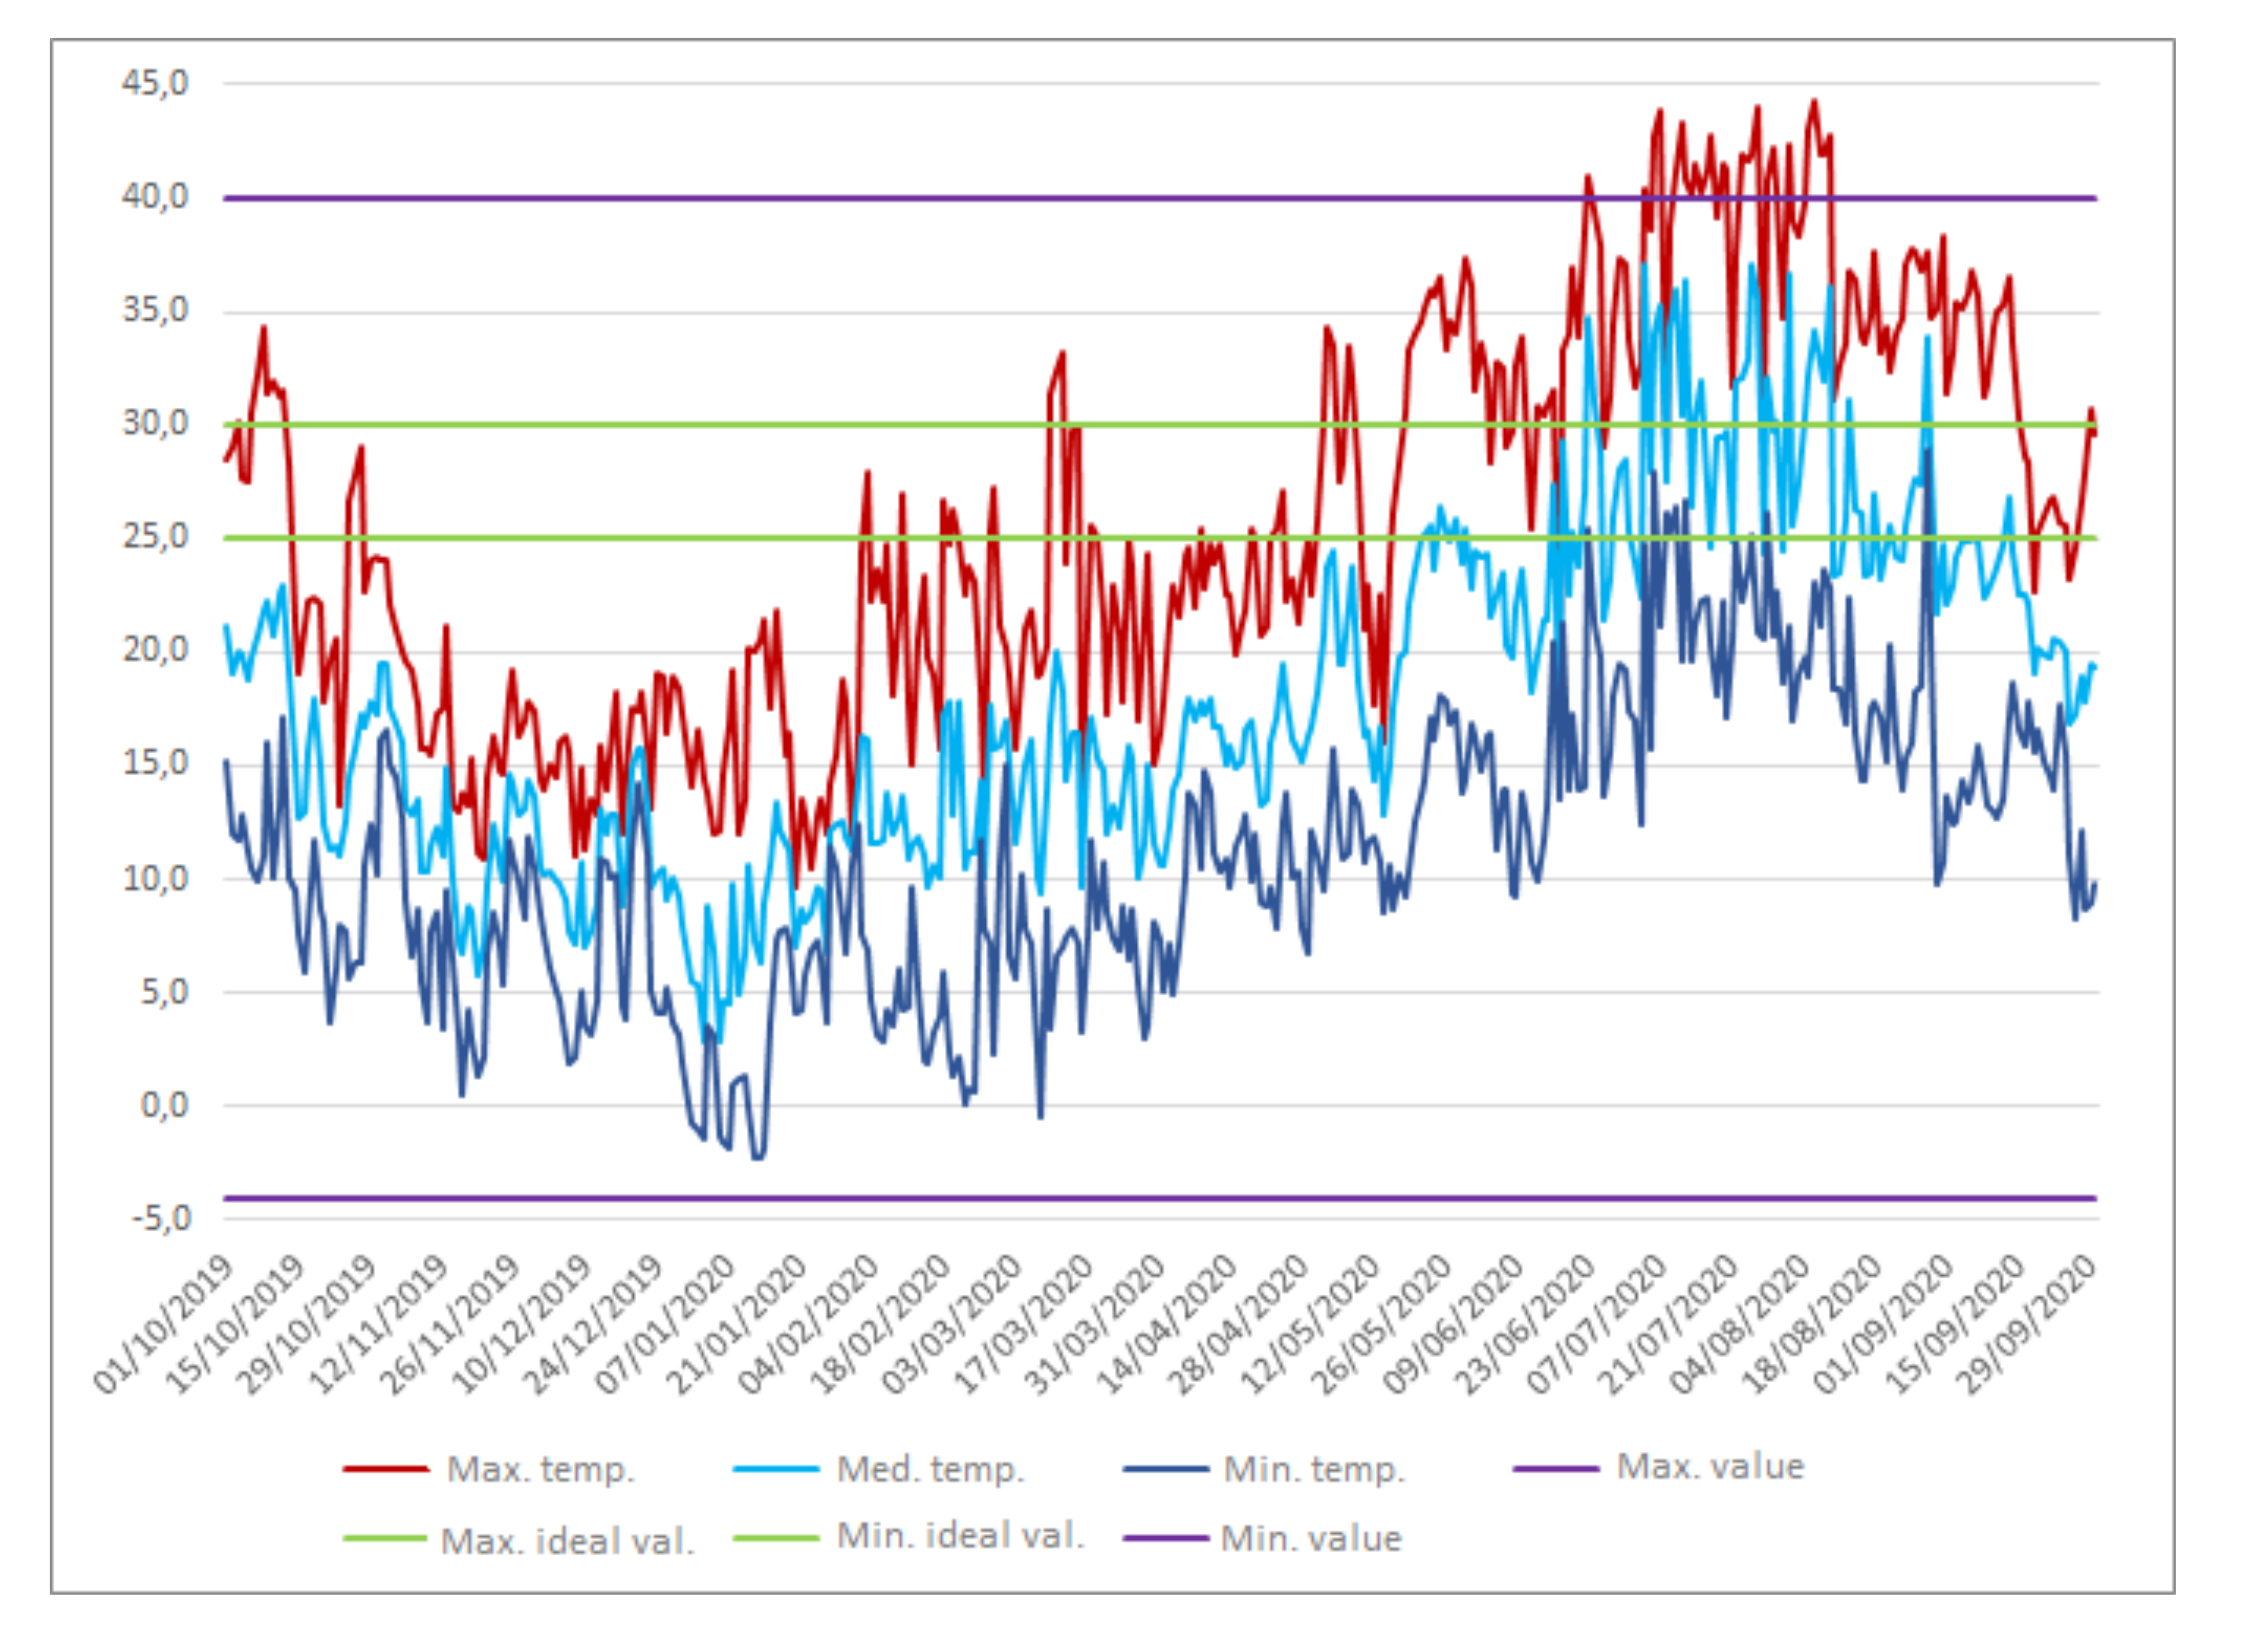
By applying the previously described thresholds to the evolution of the average temperature in the farm, we obtain
Figure 16, which shows the periods of time in where the farm has been within the optimum temperature range or has exceeded the maximum temperature recommended for the crop.
After analyzing the data, it was found that the farm was in ideal conditions for 38 days (medium temperature within the range considered ideal) while temperatures above 40 degrees were reached occasionally for 27 days, which was probably very damaging to the crop.
Study of the Appearance of Ochre Blotch
During 2020, the farm was affected by ochre blotch. One of the causes of the increase in cases of almond ochre blotch is believed to be global climate change, which has triggered a change in the seasons. Infection is favored by mild temperatures and high relative humidity during the spring.
In this sense, it was decided to carry out a review of the temperatures and relative humidities (
Table 10) detected by the deployed sensor with the values of previous years of the nearest REDAREX station (in total 5 years), in order to clarify if, indeed, there was a climatological combination that favored the appearance of this disease.
From the analysis carried out, it was concluded that high relative humidity, especially at the beginning of the spring period, and mild but relatively high temperatures represented conditions that could favor the development of this disease.
The control of these variables may allow the establishment of alarms to implement preventive measures for these or other diseases whose triggering climatic conditions are more or less known.
4.4.5. Models Evaluation
There was a lack of historical data from the Extremadura agri-food industry or from the collaborating farms themselves. The availability of farm data such as field notebooks, irrigation or treatment history, production and incident data and the inclusion of previous analyses would have been very useful for the analysis, but they were not available. This fact has prevented a more complete study that would allow a technical answer to most of the objectives and questions raised in the data mining process.
The analyses that could be carried out with the available data have attempted to answer two of the seven questions initially formulated in the process.
- 1.
Is there a direct or indirect relationship between climatology and the performance of a given crop?
Despite having performed an analysis exclusively with a climatological variable, the results seem to indicate that it has some relevance in the production of the analyzed crops;
- 2.
Is it possible to detect diseases or pests early and/or determine their causes?
Determining the cause of the appearance of diseases or pests has not been possible; however, it has been possible to establish which weather conditions favor the appearance of a disease such as ochre blotch in almond trees and confirm that such conditions have occurred in 2020 in the plantation that has suffered this disease.
4.4.6. Deployment of the Models
The deployment phase of the models in the CultivData platform has been limited to the design of their possible integration into the platform itself. The main design ideas for such integration are described below:
Integration of custom queries into the exploitation view. The goal is to make it possible to perform specific queries related to the farm itself: weather data and predictions from the nearest station, crop price, and so forth;
Incorporation of more information about the farm. The aim is to incorporate information that will help improve the analysis and provide a holistic view of the farm;
Incorporation of satellite images and their analysis. The objective is that the user can visualize the evolution of some of the remote sensing indices of his farm and be able to evaluate its evolution;
Setting alarms for diseases and pests.
5. Conclusions
The main results obtained in the CultivData project have been:
Identification and analysis of public data sources relevant to the sector: a large number of open data sources that may be relevant to the agri-food sector have been identified (86) and, in addition, an analysis of such sources has been carried out, which has allowed exploration of the data contained and even assessing the possibilities of their reuse;
Development of a prototype of an economic and functional agroclimatic sensor network: with an affordable price, with the idea of favoring its implementation in a weakly technified sector, and with an acceptable performance. The devices can measure more than ten agro-climatic variables and have an autonomy of months;
Heterogeneous agricultural information platform: this is the most important result of the project. It is a platform that allows its users to make queries to organizations with open data sources relevant to the sector in a centralized way and, in addition, allows storing and visualizing data from sensorized farms in order to perform a better monitoring of them from an agroclimatic point of view.
Exploratory analysis of data sources and data analysis: these analyses have allowed a deeper understanding of the data contained in the sources and the possibilities they represent for the regional agricultural sector. The continued collection of data over a long period of time and the addition of data from the agricultural sector (open data sources and new project collaborators) will increase the accuracy and effectiveness of these analyses.
The project has created a methodology for obtaining agricultural data, both from public sources and from on-farm sensors. The cultivation of these data provides knowledge about the specific needs of the agricultural sector. With the methodological experience of obtaining these data on the farms and having sufficient technical resources for their processing and analysis, technologies can be made available to companies in the agricultural sector that will allow them to optimize productivity, by technifying fundamental activities for making informed decisions based on data.
This is a pilot project in which one of the objectives was to obtain the methodology for the sensorization of farms, from the manufacture of the devices to their implementation, monitoring, data collection and integration with public data sources. The pilot project has been implemented in six farms and both the data and the use of the platform have been made available to farmers.
The temporality of the project has not allowed to have enough data resulting from the sensorization, since several productive cycles are necessary to have quality data that can be conclusive, therefore, once the methodology is defined, it would be necessary to collect them for several years to be able to analyze them adequately.
It could be concluded that the CultivData project represents the establishment of the necessary bases for the development of agriculture 4.0 in Extremadura (Spain). In this sense, in order to allow the project to be truly useful for the agricultural sector, the following future lines of work are established:
Involvement of the agricultural sector itself. A greater involvement of the sector’s agents is absolutely necessary, since the knowledge provided by them will allow the identification of new needs and improvements for the CultivData platform;
Continuous improvement of the platform. The platform should evolve according to new needs identified by users and industry stakeholders, adding new functionalities or improving existing ones;
Integration into the platform of the soil-plant-environment system. In all crops there are three key elements to know the health of the crops, the state of the soil, the state of the plant itself and the environmental conditions. The integration of information from these three aspects is essential for better crop monitoring;
Integration of the models and algorithms in the CultivData platform. During the development of the project, data models have been elaborated whose integration into the platform would allow the platform users to better know the status of their crops and their possible evolution. This knowledge will enable them to make better informed decisions.
Author Contributions
Conceptualization, F.L.-P., J.F.B.M. and J.-L.G.-S.; formal analysis, F.L.-P., J.F.B.M. and J.-L.G.-S.; funding acquisition, F.L.-P. and J.-L.G.-S.; investigation, F.L.-P., J.F.B.M., E.M.S. and J.-L.G.-S.; methodology, F.L.-P.; project implementation F.L.-P., J.F.B.M. and E.M.S.; project administration, J.-L.G.-S.; supervision, J.-L.G.-S.; validation, F.L.-P., J.F.B.M. and E.M.S.; visualization, F.L.-P., J.F.B.M. and E.M.S.; writing—original draft, F.L.-P., J.F.B.M., and J.-L.G.-S.; writing—review and editing, F.L.-P., J.F.B.M., E.M.S. and J.-L.G.-S. All authors have read and agreed to the published version of the manuscript.
Funding
CultivData is a research and development project funded by a specific multi-year transfer in favor of the COMPUTAEX Foundation by the General Direction of Digital Agenda belonging to the Ministry of Economy, Science and Digital Agenda of Regional Government of Extremadura (spain).
Conflicts of Interest
The authors declare no conflict of interest.
References
- Cox, M.; Ellsworth, D. Application-controlled demand paging for out-of-core visualization. In Proceedings of the Visualization’97 (Cat. No. 97CB36155), Phoenix, AZ, USA, 24 October 1997; pp. 235–244. [Google Scholar]
- Santos, P.M.; Queiros, C.; Sargento, S.; Aguiar, A.; Barros, J.; Rodrigues, J.G.P.; Cruz, S.B.; Lourenco, T.; D’Orey, P.M.; Luis, Y.; et al. PortoLivingLab: An IoT-Based Sensing Platform for Smart Cities. IEEE Internet Things J. 2018, 5, 523–532. [Google Scholar] [CrossRef]
- InsideBIGDATA Guide to Use of Big Data on an Industrial Scale. Available online: https://insidebigdata.com/white-paper/guide-big-data-industrial-scale (accessed on 15 March 2018).
- Li, X.; Zhu, L.; Chu, X.; Fu, H. Edge Computing-Enabled Wireless Sensor Networks for MultipleData Collection Tasks in Smart Agriculture. J. Sensors 2020, 2020, 4398061. [Google Scholar] [CrossRef]
- What is Open Data?—Open Knowledge Foundation. Available online: https://opendatahandbook.org/guide/en/what-is-open-data/ (accessed on 8 May 2021).
- Araujo, T.; Silva, L.; Moreira, A. Evaluation of Low-Cost Sensors for Weather and Carbon Dioxide Monitoring in Internet of Things Context. IoT 2020, 1, 286–308. [Google Scholar] [CrossRef]
- Antony, A.P.; Leith, K.; Jolley, C.; Lu, J.; Sweeney, D.J. A Review of Practice and Implementation of the Internet of Things (IoT) for Smallholder Agriculture. Sutainability 2020, 12, 3750. [Google Scholar] [CrossRef]
- Spachos, P. Towards a Low-Cost Precision Viticulture System Using Internet of Things Devices. IoT 2020, 1, 5–20. [Google Scholar] [CrossRef] [Green Version]
- Doshi, J.; Patel, T.; Bharti, S.K. Smart Farming using IoT, a solution for optimally monitoring farming conditions. Procedia Comput. Sci. 2019, 160, 746–751. [Google Scholar] [CrossRef]
- Popović, T.; Latinović, N.; Pešić, A.; Zečević, A.; Krstajić, B.; Djukanović, S. Architecting an IoT-enabled platform for precision agriculture and ecological monitoring: A case study. Comput. Electron. Agric. 2017, 140, 255–265. [Google Scholar] [CrossRef]
- Open-Source Hardware—Wikipedia. Available online: https://en.wikipedia.org/wiki/Open-source_hardware (accessed on 8 May 2021).
- Do it Yourself—Wikipedia. Available online: https://en.wikipedia.org/wiki/Do_it_yourself (accessed on 8 May 2021).
- ISO/IEC/IEEE. 29148:2011 Systems and Software Engineering—Life Cycle Processes—Requirements Engineering. Available online: https://www.iso.org/standard/45171.html (accessed on 9 May 2021).
- Wirth, R.; Hipp, J. CRISP-DM: Towards a standard process model for data mining. In Proceedings of the 4th International Conference on the Practical Applications of Knowledge Discovery and Data Mining, Manchester, UK, 11–13 April 2000. [Google Scholar]
- INE. National Statistics Institute—Ministry of Economic Affairs and Digital Transformation. Government of Spain. Available online: https://www.ine.es/ (accessed on 9 May 2021).
- AEMET. State Meteorological Agency—Ministry of Agriculture, Fishing and Food. Government of Spain. Available online: http://www.aemet.es/ (accessed on 9 May 2021).
- REDAREX. Irrigation Advisory Network of Extremadura (Spain)—Ministry of Agriculture, Rural Development, Population and Territory. Council of Extremadura. Available online: http://redarexplus.gobex.es/ (accessed on 10 May 2021).
- Eurostat. European Statistical Office—European Commission. Available online: https://ec.europa.eu/eurostat (accessed on 10 May 2021).
- ESP8266EX Datasheet. Available online: https://www.espressif.com/sites/default/files/documentation/0a-esp8266ex_datasheet_en.pdf (accessed on 10 May 2021).
- Arduino Ethernet Shield 2. Available online: https://www.arduino.cc/en/Guide/ArduinoEthernetShield (accessed on 10 May 2021).
- Sim900 Hardware Design V2.05. Available online: https://simcom.ee/documents/SIM900/SIM900_Hardware%20Design_V2.05.pdf (accessed on 10 May 2021).
- XBee. Available online: http://xbee.cl (accessed on 10 May 2021).
- Zigbee—Zigbee Alliance. Available online: https://zigbeealliance.org/solution/zigbee/ (accessed on 11 May 2021).
- Getting Started with Arduino UNO—Arduino. Available online: https://www.arduino.cc/en/Guide/ArduinoUno (accessed on 11 May 2021).
- Getting Started with Arduino Nano—Arduino. Available online: https://www.arduino.cc/en/Guide/ArduinoNano (accessed on 11 May 2021).
- Adafruit TPL5110 Low Power Timer—Adafruit. Available online: https://www.adafruit.com/product/3435 (accessed on 11 May 2021).
- Django. The Web Framework for Perfectionists with Deadlines. Available online: https://www.djangoproject.com (accessed on 11 May 2021).
- Flask Documentation. Available online: https://flask.palletsprojects.com/en/1.1.x/ (accessed on 11 May 2021).
- MongoDB Documentation. Available online: https://www.mongodb.com/ (accessed on 11 May 2021).
- Selenium. Available online: https://www.seleniumhq.org/ (accessed on 11 May 2021).
- Nutanix. Available online: https://www.nutanix.com/ (accessed on 11 May 2021).
- Supercomputer Lusitania III—CénitS. Available online: http://www.cenits.es/lusitania-III (accessed on 12 May 2021).
- Geographic Information System for Agricultural Data. Available online: https://sig.mapama.gob.es/siga/ (accessed on 12 May 2021).
- Copernicus Programm. Available online: https://www.copernicus.eu/es (accessed on 12 May 2021).
- Pettorelli, N. The Normalized Difference Vegetation Index; Oxford University Press: Oxford, UK, 2013. [Google Scholar]
- Huete, A.R. A soil-adjusted vegetation index (SAVI). Remote Sens. Environ. 1988, 25, 295–309. [Google Scholar] [CrossRef]
- Rock, B.N. Field and airborne spectral characterization of suspected acid deposition damage in red spruce (Picea rubens) from Vermont. In Proceedings of the 11th International Symposium on Machine Processing Remotely Sensed Data, West Lafayette, IN, USA, 3–5 June 1985; pp. 71–81. [Google Scholar]
- Vogelmann, J.E.; Rock, B.N.; Moss, D.M. Red edge spectral measurements from sugar maple leaves. Remote Sens. 1993, 14, 1563–1575. [Google Scholar] [CrossRef]
- Arquero, O. Almond Tree Manual: 2013—European Commission. Available online: https://www.juntadeandalucia.es/export/drupaljda/Manual_almendro_v_2013.pdf (accessed on 12 May 2021).
Figure 1.
Querying sensor data on the CultivData platform.
Figure 1.
Querying sensor data on the CultivData platform.
Figure 2.
Scheme of the system designed for CultivData.
Figure 2.
Scheme of the system designed for CultivData.
Figure 3.
Detailed diagram of the system architecture.
Figure 3.
Detailed diagram of the system architecture.
Figure 4.
Selected sensors for the project.
Figure 4.
Selected sensors for the project.
Figure 5.
Solar circuit diagram for 18,650 lithium batteries.
Figure 5.
Solar circuit diagram for 18,650 lithium batteries.
Figure 6.
First prototype of a sensorization device.
Figure 6.
First prototype of a sensorization device.
Figure 7.
Architecture of the sensor network developed.
Figure 7.
Architecture of the sensor network developed.
Figure 8.
Diagram of the network deployed in Farm 2.
Figure 8.
Diagram of the network deployed in Farm 2.
Figure 9.
Diagram of the network deployed in Farm 4.
Figure 9.
Diagram of the network deployed in Farm 4.
Figure 10.
Diagram of the network deployed in Farm 6.
Figure 10.
Diagram of the network deployed in Farm 6.
Figure 11.
Evolution of the NDVI index in stone fruit tree exploitation.
Figure 11.
Evolution of the NDVI index in stone fruit tree exploitation.
Figure 12.
SAVI index evolution in stone fruit tree exploitation.
Figure 12.
SAVI index evolution in stone fruit tree exploitation.
Figure 13.
MSI index evolution in stone fruit tree exploitation.
Figure 13.
MSI index evolution in stone fruit tree exploitation.
Figure 14.
VOG index evolution in stone fruit tree exploitation.
Figure 14.
VOG index evolution in stone fruit tree exploitation.
Figure 15.
BSI index evolution in stone fruit tree farms.
Figure 15.
BSI index evolution in stone fruit tree farms.
Figure 16.
Temperature evolution with ideal and critical thresholds.
Figure 16.
Temperature evolution with ideal and critical thresholds.
Table 1.
Rating scale of sources according to the degree of openness.
Table 1.
Rating scale of sources according to the degree of openness.
| Rating | Data Opening |
|---|
| 0/5 | Not available or License not open (e.g., HTML) |
| 1/5 | Openly licensed unstructured data (e.g., PDF) |
| 2/5 | Structured data but with proprietary format (e.g., Excel) |
| 3/5 | Structured data with open format (e.g., CSV) |
| 4/5 | Linkable data through URIs (e.g., RDF) |
| 5/5 | Linked data. Data with URIs and links to other data (e.g., RDF) |
Table 2.
Results obtained in the communications test of XBee modules.
Table 2.
Results obtained in the communications test of XBee modules.
| Site | Equipment Height (m) | Distance (m) | RSSI Remote (dBm) | RSSI Local (dBm) | Packet Loss (%) |
|---|
| 1 | 0 | 85 | −82 | −81 | 23.76 |
| 1 | 1 | 85 | −64 | −59 | 26.00 |
| 2 | 0 | 135 | −76 | −79 | 23.00 |
| 2 | 1 | 135 | −58 | −58 | 27.00 |
| 3 | 0 | 225 | −87 | −89 | 24.75 |
| 3 | 1 | 225 | −65 | −65 | 25.00 |
| 4 | 0 | 320 | −94 | −93 | 27.36 |
| 4 | 1 | 320 | −87 | −87 | 14.00 |
| 5 | 0 | 475 | - | - | - |
| 5 | 1 | 475 | −84 | −84 | 20.79 |
Table 3.
Results obtained in the autonomy test.
Table 3.
Results obtained in the autonomy test.
| Power Supply | 1.2 V AAA | 1.2 V AAA | 3.7 V Litio |
|---|
| Ranges (min) | 1 | 5 | 10 | 1 | 5 | 10 | 1 | 5 | 10 |
| Coordinator | 4 h | 5 h | 5 h | - | - | - | - | - | - |
| Sensorization | - | - | - | 7 h | 11 h | 14 h | 11 h | 13 h | 19 h |
Table 4.
Temperature values considered ideal for olive growing.
Table 4.
Temperature values considered ideal for olive growing.
| Medium temperature | Between 15 C and 20 C |
|---|
| Maximum temperature | 40 C |
| Minimum temperature | −7 C |
Table 5.
Area, performance and estimated production of olive tree cultivation in Extremadura (Spain).
Table 5.
Area, performance and estimated production of olive tree cultivation in Extremadura (Spain).
| | 2015 | 2016 | 2017 | 2018 |
|---|
| Area (ha) | 272,963 | 274,374 | 278,081 | 283,416 |
| Performance (t/ha) | 14,043 | 9352 | 16,386 | 14,695 |
| Production (t) | 3,833,219 | 2,565,946 | 4,556,635 | 4,164,798 |
Table 6.
Ratio of days in ideal conditions (IC), conditions in dangerous zone (DZ) together with the olive crop performance in Extremadura (Spain) in the analyzed period.
Table 6.
Ratio of days in ideal conditions (IC), conditions in dangerous zone (DZ) together with the olive crop performance in Extremadura (Spain) in the analyzed period.
| | 2015 | 2016 | 2017 | 2018 |
|---|
| Days in IC | 86 | 59 | 65 | 59 |
| Days punctually in DZ | 0 | 2 | 6 | 5 |
| Performance (t/ha) | 14,043 | 9352 | 16,386 | 14,695 |
Table 7.
Ratio of days in ideal conditions (IC), conditions in dangerous zone (ZP) together with the performance of the cherry crop in Extremadura (Spain) in the analyzed period.
Table 7.
Ratio of days in ideal conditions (IC), conditions in dangerous zone (ZP) together with the performance of the cherry crop in Extremadura (Spain) in the analyzed period.
| | 2015 | 2016 | 2017 | 2018 |
|---|
| Days in IC | 11 | 4 | 16 | 13 |
| Days punctually in DZ | 10 | 4 | 10 | 8 |
| Performance (t/ha) | 24,920 | 6027 | 18,503 | 8749 |
Table 8.
Scale of moisture stress index values.
Table 8.
Scale of moisture stress index values.
| Very moist | <0.2 |
| Quite moist | 0.2–0.7 |
| Moist | 0.7–1.2 |
| Slightly moist | 1.2–1.7 |
| Slightly dry | 1.7–2.2 |
| Dry | >2.2 |
Table 9.
Threshold temperature values for almond tree cultivation.
Table 9.
Threshold temperature values for almond tree cultivation.
| Medium temperature | Between 25 C and 30 C |
| Maximum temperature | 40 C |
| Minimum temperature | −4 C |
Table 10.
Average spring medium temperatures and relative humidities at the study farm 2016–2020 (C).
Table 10.
Average spring medium temperatures and relative humidities at the study farm 2016–2020 (C).
| Year | 2016 | 2017 | 2018 | 2019 | 2020 |
|---|
| Medium temperature (C) | 16.61 | 19.81 | 16.43 | 17.77 | 19.06 |
| Relative humidity (%) | 65.87 | 54.83 | 66.53 | 54.21 | 70.08 |
| Publisher’s Note: MDPI stays neutral with regard to jurisdictional claims in published maps and institutional affiliations. |
© 2021 by the authors. Licensee MDPI, Basel, Switzerland. This article is an open access article distributed under the terms and conditions of the Creative Commons Attribution (CC BY) license (https://creativecommons.org/licenses/by/4.0/).


 ,
, 


