Abstract
This paper assesses the relative performance of the MQTT protocol in comparison to the Secure Remote Update Protocol (SRUP) in a number of simulated real-world conditions, and describes an experiment that has been conducted to measure the processing delay associated with the use of the more secure protocol. Experimental measurements for power consumption of the devices and the size of comparable TCP packets were also made. Analysis shows that the use of the SRUP protocol added an additional processing delay of between 42.92 ms and 51.60 ms—depending on the specific hardware in use. There was also shown to be a 55.47% increase in power consumption when running the secure SRUP protocol, compared with an MQTT implementation.
1. Introduction
Much previous work regarding the Internet of Things (IoT) has considered devices comprised of very low-power microcontrollers and the impact of security protocols [1] such as Transport Layer Security (TLS) [2]; however, security for IoT message traffic is vital, and the performance of low-cost ARM-based systems mean that small-footprint IoT devices can be built around Single Board Linux computers. In this work we explore the performance of a protocol utilizing both TLS and asymmetric (public-key) cryptography (specifically the RSA (Rivest-Shamir-Adleman) crypto-system) to provide “Confidentiality, Integrity, & Authenticity” [3] for IoT systems built using low-cost ARM-based single board computers, in simulated real-world network conditions. Although previous work such as [4] has examined the performance of public-key cryptographic primitives on IoT-style devices with lower-powered microprocessors—the availability of much more capable processors at low cost-points sees their use become more widespread.
1.1. Protocol Comparison
In this paper, we describe experiments conducted to assess the performance overhead of the Secure Remote Update Protocol (SRUP) protocol against a simple unencrypted Message Queuing Telemetry Transport (MQTT) messaging scheme.
1.1.1. MQTT
The MQTT protocol [5], is a brokered publish/subscribe messaging protocol, which is very widely used within the IoT [6]. MQTT defines a hierarchical topic-based structure for message separation, and clients may subscribe to receive the byte-steam data published by other parties. By default MQTT is not secured; but MQTT over TLS can be implemented to encrypt the message traffic and restrict access to the broker.
1.1.2. The SRUP
In our previous work [7], we have described the SRUP for IoT communications, which is built on top of the MQTT protocol. SRUP defines a standard format for MQTT message payloads. This format allows a standardized implementation of features such as message signing to prove that messages originate from valid sources and that they have not been changed in transit, and protection against replay attacks (where an attacker captures a valid message and attempts to re-transmit or ‘replay’ that message at a later time of their choosing in order to cause an effect [8]). SRUP makes use of MQTT over TLS to ensure both confidentiality of the messages and access control to the MQTT broker [9] and uses 2048-bit RSA public/private key-pairs, and Secure Hash Algorithm version 2, with 256-bit hash (SHA-256) message hashing for signatures.
The SRUP protocol was designed for use in the context of a centralized Command and Control (C2) oriented IoT system. As such it assumes that all operations will take place within a client / server model of communications, with command from a user going via a C2 server to the device, and data going back to the user via the C2 server. In this context, the inherently decentralized concepts of blockchain in an IoT context [10] were not considered in the design of the protocol, since the C2 server is able to maintain an authenticated log of events (if required) without this additional overhead.
1.2. Performance Metrics
Our experiments considered three performance metrics for SRUP vs. plain MQTT.
- Network propagation and processing time;
- Device power consumption;
- Message size (in bytes).
2. Experimental Setup
2.1. Hardware
The experimental setup consisted of five IoT devices, each built from a Raspberry Pi 3B+ single board computer [11], fitted with a custom circuit board including LED (Light Emitting Diode) status indications and a push button for user interaction. An example of the device can be seen in Figure 1.
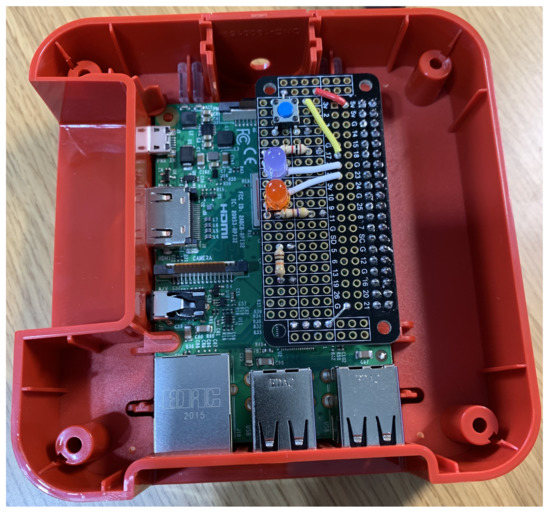
Figure 1.
The experimental hardware, consisting of a Raspberry Pi 3B+ single-board computer, and a custom circuit board.
For the purposes of this research paper, all experimentation was undertaken in lab-based conditions. The devices were connected over Ethernet [12] to another Raspberry Pi 3B+ computer, running locally on the network, acting as a simple C2 server. The C2 server was running custom software that selected one of the five devices at random, sent a SRUP action message to the device requesting that it toggled the state of the LED, and waited for a random interval before looping back. The program execution continued until each device had received a total of 250 messages. This is illustrated at Figure 2.
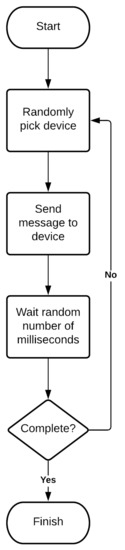
Figure 2.
A flowchart showing the execution of the C2 server during the experiment.
The a priori assumption was that a significant proportion of any additional delay would be due to the time taken to process the cryptographic algorithms used for message signing. In order to evaluate the extent to which the performance of the protocol is influenced by the speed of the hardware, one additional device was built using a faster Raspberry Pi 4 single board computer [13], allowing performance comparison with the other devices. The Pi 4 was identical to the devices described above, apart from the Central Processing Unit (CPU) and Random-Access Memory (RAM) configuration. This increased the CPU from the Broadcom BCM2837B0, Quad-core Cortex-A53 (ARMv8) 64-bit System on Chip (SoC) running at 1.4 GHz in the Pi 3B+, to a Broadcom BCM2711, Quad-core Cortex-A72 (ARM v8) 64-bit SoC running at 1.5 GHz. The RAM increased from from 1 GB of LPDDR2 to 2 GB of LPDDR4 SDRAM.
2.2. Software
The software consisted of the open source SRUP libraries (version 6.0) (built using C++) and the Python front-end wrapper described in our previous work [14]. This enabled the device code to consist of a short and easy-to-understand Python script.
2.3. SRUP vs. MQTT
In order to provide a baseline comparison, the performance of the devices was measured against the same hardware running a Python program (version 3.9.2) which used a simple MQTT scheme to control the LED. This comparison program made no use of either TLS for the MQTT message traffic encryption or RSA for message signing; this enabled the measurement of the overhead caused by these components (the term overhead is used here to refer to the potential additional burdens incurred from running SRUP, such as increased message delays or power consumption).
When using SRUP, there is a one-time key exchange process which only occurs when the device initially joins the C2 network. This process results in a short additional time delay, which is not part of the usual operation of the protocol.
The key exchange process uses Secure Hyper-Text Transfer Protocol (HTTPS) rather than MQTT to retrieve the key. As there is no equivalent step within the MQTT-only setup, the key exchange element was deliberately excluded from the comparison experiment.
A diagram depicting factors associated with the total processing delay for a SRUP message can be seen in Figure 3.
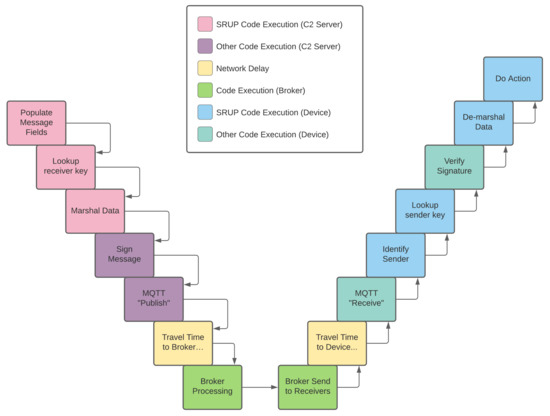
Figure 3.
A diagram showing the factors associated with the processing delay for an SRUP message.
Although these were not all explicitly measured during the experimentation, the travel time and broker processing delay are constant between both the SRUP and MQTT experiments, as are the MQTT publish and receive times (not counting any message size-related delays), and the time taken to perform the IoT device operation. As such the experiment measures the cumulative delay of the message population, signing process, verification and field extraction—plus a small amount of additional message propagation delay for the larger message size. Further detailed work would be required in order to profile the library code to identify the specific contribution of each of these elements to the overall delay.
2.4. Time Synchronization
In order to measure the overhead, the experiment made use of log files generated by the devices and by the C2 server; these indicate the time at which the server initiated the generation of the command and the time at which the receiving device had processed the message. These two timestamps were used to calculate the elapsed wall-clock time. In order to ensure that the clocks on both devices were synchronized as accurately as possible, the device acting as a C2 server was also configured to act as an Network Time Protocol (NTP) [15] server using the chrony tool (https://chrony.tuxfamily.org—accessed on 17 September 2021). Since there was no requirement for precise synchronization to an absolute time reference, the C2 server was running as the authoritative time source on the local network. Configuring the device’s clocks to use the local time-server as their sole source of time ensured that the clocks were as tightly aligned as possible.
3. Network Conditions
3.1. Network Condition Simulation
For the purposes of the experiment, it was assumed that the hardware were to represent deployed IoT devices connected over a cellular data connection. Network condition simulation was used in order to appropriately represent the behaviour of a cellular network in different operating conditions. This simulation was conducted using the Linux tc tool [16] and the associated tcconfig wrapper tools (such as tcset [17]).
Work by [18] provides performance data for cellular networks in a range of conditions [18], and this was used to select representative parameters for tc. In order to assess the performance comparison in a range of conditions, ten different cases were selected. These were drawn from a software implementation of the [18] dataset produced by [19]. The cases selected ranged from the theoretical ‘best case’ (where all devices were running on the same Local Area Network (LAN)) through to simulations of Fourth-Generation (4G) and Third-Generation (3G) cellular networks (which, in turn, ranged from ‘good’ to ‘poor’ signal strength).
A simple real-world measurement was taken within an isolated area of the New Forest National Park (on the south coast of the United Kingdom) in order to provide a representative data point for deployment of a 3G device in a rural location. The New Forest was selected as an area local to Southampton, with poor network coverage in order to record a real-world ‘worst case’ for signal strength and network performance.
An assessment made using a smartphone ‘network cell information’ measurement app [20] showed a very poor signal strength of -128 decibel-milliwatts (dBm) of Reference Signals Received Power (RSRP), and 115 kilobits per second (kb/s) upload. A photograph illustrating this is shown at Figure 4.
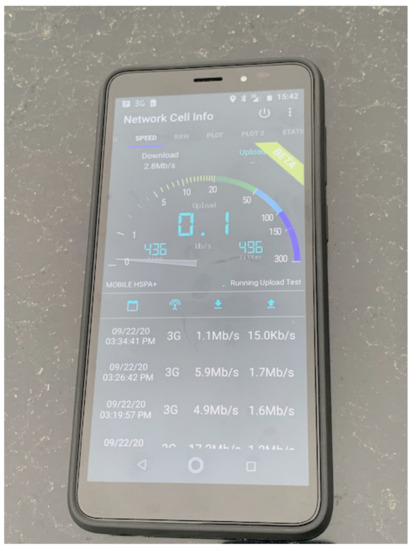
Figure 4.
A screenshot from the mobile application used to assess cellular network performance in a rural area of Southern England.
We wanted to assess the full range of cellular network conditions, from ‘very good’ to ‘very poor’ legacy networks (such as GSM (Global System for Mobile Communications: [21]), commonly referred to as Second-Generation (2G) networks). However, there is a lack of published data for the simulation of the network conditions of GSM, and therefore representative propagation delay data were taken for 3G networks from Khatouni et al., and the data transfer rates were capped at the ‘best case’ values for both the Enhanced Data Rates for GSM Evolution (EDGE) [22] and General Packet Radio Service (GPRS) [23] standards.
In order to establish a reasonable ‘worst case’, packet loss data taken from Ghaderi and Boutaba [24] were applied, in addition to the simple network propagation delays, to the network conditions simulation.
3.2. Experimental Conditions
The configuration for the experimental runs was as shown in Table 1; the full details of the network condition parameters used for each of these can be found in Appendix A:

Table 1.
Experimental Conditions.
Each of these cases was run as an experiment, with all five devices running the SRUP protocol.
For the comparison experiment (using the MQTT protocol), the ‘best case’, reasonable ‘worst case’, and three cases in between (cases 1, 2, 3, 5, and 9) were selected as being representative of the overall problem-space. These five cases, where both SRUP and MQTT were run, will be referred to as the ‘combined experiments’.
4. Measurements
Using the SRUP protocol, we expected to see an increase in the time taken for message processing and in the power consumption of the device (both due to the additional processing requirements of running the message signing algorithms), and the total size of the data sent (due to the additional fields used by SRUP to ensure message security). Therefore, the following measurements were taken:
4.1. Time
The actual performance measurement was assessed by analysis of the log files produced by the devices, and the server for any given experimental run. Full details of this analysis can be seen in Section 5.
4.2. Power
Assessment was made of the average power consumption of one of the devices when running both the MQTT and SRUP conditions. Measurement was made using a logging Universal Serial Bus (USB) power meter.
4.3. Message Size
The network traffic was captured using Wireshark [25] and examined to identify the size of the raw MQTT and the SRUP implementation’s MQTT messages.
5. Log File Analysis
All of the log file analysis was performed using the Python programming language and Jupyter notebooks [26]. The popular pandas library [27] was used for ‘data wrangling’ and collation. This analysis involved:
- Mapping the device ID to the logical device number;
- Loading the log files from the C2 server for each experiment;
- Stripping the unused columns out of the resulting dataframe;
- Loading all of the log files from each device, for each experiment, and combining them into a single Python object (a list of dictionaries of dataframes);
- Generating a new dataframe for each row in the C2 log dataframe, recording the device number, the type of operation (on or off), and the timestamp at which the command was sent;
- For each row in the dataframe generated in step 5, extracting the timestamp at which this command was received by the device;
- Calculating the time delay between sending and receiving, in milliseconds.
Each experiment generated a graph, which was used to check the data ingestion process (exemplars shown in Figure 5 and Figure 6). As expected, experiments where a delay distribution had been applied had a significantly greater standard deviation. A similar analysis process was also conducted for the experimental runs using MQTT.
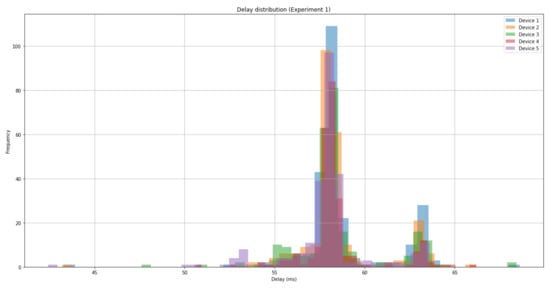
Figure 5.
A graph showing the delay distribution associated with SRUP message propagation and processing time, for experiment 1 (no network conditioning).

Figure 6.
A graph showing the delay distribution associated with SRUP message propagation and processing time, for experiment 7 (observed 3G poor signal).
Once complete, the next step of the analysis process was to calculate the mean delay for each device, for each experiment. The means for each device were then averaged in order to calculate the combined mean for each experiment; the total processing overhead for each experiment could then be calculated. Full details of the analyses can be seen in the Jupyter notebooks [28], available along with the raw and processed data within the experimental dataset.
6. Results
6.1. SRUP vs. MQTT Performance Comparison
A graph showing the mean delay for each of the SRUP experiments is shown in Figure 7, and a graph showing the combined means for each device for a given experiment (for both the SRUP and MQTT cases) is shown in Figure 8. The difference between the mean delays for each protocol is shown in Figure 9.
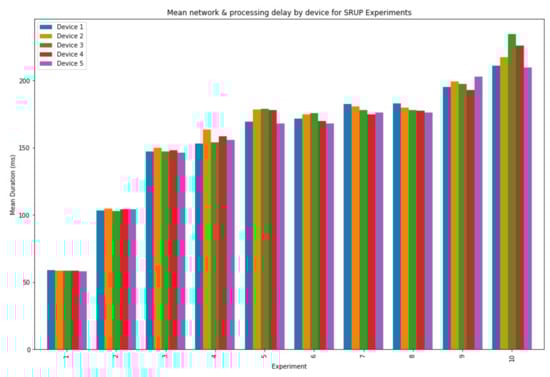
Figure 7.
A graph showing the mean SRUP message network and processing delay by device, for each of the experiments.
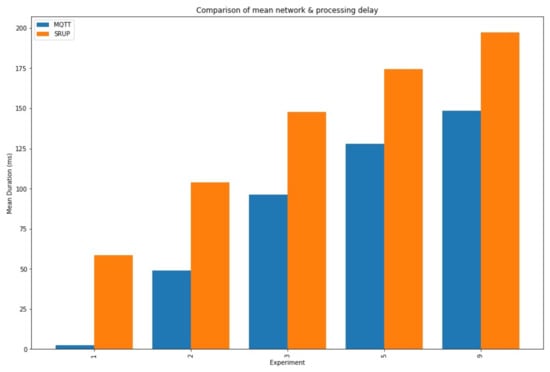
Figure 8.
A graph showing the total mean network and processing delay for both MQTT and SRUP messages, in the five combined experiments (experiments 1, 2, 3, 5, and 9).
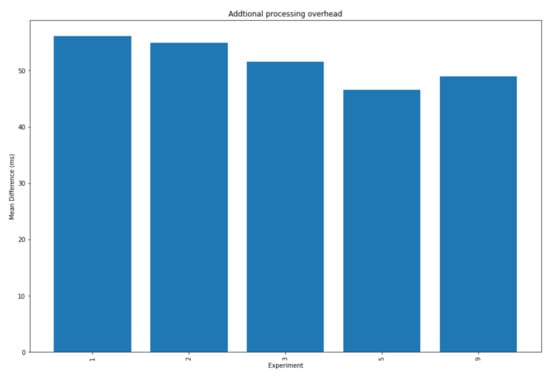
Figure 9.
A graph showing the difference between the total mean network and processing delay the five combined experiments.
The total combined mean processing overhead for SRUP, when compared with MQTT, across all network conditions, was shown to be an additional . This compares to the worst-case of when excluding the effects of the network delay (experiment 1). Although on an Ethernet LAN this represents a significant additional delay ( vs. ) compared with a wholly insecure system, when compared with a more representative scenario for deployed IoT (experiment 3, medium strength 4G): the overhead represents only % of the MQTT delay ( vs. = ).
Even in the worst-case, the processing overhead means that only where a message frequency exceeds (see Equation (1)), will the additional processing time be greater than the natural message period. Since a typical real-world IoT device may be expected to have a mean time between messages of minutes, the additional processing overhead in the order of tens of milliseconds is a very small additional price to pay for the very significant security benefits that the SRUP protocol offers. However, this result does show that protocol in its current form may not be well suited to highly time-critical applications, when running on lower-specification hardware.
A boxplot graph depicting the extent of the distribution of the data; and including the minimum, maximum, median and 1st and 3rd quartiles (Figure 10) shows the distribution of differences across all the combined experiments.
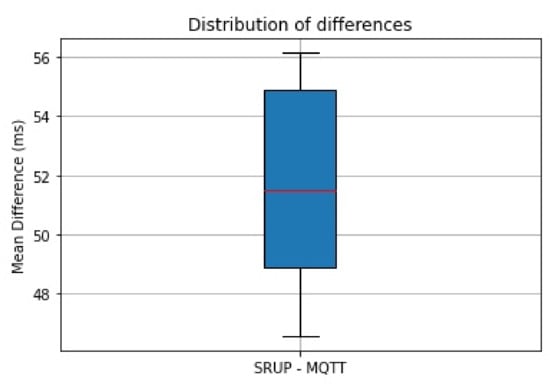
Figure 10.
A box-plot chart showing the distribution of differences in the network and processing delay between the MQTT and SRUP experiments, considered over all experiments.
The analysis also shows that the SRUP protocol is robust to even extremely poor network conditions. Even in the worst case (case 10), all messages were correctly received within (, ) (Figure 11) due to the robust nature of the underpinning MQTT protocol.
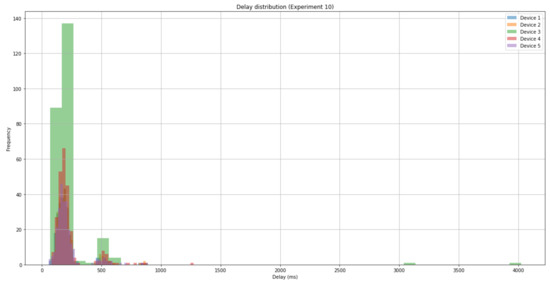
Figure 11.
A graph showing the delay distribution associated with message propagation and processing time, for experiment 10 (2G GPRS + 10% packet loss).
6.2. Raspberry Pi 3B+ vs. Raspberry Pi 4
The additional processing power of the Pi 4 was shown to have a benefit in reducing the overhead incurred by the use of SRUP. The Pi 4 was, on average, faster than the Pi 3B+ when using the SRUP protocol; in comparison, the MQTT protocol was just faster in the same context. Thus, the use of a Pi 4 reduces the total overhead processing delay to for SRUP.
6.3. SRUP vs. MQTT Power Consumption
A graph showing the instantaneous power consumption for a Raspberry Pi 3B+ device, running the combined experiment (case 1) is shown at Figure 12.
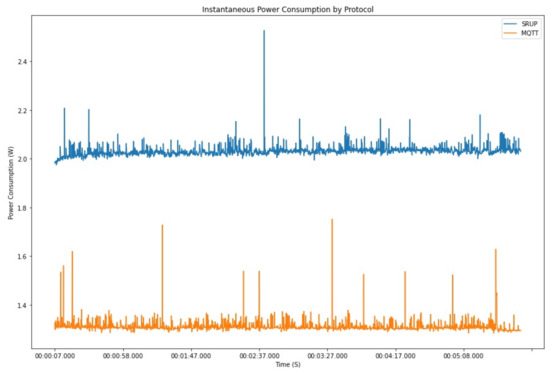
Figure 12.
A graph showing the instantaneous power consumption of the experimental device, by time, for a combined experiment (case 1).
The mean power consumption for the MQTT run is (), which compares to a mean power consumption of () for SRUP. The power consumption of the device when running SRUP can thus be shown to be an additional when compared with MQTT.
This represents an increase in power-consumption of %. (See Equation (2)).
If the device was powered over USB (at 5 ) from a 10,000 mAh battery, the energy of the battery may be expressed as (10,000 .
From this we can calculate (Equations (3)–(5)) that the battery would be expected to last for 38.1 h of continual MQTT activity, vs. 24.5 h of SRUP operation; a difference of 13.6 h of continuous operation. A real-world IoT application, however, would be very unlikely to be operating in a state of continuous message exchange, and in may typically exchange at most a few messages per minute; therefore, the additional power required to process the messages represents only a very small proportion of the overall power consumption.
6.4. SRUP vs. MQTT Message Size
Analysis of the Wireshark traffic capture shows the differences between the message lengths. For the MQTT setup, a single text character was sent as the message payload using either an ASCII (American Standard Code for Information Interchange): ‘1’ or a ‘0’ (ASCII 31 or 30) corresponding to the on or off operation. This, combined with the MQTT topic used to identify the destination device (e.g., test/d1), results in a message size of 80 bytes.
In comparison, for the SRUP experiment, the same signal was sent using a message comprised of:
- One byte (0x00 or 0xFF) to signify the operation to perform (on or off);
- A two-byte SRUP message header;
- An eight-byte sequence ID;
- An eight-byte sender ID;
- A variable-length token;
- The RSA signature.
The message is sent to an MQTT topic corresponding to the device ID prefixed by the word SRUP. This results in an SRUP message size of 359 bytes, and an overall TLS packet length of 430 bytes. This represents an approximately 540% increase in data for the SRUP application when compared with MQTT.
An example dataframe corresponding to each of these two message types can be seen at Figure 13.
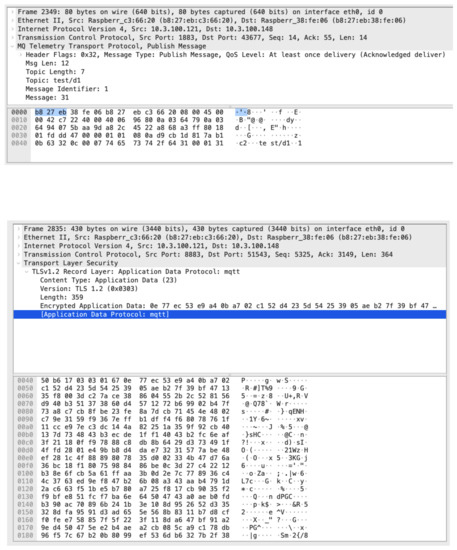
Figure 13.
The raw network data, captured in Wireshark, for two messages (an MQTT message (top), and a SRUP message (bottom)). In each case the messages carry the same data. Note that the plain MQTT message is unencrypted, in contrast to the SRUP message.
7. Conclusions
We have shown that the overhead associated in processing messages sent using our new Secure Remote Update Protocol (SRUP), in comparison with insecure Message Queuing Telemetry Transport (MQTT) messages, is independent of the network conditions. SRUP has also been shown to have an overhead that is tolerable for all messaging applications bar those that are the most time-sensitive or those requiring a higher message frequency than messages-per-second.
The benefits of using the SRUP protocol are that it provides: (1) encrypted and authenticated messages, and (2) resilience to replay attacks (where an attacker captures a valid message and attempts to re-transmit it to cause an effect). These benefits are highly significant for any real-world application of Internet of Things (IoT) technologies; without message encryption, the data contained within the messages may be freely obtained by anyone with access to the transport network or anyone who is able to ‘sniff’ traffic leaving or entering the devices or servers. Authentication ensures that messages are protected from both deliberate tampering or accidental corruption in transit, and ensures that only validated and approved senders can issue commands to devices.
The SRUP protocol offers protection against replay attacks by removing the possibility of an attacker capturing a valid message; such protections greatly enhance the security of IoT systems, rendering them much more suitable for use in applications such as building management or monitoring.
We have also shown that, although there is a cost in terms of the power consumption of devices using SRUP, this is only an issue for battery-powered devices. Further research is recommended to evaluate the power consumption demands of running SRUP on battery-powered devices that utilize specialized low power hardware. Additionally, no work has yet been conducted to examine the implications of running SRUP on embedded microcontrollers, such as the ESP32.
Although the data packet size of SRUP is significantly increased compared with MQTT, we have shown that SRUP traffic is robust to even extremely poor network conditions and that messages are still successfully delivered. This increased packet size does, however, mean that the protocol is not well-suited for use with extremely constrained bandwidth communications bearers, such as LoRa [29] or SigFox [30].
Author Contributions
Conceptualization, methodology, software, validation, formal analysis, and investigation, A.J.P.; writing—original draft preparation, A.J.P.; writing—review and editing, A.J.P. and S.J.C.; visualization, A.J.P.; supervision, S.J.C. All authors have read and agreed to the published version of the manuscript.
Funding
This work has been funded by the United Kingdom Defence Science and Technology Laboratory (Dstl). Dstl is a part of the U.K. Ministry of Defence.
Data Availability Statement
All data, and analysis, pertaining to this research can be obtained as “Dataset for An assessment of the Performance of the Secure Remote Update Performance in Simulated Real-World Conditions” [28].
Conflicts of Interest
The authors declare no conflict of interest.
Appendix A. Network Conditioning Simulation Setup
The detailed network conditioning settings for each of the ten experiments was as shown in Table A1.
Table A1.
The detailed network conditioning settings for each of the ten experiments.
Table A1.
The detailed network conditioning settings for each of the ten experiments.
| Experiment | Description | Distribution Used | tc Settings Applied |
|---|---|---|---|
| 1 | LAN Ethernet | No network conditioning | - |
| 2 | Good Strength 4G | H3G_Access_AB.good.4G ↩ .no_roaming | - |
| 3 | Medium Strength 4G | TIM.medium.4G.no_roaming | - |
| 4 | Good 3G | TIM.good.3G.no_roaming | |
| 5 | Poor 3G | TIM.bad.3G.no_roaming | |
| 6 | 2G EDGE best-case | - | –rate 384 Kbps –delay 115.6 ms |
| 7 | Observed 3G poor signal | - | –rate 115 Kbps –delay 122.6 ms –delay-distro 40.6 |
| 8 | 2G GPRS best-case | - | –rate 40 Kbps –delay 122.6 ms –delay-distro 40.6 |
| 9 | 3G poor signal +5% loss | - | –rate 115 Kbps –delay 122.6 ms –delay-distro 40.6 –loss 5 |
| 10 | 2G GPRS +10% loss | - | –rate 40 Kbps –delay 122.6 ms –delay-distro 40.6 –loss 10 |
References
- Restuccia, G.; Tschofenig, H.; Baccelli, E. Low-Power IoT Communication Security: On the Performance of DTLS and TLS 1.3. In Proceedings of the 2020 9th IFIP International Conference on Performance Evaluation and Modeling in Wireless Networks (PEMWN), Berlin, Germany, 1–3 December 2020; pp. 1–6. [Google Scholar] [CrossRef]
- Rescorla, E. The Transport Layer Security (TLS) Protocol Version 1.3; Standard RFC 8446; Internet Engineering Task Force: Fremont, CA, USA, 2018; Available online: https://tools.ietf.org/html/rfc8446 (accessed on 17 September 2021).
- Braun, J.; Buchmann, J.; Demirel, D.; Geihs, M.; Fujiwara, M.; Moriai, S.; Sasaki, M.; Waseda, A. LINCOS: A Storage System Providing Long-Term Integrity, Authenticity, and Confidentiality. In Proceedings of the 2017 ACM on Asia Conference on Computer and Communications Security (ASIA CCS’17), New York, NY, USA, 2–6 April 2017; pp. 461–468. [Google Scholar] [CrossRef]
- Shim, K.A. A Survey of Public-Key Cryptographic Primitives in Wireless Sensor Networks. IEEE Commun. Surv. Tutor. 2016, 18, 577–601. [Google Scholar] [CrossRef]
- Banks, A.; Gupta, R. MQTT Version 3.1.1, OASIS Standard. 29 October 2014. Available online: http://docs.oasis-open.org/mqtt/mqtt/v3.1.1/os/mqtt-v3.1.1-os.pdf (accessed on 17 September 2021).
- Colombo, P.; Ferrari, E.; Tümer, E.D. Regulating Data Sharing across MQTT Environments. J. Netw. Comput. Appl. 2021, 174, 102907. [Google Scholar] [CrossRef]
- Poulter, A.J.; Johnston, S.J.; Cox, S.J. SRUP: The Secure Remote Update Protocol. In Proceedings of the 2016 IEEE 3rd World Forum on Internet of Things (WF-IoT), Reston, VA, USA, 12–14 December 2016; pp. 42–47. [Google Scholar] [CrossRef] [Green Version]
- Feng, Y.; Wang, W.; Weng, Y.; Zhang, H. A Replay-Attack Resistant Authentication Scheme for the Internet of Things. In Proceedings of the 2017 IEEE International Conference on Computational Science and Engineering (CSE) and IEEE International Conference on Embedded and Ubiquitous Computing (EUC), Guangzhou, China, 21–24 July 2017; Volume 1, pp. 541–547. [Google Scholar] [CrossRef]
- Poulter, A.J.; Johnston, S.J.; Cox, S.J. Extensions and Enhancements to “the Secure Remote Update Protocol”. Future Internet 2017, 9, 59. [Google Scholar] [CrossRef] [Green Version]
- Leng, J.; Ye, S.; Zhou, M.; Zhao, J.L.; Liu, Q.; Guo, W.; Cao, W.; Fu, L. Blockchain-Secured Smart Manufacturing in Industry 4.0: A Survey. IEEE Trans. Syst. Man Cybern. Syst. 2021, 51, 237–252. [Google Scholar] [CrossRef]
- Raspberry Pi Foundation. Raspberry Pi 3 Model B+ Specification. Available online: https://www.raspberrypi.org/products/raspberry-pi-3-model-b-plus/ (accessed on 17 September 2021).
- IEEE. IEEE Standard for Ethernet; Technical Report; IEEE: Piscataway, NJ, USA, 2018. [Google Scholar] [CrossRef]
- Raspberry Pi Foundation. Raspberry Pi 4 Tech Specs. Available online: https://www.raspberrypi.org/products/raspberry-pi-4-model-b/specifications/ (accessed on 17 September 2021).
- Poulter, A.J.; Johnston, S.J.; Cox, S.J. pySRUP—Simplifying Secure Communications for Command Control in the Internet of Things. In Proceedings of the 2019 IEEE 5th World Forum on Internet of Things (WF-IoT), Limerick, Ireland, 15–18 April 2019; pp. 273–277. [Google Scholar] [CrossRef]
- Mills, D.; Delaware, U.; Kasch, W. Network Time Protocol Version 4: Protocol and Algorithms Specification; Standard RFC 5905; Internet Engineering Task Force: Fremont, CA, USA, 2010; Available online: https://tools.ietf.org/html/rfc5905 (accessed on 17 September 2021).
- Kuznetsov, A.N. Iproute2 Routing Commands and Utilities. Available online: https://man7.org/linux/man-pages/man8/tc.8.html (accessed on 17 September 2021).
- Hombashi, T. Tcconfig: A tc Command Wrapper. Open Source Software. 2020. Available online: https://github.com/thombashi/tcconfig (accessed on 17 September 2021).
- Khatouni, A.S.; Trevisan, M.; Giordano, D. Data-Driven Emulation of Mobile Access Networks. In Proceedings of the 2019 15th International Conference on Network and Service Management (CNSM), Halifax, NS, Canada, 21–25 October 2019; pp. 1–6. [Google Scholar] [CrossRef]
- Trevisan, M. Mobile Network Latency Emulator. Open Source Software. 2019. Available online: https://github.com/marty90/mobile-latency-emulator (accessed on 17 September 2021).
- M2Catalyst LLC. Network Cell Info App. Available online: https://m2catalyst.com/apps/network-cell-info (accessed on 17 September 2021).
- Sultan, A.; Pope, M. Digital Cellular Telecommunications System (Phase 2+) (GSM); Universal Mobile Telecommunications System (UMTS); Network Architecture; Technical Report 3GPP TS 23.002; European Telecommunications Standards Institute: Valbonne, France, 1999. [Google Scholar]
- Schramm, P.; Andreasson, H.; Edholm, C.; Edvardsson, N.; Hook, M.; Javerbring, S.; Muller, F.; Skold, J. Radio interface performance of EDGE, a proposal for enhanced data rates in existing digital cellular systems. In Proceedings of the VTC’98, 48th IEEE Vehicular Technology Conference, Pathway to Global Wireless Revolution (Cat. No.98CH36151), Ottawa, ON, Canada, 21 May 1998; Volume 2, pp. 1064–1068. [Google Scholar] [CrossRef]
- Naper, H.P.; Pope, M. Digital Cellular Telecommunications System (Phase 2+) (GSM); Universal Mobile Telecommunications System (UMTS); General Packet Radio Service (GPRS); Service Description; Stage 2; Technical Report 3GPP TS 23.060; European Telecommunications Standards Institute: Valbonne, France, 1999. [Google Scholar]
- Ghaderi, M.; Boutaba, R. Data Service Performance Analysis in GPRS Systems. In Proceedings of the 2004 IEEE 15th International Symposium on Personal, Indoor and Mobile Radio Communications (IEEE Cat. No.04TH8754), Barcelona, Spain, 5–8 September 2004; Volume 1, pp. 556–560. [Google Scholar] [CrossRef]
- Goyal, P.; Goyal, A. Comparative study of two most popular packet sniffing tools—Tcpdump and Wireshark. In Proceedings of the 2017 9th International Conference on Computational Intelligence and Communication Networks (CICN), Girne, Northern Cyprus, 16–17 September 2017; pp. 77–81. [Google Scholar] [CrossRef]
- Perkel, J.M. Why Jupyter is data scientists’ computational notebook of choice. Nat. News 2018, 563, 145–146. [Google Scholar] [CrossRef] [PubMed] [Green Version]
- Stančin, I.; Jović, A. An overview and comparison of free Python libraries for data mining and big data analysis. In Proceedings of the 2019 42nd International Convention on Information and Communication Technology, Electronics and Microelectronics (MIPRO), Opatija, Croatia, 20–24 May 2019; pp. 977–982. [Google Scholar] [CrossRef]
- Poulter, A.J. Dataset for an Assessment of the Performance of the Secure Remote Update Performance in Simulated Real-World Conditions. 2021. Available online: http://eprints.soton.ac.uk/id/eprint/449089 (accessed on 17 September 2021).
- Zourmand, A.; Kun Hing, A.L.; Wai Hung, C.; AbdulRehman, M. Internet of Things (IoT) using LoRa technology. In Proceedings of the 2019 IEEE International Conference on Automatic Control and Intelligent Systems (I2CACIS), Selangor, Malaysia, 29 June 2019; pp. 324–330. [Google Scholar] [CrossRef]
- Lavric, A.; Petrariu, A.I.; Popa, V. SigFox Communication Protocol: The New Era of IoT? In Proceedings of the 2019 International Conference on Sensing and Instrumentation in IoT Era (ISSI), Lisbon, Portugal, 29–30 August 2019; pp. 1–4. [Google Scholar] [CrossRef]
Publisher’s Note: MDPI stays neutral with regard to jurisdictional claims in published maps and institutional affiliations. |
© 2021 by the authors. Licensee MDPI, Basel, Switzerland. This article is an open access article distributed under the terms and conditions of the Creative Commons Attribution (CC BY) license (https://creativecommons.org/licenses/by/4.0/).