1. Introduction
Behavioral phylogenetics makes it plausible that the common ancestor of
Homo and
Pan genera had a hierarchical social structure [
1,
2,
3,
4,
5]. Paleolithic humans with a foraging lifestyle, however, had a largely egalitarian society, and yet hierarchical structures became again common in the Neolithic period. Today, nonliterate human societies fill the ethological spectrum [
6] from egalitarian to authoritarian and despotic. This nonmonotonic journey U-shaped trajectory along the egalitarian–hierarchical spectrum during human evolution was stressed by Bruce M. Knauft [
1]. Several anthropological explanations [
1] have been constructed for Knauft’s U.
A number of recent papers [
7,
8,
9] have focused on the evolutionary mechanisms that could resolve the apparent Darwinian paradox of the early-stage viability of hierarchical social structures. Since leadership positions provide preferential access to resources, it is not clear why followers would comply in the absence of coercive institutions. One potential answer is group-level selection [
8] aimed at reducing scalar stress while enhancing in-group cooperation. This stream of study reveals some of the driving forces behind the connection between group size and the prevalence of hierarchy. Our work is intended to complement existing evolutionary arguments. In the context of physics, our main emphasis is on formulating an equation of state for the system, grounded in micromotives, as opposed to focusing on the processes that govern the temporal evolution of the system’s state.
Our approach to the study of social organization is based on an agent-based model and uses tools of information theory and statistical mechanics—a practice rooted in the tradition of sociophysics [
10]. Sociophysics typically engages with mathematical tools to elucidate the interplay between variables in social systems. A path towards the mathematical analysis of cross-cultural data is to proceed first by formulating a hypothesis, which might take the form where two given variables are related, either by virtue of their correlation or by some causal influence. Regression analysis from the data could then be used in the attempt to falsify the hypothesis. While an important tool, this method fails to suggest new relations that might appear from a more theory-based approach to model building. Instead, we model the society by considering agents that interact through the exchange of information. In particular, we are interested in the perception of each agent of the social network of its society, taking into account cognitive constraints and social navigation demands. Then, from general principles of information theory, we obtain the probability of the agent’s perceived social network conditioned on the context. By calculating expected values of network node degrees, we obtain order parameters, which indicate whether the network is in an egalitarian-symmetric or hierarchical-broken symmetry state. The context depends on a combination of parameters, which grows with cognitive capacity of the agents and decreases with group size, modulated by environmental pressure. Since social perceptions mediate motivations and hence possible behaviors, we can make predictions about the effect of these variables in the probable forms of social organization and give a scenario for the Knauft’s U-shape.
We built the model to address the U-shaped curve of egalitarianism. In itself, that is not surprising. Any experimental result can be explained by a model built explicitly for that purpose. But the same model permits making predictions about another empirical situation, dealing with the influence of ecology on the expected hierarchy of modern human groups. The theory suggests a form of looking at the available ethnographic data [
11] and allows a new interpretation of observed patterns involving social structure, community size and environment in terms of a competition between cognitive constraints and social navigation demands, which are related to phase transitions. Furthermore, it allows for changes beyond the U-behavior to a zig-zag-like, such as that described in Ref. [
12].
2. Model and Definitions
The central concept in this article is the cognitive representation of the network of social interactions by each agent, the inferred or perceived network and not the actual social network. Each one of the
n political agents of a group has a perceived social network, represented by a graph of
n vertices. For every agent
i, the network is
, where
, if agent
i knows the social relation between agents
j and
k, independently of whether the relation is positive, neutral or negative. If agent
i has no information about this relation, the bond is absent,
. This matrix is symmetric by its very design. For further details we suggest the following references [
13,
14,
15,
16] for models of the real social network with cognitive limitations and social interactions [
17,
18] for an agent-based model of how social stratification can emerge from efficiency demands of collective information processing. Reference [
19] presents an evolutionary model for the emergence of inequity aversion as an adaptation selected from a pool of hierarchical groups. In addition, Refs. [
7,
8,
9] treat other evolutionary approaches. The joint effect of demography and ecology on the emergence of hierarchy has been studied in Ref. [
20]. Takao Terano and collaborators [
15,
16] used agent-based modeling and cognition-limited representations to analyze the emergence of money in terms of symmetry breaking in a doubly structural network representing a fixed social network and a dynamical network of exchangeability of commodities. We consider our paper as one that draws from and complements these earlier investigations.
Holding a particular belief about the network represents a cost to an agent. Our central hypothesis is that the cost can be represented by a function arising from cognitive and social constraints. The cost is built by noting that:
- (1)
The cognitive contribution to the cost increases with the number of memorized social relations
. Then, the simplest form is
- (2)
It is preferable to have first-hand information about the nature of associations of third parties, compared to the cost of relying on indirect information derived from heuristics such as the ‘friend of a friend is a friend’ and its variations. Two agents j and k can be connected by a bond or a path of bonds, through intervening agents, so that their social relation can be estimated. Call the length of the shortest path of bonds joining j and k in the perceived network . It is natural to assume that this lack of direct knowledge implies a social cost, which increases with the length of the shortest path between the agents.
Since
is the adjacency matrix,
is defined by the integer powers
of
(see, e.g., Ref. [
21]):
permit determining the shortest path
Define
, the mean over all pairs
(counted only once)
Both and are functions of , the variables of the problem.
We define the joint cognitive-social cost of the representation as the sum of the cognitive term and the social cost. The purpose of this exercise is not to uncover a ‘true’ form for the function that describes the cost to an agent. Our focus is on understanding the fundamental outcomes of the basic competition between costs rather than a precise identification of a functional form.
To be able to sum such different things, we introduce a parameter
:
The interpretation of the meaning of
comes from the following argument. For fixed values of
and
, as
increases, the relative contribution of the cognitive cost
to the overall cost decreases. It is thus a proxy of the cognitive capacity of an agent. It can be assumed that
can be associated with the mass ratio between the neocortex and rest of the brain [
22,
23,
24] and/or the medial frontal cortex including the anterior cingulate cortex [
25,
26,
27]. The cost is infinite if there is no path between two agents in a perceived social network, so only connected graphs occur.
As this stands, an agent-perceived network is independent of the network of another agent. We now introduce interactions.
- (3)
Many different forms of communication lead to social learning [
28]. We follow ideas from opinion dynamics [
29] and suppose that, through gossiping, agents share information or learn from social partners about coalitions of pairs of other agents, leading to correlated perceived networks. In the simulations, we introduce the possibility of an agent
m copying from an interlocutor
i its link about any other pair (
).
Finally, we make a hypothesis that enters in the interpretation of the results but not in the construction of the model.
- (4)
We suppose that perceptions about social coalitions engender motivations that direct behaviors. We call this the Perceptions Motivate Behaviors (PMB) hypothesis. Hence, there is a correlation between the perceived social network and the real coalitions emerging. We believe that this particular step of our argument should be amenable to experimental verification. It receives support from the finding that in traditional societies, perceived positions in a social hierarchy are important to determine the commanded authority [
30]. Within the PMB hypothesis, when the perceived social network is symmetric, social agents are not inclined to accept inequalities. Attempts to dominate a group, either economically, politically or sexually, would be met with resistance. However, if the symmetry is broken, social agents would not be so reluctant to accept a hierarchical political organization, at least under high rates of information exchange (or gossiping), when the central agent is with high probability the same for most of the agents.
3. The Probability of a Perceived Social Network
The standard methodology of information theory and statistical mechanics, which includes Bayesian and entropic methods, leads to the attribution of a probability to a network , conditioned on available information I.
Consider
the expected value of
under
then the sum is over all
possible configurations of
. Suppose that either the information available is that
has a specific value
or that it has a significantly constant value during a relatively long time or alternatively, it is supposed that the value of
to be
. In the last case, as
is varied, different behaviors will be revealed.
The method of inference by maximum entropy introduces a parameter
. This parameter (or Lagrange multiplier) sets the range of fluctuations of the cost above its minimum value. Semantically, it is analogous to a pressure under which the band lives. Large values above the minimum cost are unlikely for large
but very likely if
is small. This pressure may arise from the ecology or it might model normative or informational peer pressure, from the perception of external threats, or as peer pressure arising from moral standards [
31,
32]. The name ‘pressure’ describes
in the generalized manner used in thermodynamics [
33], in the sense that it is an entropic intensive parameter conjugated to the extensive cost in
. In a simple fluid, the temperature is conjugated to the energy, but here,
is not an energy nor
an inverse temperature.
The procedure calls for the maximization of the information entropy subject to the known constraints [
34]. The entropy can be interpreted as a measure of the ignorance about
. Many probability distributions are compatible with the information constraint in Equation (
6). Therefore, we take the one distribution that is most ignorant while still compatible with the information and the normalization requirement:
The result is the Boltzmann probability distribution
where
, which controls the scale of fluctuations, is the intensive Lagrange multiplier conjugated to the extensive
. The information content in the intensive
is equivalent to that in the extensive
due to Equation (
6) since they are conjugated variables. The partition function
Z depends on the number of agents,
and
,
.
The macroscopic state of the system is characterized by the values of appropriate order parameters, expected values of functions of interest, which we now define. We probe here whether represented agents are considered symmetrically or if distinctions are made. It is useful to consider the degree
of vertex
j in a graph
, the number of agents
k with
:
In addition, we define the maximum degree and the average degree, respectively,
for agent
i. Natural order parameters are the expectation values
and
with respect to
.
We obtain estimates of the order parameters employing simple Metropolis Monte Carlo (MC) methods. We first considered isolated agents and did a MC simulation of the Boltzmann distribution (
9). Calculations of the minimum distance were performed using Dijkstra’s algorithm. Qualitatively equivalent results can be obtained by defining a distance to be infinite if larger than a fixed finite length. Then, we simulate the exchange of information between the agents, which couples the different perceived networks.
At this point a methodological disclaimer is necessary. Our approach can be described as an application of maximum entropy inference, akin to the canonical statistical analysis of physical systems at equilibrium. The appearance of a Boltzmann distribution as a result of our method should not be interpreted as an excessive reliance on physical analogies. Rather, it demonstrates the extensive applicability of this inference technique.
4. Results
The expected values
of the maximum degree and
of the average degree, with respect to the probability distribution
, are used to construct the order parameter
H that signals hierarchical organization:
This is a helpful definition since for large , the symmetry of the perceived networks is broken and for small , representations are symmetric. The factor 2 is included for convenience when comparing with the empirical record. A central result from the simulations is that, given , to a good approximation, H does not depend on and n independently but on the value of the combination , the specific cognitive capacity per dyadic relation.
Our results can be described as follows, see
Figure 1. For a given value of the pressure
, around 10, for sufficiently large specific cognitive capacity
(>1.2),
H is close to zero. The typical perceived network of an agent is a fully connected graph (
Figure 1, lower, on the right), meaning that cognitive costs are low enough and every possible pair of social interactions in the group can be stored. In the full graph, every agent is equal to any other. The representation of the network of social interactions is symmetric, and there is no agent that is seen as a central hub. The dynamics of social changes, a stochastic MC dynamics, is frozen.
Either a smaller cognitive capacity or a larger size of the local social group, leading to intermediate
z values, changes the above full graph picture (
Figure 1, lower, in the center). Now,
H is close to 1. Some bonds have to be absent in order to respect cognitive limits. The representations are still symmetric in a statistical sense, but fluctuations do occur, and a few agents will have a higher number of known social relations than others. The degrees of all vertices are not the same. Now, the dynamics of the perceived social network is not frozen, and different agents may temporarily occupy a more centralized position. To the perceiving agent, the members of its group are statistically equal, but its knowledge of their social connections is not uniform. Unequal roles start to appear in the inferred network, leading to the possibility of a social organization where there are ‘big men’ [
35,
36], and their distinctions might be described as those of first among equals, or rather among statistical equals in this theory.
For low
z, resulting from an even larger number of agents or smaller cognitive capacity, a new regime for the organization of the inferred network emerges (
Figure 1, bottom left), signaled by a larger value of
. The symmetric role of the agents in the representation is broken. One of the represented agents has a special position, likely to be connected to most of the other agents, which in turn are connected almost uniquely to it. The dynamics again is frozen, and an agent crystallizes in a unique central position in the star topology of the inferred social network. Still, different agents have been sampled independently, and the central agents of the perceived networks are with high probability not the same.
Figure 2 shows the phase diagram, obtained by plotting the value of
H in the
space.
Figure 1 was obtained by a horizontal cut of
Figure 2 at
.
5. Correlation of Networks through Gossip
Gossip, though not a standard technical term in statistical mechanics, is employed here to denote the interaction between agents that arises through the exchange of information about interpersonal relationships. The impact of gossip is to create correlations among the perceived social networks of various agents. The three regimes—full graph, intermediate and star—remain unaffected.
We now run the simulation for the n agents together. A parameter g () measures the intensity of information exchange through gossip.
Choose an agent i and a pair , independently of anything else, uniformly at random. A no gossip dynamic step occurs with probability (): a MC Metropolis update is performed on the bond of the pair . Let be the joint cognitive-social cost with the bond replaced by . With probability let the change of by be accepted. Otherwise, is kept fixed. With probability g, another agent l is chosen, also independently and uniformly at random and its corresponding edge is copied to .
The step performed with probability () simulates the update of the social network representation by independent observations, learning new relations and forgetting about previously known relations. The gossip step, done with probability g, simulates the exchange of information where agent l tells and agent i learns or forgets something about the relation of agents j and k. Gossip can be introduced by more elaborate schemes, but this is sufficient for our modeling purposes.
After all i have been considered, a MC step has been completed. The range was divided uniformly into 100 intervals; the range was divided into 200 intervals. The values of n varied from 7 to 15. We run a MC simulation for each fixed n and for each pair of and . –2 × MC steps were run for thermalization, and then data about the order parameters were collected for around MCS. It is usual in studying phase transitions to look at the large n limit of the population, since singularities are only possible in the thermodynamic limit. However, since we are interested in the finite n case, we search for quantitative changes but not for critical exponents nor universality classes.
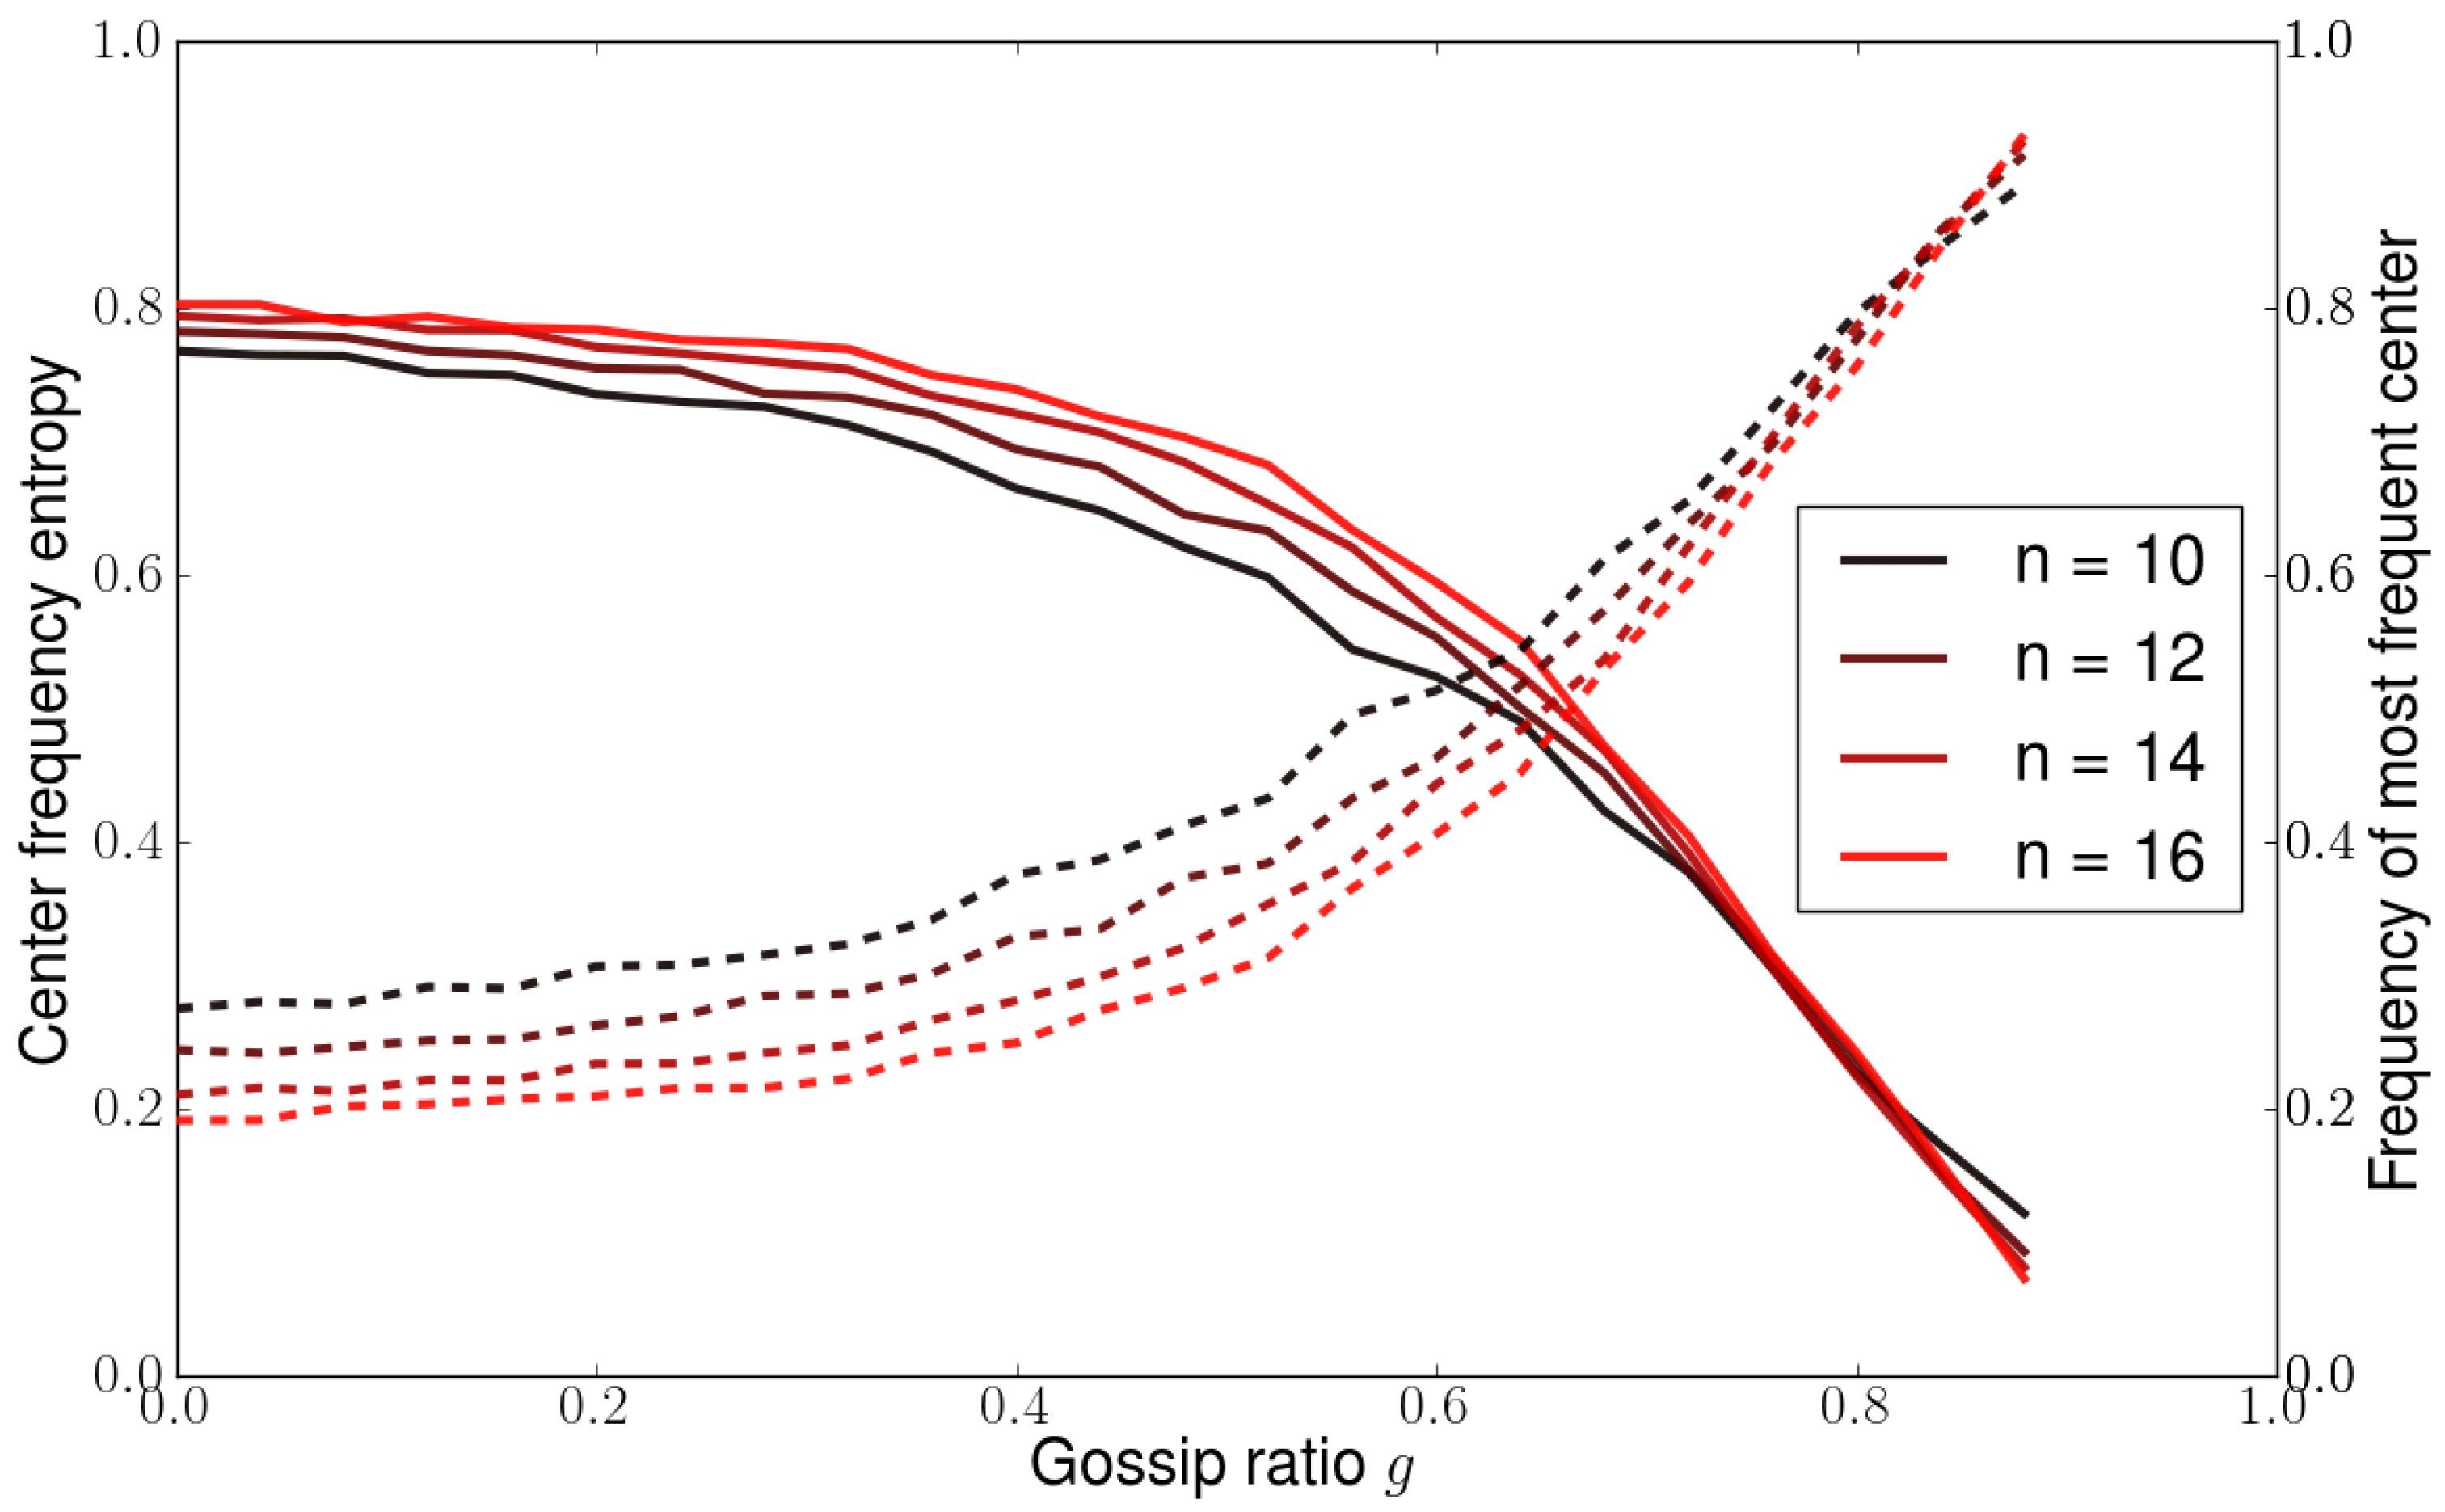
Figure 3 shows how frequent is the most frequent central agent as a function of the level of gossip
g. Let
be the probability that for the social network representation of agent
i, the central element is
j. The spreading of the probability distribution can be measured by the ratio of the average over the population of its entropy to the maximum possible value
:
The results indicate that large correlation occurs when gossip dynamics dominates independent dynamics, starting around
.
Figure 4 shows the acceptance rate for changes under the Metropolis dynamics in the network representations for three different
s. For high pressure, e.g.,
, and in the extreme cases of
z, there is almost no tolerance to changes. In the large-
z regime, upstarts that try to be different are not accepted. This is in accordance with the counter dominant behavior theory [
2,
5,
37]. Perception of equality is hard to change, and this turns inequality unacceptable according to the PMB hypothesis.
In the low-z regime, the central agent is stable. Perceived network, highly correlated due to gossip, are very stable at both extremes of the scaling variable. The intermediate fluid phase decreases with increasing pressure . Agents are only statistically equal and large dynamical fluctuations make the duration of the time intervals during which there is a change in the representational network much smaller than in the extreme egalitarian or hierarchical phases.
6. Knauft’s U-Shape
The broken symmetry phase with the gossip-induced correlations, together with the PMB hypothesis, allows the possibility of appearance of hierarchical social structures.
Since the relevant scaling between and n is through z, for either larger band size for fixed cognitive resources or small enough cognitive resources for a given band size, a fully symmetric representation of the network of social relations becomes impossible and an egalitarian organization of the group becomes unlikely.
A stylized scenario for the non-monotonic change along the hierarchy spectrum (
Figure 5) follows from a historical reconstruction of the dynamics of conditions external to the model. A smaller cognitive capacity (or encephalization) in the evolutionary past of the agents, and hence a smaller
z, is suggestive of hierarchical organization. Along the human lineage after it separates from that leading to chimpanzees and bonobos, there was an increase in the cerebral volume and in the neocortex. The reason for this is not under scrutiny. Whether social navigation, need for cooperative hunting or toolmaking were the sole or joint driving forces, the increase is factual. As cognitive capacity increases (larger
z), the social representation can become a full graph and motivate an egalitarian organization.
On a faster time scale, a growth of the number of members of bands characterizes the Neolithic, bringing back the conditions (small
z) for the symmetry breaking of the representation of the social network under fixed cognitive conditions. Again, the reasons for this growth are totally outside the scope of the present mathematical model, but we can only speculate that technological advances such as food production and storage might be involved [
2,
5,
37].
The possibility of a further change of z on a still shorter time scale, restoring a symmetric representation of society, can occur if the means for processing more information are enhanced, even in the absence of cognitive changes through evolution, but rather through advances such as printing technology or even computer networking. Thus, the model not only suggests a mechanism for the U-shape trajectory but also to conceive further reorganizations of the social network representation and its consequences on social organization due to external conditions changing the balance between computational or cognitive resources and the size of the group.
7. Social Organization: Theoretical Predictions and the Empirical Record
We could end our presentation with the suggestion that the reason for Kanuft’s U is the competition of navigational and cognitive costs. However, the model can be called to deal with a totally different problem. Can a signature of this competition between cognitive and social navigation constraints be seen today for modern humans? A clear theoretical prediction about the dependence of social stratification on ecological pressure and group size (, fixed) can be compared to data from the ethnographic record. The prediction is divided into two parts. First, for very mild climates, that is, small ecological pressure , intermediate social structures are expected. As climates of increasing harshness are considered, different social organizations will occur. Second, this difference depends on group size. Cultures organized in small groups will be more egalitarian, and those in larger groups more hierarchical.
7.1. Theory: Conditional Probabilities and Order Parameters
The phase diagram in the
–
z plane can be thought of as a phase diagram in the
–
n plane if the encephalization, or cognitive capacities, of the agents is fixed (see
Figure 6). To be able to confront with the empirical record, we divided the ranges of
and
z into three regions each: harsh, intermediate and mild climates and ‘small’, ‘medium’ and ‘large’ groups, respectively. The phase diagram is thus divided into nine regions. The regions are chosen essentially so that all points in the
–
z space in the harsh-large region are of the same color (blue). The same is done for the region of harsh–small (all red) and for mild–small and mild–large. The qualitative results are robust to changes in the detailed choices.
A useful choice for the two values needed to separate the three regions are , separating the harsh from the intermediate region and separating the intermediate form the mild region. For , climate c is mild. For , climate c is intermediate, and for , c is harsh.
For
, the borders are set at
and
For
,
small. For
,
intermediate. For
,
large. Then, we consider the mean order parameter
for each region:
where
.
7.2. Ethnographical Data
Data were obtained from the Ethnographic Atlas (EA) [
11] using the Standard Cross Cultural code [
38].
The relevant variables for our study are
s,
h and
c, which stand for size category, hierarchy category and climate category. All variables can take integer values 1, 2 or 3. They are obtained by grouping the EA variables into three groups as shown in
Table 1. There are 248 cultures in Ref. [
11] with information on these three variables.
7.3. Data: Conditional Probabilities and Order Parameters
The categorical values are obtained by grouping the relevant variables of the EA according to Tables given in the
Supplementary Materials as shown in
Table 1, into three categories.
We extract the numbers of cultures
with a given set of values
and the marginal numbers
of cultures with a given pair of values of
independently of
h. These are related by
. The conditional probabilities,
of a culture having a given class stratification, given its climate and group size.
Then, we calculate the average hierarchy of the cultures with the same values of
n and
c, that is, that belong to the same size and climate categories. We calculate the empirical average hierarchies conditional on size and climate:
which satisfies
.
7.4. Theory–Data Comparison
The empirical and theoretical predictions’ order parameters are shown in
Figure 7, left, and
Figure 7, right, respectively. one can The typical bifurcation of a phase transition as different values of climate harshness are considered, occur in both the empirical data and the theoretical results. The qualitative agreement between theory and empirical record supports that our methodology is capable of suggesting new ways of looking at the available ethnographic records, which can now come under scrutiny by the community of quantitative ethnography dealing with cross-cultural studies.
That inequality rises with group size and that there are ecological factors involved has been previously considered [
5,
39,
40,
41,
42], but not how the rise is modulated by ecological pressure nor the hypothesis that this is due to the competition of cognitive and social navigation needs and therefore the influence of climatic pressure on hierarchy can be reversed by demographics. It is not a coincidence that the transition between egalitarian and hierarchical regimes can be presented in the same language as phase transitions and critical phenomena in physical systems.
8. Discussion
Our approach, based on probability, entropic inference and information theory, is a methodological approach typical in the mathematical-physics modeling of systems that incorporates conditioning factors, however, they can be used when the conditioning comes from demographic, ecological, social and cognitive information.
Our main hypothesis is that a social-cognitive cost is relevant to characterize probabilistically the perceived social networks. The introduction of the conjugated parameter
, with the same informational content of the average cost, is an unavoidable theoretical consequence. It controls the size of fluctuations above the minimum possible value of the cost, prompting its interpretation as a generalized pressure. Gossip, a metaphor for information exchange, correlates the perceived networks. The cognitive capacity and the size of the group combine into a variable
z, the specific cognitive capacity, and the perceived social state can be described in a space of just two dimensions
. External to the model, the dynamics of encephalization and band size determine the historical evolution of
z, leading to a scenario for non-monotonic hierarchical change [
1]. Further changes in
z could occur, e.g., due to technological advances, which translate into more effective information processing and better social navigation. In addition, an effective reduction of ecological pressure, following enhanced productivity, can occur. Then, a more egalitarian perception of the social networks will follow. The PMB hypothesis predicts that motivations and behaviors will change, but the theory does not go into the area of predicting how behaviors change, nor what institutions will emerge in order to permit such behaviors, nor the time scales of these changes. Our approach to the transition from hierarchical to egalitarian and back dispenses the issue of whether the hierarchical type of behavior laid dormant (Lars Rodseth in Ref. [
1]) and remained present throughout the Pleistocene or whether the resurgence was due to convergent evolution (e.g., Ref. [
43]). It can be turned on or off by the joint effects of cognitive resources, social demands, ecology and demography. These are similar to ordered–disordered transitions that result from pressure or temperature changes. The possibility of being solid ice is not dormant in water when it is heated up. At least that is not an appropriate metaphor, but it has been used in this context in the humanities.
One can speculate that the time spent in the large
z egalitarian phase promoted conditions for the fixation of altruistic genes and the emergence of the ‘do unto others’ ideas since all are equal under the representation networks. One would not expect the fixation of altruistic behavior, which arises from punishment and collaboration [
44,
45,
46] in other than the symmetric phase, but this should be amenable to model construction and analytic studies.
9. Conclusions
This simple model and the particular function we have used to represent the cognitive-social cost are far from complete. We do not claim specific numerical validation by confrontation with empirical data in any other way than just a qualitative one. More sophisticated forms of coalitions, other than dyadic pairing, should lead to increased richness of the phase diagram, without disrupting the rough overall picture. We have also avoided considering gender issues. Rampant sexual inequalities can exist in an egalitarian organization of males. Nevertheless, if competition between cognitive constraints and social navigation needs indeed occurs, then phase transitions from egalitarian to hierarchical perception follow from general arguments. It has been argued [
47] that ‘in the history of the human species, there is no more significant transition than the emergence and institutionalization of inequality’. We expect that these methods, which unify the theoretical analysis of the empirical findings behind the scenario for the U-shape dynamics and the conditions that influence the transformation of perception of social organization, will stimulate the use of information theory methods in the analysis of empirical research in cross-cultural studies.


