1. Introduction
Many scientific results of modern high-energy physics are obtained by comparing simulated theoretical predictions with experimental data. Tracking detectors provide basic information about charged particles observed in the experiment. Time projection chambers (TPCs) have become commonly accepted tracking detectors in high-energy physics experiments on colliders [
1,
2,
3]. High-precision knowledge of the locations of the sensors in a detector’s global coordinate system is the basis for its high resolution and for obtaining unbiased physical results. Partially, such knowledge can be achieved by optical survey, for example, by laser systems that are used to determine the actual position of the sensors. However, it turns out that the most accurate alignment can be obtained from experimental data by fitting tracks from millions of events and minimizing the amount of their average deviation over all measured track points from the track model, as follows:
where vector
is the position of
ith track hit,
is the point of the expected track trajectory to the closest hit,
is the measurement error, and the bar denotes hit-averaging. By minimizing the sum (
1) for a single track, its best trajectory is found assuming the detector perfect alignment. After finding the parameters of each track, the minimum of Equation (
1) for a set of events can be searched for using the detector alignment settings as variables [
4,
5,
6].
Let
be the real coordinate of the sensor of the experimental setup along some axis, and
is the corresponding coordinate of the track point closest to the sensor. Since the track points are distributed evenly in space around the sensor, the average deviation
should be close to zero and tends to zero with increasing statistics. Let us introduce the distortion
d in
and calculate the difference between values (
1) in case of wrong and real alignments:
The distortion of the sensor coordinate leads to an increase in Equation (
1), for which the minimum value is achieved with the correct alignment of the detector. Inaccurate alignment is passed to the Equation (
1) violating the minimization procedure during the track reconstruction.
This paper studies, using the example of the multipurpose detector (MPD) [
3] at the NICA (Nuclotron-based Ion Collider fAcility) at the Joint Institute for Nuclear Research (JINR, Dubna, Russia) [
7], how Equation (
1) depends on the TPC alignment parameters and evaluates the accuracy of TPC alignment simulated for the detector’s artificial tracks.
2. Time Projection Chamber of the MPD Detector
The TPC of the MPD detector is a detector of charged particles produced by the nuclear–nuclear collisions inside the NICA collider operating at the nucleon-nuclen center-of-mass energy range
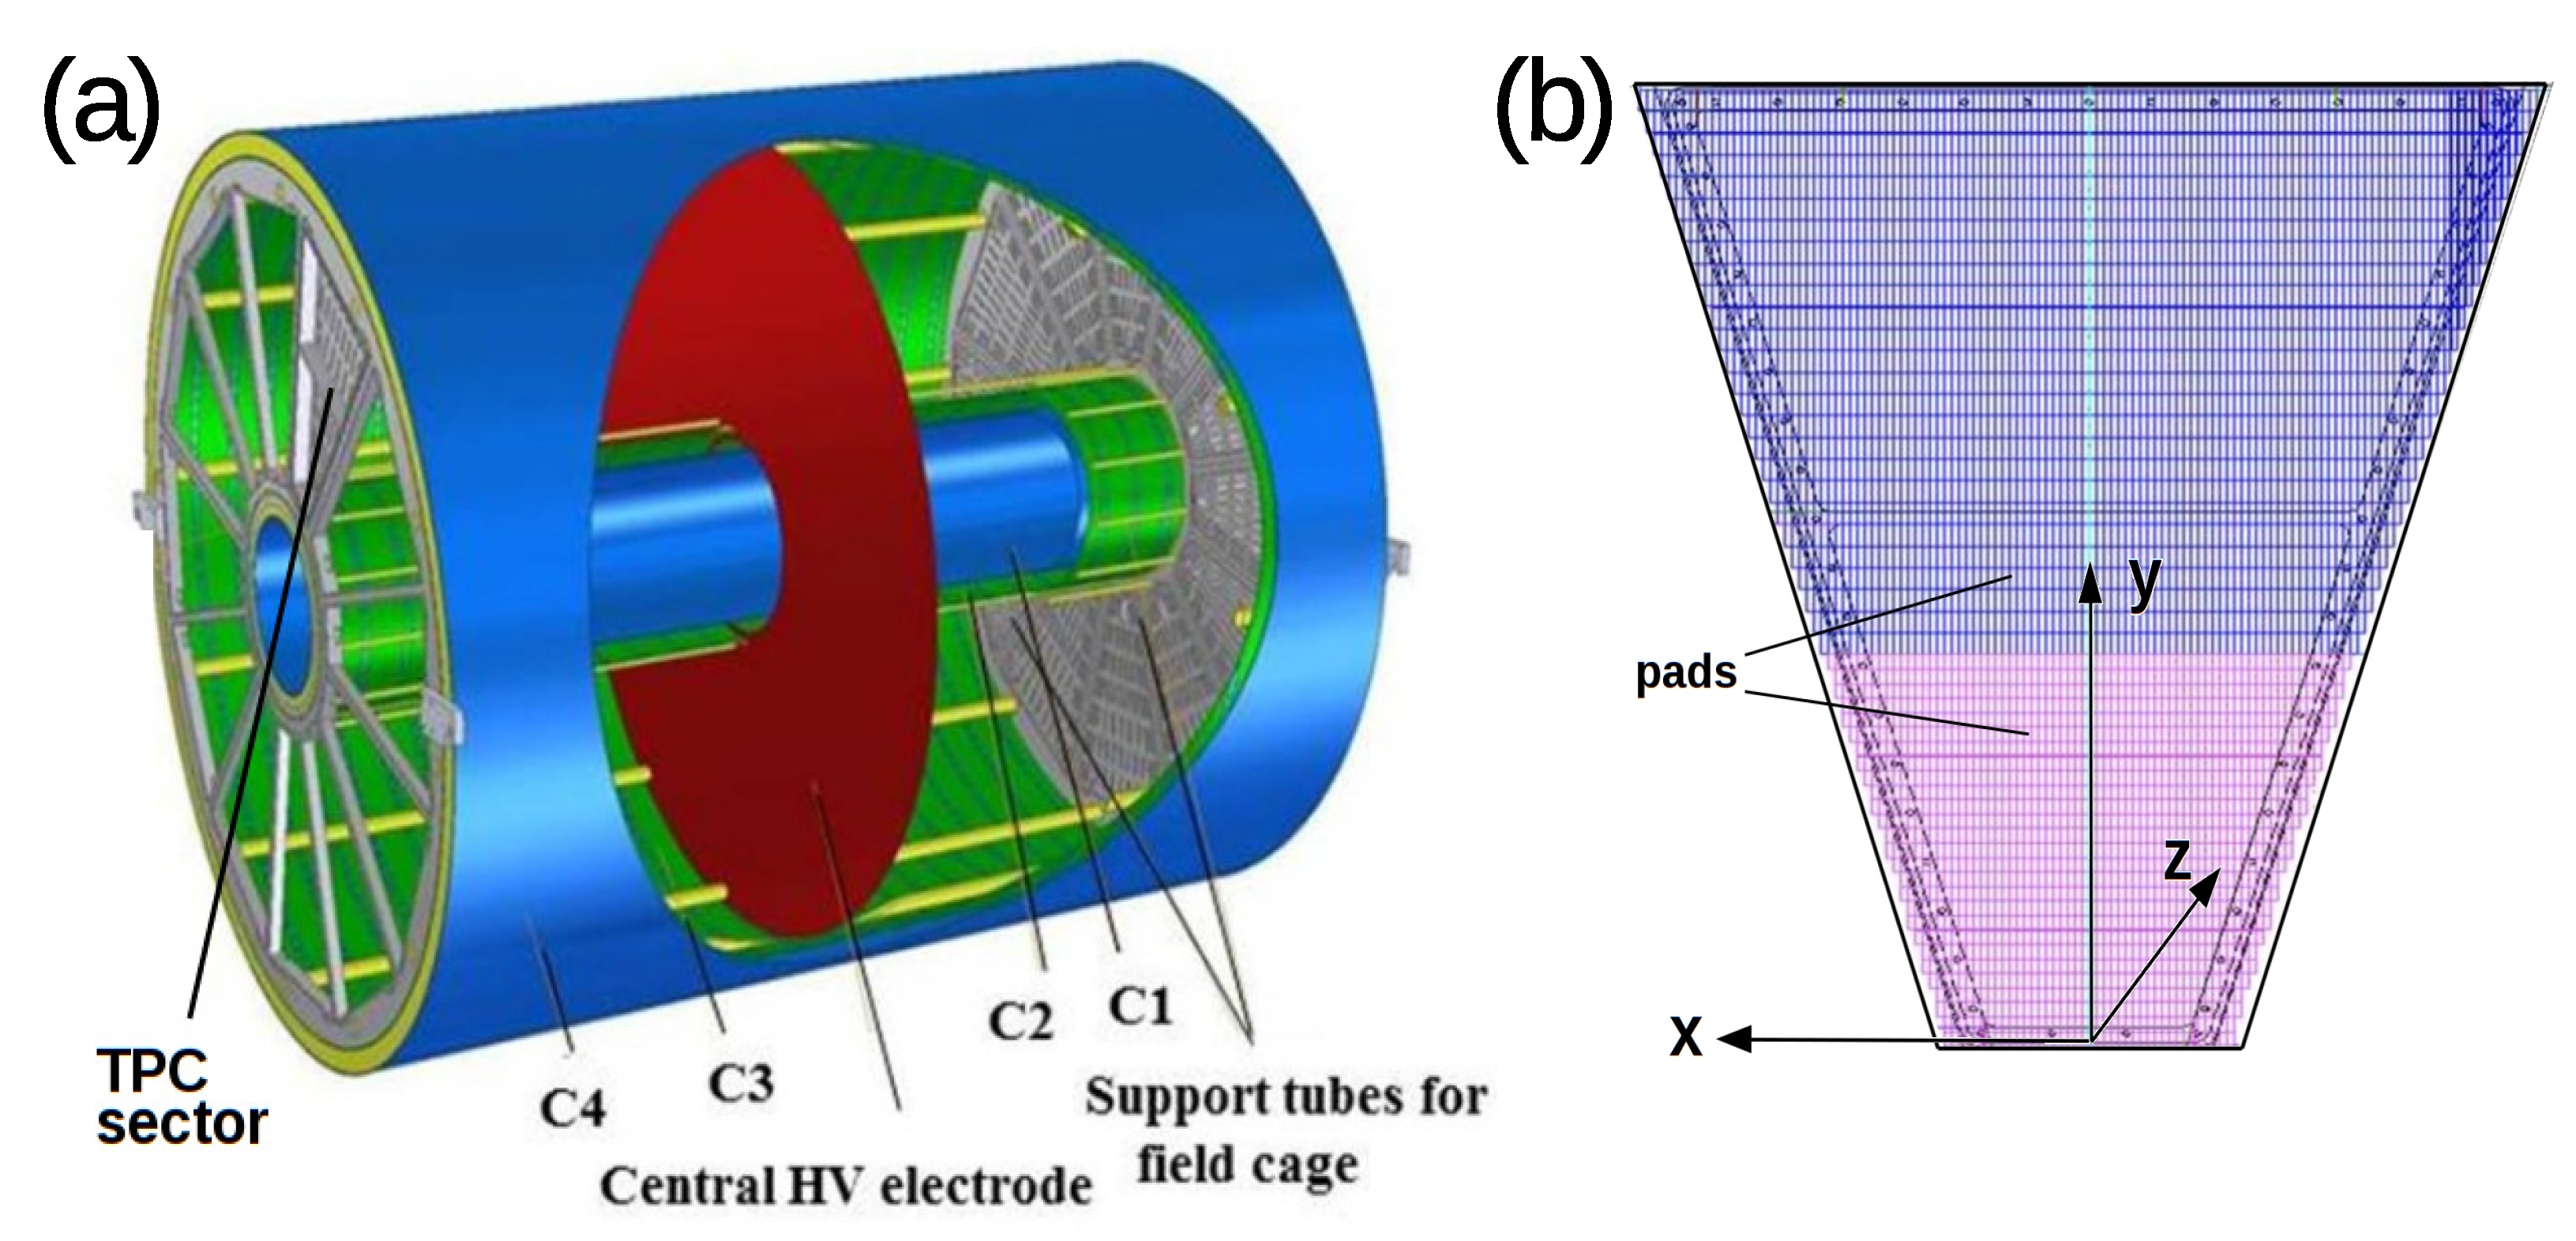
GeV. The TPC is the cylinder divided by the central electrode into two parts; see
Figure 1a. The inner and outer diameters of the chamber are of 54 and 280 cm. The chamber length is of 340 cm. the chamber is filled with a gas mixture of 90% argon and 10% methane at 2 mbar above atmospheric pressure. At the end cap of each chamber, there are 12 readout sectors. The TPC readout system is based on the multi-wire proportional chambers (MWPCs) with a cathode pad readout. The sector contains more than four thousand sensitive elements (pads) that register the drift electrons formed by the track of a charged particle; see
Figure 1b. The pad width is 0.5 cm. The height is 1.2 cm in the narrow part of the sector and 1.8 cm in the wide part. The elements are firmly fixed at the base of the sector, with which the local coordinate system (LCS) of the sector is associated.
The LCS of a sector (
Figure 1b) is the right-hand Cartesian coordinate system. Its origin is in the middle of the small base of the trapezoid of the sector. The
y-axis is directed perpendicular to the base in the interior of the sector. The
z-axis is directed outwards from the chamber.
However, the real position and orientation of the sector in the global coordinate system (GCS) may deflect from the design. Therefore, one needs to introduce an additional coordinate transformation from the real LCS of the sector
s,
, to its theoretical position,
:
Let us consider the base and sensors of the TPC sector as a solid body. The matrix
,
defines the TPC sector orientation in the theoretical LCS, where the airplane angle system—roll (
), yaw (
), and pitch (
)—is chosen for the Euler angles.
The designed plane of the sensitive elements of the sector lies on the end cap of the cylinder. The position and orientation of the theoretical LCS are obtained by turning the GCS of the detector around the cylinder axis (
z-axis of the GCS), then shifting it sequentially along the
z and
y axes. The conversion from
to the GCS,
, is
The vector
and the rotation matrix
are constant, in contrast to similar quantities in Equation (
2), which need to be determined.
3. Finding the Position of TPC Sectors
The sector position and its orientation as a solid body in the GCS of the detector are determined by six parameters in Equation (
2): the three coordinates of the vector
and the three Euler angles,
, and
, which define the matrix
. For each of the 24 sectors of the MPD detector, the vector
is introduced.
The TPC measures the track points in the LCS of the sector. The coordinate of a track hit in the GCS depends on six parameters: . The coordinates of the vector in the alignment problem are called global parameters.
Let
be the track model defined by parameters of
. There are five parameters for a line (absence of a magnetic field) and six parameters for a helix (presence of a magnetic field). The coordinates of the vector
are called local parameters. The position of the point on the track is set by the value
t. For each hit, one finds the distance to the model curve defined by
:
Let us calculate the sum of the distances (
6) divided by the measurement error,
, for each hit of a set of tracks:
As discussed in
Section 1, this amount has its minimum value when using the correct alignment of the device. Thus, the positions of sectors in the GCS of the detector can be found from the condition,
Finding the minimum of a function of 144 + 5 (line) or 144 + 6 (helix) variables (global plus local parameters) requires time-consuming calculations of the Equation (
7). On the other hand, the differential of the Equation (
7) at the minimum point is zero, and one can search for the increments
of vectors
by solving in the first approximation the system of linear equations,
The vector is the value of global alignment parameters during the initial reconstruction of tracks. The coordinates of the vector are local parameters found at the alignment .
4. Simulation of the MPD TPC Response
To study the accuracy of measuring the alignment of the device, the simplified simulation of the MPD TPC response (mini-Monte Carlo (MC)) was created. The conditions of this mini-MC are as follows.
- 1.
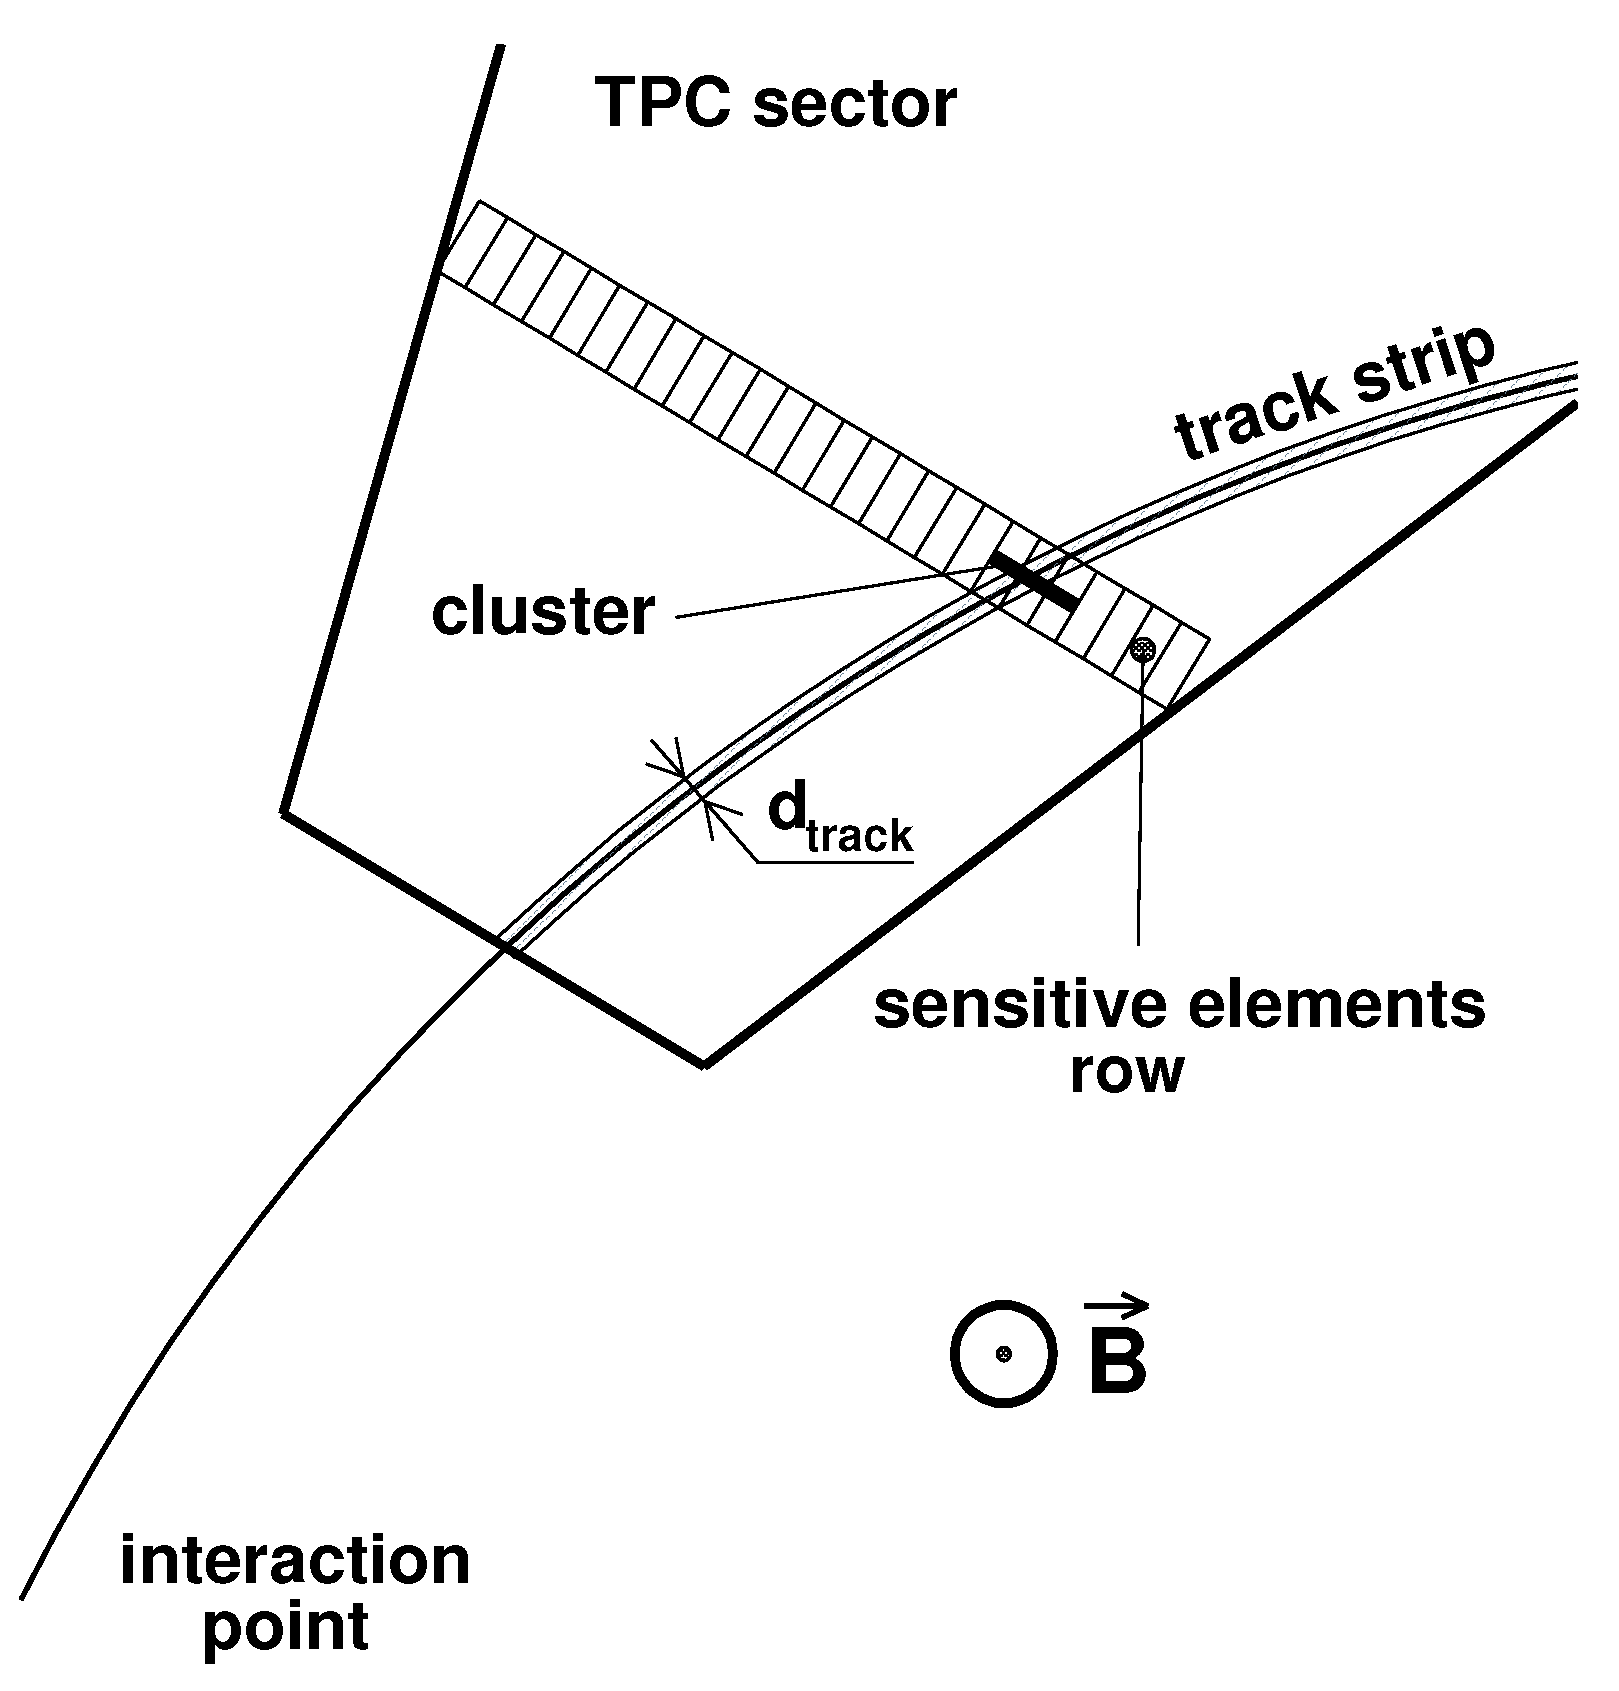
A charged particle leaves a trace of width
on the surface of the sector; see
Figure 2. A width of 8 mm was chosen according to the results of [
8].
- 2.
The center of the strip is the projection of the track along the electric field onto the plane of the sector sensors.
- 3.
The amplitude of the pad signal is proportional to the area of pad coverage by the band and the final value is smeared according to the Gaussian function. The standard deviation value is 10% of the pad signal. The Equation (
7) practically does not change within the standard deviation range of 0–20% of the amplitude.
- 4.
The distance along the electric field from the particle to the pad plane is smeared according to the Gaussian function. The standard deviation is chosen as 1% of the actual distance that is about 2 cm for the farthest track points and corresponds to the accuracy of measurements in the pad plane.
- 5.
Adjacent pads of the same row with a signal above the threshold form a cluster. The local coordinates of the cluster are determined as the weighted sum of the coordinates of individual pads. Using these coordinates, the coordinates of the hit are calculated in the GCS of the detector.
- 6.
The global hits are fitted by the mathematical model of the track (line or helix).
- 7.
According to the results of the track fit, function
and its derivatives are calculated using Equations (
3) and (
4).
The following types of the tracks were modeled:
- 1.
Cosmic muons without a magnetic field in the detector.
On a horizontal surface, the points of its intersection with muons are evenly distributed. The distribution of the zenith angle,
, is
- 2.
Single muons are born at the interaction point in the magnetic field of the detector.
The muon momentum is isotropically distributed in a space and its absolute value is chosen from the condition of uniform distribution of the helix radius in the [80 cm, 160 cm] interval.
- 3.
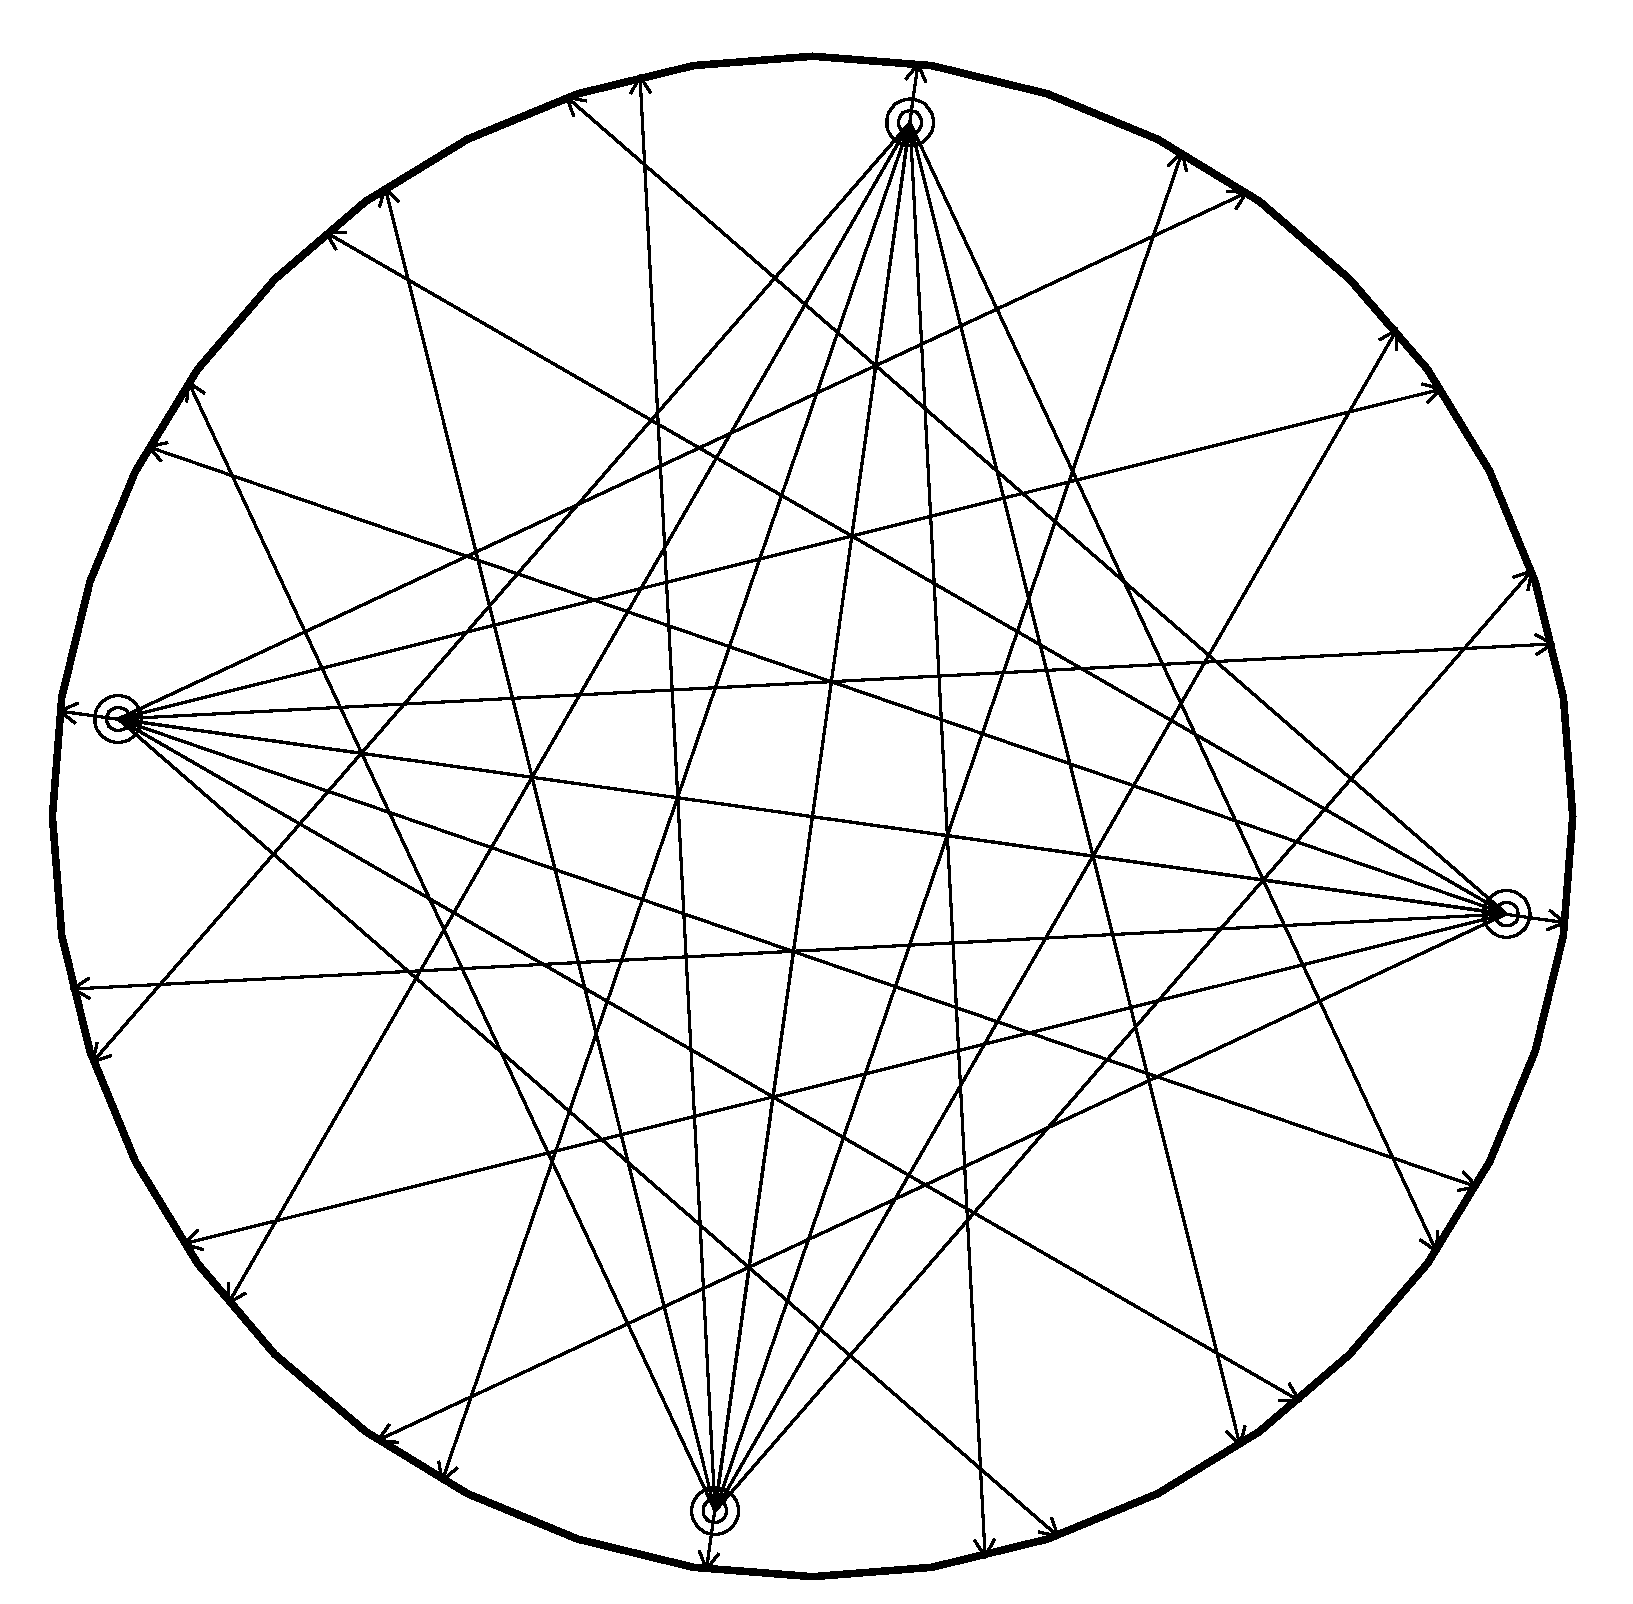
Tracks initiated by the TPC laser system.
This system is designed exclusively for monitoring the properties of TPC gas. In each TPC half, there are four planes perpendicular to the longitudinal axis of the detector, into which laser radiation capable of ionizing the TPC gas is injected. In each plane, four sources emit seven rays each. The tracks of rays cover the areas of all sectors. The diagram of laser beams in these planes is shown in
Figure 3.
5. Study of the Accuracy of the TPC Alignment Calculation
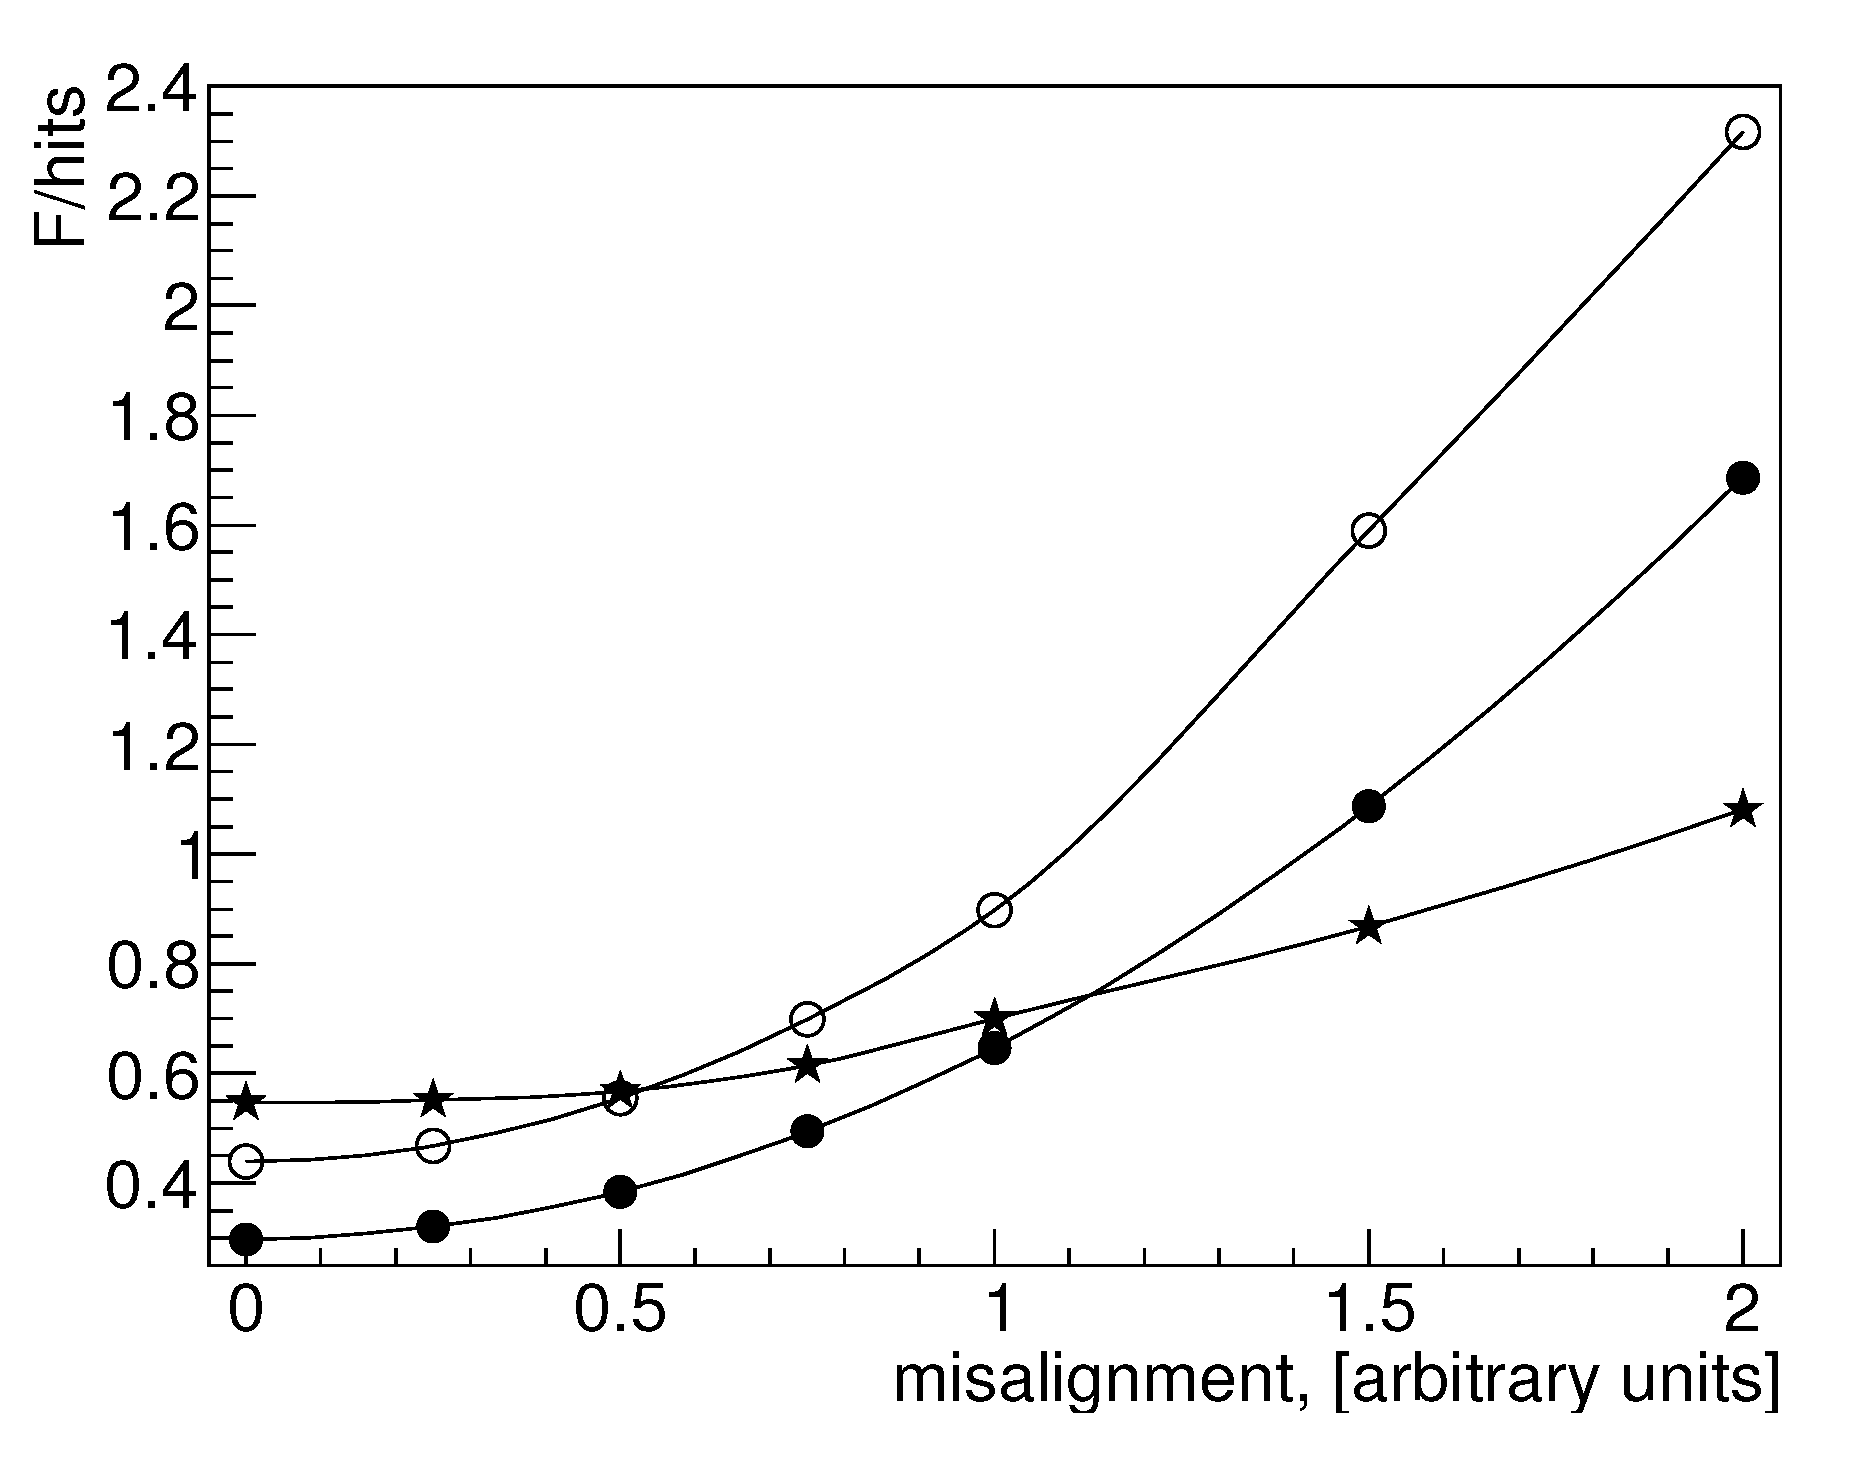
Figure 4 shows the simulation results of the function
for different values of TPC alignment distortion. The pseudo experiment consists of the simulation tracks for alignment with deviations from the theoretical alignment and the reconstruction of tracks using the theoretical alignment. The values
Xs of the misalignment shown in
Figure 4 to be understood as follows. The position of the origin of the local coordinate system of each TPC sector is shifted randomly inside the [−
X cm, +
X cm] interval along each axis. Similarly, each sector rotates additionally around each axis of the theoretical local coordinate system by a random angle evenly distributed in the range of angles [−
X degree, +
X degree]. For this TPC alignment, artificial tracks are generated, the reconstruction of which is performed using the theoretical location of sectors.
The gradient of the function F for muons in a magnetic field is smaller than for cosmic muons or rays of the TPC laser system.
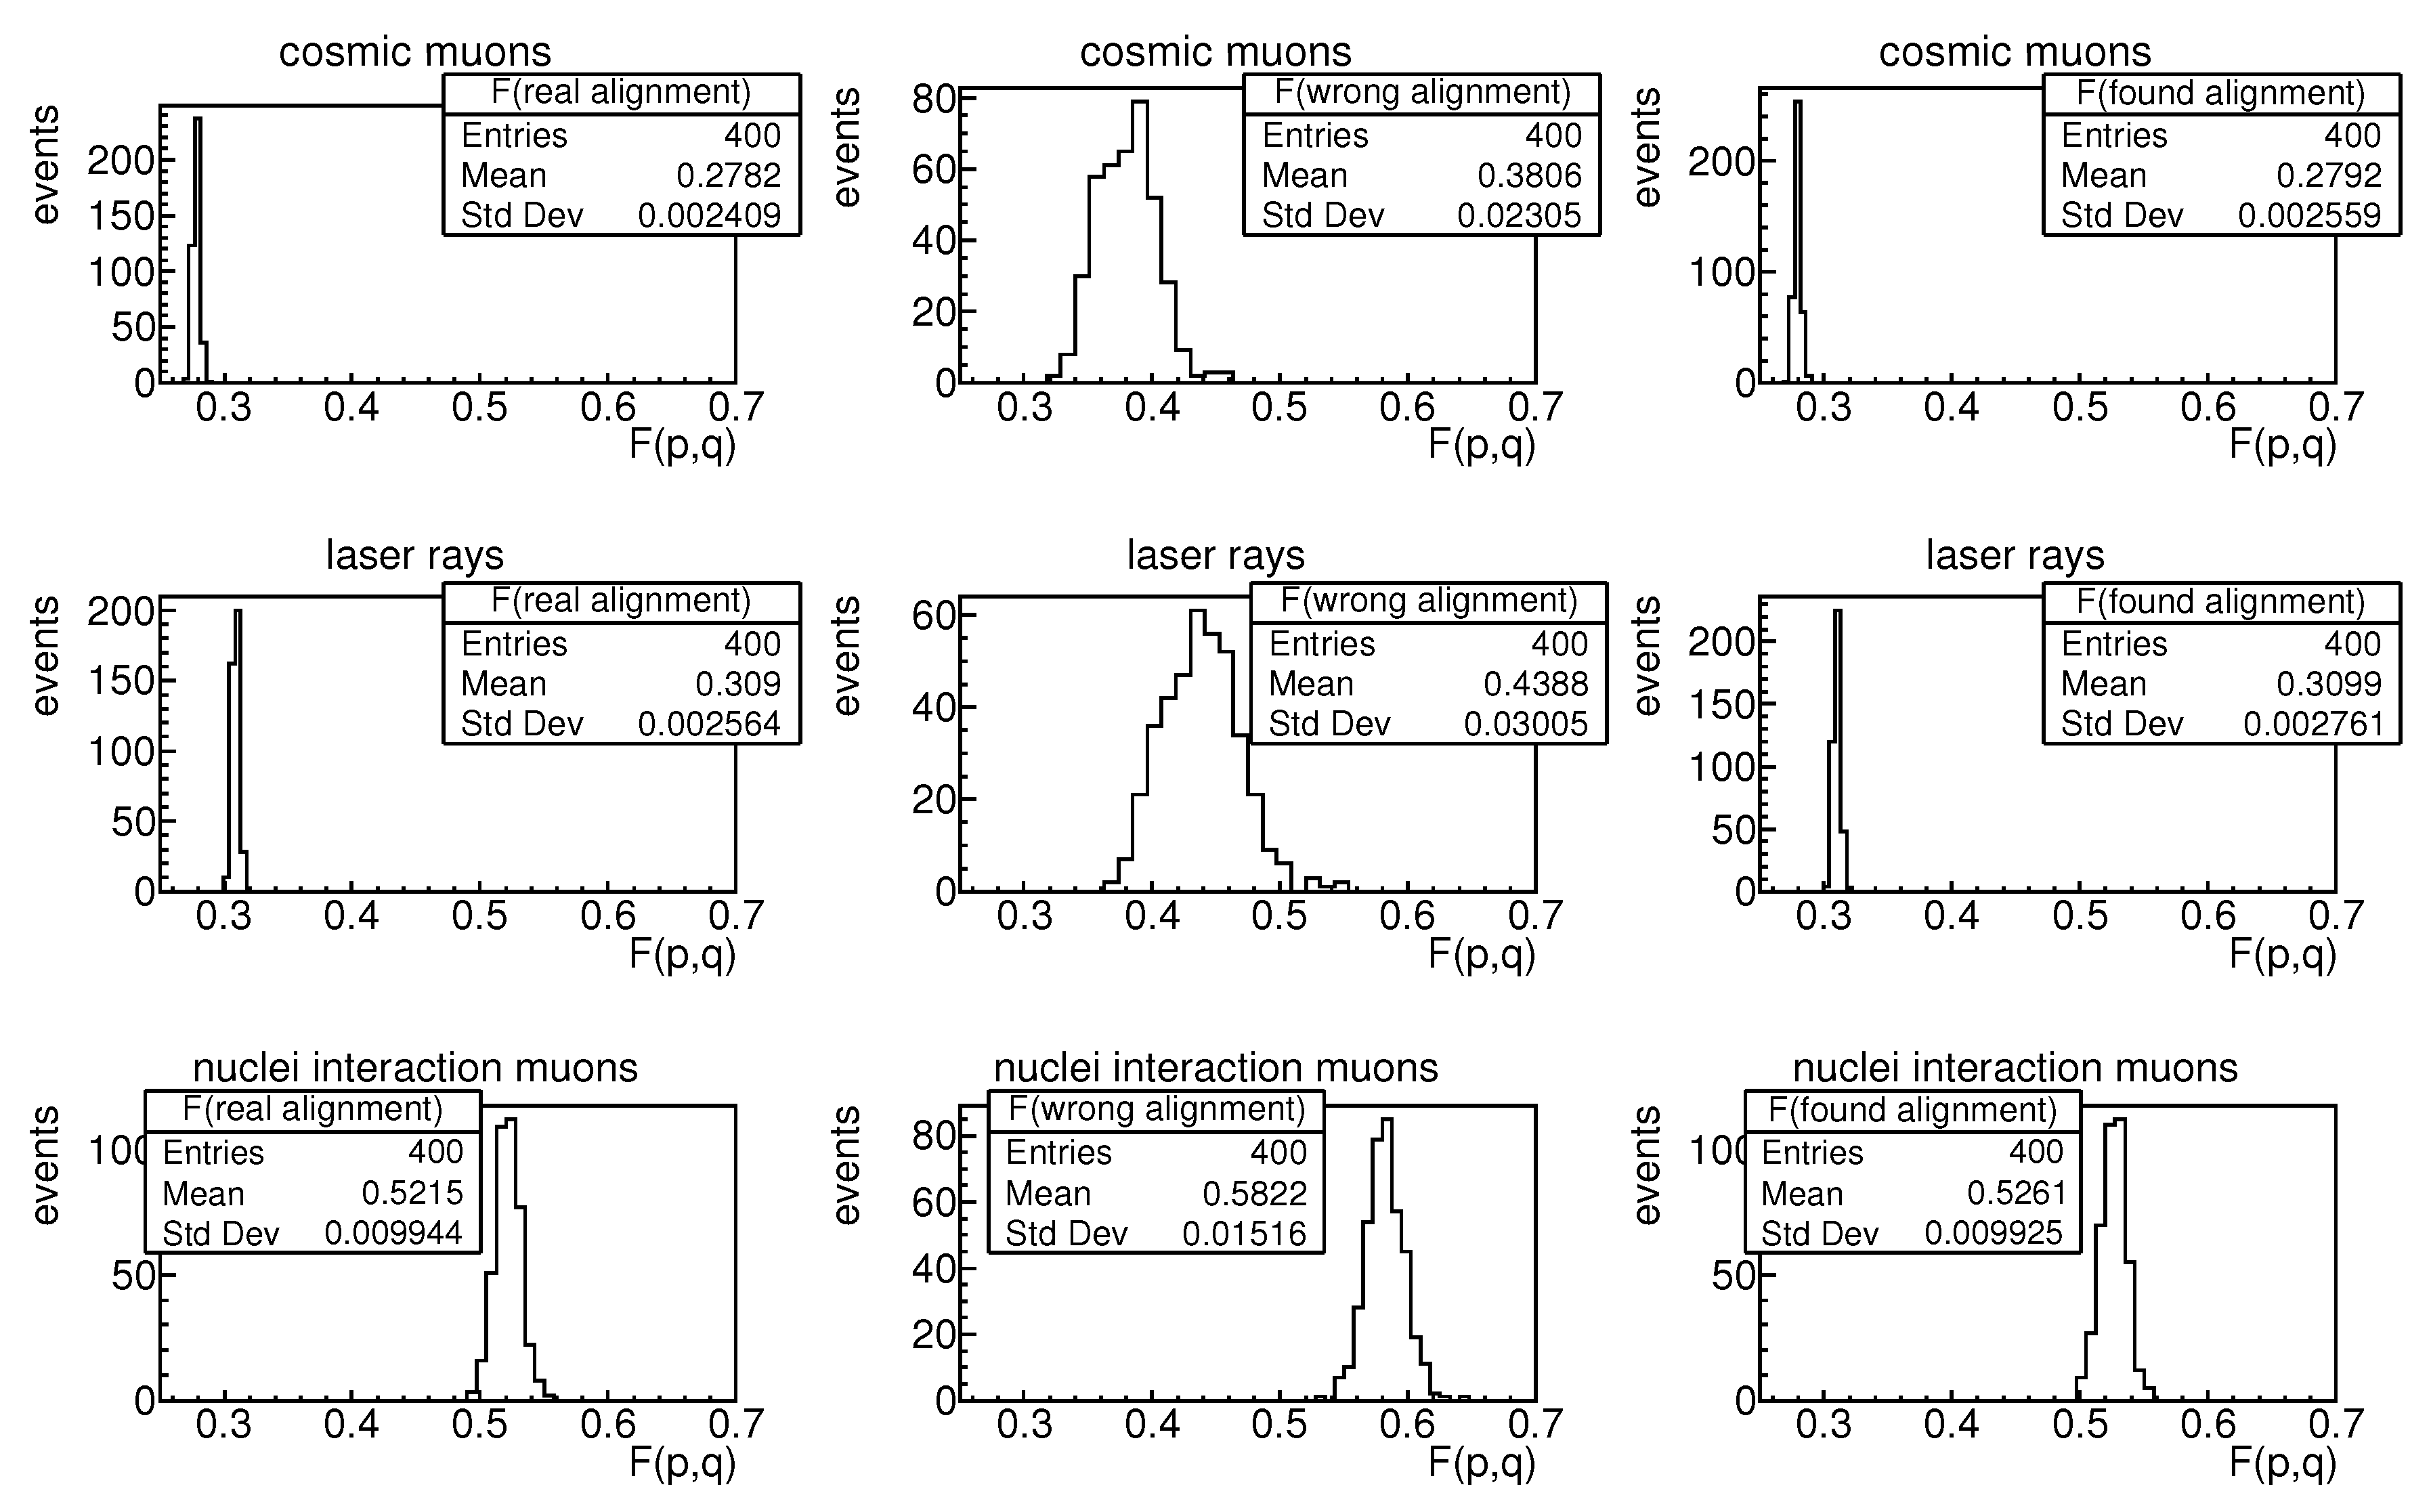
To assess the accuracy of finding the position of the TPC sectors, 400 mini-MC experiments were conducted for each type of track. In each experiment, the shifts along the axes of the origin are in the [−0.5 cm, +0.5 cm] interval, and the angles
, and
are in the [−1 degree, +1 degree] interval. A set of 10,000 tracks was generated for each experiment. The minimization method of the function
F is applied to the simulated sample of track hits to find the real alignment. The simulation results for the above-defined three types of tracks are shown in
Figure 5.
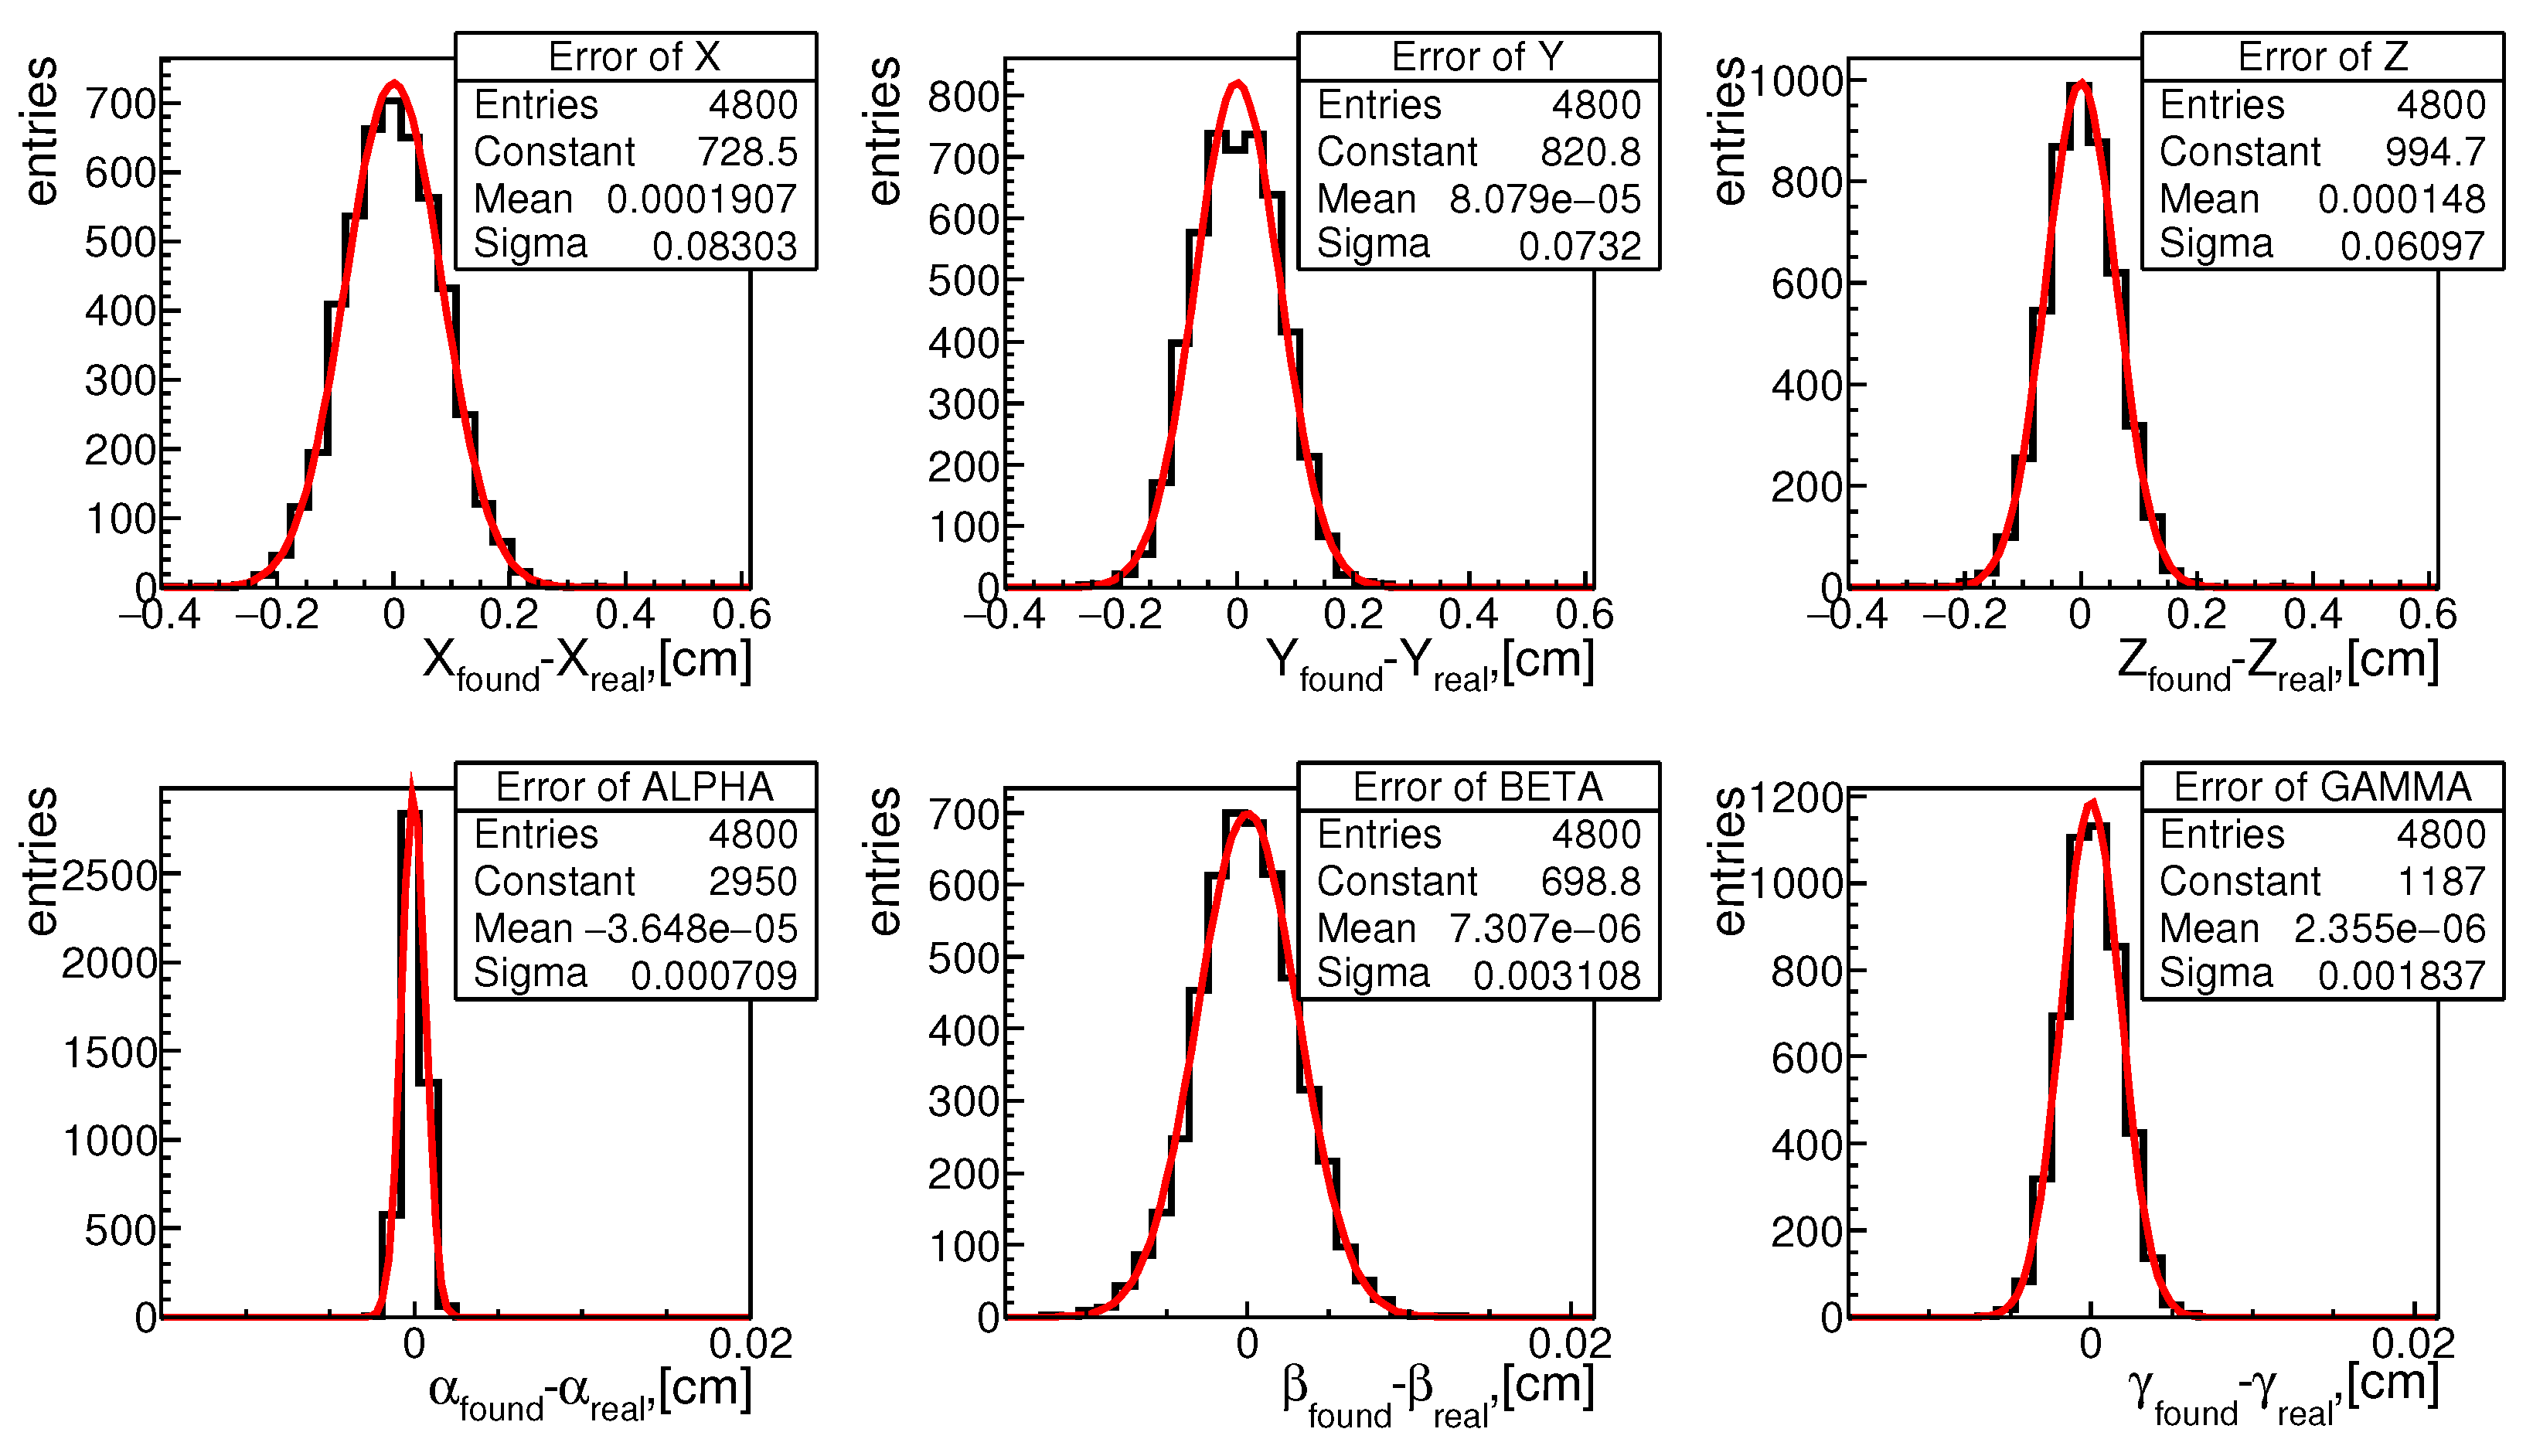
Figure 6 shows the distribution of errors of global sector alignment parameters when calculating them using generated samples of cosmic muons. All distributions have the form of the Gaussian.
ndf (with the “ndf” denoting the number of degrees of freedom) are close to 1, excluding the plot for
Y, which has
ndf close to 3.
Table 1 gives the standard deviations of the measurement errors of the global parameters of the sector. The results of experiments with cosmic and laser beams are similar both in the mean values and in the width of the distributions. The alignment accuracy by laser beams is quite close to the results of cosmic rays and is about 750 microns for shifts and about 7 arc minutes for Euler angles
and
. The accuracy of the angle
is about 2 arc minutes because of the greater sensitivity of the function
F on this angle. The results for muons in the magnetic field of the detector are much worse and differ by several times from the measurements on straight tracks. This difference is a consequence of the flatter shape of the function
F (see
Figure 4). Qualitatively, such behavior of the function
F can be explained if one takes into account that, on average, a straight track crosses more sectors than the track from the interaction point.
The problem of finding the alignment can be determined with accuracy up to the simultaneous shift of all sectors by the same vector or their simultaneous rotation around the axis, which corresponds to the movement of the chamber in space as a single whole. To exclude the accumulation of this type of error during the iterative minimization process in the final solution, the shifts of the global variables were fixed by subtracting their average values from the solution in each iteration.
The system (
9) does not represent an exact condition, while is a first-order relative increment in the global variables. To find the minimum of the function
F, an interactive procedure was used. To terminate, the sufficient condition,
was obtained. Here,
k is the iteration number. Reducing the threshold value does not lead to an increase in the accuracy of finding the minimum. The smoothness of the function
F or the absence of local minima near the global minimum depends on the magnitude of the track statistics used to calculate the alignment. Increasing the statistics from 10,000 tracks to 50,000 does not improve the accuracy of the global TPC alignment parameters.
6. Conclusions
A theoretical basis for the alignment of the time projection camera of the MPD detector has been developed.
The proposed method of calculating global alignment parameters can be applied to any track detector consisting of separate parts with sensitive elements rigidly fixed on them, for example, silicon vertex detectors.
The TPC’s response to charged particles has been simulated within the framework of the computer system of the MPD detector. Using mini-MC simulation data, the track parameters have been reconstructed for three types of tracks: cosmic rays without a magnetic field in the detector, rays of the TPC laser system, and muons born at the interaction point of nuclei in the presence of a magnetic field.
The TPC laser system, designed exclusively for monitoring the properties of the gas in the detector can also be used to monitor the MPD TPC alignment.
The accuracy of the MPD TPC alignment finding has been investigated in MC events with different types of tracks. In the case of cosmic and laser rays, the accuracy is obtained to be about 750 microns for the shift in the sector position and 7 arc minutes for Euler angles. If muons born from the collisions between nuclei are used, the accuracy becomes several times worse.
