Abstract
Ransomware attacks pose a serious threat to global cybersecurity, inflicting severe financial and operational damage on organizations, individuals, and critical infrastructure. Despite their pervasive impact, proactive measures to mitigate ransomware threats remain underdeveloped, with most efforts focused on reactive responses. Moreover, prior literature reveals a significant gap in systematic approaches for predicting such incidents. This research seeks to address this gap by employing time-series analysis to forecast ransomware attacks. Using 1880 ransomware incidents, we decompose the dataset into trend, seasonal, and residual components, fit a time-series model, and forecast future attacks. The results indicate that time-series analysis is useful for uncovering broad, structural patterns in ransomware data. To gain further insight into these results, we perform sub-analyses based on attacks targeting the top five sectors. The findings reveal reasonable predictive performance for ransomware attacks against government facilities and the healthcare and public health sector, with the latter showing an upward trend in attacks. By providing a predictive lens, our model equips organizations with actionable intelligence, enabling preemptive measures and enhanced situational awareness. Finally, this research underscores the importance of integrating time-series forecasting into cybersecurity strategies and seeks to pave the way for future advancements in predictive analytics for cyber threats.
1. Introduction
Ransomware attacks continue to cause significant disruptions for organizations, leading to costly impacts and loss of critical information. For example, the number of ransomware attacks on healthcare organizations more than doubled annually from 2016 to 2021 [1]. Furthermore, the severity of ransomware attacks varies across sectors, with private organizations more likely to experience severe consequences compared with public ones [2]. Cybercriminals are continually evolving their tactics to evade detection and intensify pressure on victims [3].
As ransomware threats show no signs of slowing down, investing in cybersecurity has become a strategic imperative. A survey of 569 cybersecurity leaders found that 91% expect budget increases for technologies such as centralized monitoring, machine learning, artificial intelligence, and next-generation firewalls to enable faster threat detection and response [4]. However, attackers can bypass detection using techniques like packers, crypters, polymorphism, and metamorphism [5], highlighting the need for proactive strategies beyond detection alone.
This study focuses on predicting emerging ransomware threats by analyzing historical attack patterns. Using time-series analysis, we monitor the number of ransomware incidents over time, identify trends, seasonality, and noise, and forecast future threats. This approach enables organizations to allocate security resources effectively and mitigate potential breaches before they occur.
While most prior research has centered on detecting or preventing ransomware, few studies have explored forecasting future incidents using historical time-series data [6]. Existing prediction techniques are often limited to specific ransomware families, narrow attack scopes, and small datasets [7,8,9], reducing the generalizability of results. This study addresses these gaps by applying time-series analysis to a broader range of ransomware strains and technologies, including industry-specific trends.
We use publicly reported ransomware incidents from the Critical Infrastructure Ransomware Attacks (CIRA) dataset covering 2013–2024 to build and test our prediction models. Our contributions include: (1) employing time-series analysis that emphasizes recent data while accounting for trend, seasonality, and noise; (2) providing generalizable results by analyzing a diverse set of ransomware families; and (3) conducting the first industry-specific time-series analysis of ransomware attacks. These findings have practical implications for security teams and decision-makers, offering actionable insights to anticipate threats and optimize resource allocation.
The rest of this paper is organized as follows: Section 2 reviews relevant literature; Section 3 introduces the time-series methodology; Section 4 describes data collection, model development, and performance evaluation; and Section 5 presents the findings, implications, limitations, and future research directions.
2. Research Background and Literature Review
Prior research on ransomware countermeasures can be broadly categorized into detection, prevention, and prediction. Detection approaches focus on identifying malicious behaviors such as abnormal file operations and registry changes [10]. While effective in recognizing known patterns, these methods are challenged by ransomware’s morphing nature and the continual emergence of new variants [6,11]. Prevention techniques, in contrast, emphasize proactive or reactive defenses during an attack [12]. However, because they often rely on manually crafted procedures, they tend to be error-prone and struggle to keep pace with the rapid evolution of ransomware. Finally, ransomware prediction involves anticipating ransomware attacks by monitoring for early signs and identifying the likelihood of ransomware attacks [13].
Prediction methods have gained increasing attention, aiming to anticipate ransomware activity before or during its early stages. Prior works in this space vary in focus. Some target deployment methods (e.g., Hull et al. [14], who used classifiers to identify early warning signs of 18 ransomware families). Others concentrate on financial indicators, such as blockchain analytics, where Akcora et al. [15] and Xu [16] analyzed Bitcoin transactions to forecast ransomware families. A third stream emphasizes behavioral monitoring, as in Jeon et al. [17], who applied deep learning to API call sequences in healthcare IoT, and Rhode et al. [18], who used recurrent neural networks to detect ransomware within seconds of execution. Finally, several studies have applied time-series forecasting to ransomware activity. For example, Quinkert et al. [7] leveraged malicious domain signals but restricted their scope to a single ransomware strain, whereas Albulayhi and Al-Haija [19] adopted neural network regression on annual attack counts without decomposing time-series components such as trend or seasonality. More recent efforts, including Gazzan and Sheldon [9], Mathane and Lakshmi [8], Li [20], and Gogineni et al. [21], have explored context-aware frameworks, supply chain datasets, and deep neural models. Yet, these approaches often remain narrow in scope or lack empirical validation across diverse ransomware families.
In summary, while existing predictive studies have advanced ransomware forecasting, they share two key limitations: (1) reliance on restricted or non-representative datasets, limiting generalizability, and (2) insufficient attention to decomposing ransomware activity into fundamental components (e.g., trend, seasonality, noise), which are essential for understanding long-term patterns. Our study addresses these gaps by leveraging the CIRA global ransomware database and applying time-series analysis to uncover the structural components of ransomware attacks.
3. Time-Series Analysis
Time-series analysis refers to a set of statistical techniques and procedures used to extract information from time-ordered data. In the information security field, time-series analysis has been applied to predict various threats, including software vulnerabilities [22], stages of cyber-intrusions [23], and distributed denial-of-service attacks [24]. While the analysis helps in understanding historical trends, patterns, forecasting future values, and making informed decisions [25], it is not intended to quantify or explain the causal factors behind the behavior of the data. Unlike other statistical models that often treat observations as independent from each other, time-series models account for the temporal dependency of data points and recognize that current values are frequently influenced by their past values [26]. In the context of this study, time-series analysis can help to identify key components of ransomware attacks such as the trend, seasonality, and noise. Specifically, it can identify upward or downward movements in ransomware attacks, fluctuations over fixed periods, fluctuations that exhibit cyclical behavior, and random variations not accounted for by other components [27]. In this study, we focus on the following time-series models fitted to our dataset, namely, seasonal and trend decomposition using LOESS, the autoregressive integrated moving average, and exponential smoothing. It is worth noting that we tested several machine learning models, Long Short-Term Memory (LSTM) and Gated Recurrent Unit (GRU), but they suffered from overfitting, which is probably due to having only 8 years of data.
Seasonal and Trend Decomposition Using LOESS (STL)
STL is a non-parametric smoothing technique which decomposes time-series data into three components: trend (T), seasonal (S), and residuals (noise) (R) [28]. By using locally estimated scatterplot smoothing (LOESS), a regression technique to produce smooth estimates of the three components, STL can extract seasonality and trend, as well as calculate residuals as unexplained variance or random noise in the ransomware data [29]. Specifically, STL iteratively applies LOESS smoothing to refine and improve the estimates of the trend, seasonal, and residuals components of the original time series Y at time t. The flexibility of LOESS smoothing enables it to effectively handle complex time-series data. The decomposition equation can be expressed as follows:
STL can be combined with other methods, such as autoregressive integrated moving average (ARIMA) and exponential smoothing, to leverage the strengths of each method in forecasting [30]. ARIMA is one of the most popular time-series forecasting models, which has been widely applied in research domains such as economics, finance, and healthcare. An ARIMA model uses lagged values and lagged forecast errors to model the data and it is represented as (p, d, q), where p indicates the number of autoregressive terms (AR), d represents the number of differences applied to achieve stationarity, and q denotes the number of moving average (MA) terms. For instance, an ARIMA(1,1,1) model suggests that the number of ransomware attacks at time t is dependent solely on the number of attacks at time t − 1, the data have been differenced twice to achieve stationarity, and that the predicted number of ransomware attacks at time t is based solely on the past prediction errors at time t − 1. Exponential smoothing, on the other hand, is another forecasting technique that assumes that future values are shaped by recent observations; therefore, it uses exponentially weighted averages of past observations and places greater emphasis on more recent data to predict future values [31]. In the context of this study, exponential smoothing would place more weight on recent ransomware attacks than older data points. An exponential smoothing model (ETS) requires three parameters: error (E), trend (T) and seasonality (S), each of which can take one of three values: additive (A), multiplicative (M), or none (N). An ETS model determines whether trend and seasonality are independent of the series’ level or if they scale with the series’ level, leading to variations that grow or shrink proportionally to the overall magnitude [32]. For example, the ETS (A,N,N) model indicates that forecasting ransomware attacks involves an error term, which is added to the previous ransomware observation, with no consideration for trend or seasonal patterns in the data.
By combining STL with ARIMA or exponential smoothing, STL handles non-constant seasonal patterns, while ARIMA or exponential smoothing captures any remaining correlations in the non-seasonal part of the data by independently fitting a model and forecasting the residual component of the decomposed time series [30]. The general form of the STL-ARIMA or STL-ETS forecasting equation is as follows:
where: is the forecasted value of the time series at time t + h, h represents the number of steps into the future that are being predicted, and are the forecasted trend, seasonal, and residual components.
4. Methodology
4.1. Data Collection
We collected data related to ransomware attacks from CIRA. The CIRA dataset is maintained by the cybersecurity in application, research, and education lab at Temple University and contains more than 1800 records of publicly disclosed ransomware incidents [33]. According to CIRA, these incidents are captured from media and security reports between November 2013 and August 2024. For each ransomware incident, CIRA reports the date, the targeted critical infrastructure sector, in addition to other details related to the ransomware strain, duration, and ransomware amount.
In this study, we applied several filtering steps to construct a consistent and analyzable sample. First, we captured the entire ransomware dataset (N = 1898). To ensure an adequate number of incidents for time-series analysis, we removed all incidents (N = 18) reported in 2013, 2014, and 2015. Second, we filtered incidents based on five primary targeted sectors: government facilities, healthcare and public health, educational facilities, information technology, and critical manufacturing. These sectors contained sufficient data for time-series analysis. Finally, we aggregated ransomware incidents by month. We chose monthly aggregation, since daily or weekly aggregation would result in many missing data points. Table 1 summarizes the steps taken in the sample selection process.

Table 1.
Sample construction.
Table 2 presents descriptive statistics of the ransomware dataset, including the date, the number of incidents, and the monthly average. Based on the data, government facilities had the highest number of attacks and the highest average compared with other sectors while critical manufacturing had the lowest total and average. Figure 1 visually depicts the monthly aggregation of all ransomware attacks and for each sector. From the graph, we can see an increase in the number of ransomware attacks during and after the COVID-19 era, which is attributed to a wider attack surface and evolving attack vectors [34]. Nonetheless, based on Figure 1, it is clear that certain industries, such as healthcare and public health, as well as critical manufacturing, have also experienced this increase.
Table 2.
Descriptive statistics of ransomware attacks.
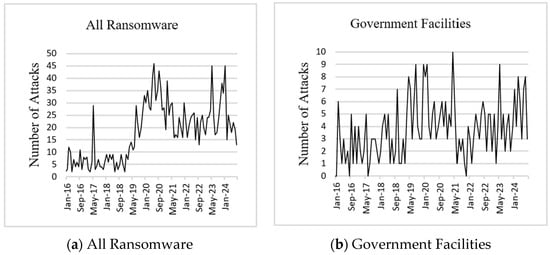
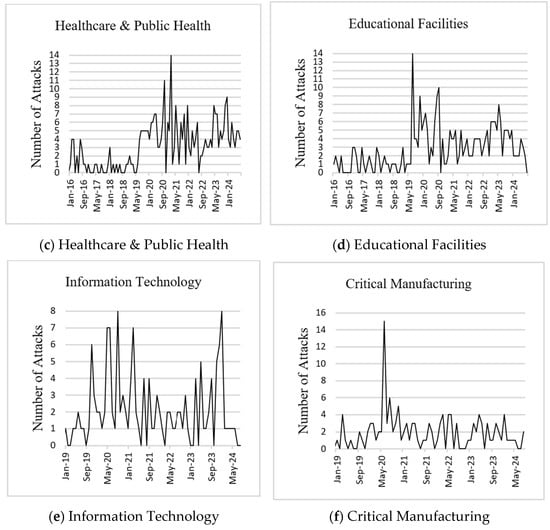
Figure 1.
Ransomware attacks.
4.2. STL Decomposition
We utilized the STLF package in the R statistical software (version 4.4.2) to perform STL decomposition and forecasting. The number of ransomware attacks was used as the dependent variable, whereas monthly periodicity was the independent variable. Each dataset was divided into 80% training set and 20% testing set. The training set was utilized to develop and train the fitted time-series models, while the testing set was employed to evaluate the models’ performances. Moreover, STL decomposition was applied to the training set to extract the trend, seasonal, and noise components. Based on Figure 2, all datasets exhibited a similar increasing trend in ransomware attacks starting in 2019. However, government facilities (Figure 2b) and the healthcare and public health sector (Figure 2d) are the only ones showing a continued increase beginning in 2022, whereas educational facilities (Figure 2c), information technology (Figure 2e), and critical manufacturing (Figure 2f) show a slight decline.
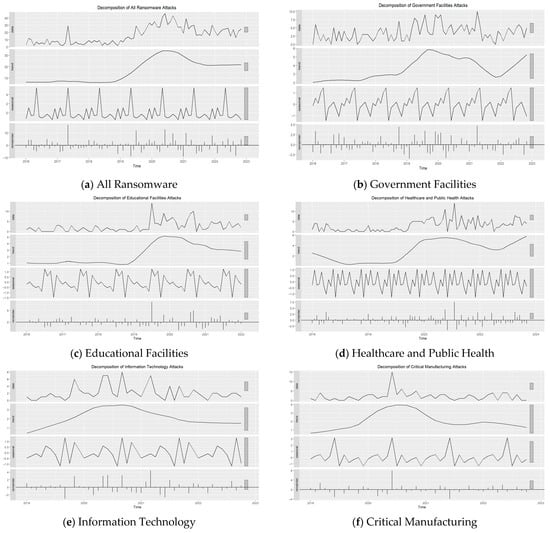
Figure 2.
STL decomposition of ransomware attacks.
To determine the contribution of each time-series component to the overall variability in the data, we calculated the variance and computed the ratio of each component’s variance to the total variance. Based on the results in Table 3, the trend component was the major contributor to the variability in the dataset for all ransomware (73.86%) and healthcare and public health (46.73%), which indicates that the underlying trend is the dominant feature of these time series. The seasonality component, on the other hand, was a minor contributor to the variability across all datasets. Finally, the remainder (noise) component was a major contributor to the datasets for government facilities (57.64%), educational facilities (54.32%), information technology (63.81%), and critical manufacturing attacks (55.44%), suggesting the presence of unexplained noise or irregular patterns in the data.
Table 3.
Percentage of variance explained by time-series components.
4.3. Fitting Time-Series Models
Following STL decomposition, individual time-series models were constructed for each ransomware dataset. To select the optimal model, we compare the normalized Bayesian Information Criterion (BIC) values. Additionally, to ensure that the time-series models meet the required assumptions, we assess stationarity using the Autocorrelation Function (ACF) and the augmented Dickey–Fuller test [35]. Residual diagnostics are also conducted to evaluate model adequacy. Specifically, we use the Ljung–Box test to evaluate the null hypothesis that the residuals are randomly distributed, indicating a good fit [36]. Furthermore, the ACF and the partial autocorrelation function (PACF) plots were examined for each model’s residuals to ensure that there were no significant correlations at any lag. The results confirmed that the residuals were independent, indicating that each model captured the relevant information from the data. Furthermore, based on the Ljung–Box test, all p-values of the fitted models exceeded 0.05, indicating that the models fit the ransomware dataset well. Table 3 presents model statistics along with summary information of the best-fitted models.
Based on the fitted models, as shown in Table 4, our analysis identified STL-ARIMA(0,1,1) as the optimal choice for all ransomware and educational facilities datasets. This model requires first-order differencing to ensure stationarity. In addition, using this model, predicting future ransomware attacks is based on the most recent random fluctuations (errors) in the data and it is not impacted by the past number of attacks. Furthermore, STL-ARIMA(0,1,2) was the best fitted model for healthcare and public health dataset. Similar to the first model, this one also requires first-order differencing. However, predicting future attacks uses the past two forecast errors only and does not use past number of attacks. Furthermore, STL-ETS(A,N,N) was deemed the best model for government facilities, information technology, and critical manufacturing datasets. Predicting future ransomware attacks using this model is based on a weighted average of past values, where more recent observations have a higher influence than older ones. However, since there are no trend or seasonality components, this model assumes that future values will fluctuate around a relatively constant level.
Table 4.
Ransomware prediction models.
Figure 3 represents the actual, fitted, and forecasted values for all datasets along with the 80% and 95% prediction intervals. Each graph shows the number of ransomware attacks over time, with past data on the left and the predicted number of future attacks after the solid vertical line. For all ransomware incidents (Figure 3a), the fitted line smooths the actual data into a gradual rise peaking around 2021, followed by a decline that aligns with historical trends. The forecast projects a continued downward trajectory with minor fluctuations, while the 80% and 95% confidence intervals widen over time, reflecting growing uncertainty, particularly within the broader 95% range. In the government facilities sector (Figure 3b), the fitted line captures a peak in mid-2020 followed by a steady decline. The forecast suggests stabilization with small variations and widening confidence intervals signal increasing uncertainty. For healthcare and public health (Figure 3c), the fitted line shows a peak around mid-2020 and a fluctuating decline consistent with historical patterns. The forecast points to possible stabilization, with progressively widening confidence intervals indicating greater uncertainty in long-term projections. In educational facilities (Figure 3d), the fitted line smooths a sharp mid-2020 peak into a gradual rise and decline, closely following actual data. The forecast anticipates stabilization at lower levels, with confidence intervals expanding to show increasing variability in possible outcomes. For the information technology sector (Figure 3e), multiple peaks between 2019 and 2021 are smoothed into a declining trend. The forecast predicts stabilization with minor fluctuations, while widening intervals highlight increasing uncertainty in future attack numbers.” Finally, in the critical manufacturing sector (Figure 3f), the fitted line follows a notable mid-2020 peak and gradual decline. The forecast indicates a generally stable but fluctuating trend, with widening intervals reflecting greater uncertainty over time.
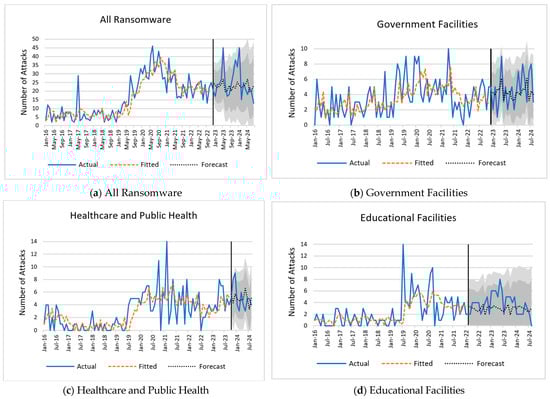
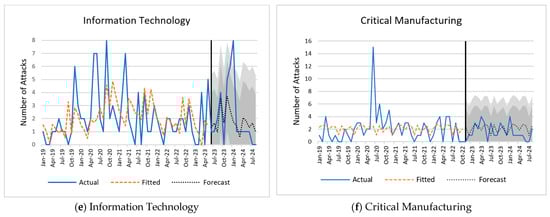
Figure 3.
Fitted time-series models and forecasts.
4.4. Predictive Performance
Using the fitted models, we forecasted the number of monthly ransomware attacks for each dataset. To evaluate the predictive performances of the proposed forecasting models, we used three metrics: Mean Absolute Error (MAE), Root-Mean-Square Error (RMSE), and Symmetric Mean Absolute Percentage Error (SMAPE). MAE measures the average absolute difference between the observed and predicted values. Unlike other performance metrics, MAE does not square the errors, which ensures that all errors are weighted equally [37]. RMSE measures the average difference between the observed and predicted values, however, it gives more weight to large errors due to the squaring of the error terms. Thus, it is more sensitive to observations that are further from the mean compared to MAE. SMAPE averages the percentage deviation between the observed and predicted values, assigns equal weight to overestimations and underestimations, and ensures that the percentage error is between 0% and 200%. The formulas of MAE, RMSE, and SMAPE are as follows:
where is the total number of observations, and and are the observed and predicted values of ransomware attacks at time t, respectively. The reported values of the three metrics are shown in Table 5. Based on the predictive performance of the models, the all-ransomware model was the most accurate (SMAPE = 26.26%), followed by the healthcare and public health model (SMAPE = 33.29%). On the other hand, the prediction models for information technology and critical manufacturing were the least accurate (82.69% and 76.94%, respectively).
Table 5.
Predictive performance of fitted models.
To check robustness, we partitioned the data into 70% training and 30% test sets and re-ran all the analyses. Table 6 shows the best-fitted model for each dataset, as well as SMAPE, MAE, and RMSE. According to the robustness check, the best-fitted model is the same for each dataset. Furthermore, the SMAPE of each model is very close to original results and the MAE and RMSE of both the model fit and accuracy are very close to the original results. These results indicate that the selected forecasting models are robust.
Table 6.
Robustness check of fitted models.
5. Discussion and Implications
Based on the analysis, STL decomposition and time-series modeling proved effective for understanding patterns and trends and predicting future ransomware threats. Our models, built solely on counts of ransomware attacks, successfully captured the overall intensity of cyberattacks, making them a compelling approach for forecasting. However, given the relatively high residual noise in several sectoral models, this result should be viewed as suggestive of long-term structural dynamics rather than a definitive explanation of ransomware activity.
For the all-ransomware model, the decomposed components showed a flat trend. This may indicate that countermeasures by organizations, along with growing public awareness, are slowing the growth of threats. Alternatively, attackers might be shifting to other methods or targets, such as more sophisticated, harder-to-detect techniques [38]. In the healthcare and public health sector, however, the trend is rising, consistent with previous studies [1]. The value of sensitive medical data makes this sector especially attractive to cybercriminals. Thus, prevention should focus on addressing unpatched vulnerabilities through risk-based patch management [39], and on training users to detect phishing and malicious emails [40,41]. Foundational security measures, such as honeypots [42], incident response plans, and regular backup restoration drills, can further strengthen resilience and recovery. In contrast, governmental facilities, educational facilities, information technology, and critical infrastructure showed only minor trend contributions to time-series variability.
No seasonal component was detected, suggesting that ransomware attacks lack a regular monthly pattern. While other reports note more attacks on weekends and holidays [43], the seasonality in our dataset may have been too small relative to noise or nonlinear components. Future research could examine whether daily, weekly, or quarterly patterns reveal seasonality.
Forecasts were effectively fitted for government facilities, healthcare and public health, educational facilities, and critical manufacturing, though accuracy varied. Models for government facilities and healthcare achieved reasonably accurate predictions, enabling strategic resource allocation and improved resilience. In contrast, predictions for educational facilities, information technology, and critical manufacturing were less accurate. One possible reason for the varying accuracy in the prediction models may be due to structural and operational factors. Heavy dependence on third-party vendors can introduce uncontrolled vulnerabilities that vary widely in security posture, whereas the breadth and complexity of a sector’s attack surface, shaped by legacy systems, interconnected devices, and distributed networks, can create irregular and harder-to-predict attack patterns [44]. Furthermore, variations in organizational security maturity, incident-reporting practices, and regulatory oversight further contribute to differences in predictability. These factors manifest differently across sectors. For instance, healthcare and public health are relatively predictable because they maintain standardized IT practices, enforce regulatory compliance, and have established incident reporting mechanisms [45]. Government facilities, on the other hand, exhibit moderate predictability due to structured networks, though third-party vendor dependencies and varying local security practices can introduce variability [46]. However, educational facilities are less predictable because of diverse IT systems, frequent onboarding and offboarding of users, and inconsistent security enforcement across campuses [47]. Similarly, the IT and critical manufacturing sectors are highly unpredictable due to complex, heterogeneous networks, broad attack surfaces, and reliance on legacy or industrial control systems (ICS) that are frequently targeted [48]. These sector-specific characteristics may help to explain why some models produce higher forecast errors than others. Another possible reason is the absence of external variables such as economic conditions. Economic conditions may also influence a sector’s ability to maintain robust security infrastructure [49]. Underfunded sectors often prioritize operational costs over security, making them more vulnerable and more willing to pay ransoms [50]. Future work could incorporate additional external and structural variables into the modeling process to improve predictive accuracy and provide actionable, sector-tailored threat forecasts.
To maximize the utility of the proposed time-series forecasting models, we outline a four-step framework for embedding predictions into operational cybersecurity strategy:
- Forecast Integration and Monitoring: Incorporate updated forecasts (e.g., monthly ransomware incident projections) into security dashboards where automated alerts can be used to flag when predicted attack volumes exceed historical baselines, enabling early situational awareness.
- Risk Prioritization: Compare forecasted trends against the organization’s threat landscape, considering both projected attack volumes and potential business impact. Prioritize sectors, assets, or systems that combine high forecasted activity with high criticality, ensuring that limited resources are allocated to the most consequential risks.
- Resource Allocation and Mitigation: Align staffing, budget, and technical defenses with predicted demand. For instance, scale up incident response capacity ahead of forecasted peaks, intensify patching cycles for at-risk systems, or pre-position backup and recovery resources where threat levels are expected to rise.
- Evaluation and Feedback Loop: Measure actual attack occurrences against forecasted values to assess predictive accuracy. These results can be fed back into the time-series models to continuously improve accuracy and responsiveness. This ensures the forecasting system evolves with the threat landscape rather than remaining static.
Finally, the proposed forecasting model aligns with NIST’s Cybersecurity Framework (CSF) by strengthening the Identify and Protect functions through the early detection of emerging ransomware trends and high-risk sectors [51]. By integrating these predictive capabilities into CSF implementation, it enables organizations to shift from reactive to proactive cybersecurity management.
This study contributes to both theory and practice. Theoretically, it extends the cybersecurity literature by focusing on proactive methods, as most prior research emphasizes reactive measures [49]. We identify critical time-series components of ransomware incidents and introduce models capable of forecasting future threats. By demonstrating that ransomware can be anticipated through trends, we offer a systematic approach to signaling impending attacks. This addresses the call by Razaulla et al. [6] for improved ransomware defenses. To our knowledge, this is the first study to apply STL decomposition and time-series analysis to publicly disclosed ransomware incidents.
Our results suggest four key implications. First, organizations should monitor ransomware trends to guide proactive risk management. For example, anticipating months with higher attack likelihood can improve preparedness. Healthcare and public health organizations, in particular, should strengthen security protocols, tools, and training to counter the upward trend. Second, our models can help to prioritize security investments and allocate resources efficiently. Third, because we used publicly available data, practitioners can replicate the models and monitor attack patterns over time. Fourth, the findings can inform policymakers in developing sector-specific regulations and guidelines to protect critical infrastructure.
Limitations and Future Research
We acknowledge several limitations in this study which provide ample opportunities for further research. Firstly, the data collected were restricted to the CIRA database, which contains only publicly reported ransomware attacks. Therefore, the generalizability of the findings could be limited given the voluntary nature of reporting ransomware threats. Future studies may benefit from the upcoming changes to the Cybersecurity and Infrastructure Security Agency’s (CISA’s) reporting requirements, which mandate certain sectors and organizations to report ransomware incidents [52]. Additionally, future work may benefit from obtaining incident data from private cybersecurity companies and threat intelligence firms that offer subscription-based services. Secondly, our analysis was limited to a single independent variable, namely the monthly number of ransomware attacks, without considering other factors that may affect the predicative accuracy of the models. This is a limitation of ARIMA and exponential smoothing methods. Future research could benefit from using causal models or Autoregressive Integrated Moving Average with Exogenous Inputs (ARIMAX), which extends the traditional ARIMA model by incorporating multiple independent variables. Inputs variables that measure economic factors such as unemployment rate or variables that consider geopolitical factors such as sanctions or political tensions might help in predicting the number of ransomware attacks more accurately. Thirdly, the subanalyses were limited to the top five sectors with the highest number of ransomware attacks. While the dataset included other important sectors, they were excluded due to the low number of observations. As the CIRA database is continuously being updated, we anticipate that future research could examine additional sectors when more data becomes available.
Building on the findings of this study, subsequent research could explore whether external factors such as geopolitical events, economic factors, or industry-specific threats could increase the predictive accuracy of the forecasting models. Furthermore, prospective research can perhaps focus on building predictive model for specific ransomware types (e.g., Ransomware-as-a-Service (RaaS), ransomware families, or ransomware attack techniques (e.g., double extortion). Finally, subsequent studies could explore the use of hybrid models that combine traditional time-series methods with artificial intelligence techniques, such as deep learning, to improve the accuracy of ransomware attack predictions.
Author Contributions
Conceptualization, Y.R.; Data curation, Y.R.; Formal analysis, Y.F.R.; Writing—original draft, Y.R. and Y.F.R. All authors have read and agreed to the published version of the manuscript.
Funding
This research received no external funding.
Data Availability Statement
Data is available on request.
Conflicts of Interest
The authors declare no conflicts of interest.
Abbreviations
The following abbreviations are used in this manuscript:
| ARIMA | Autoregressive Integrated Moving Average |
| CIRA | Critical Infrastructure Ransomware Attacks |
| ETS | Exponential Smoothing Model |
| STL | Seasonal and Trend Decomposition using LOESS |
References
- Neprash, H.T.; McGlave, C.C.; Cross, D.A.; Virnig, B.A.; Puskarich, M.A.; Huling, J.D.; Rozenshtein, A.Z.; Nikpay, S.S. Trends in ransomware attacks on US hospitals, clinics, and other health care delivery organizations 2016–2021. JAMA Health Forum 2022, 3, e224873. [Google Scholar] [CrossRef] [PubMed]
- Yuryna Connolly, L.; Wall, D.S.; Lang, M.; Oddson, B. An empirical study of ransomware attacks on organizations: An assessment of severity and salient factors affecting vulnerability. J. Cybersecur. 2020, 6, tyaa023. [Google Scholar] [CrossRef]
- Humayun, M.; Jhanjhi, N.Z.; Alsayat, A.; Ponnusamy, V. Internet of things and ransomware: Evolution, mitigation and prevention. Egypt. Inform. J. 2021, 22, 105–117. [Google Scholar] [CrossRef]
- Fortinet. The 2023 Global Ransomware Report. 2023. Available online: https://www.fortinet.com/content/dam/fortinet/assets/reports/report-2023-ransomware-global-research.pdf (accessed on 12 January 2025).
- Geng, J.; Wang, J.; Fang, Z.; Zhou, Y.; Wu, D.; Ge, W. A Survey of strategy-driven evasion methods for PE malware: Transformation, concealment, and attack. Comput. Secur. 2024, 137, 103595. [Google Scholar] [CrossRef]
- Razaulla, S.; Fachkha, C.; Markarian, C.; Gawanmeh, A.; Mansoor, W.; Fung, B.C.; Assi, C. The age of ransomware: A survey on the evolution, taxonomy, and research directions. IEEE Access 2023, 11, 40698–40723. [Google Scholar] [CrossRef]
- Quinkert, F.; Holz, T.; Hossain, K.S.M.; Ferrara, E.; Lerman, K. Raptor: Ransomware attack predictor. arXiv 2018, arXiv:1803.01598. [Google Scholar] [CrossRef]
- Mathane, V.; Lakshmi, P.V. Predictive analysis of ransomware attacks using context-aware AI in IoT systems. Int. J. Adv. Comput. Sci. Appl. 2021, 12, 240–244. [Google Scholar] [CrossRef]
- Gazzan, M.; Sheldon, F.T. Opportunities for early detection and prediction of ransomware attacks against industrial control systems. Future Internet 2023, 15, 144. [Google Scholar] [CrossRef]
- Begovic, K.; Al-Ali, A.; Malluhi, Q. Cryptographic ransomware encryption detection: Survey. Comput. Secur. 2023, 132, 103349. [Google Scholar] [CrossRef]
- Beaman, C.; Barkworth, A.; Akande, T.D.; Hakak, S.; Khan, M.K. Ransomware: Recent advances, analysis, challenges and future research directions. Comput. Secur. 2021, 111, 102490. [Google Scholar] [CrossRef] [PubMed]
- McIntosh, T.; Kayes, A.S.M.; Chen, Y.P.P.; Ng, A.; Watters, P. Ransomware mitigation in the modern era: A comprehensive review, research challenges, and future directions. ACM Comput. Surv. 2021, 54, 1–36. [Google Scholar] [CrossRef]
- Lanza, C.; Lahmadi, A.; François, J. Ransomware Analysis: Knowledge Extraction and Classification for Advanced Cyber Threat Intelligence; CRC Press: Boca Raton, FL, USA, 2024. [Google Scholar]
- Hull, G.; John, H.; Arief, B. Ransomware deployment methods and analysis: Views from a predictive model and human responses. Crime Sci. 2019, 8, 1–22. [Google Scholar] [CrossRef]
- Akcora, C.G.; Li, Y.; Gel, Y.R.; Kantarcioglu, M. Bitcoinheist: Topological data analysis for ransomware detection on the bitcoin blockchain. arXiv 2019, arXiv:1906.07852. [Google Scholar] [CrossRef]
- Xu, S. The application of machine learning in Bitcoin ransomware family prediction. In Proceedings of the 2021 5th International Conference on Information System and Data Mining, New York, NY, USA, 27–29 May 2021; pp. 21–27. [Google Scholar]
- Jeon, J.; Baek, S.; Jeong, B.; Jeong, Y.S. Early prediction of ransomware API calls behaviour based on GRU-TCN in healthcare IoT. Connect. Sci. 2023, 35, 2233716. [Google Scholar] [CrossRef]
- Rhode, M.; Burnap, P.; Jones, K. Early-stage malware prediction using recurrent neural networks. Comput. Secur. 2018, 77, 578–594. [Google Scholar] [CrossRef]
- Albulayhi, K.; Al-Haija, Q.A. Early-stage malware and ransomware forecasting in the short-term future using regression-based neural network technique. In Proceedings of the 2022 14th International Conference on Computational Intelligence and Communication Networks (CICN), Al-Khobar, Saudi Arabia, 4–6 December 2022; pp. 735–742. [Google Scholar]
- Li, S. Comparative Analysis of Predicting Malware Attack Trends in Cyber Supply Chain Using Multiple Classification Models. IEEE Access 2024. [Google Scholar] [CrossRef]
- Gogineni, K.; Derasari, P.; Venkataramani, G. Foreseer: Efficiently forecasting malware event series with long short-term memory. In Proceedings of the 2022 IEEE International Symposium on Secure and Private Execution Environment Design (SEED), Storrs, CT, USA, 26–27 September 2022; pp. 97–108. [Google Scholar]
- Roumani, Y.; Nwankpa, J.K.; Roumani, Y.F. Time series modeling of vulnerabilities. Comput. Secur. 2015, 51, 32–40. [Google Scholar] [CrossRef]
- Rege, A.; Obradovic, Z.; Asadi, N.; Parker, E.; Pandit, R.; Masceri, N.; Singer, B. Predicting adversarial cyber-intrusion stages using autoregressive neural networks. IEEE Intell. Syst. 2018, 33, 29–39. [Google Scholar] [CrossRef]
- Falowo, O.I.; Abdo, J.B. 2019–2023 in Review: Projecting DDoS Threats with ARIMA and ETS Forecasting Techniques. IEEE Access 2024, 12, 26759–26772. [Google Scholar] [CrossRef]
- Box, G.E.; Jenkins, G.M.; Reinsel, G.C.; Ljung, G.M. Time Series Analysis: Forecasting and Control; John Wiley & Sons: Hoboken, NJ, USA, 2015. [Google Scholar]
- Chatfield, C. The Analysis of Time Series: Theory and Practice; Springer: Berlin/Heidelberg, Germany, 2013. [Google Scholar]
- Yaffee, R.A.; McGee, M. An Introduction to Time Series Analysis and Forecasting: With Applications of SAS®® and SPSS®®; Elsevier: Amsterdam, The Netherlands, 2000. [Google Scholar]
- Cleveland, R.B.; Cleveland, W.S.; McRae, J.E.; Terpenning, I. STL: A seasonal-trend decomposition. J. off. Stat 1990, 6, 3–73. [Google Scholar]
- Cleveland, W.S.; Devlin, S.J. Locally weighted regression: An approach to regression analysis by local fitting. J. Am. Stat. Assoc. 1988, 83, 596–610. [Google Scholar] [CrossRef]
- Hyndman, R.J.; Athanasopoulos, G. Forecasting: Principles and Practice; Otexts: Melbourne, Australia, 2018. [Google Scholar]
- De Livera, A.M.; Hyndman, R.J.; Snyder, R.D. Forecasting time series with complex seasonal patterns using exponential smoothing. J. Am. Stat. Assoc. 2011, 106, 1513–1527. [Google Scholar] [CrossRef]
- Hyndman, R.; Koehler, A.B.; Ord, J.K.; Snyder, R.D. Forecasting with Exponential Smoothing: The State Space Approach; Springer Science & Business Media: Berlin/Heidelberg, Germany, 2008. [Google Scholar]
- Rege, A. Critical Infrastructure Ransomware Attacks (CIRA) Dataset. Version 12.9. Temple University. 2024. Available online: https://sites.temple.edu/care/cira/ (accessed on 8 September 2024).
- Lng, M.; Connolly, L.; Taylor, P.; Corner, P.J. The evolving menace of ransomware: A comparative analysis of pre-pandemic and mid-pandemic attacks. Digit. Threat. Res. Pract. 2023, 4, 1–22. [Google Scholar] [CrossRef]
- Dickey, D.A. Stationarity issues in time series models. SAS Users Group Int. 2015, 30, 1–17. [Google Scholar]
- Ljung, G.M.; Box, G.E. On a measure of lack of fit in time series models. Biometrika 1978, 65, 297–303. [Google Scholar] [CrossRef]
- Willmott, C.J.; Matsuura, K. Advantages of the mean absolute error (MAE) over the root mean square error (RMSE) in assessing average model performance. Clim. Res. 2005, 30, 79–82. [Google Scholar] [CrossRef]
- Oz, H.; Aris, A.; Levi, A.; Uluagac, A.S. A survey on ransomware: Evolution, taxonomy, and defense solutions. ACM Comput. Surv. 2022, 54, 1–37. [Google Scholar] [CrossRef]
- Dissanayake, N.; Jayatilaka, A.; Zahedi, M.; Babar, M.A. Software security patch management-A systematic literature review of challenges, approaches, tools and practices. Inf. Softw. Technol. 2022, 144, 106771. [Google Scholar] [CrossRef]
- Hillman, D.; Harel, Y.; Toch, E. Evaluating organizational phishing awareness training on an enterprise scale. Comput. Secur. 2023, 132, 103364. [Google Scholar] [CrossRef]
- Yeoh, W.; Huang, H.; Lee, W.S.; Al Jafari, F.; Mansson, R. Simulated phishing attack and embedded training campaign. J. Comput. Inf. Syst. 2022, 62, 802–821. [Google Scholar] [CrossRef]
- Brardi, D.; Giallorenzo, S.; Melis, A.; Melloni, S.; Onori, L.; Prandini, M. Data flooding against ransomware: Concepts and implementations. Comput. Secur. 2023, 131, 103295. [Google Scholar] [CrossRef]
- Semperis. 2024 Ransomware Holiday Risk Report. 2024. Available online: https://www.semperis.com/ransomware-holiday-risk-report/ (accessed on 5 February 2025).
- Keskin, O.F.; Caramancion, K.M.; Tatar, I.; Raza, O.; Tatar, U. Cyber third-party risk management: A comparison of non-intrusive risk scoring reports. Electronics 2021, 10, 1168. [Google Scholar] [CrossRef]
- Argaw, S.T.; Troncoso-Pastoriza, J.R.; Lacey, D.; Florin, M.V.; Calcavecchia, F.; Anderson, D.; Burleson, W.; Vogel, J.; O’Leary, C.; Eshaya-Chauvin, B.; et al. Cybersecurity of Hospitals: Discussing the challenges and working towards mitigating the risks. BMC Med. Inform. Decis. Mak. 2020, 20, 146. [Google Scholar] [CrossRef]
- Hossain, S.T.; Yigitcanlar, T.; Nguyen, K.; Xu, Y. Local government cybersecurity landscape: A systematic review and conceptual framework. Appl. Sci. 2024, 14, 5501. [Google Scholar] [CrossRef]
- Ulven, J.B.; Wangen, G. A systematic review of cybersecurity risks in higher education. Future Internet 2021, 13, 39. [Google Scholar] [CrossRef]
- Asghar, M.R.; Hu, Q.; Zeadally, S. Cybersecurity in industrial control systems: Issues, technologies, and challenges. Comput. Netw. 2019, 165, 106946. [Google Scholar] [CrossRef]
- Brho, M.; Jazairy, A.; Glassburner, A.V. The finance of cybersecurity: Quantitative modeling of investment decisions and net present value. Int. J. Prod. Econ. 2025, 279, 109448. [Google Scholar] [CrossRef]
- Al-Rimy, B.A.S.; Maarof, M.A.; Shaid, S.Z.M. Ransomware threat success factors, taxonomy, and countermeasures: A survey and research directions. Comput. Secur. 2018, 74, 144–166. [Google Scholar] [CrossRef]
- NIST. NIST Cybersecurity Framework. 2025. Available online: https://www.nist.gov/cyberframework (accessed on 16 August 2025).
- CISA. Cyber Incident Reporting for Critical Infrastructure Act of 2022 (CIRCIA). 2022. Available online: https://www.cisa.gov/topics/cyber-threats-and-advisories/information-sharing/cyber-incident-reporting-critical-infrastructure-act-2022-circia (accessed on 28 March 2025).
Disclaimer/Publisher’s Note: The statements, opinions and data contained in all publications are solely those of the individual author(s) and contributor(s) and not of MDPI and/or the editor(s). MDPI and/or the editor(s) disclaim responsibility for any injury to people or property resulting from any ideas, methods, instructions or products referred to in the content. |
© 2025 by the authors. Licensee MDPI, Basel, Switzerland. This article is an open access article distributed under the terms and conditions of the Creative Commons Attribution (CC BY) license (https://creativecommons.org/licenses/by/4.0/).