Abstract
Banking malware poses a significant threat to users by infecting their computers and then attempting to perform malicious activities such as surreptitiously stealing confidential information from them. Banking malware variants are also continuing to evolve and have been increasing in numbers for many years. Amongst these, the banking malware Zeus and its variants are the most prevalent and widespread banking malware variants discovered. This prevalence was expedited by the fact that the Zeus source code was inadvertently released to the public in 2004, allowing malware developers to reproduce the Zeus banking malware and develop variants of this malware. Examples of these include Ramnit, Citadel, and Zeus Panda. Tools such as anti-malware programs do exist and are able to detect banking malware variants, however, they have limitations. Their reliance on regular updates to incorporate new malware signatures or patterns means that they can only identify known banking malware variants. This constraint inherently restricts their capability to detect novel, previously unseen malware variants. Adding to this challenge is the growing ingenuity of malicious actors who craft malware specifically developed to bypass signature-based anti-malware systems. This paper presents an overview of the Zeus, Zeus Panda, and Ramnit banking malware variants and discusses their communication architecture. Subsequently, a methodology is proposed for detecting banking malware C&C communication traffic, and this methodology is tested using several feature selection algorithms to determine which feature selection algorithm performs the best. These feature selection algorithms are also compared with a manual feature selection approach to determine whether a manual, automated, or hybrid feature selection approach would be more suitable for this type of problem.
1. Introduction
Cybercrime poses a serious danger to cybersecurity [1], and according to [2], the cost of cybercrime reached USD 8 trillion in 2023, with malware such as banking malware accounting for a large proportion of this total cost. In recent years, banking malware has emerged as a major concern, because malicious actors can make huge profits from these types of malware variants [3], and the cost to businesses is high. For instance, Emotet banking malware infections can cost up to USD 1 million per incident to remediate [4]. Banking malware attacks are continuing to rise [5], and the discovery of new banking malware variants is also continuing to increase. For example, over a thousand variants of the banking malware Godfather were discovered in 2023 alone [6].
The Zeus banking malware has emerged as one of the most notorious banking malware variants ever developed [7], and since the release of the Zeus source code, many additional variants of Zeus have been developed and have emerged, including Ramnit, Zeus Panda, and Ramnit [8].
1.1. Need for Detecting Banking Malware
New malware variants are always being discovered and are becoming more sophisticated in the way that they attack systems [9], and they will continue to increase [10]. Banking malware follows the same trajectory, and, in this category, Zeus and its variants are still the most prevalent and widespread of all the banking malware variants discovered. For example, Figure 1 shows that Zeus and Ramnit were amongst the top ten banking malware variants discovered in Q3 of 2022 [11]. Figure 2 depicts the number of banking malware attacks that were detected during the same time, and an upward trend is clearly visible [11].
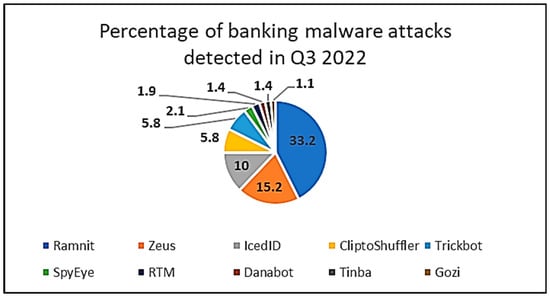
Figure 1.
Top ten malware discovered in Q3 of 2022. This is the proportion of distinct users who experienced this malware family relative to the total number of users targeted by financial malware.
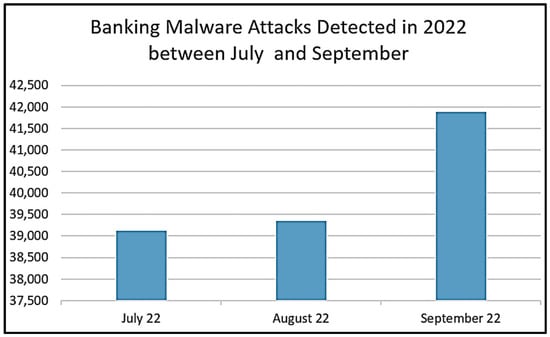
Figure 2.
Banking malware attacks detected in Q3 of 2022.
Banking malware have also diversified their tactics, expanded their capabilities, and, over time, evolved into more sophisticated software tools that leverage several attack vectors to cause financial loss. The fact that threat actors can use Malware-as-a-service (MaaS) providers to target victims has also led to their increased prevalence, and some of these MaaS providers can charge up to USD 4000 per month for their services [12].
Many strategies exist to detect banking malware, and these include signature-based, anomaly-based, behavior-based, and heuristic-based approaches [13], but these do have limitations [14]. These approaches and limitations are explored further over the next few sections, however, some of these limitations include the following:
- The need to update signature-based malware systems.
- The inability of these systems to detect newer malware variants.
- The inability to detect malware that uses sophisticated obfuscation techniques.
- The inability to detect zero-day malware.
This research paper is broken down into the following sections. Firstly, a review is conducted of the Zeus, Zeus Panda, and Ramnit banking malware variants and then a banking malware family tree is proposed. The purpose of this review is to understand the similarities and differences between these various banking malware variants. Next, a literature review of related research is provided, followed by a problem statement. Finally, this paper proposes a machine learning approach for detecting banking malware and also proposes a feature section approach that supports the proposed machine learning approach.
1.2. Paper Contribution and Rational
The main objectives of this paper are to develop a methodology and approach for detecting several banking malware variants’ Command and Control (C&C) communication network traffic and to distinguish this from benign network traffic using binary classification machine learning (ML) algorithms. For this research, machine learning algorithms are used rather than deep learning algorithms or neural networks. The rationale for this is that, firstly, machine learning algorithms are preferred for smaller datasets. This is because machine learning algorithms can perform well even with limited data. Deep learning algorithms require large amounts of data to perform effectively and have many parameters that need to be tuned. Machine learning algorithms also require fewer computational resources and can be deployed quickly, which could help to identify malware more rapidly and effectively [15,16]. Ref. [17] also conducted extensive research in this area and compared several binary classification and deep learning algorithms, using these to detect banking malware C&C communication traffic. The paper demonstrated that machine learning algorithms are more than capable of detecting banking malware, and in fact, in many cases, machine learning algorithms performed much better than deep learning algorithms. The authors also discovered that developing and tuning deep learning algorithms can be complex, time consuming, and increases the training time.
Many other researchers have used machine learning algorithms in their research, and some of these are discussed in Section 2. It is clear from these research findings that machine learning algorithms are effective at detecting many different types of malware variants, including several banking malware variants.
Three ML algorithms and an ensemble approach are all examined, analyzed, and compared in this paper, and these include the decision tree (DT), random forest (RF), and K-Nearest Neighbors (KNN) ML algorithms. The ensemble approach combines all three of the above algorithms, and the rationale for selecting these three algorithms is that, in [17], many common machine learning algorithms were tested, and it was determined that the random forest, decision tree, and KNN machine learning algorithms performed the best when used for detecting malware C&C communication traffic. Ref. [17] also demonstrated that these ML algorithms performed better than or similar to several deep learning approaches. Ref. [18] also concluded in their research that, out of over 179 ML algorithms tested, the KNN, SVM, random forest, and decision tree algorithms performed the best.
This paper aims to develop a machine learning approach that will detect the Zeus banking malware and its variants. It will then test and compare the detection results of several binary ML classification algorithms to determine which one provides the best detection results when used to detect the Zeus banking malware’s C&C communication traffic. It will also examine, test, and compare the detection results of other banking malware C&C communication traffic to understand whether the methodology proposed in this paper works. This research also identifies the minimal number of features that could be used to identify these banking malware variants. This paper aims to achieve the following:
- From all the ML algorithms being analyzed, identify which one performs the best.
- Establish whether the features used to detect the Zeus banking malware can also be used to detect the other banking malware variants.
- Determine a minimum set of features that could be used for detecting Zeus.
- Determine a minimum set of features that could be used for detecting other variants of the Zeus malware.
- Compare the performance results of all the ML algorithms.
- Compare the classification results with other research examined in Section 2.
1.3. Overview of the Zeus Banking Malware
Zeus, also known as Zbot, is a notorious banking malware designed to steal financial information such as online banking credentials through methods like keylogging, screen capturing, and the real-time manipulation of web sessions (man-in-the-browser attacks). It spreads via phishing emails, malicious downloads, and software vulnerabilities. Once installed, Zeus establishes persistence, evades detection using rootkits and encrypted communication, and connects to a remote Command and Control (C&C) server to send stolen data and receive instructions [19]. Known for its modular architecture, Zeus can be customized for specific targets and often forms botnets for large-scale cybercrime operations. Its source code leak in 2011 led to numerous variants, making it one of the most impactful and studied banking malware families in cybersecurity history.
Once the Zeus malware gets onto a device, it needs to perform several actions to infect the device. The Zeus bot inserts malicious code into the winlogin.exe process after copying itself to the system 32 directory, and this is achieved by escalating its privileges and manipulating the winlogin.exe and svchost processes. Two files are created, local.ds, which is used to download the configuration file, and user.ds, which is used to transmit stolen data back to the threat actors’ C&C servers. The additional code injected into the svchost process is used by the Zeus bot for communication purposes, and Zeus communicates using a Command and Control (C&C) channel which can either use a centralized or P2P architecture. In the centralized architecture, the IP address of the C&C server is hardcoded into the bot’s binary file, which leaves the bot vulnerable, because if the C&C channel is discovered and blocked, the Zeus bot becomes inactive and is unable to recover [20]. Modern-day variants of the Zeus malware use a P2P architecture, as this is more resilient to disconnections and is much harder to detect and block [21]. One reason is simply because the IP address is not hardcoded into the bot binary and because, in the P2P network, multiple bots can act as C&C servers. This architecture also allows stolen data to be routed through the bot network via these intermediary C&C bots and, crucially, allows bots to recover from failures [22]. This recovery is possible, because each peer C&C bot can essentially provide support to a failed bot, for example, by sending the failed bot an updated IP address to help it resume malicious communications.
1.4. Overview of the Zeus Panda Banking Malware
Zeus Panda, a variant of the original Zeus malware, is a sophisticated banking malware designed to steal sensitive financial data through techniques such as keylogging, web form data theft, and man-in-the-browser (MITB) attacks. It primarily propagates via phishing emails, malicious attachments, and compromised websites, often targeting financial institutions and systems in specific regions [19]. Panda communicates with remote Command and Control (C&C) servers to exfiltrate data and receive instructions, using encrypted communication and Domain Generation Algorithms (DGAs) for resilience. Its modular design allows it to adapt to various targets, and it employs advanced evasion techniques like anti-debugging and polymorphism to avoid detection, making it a significant threat in the cybersecurity landscape.
The Zeus Panda banking malware portrays similar characteristics to the Zeus banking malware. Research shows that it infects devices using spam emails and exploit kits, and it has been known to spread like a virus [19]. Zeus Panda’s communication architecture is similar to the Zeus banking malware architecture, and its communication is generally encrypted using RC4 or AES [19]. Zeus Panda’s authors have also enhanced the code to allow it to detect and evade security protection tools such as anti-virus software and firewalls [23]. Zeus Panda is intelligent enough to detect that it is running in a virtual environment, and upon sensing such an environment, it can disable itself to ensure that researchers are unable to detect communication patterns [23]. The Zeus Panda malware is difficult to detect and can persist on a device for a long time, and researchers have concluded that Zeus Panda is a sophisticated variant of the Zeus malware [23].
1.5. Overview of the Ramnit Banking Malware
Ramnit is a versatile and persistent malware that evolved from a worm in 2010 into a sophisticated banking Trojan targeting financial institutions and sensitive data. It spreads through phishing emails, malicious attachments, exploit kits, and infected files, using techniques like man-in-the-browser (MITB) attacks and web injections to steal online banking credentials and other personal information. Ramnit communicates with Command and Control (C&C) servers via encrypted channels, enabling data exfiltration and command execution. Its modular architecture allows for adaptability, while advanced evasion techniques, such as polymorphism and rootkits, make it difficult to detect. Despite law enforcement disruptions, Ramnit has resurfaced over the years with enhanced capabilities, posing a significant threat to global cybersecurity.
Ramnit is an enhanced version of the Zeus malware and incorporates code from the Zeus banking malware [24]. The C&C communication channel is encrypted, and this is usually achieved using custom encryption techniques [25]. Ramnit can also use HTTPS to obfuscate the communication channel and hide any data that are transmitted between systems. Ramnit is sophisticated enough to detect and evade security tools, and once it infects a device, it can persist on the device for a long time [25]. Ramnit can also use evasion techniques to avoid detection, and some of these include the use of anti-debugging techniques, polymorphism, and encryption [26].
1.6. Banking Malware Communication (C&C) Architecture
Zeus, Zeus Panda, and Ramnit are all sophisticated malware families targeting financial institutions, employing similar techniques like phishing-based propagation, Command and Control (C&C) communication, a modular architecture, and advanced evasion methods such as polymorphism and MITB attacks to steal banking credentials and personal data. While Zeus is the foundational banking Trojan known for its widespread botnet use, Zeus Panda enhances targeting with tailored regional attacks and advanced MITB capabilities. Ramnit, evolving from a worm, extends its reach with broader infection methods, including USB and executable file propagation, exhibiting a stronger persistence through polymorphic techniques and rootkit functionality. Despite their similarities, each malware family has unique traits that make it distinct in its evolution and attack strategies.
Banking malware use C&C communication channels to communicate between the infected device and malicious entity, and the focus of this study is to identify these communication patterns. Once a device becomes infected, outgoing communication is hard to detect, as it can very easily obfuscate itself with the normal traffic flows of the network, thus making the malware hard to detect.
Banking malware variants are made up of bots that communicate with the C&C server and, initially, these communication channels are centralized, because each bot will communicate with the C&C server directly. These bots are also controlled directly by the C&C server, and this architecture uses a push model for communication purposes. Instructions and malicious commands are all pushed from the C&C server to the bot [27]. The C&C channel always remains active in the ‘connect mode’, as the bot needs to be ready to receive commands [27]. This communication uses the HTTP/HTTPS protocol and can also use other protocols such as DNS tunneling, which makes the malware more difficult to detect. The bots also reach out to the C&C server at predefined intervals, and this ensures that the C&C server maintains communication with these bots. The centralized C&C architecture has limitations, and the key one is that, if the C&C server becomes inactive, all the bots fail, and the bot network becomes inactive.
The centralized architecture evolved into a peer to peer (P2P) architecture in which the bots build a decentralized network of bots. This means that the bots can receive commands from other bots, and there is no longer a reliance on a centralized C&C server. This P2P network is more difficult to detect and take down [28], and makes the botnet more resilient. If a bot in a botnet loses communication, it can automatically try other bots or domains to resume communication. Also, this bot failure does not affect the botnet, as the botnet remains active and other bots are still able to communicate with each other. There are some weaknesses inherent in this type of network, and one of them is that updates can take longer to propagate across the network, as these updates have to be routed through many other bots. Also, stolen data that need to be routed back to the malicious attacker can also face similar challenges.
Machine learning (ML) is critical for detecting the C&C communicating traffic used by malware due to its ability to overcome the limitations of traditional detection methods. Unlike signature-based approaches, which struggle in detecting zero-day malware, polymorphic threats, or encrypted traffic, ML focuses on patterns, behaviors, and anomalies in network communications. By analyzing network features such as packet sizes, traffic flow, and timing intervals, ML models can identify malicious communications even when the data are obfuscated. Furthermore, machine learning enables real-time detection capabilities and can efficiently scale to handle vast amounts of network traffic. It can also adapt to evolving threats, as ML models can be retrained on new data. It is particularly effective against decentralized P2P C&C architectures, like the Zeus banking malware, as it can model peer relationships and detect botnet traffic. Supervised algorithms such as random forest and unsupervised methods like clustering can help to optimize feature selection, improving detection accuracy while reducing computational overhead. By leveraging behavioral analysis, ML provides a robust and dynamic solution for identifying and mitigating sophisticated malware C&C activities.
1.7. Proposed Banking Malware Tree
This section examines and discusses the relationships between the three banking malware variants that were discussed above and establishes a timescale of when they emerged. Figure 3 shows that Zeus was discovered in 2006 [29], Ramnit was discovered in 2010, and Zeus Panda was discovered in 2016 [30], and research indicates that they all share similar code and perform similar actions. Based on this research [30,31,32,33,34,35,36], this paper proposes that all banking malware variants belong to a specific family of banking malware, and this proposed family tree can be seen in Figure 4. A historical timeline of a selection of banking malware variants can be seen in Figure 3, which suggests that all banking malware variants can be traced back to one of the parent banking malware variants, Zeus, Snifula, and Gozi, as shown in Figure 4.
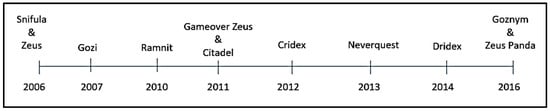
Figure 3.
Banking malware timeline.
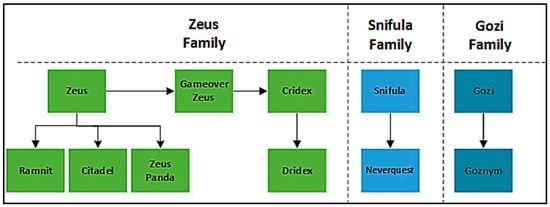
Figure 4.
Banking malware tree.
The key conclusions from this research reveal that most banking malware variants belong to one of the three primary families identified in Figure 4. These variants frequently borrow code from one another, with newer malware still sharing similarities in code and behavior with those outlined in Figure 4. Despite these overlaps, banking malware continues to evolve, becoming increasingly sophisticated and more effective at targeting victims.
The rest of the paper is organized as follows: Section 2 discusses some of the key research that has been conducted in this field. In Section 3, a problem statement is presented. Section 4 proposes a framework to detect the banking malware variants discussed in Section 1.2, Section 1.3 and Section 1.4, Section 5 analyzes and compares the research findings, and Section 6 concludes with a summary and conclusion.
2. Related Studies
Malware detection approaches can be categorized using several methods. However, the method discussed by [37] is used in this paper, which is that malware detection can either be signature-based, heuristic-based, or behavioral-based. Also, malware detection tools can either be host-based or network-based [38], and this research examines a network-based approach, as it focuses on C&C network communication traffic.
The authors in [39] used the SVM machine learning algorithm to develop an intrusion detection system which uses the NSL-KDD dataset to classify network traffic. To select appropriate features, ref. [39] used a hybrid feature selection approach which ranks features using a feature selection approach called Information Gain Ratio (IGR) and then refined this further by using the k-means classifier. They achieved an accuracy of 99.32 and 99.37 when used with 23 and 30 features.
A simple yet effective method was developed by [40], which involved extracting statical features called ‘function call frequency’ and ‘opcode frequency’ from Windows PE files. These features were extracted from both the executable files’ header and from the executables’ payload, and the features were extracted from a total of 1230 executable files. The dataset contained 800 malware and 430 non-malware executable files, and the experimental work was conducted using a tool called WEKA. Several classifiers were experimented with, and the results of these experiments can be seen in Table 1.

Table 1.
Test results from [40] when using the SVM ML algorithm.
Research was carried out by [41], who used an unsupervised machine learning algorithm to detect botnet communication traffic. They used datasets obtained from the University of Georgia which contained botnet traffic from both the Zeus and Waledac malware variants. Features were extracted from the dataset by using a tool called Netmate, which extracts traffic as flows and then analyzes each flow to calculate their statistical features. The datasets were analyzed using WEKA and all the experimental analyses were also conducted using this tool. The experimental results can be seen in Table 2.
Table 2.
Test results from [41] when using an unsupervised ML algorithm.
BotOnus is a tool developed by [42] which can extract a set of flow specific features and then, by using an online fixed-width clustering algorithm, can arrange these features into unique clusters. These clusters are examined and analyzed for suspicious behaviors. Suspicious botnet clusters are defined as flow clusters that have at least two members that have been identified as potentially suspicious. This is determined using an intra-cluster similarity score which is set to a predefined threshold. BotOnus is an online detection technique that makes use of unsupervised machine learning algorithms and can identify unknown botnets. Table 3 shows the experimental results obtained by BotOnus.
Table 3.
Test results from [42] when using an unsupervised ML algorithm.
RCC Detector (RCC3) is a tool developed by [43] that uses a multi-layer perceptron (MLP) and a temporal persistence (TP) classifier to analyze the traffic flows from a host, and the aim is to identify malware communication traffic. The botnet detection system was trained and tested using the DETER testbed and two datasets were used, the DARPA and LBNL datasets. The authors aimed to predict Zeus, Blackenergy, and normal traffic, and the key to this paper was that RCC examined traffic generated from a host. The tool achieved a detection rate of 97.7%.
Classification of Network Information Flow Analysis (CONIFA) is a tool developed by [44] which was used to identify and detect the Zeus banking malware. For the experimental analysis, ref. [44] used a standard framework, a cost-sensitive, and a cost-insensitive version of the C4.5 machine learning algorithm. For the cost-sensitive experimental analysis, the following parameters were used.
- Lenient version with cost settings of 10, 20, and 30
- Strict version with a cost setting of 10, 20, and 30
Two Zeus datasets were used for training and testing, and these comprised 432 samples of the Zeus v1 malware and 144 samples of the Zeus v2 malware. The prediction results of the tests conducted using the standard framework can be seen in Table 4, and the test results of using the cost-sensitive and cost-insensitive versions of C4.5 can be seen in Table 5. Table 5 demonstrates an improvement in the recall score and shows that the cost-sensitive and cost-insensitive versions of C4.5 performed better than the standard framework at predicting the Zeus malware.
Table 4.
Test results of using the standard framework.
Table 5.
Test results of CONIFA using the cost-sensitive and -insensitive versions of C4.5.
Table 4 demonstrates that, when the standard framework was evaluated against the Zeus v2 dataset after being trained on the Zeus v1 dataset, the detection results decreased. About half of the Zeus flows were incorrectly identified, with a recall rate of approximately 56%. As seen in Table 5, CONIFA showed improvement during the same experiment, with the recall rate rising to almost 67%.
The authors in [45] used the Symbiotic Bod-Based (SBB) and C4.5 machine learning algorithms to create a framework for detecting malware communication traffic. Features were extracted from the communication (C&C) channels of various malware variants, which included the C&C communication traffic of the Zeus banking malware. The samples were obtained by generating C&C communication traffic to known malware domains. Additional malware samples were obtained from various sources, including NETRESEC and Zeustracker, and these were used in the experimental analysis. Table 6 shows the datasets that were used for the experimental analysis.
Table 6.
Information about the datasets used by [45].
After the data were collected, a program called Softflowd was used to extract the features that were used during the experimental analysis. Two feature sets were used, and these are depicted in Figure 5.
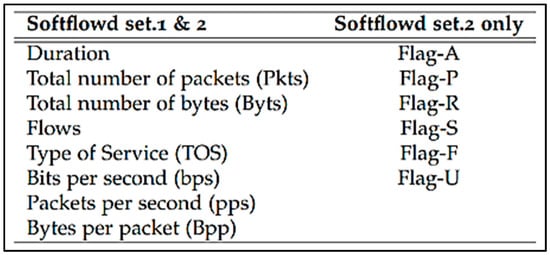
Figure 5.
The two feature sets used by [45] during their experimental analysis.
The results obtained during the experimental analysis can be seen in Table 7 and Table 8. Table 7 shows the classification results when the ML algorithms were trained and tested using the features in feature set 1 and 2. Table 8 shows the results obtained when the ML algorithms were trained and tested using the features in feature set 1 only. For brevity, only the results for the Zeus malware are shown. The results depicted in both Table 7 and Table 8 show good prediction results across all the datasets. The highest true positive rate was achieved when the algorithms were trained and tested using the features from the Softflowd set.1 and 2 feature set, and was obtained by both the C4.5 and SBB machine learning algorithms. The true positive scores obtained were 99% and 98%, respectively. Table 8 shows that the highest true positive rate achieved was 100%, and this was achieved by the SBB machine learning algorithm.
Table 7.
Classification results when used with Softflowd set.1 and 2.
Table 8.
Classification results when used with Softflowd set.2.
Auto-mal is a product developed by [46] which analyzes binary codes and identifies a set of features that are used to identify malware such as the Zeus banking malware. These features are then used to automatically classify the malware samples into malware families, and this is performed by using several machine learning algorithms. These algorithms include the Support Vector Classification (SVM), logistic regression (RG), Classification Tree (CT), and K-Nearest Neighbor (KNN) machine learning algorithms. Auto-mal captures and categorizes network traffic by using information such as the IP address, port numbers, and protocol types, and during this experimental analysis, 1.980 Zeus malware samples were analyzed. The Zeus samples were split into two datasets, one of which was used for training and the other was used for testing. For testing, 979 samples of Zeus and 1000 normal samples were used, and the testing results showed that the SVM algorithm performed the best and was able to correctly identify 95% of the Zeus malware samples. The decision tree algorithm produced a high false negative result, and from this, ref. [46] concluded that the decision tree algorithm was limited in its usefulness.
An XAI-driven antivirus software was developed by [47], which essentially uses Explainable Artificial Intelligence (XAI) to create AI models. This XAI-driven antivirus software was designed to identify the Citadel banking malware, which is a variant of the Zeus banking malware. Ref. [47] highlights the limitations of traditional antivirus programs and argues that an AI-driven approach is more robust, accurate, and proactive in detecting new and evolving malware variants of the Citadel banking malware. XAI uses multiple Extreme Learning Models (mELMs) to detect the Citadel banking malware, and mELM is a morphological technique used for digital image processing. Ref. [47] adopted this in their software program to detect Citadel and concluded that mELM is a viable technique that can be used to detect malware. The software achieved an accuracy of 98% and was also quick at training and learning. One of the key characteristics of XAI is that the authors provided some insights into how the algorithm works, and these insights can help other researchers in their research projects.
The authors in [48] used a Convolutional Neural Network (CNN) to classify malware samples which included the banking malware variant Ramnit. The authors transformed the malware binary files into grayscale images, which then enabled the CNN to detect patterns that could be used to classify the malware. Ref. [48] built a CNN network which consisted of a convolutional layer, pooling layer, and fully connected layer. Features were generated by analyzing the executable files, and although many techniques exist to perform this, ref. [48] used the following methodology. First, 1600 unique opcodes were created, which then allowed [48] to use the opcode frequency as the discriminatory feature for the experimental work. To select the optimal number of features for the experimental work, ref. [48] used different dimensionality reduction techniques, which included the variance threshold approach, a single layer auto-encoder, and a three-layer stacked auto encoder.
The authors in [49] used both machine learning and deep learning algorithms to build several models to train, test, and classify malware. The machine learning algorithm used was the random forest algorithm, and three deep learning models were used. The three deep learning models were architected using two hidden layers (DNN-2L), four hidden layers (DNN-4L), and seven hidden layers (DNN-7L). Ref. [48] used several criteria to measure the performance of the algorithms and models used, and these included accuracy, recall (true positive rate (TPR)), true negative rate (TNR), and precision (positive predictive value (PPV)). The experimental analysis produced good results. The lowest score was a precision score of 87.97%, achieved by the DNN-7L model, and the highest score was achieved by the RF model, with a PPV/precision score of 100.
Fingerprinting Windows API system function calls is an approach developed by [49], in which the frequency of Windows API system function calls are captured and analyzed to identify malicious patterns. This approach also allows for various malware variants to be categorized based on their relationships. The relationship is determined by understanding and grouping common behaviors and patterns that are identified during the analysis stage. Around 65,000 malware samples were analyzed, and this was conducted using the Cuckoo Malware Sandbox, which allowed [49] to identify the name of the API calls being called and the number of times each API call was made. Ref. [49] used several machine learning algorithms to train and test samples, and these included KNN, logistic regression, and the decision tree ML algorithm. The detection results obtained were good, and for the Ramnit.gen!A malware, an accuracy of 79.495% was achieved, and for the Ramnit.gen!C malware, an accuracy of 95.473% was achieved.
Similar research was conducted by [50], who created a machine learning model that was able to classify and identify malware and also able to group malware variants based on their relationships. These included several variants of the banking malware Ramnit. Ref. [50] extracted features from the malware samples using an approach called static analysis. This approach enabled them to extract features without having to execute or run the malware executable. The authors claimed that this approach allowed them to achieve a better performance with a low computational risk. Using the static approach, features could be extracted from two files within the executable, the hex file or the byte code file. During their research, ref. [50] extracted the features from the byte code files. This was performed using the n-gram feature extraction approach, which analyzed the byte sequence or opcode patterns within the malware executable files and then represented these patterns as words, in this case using the hex format. Ref. [50] used the K-Nearest Neighbor, logistic regression, random forest, and XGboost machine learning algorithms to train, test, and classify the malware, and for the evaluation, accuracy and log-loss were used to measure the performance of the machine learning algorithms. Table 9 shows the classification results obtained when classifying the malware using the byte file features. Table 9 shows that the XGBoost and decision tree ML algorithms performed the best, achieving an accuracy of 98.76 and 97.98, respectively.
Table 9.
Experimental results of the algorithms when classified using byte file features.
3. Problem Statement
The goal of this study is to develop a methodology and create a framework for predicting banking malware using machine learning approaches. Many malware detection approaches already exist and have been researched and used by researchers. Some of these include signature-based approaches [51,52] and anomaly-based detection approaches [53,54], however, these do have limitations [55]. Some of these limitations include the following.
- Signature-based systems are unable to detect zero-day malware or unknown malware variants.
- Signature-based systems must be updated frequently to accommodate newly emerging malware variants.
- Malware uses various obfuscation techniques to evade detection.
- There can be a time delay between discovering new malware and creating a signature to identify the malware.
- Signature databases can consume significant system resources and have a slow performance.
- Modern malware can dynamically change its structure (polymorphic malware) or rewrite its code (metamorphic malware) to avoid signature-based malware systems.
- As the malware landscape evolves, maintaining and updating the signature database becomes increasingly complex.
- Effective and continuous tuning is required to reduce false positives.
- The network has to be baselined, and normal communication traffic needs to be identified.
- Network traffic must be constantly monitored.
- Malware can hide within the normal traffic flows, making these malware types difficult to detect.
Machine learning has been used to resolve these issues, and while researchers have used machine learning algorithms to detect banking malware [35,44,45,46,47], there has been minimal research aimed at detecting a wide range of banking malware variants using a model trained exclusively on one dataset containing a single banking malware variant. This study seeks to address this gap by developing a machine learning model trained on a single dataset representing one variant of banking malware. The primary objectives of this research are as follows:
- Cross-Variant Detection: To apply the trained model to identify other banking malware variants and evaluate its generalizability.
- Algorithm Performance Evaluation: To compare the detection performances of various machine learning algorithms in this context.
- Feature Optimization: To determine the minimum set of features required to achieve satisfactory prediction results, thereby optimizing computational efficiency and simplifying the detection process.
This approach aims to advance the understanding of cross-variant malware detection and provide insights into the effectiveness of machine learning algorithms and feature selection when used to detect diverse banking malware threats.
4. Research Methodology
This research paper aims to classify C&C network traffic flows as belonging to Zeus, which indicates that the C&C network traffic is malicious. The high-level activities include the following steps:
- Obtain pcap samples of the Zeus banking malware and benign traffic.
- Extract features from the pcap samples.
- Train and test the algorithms with the data.
- Compare and discuss the results.
Bot samples are collected as pcap files, and these pcap files are made up of network flows. A flow is defined as a sequence of packets flowing between a source and a destination host. Each flow is referred to as an ML sample, and the features are extracted from these samples. For this research, supervised ML algorithms are chosen, as these algorithms are well-suited for solving predication and classification problems such as the one being researched in this paper [56]. This paper analyzes three supervised ML algorithms, which are the decision tree (DT), random forest (RF) and K-Nearest Neighbor (KNN) ML algorithms, and examines an ensemble approach. The approach and methodology are explained in the next few sections.
4.1. Machine Learning Algorithms
Artificial intelligence (AI) is made up of several fields, which include deep learning, neural networks, and machine learning. Figure 6 depicts the various fields of AI [57].
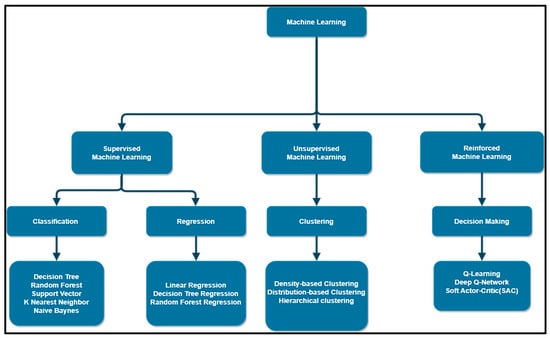
Figure 6.
Machine learning approaches with example algorithms.
The most widely used approaches in machine learning are supervised, unsupervised, and reinforced learning, and Figure 7 illustrates the various types of machine learning approaches [58] that can be used. For this paper, supervised ML approaches are used.
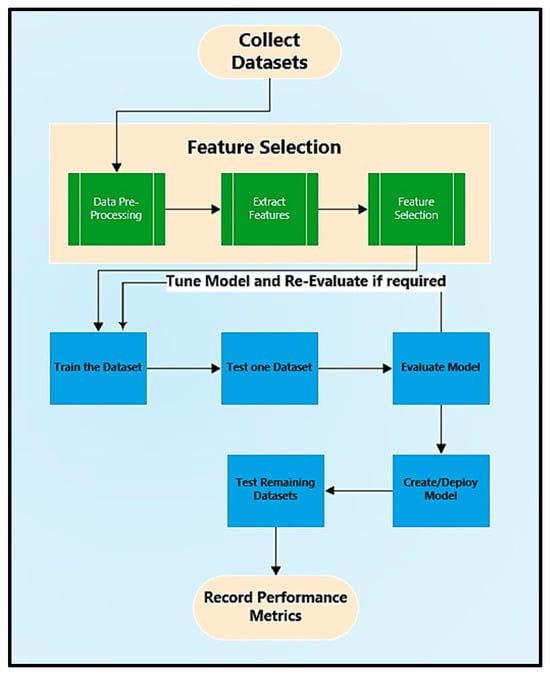
Figure 7.
System architecture.
There are several types of supervised ML approaches that could be considered for the problem being researched in this paper, and these are as follows [58]:
- Binary classification—Two possible classifications can be predicted, for example, an email can either be spam or not spam. The two possible classes are usually either normal or abnormal.
- Multi-Class classification—Multiple classes are involved, and each data point is classified into one of the available class options.
- Multi-Label classification—Multiple classes can be predicted for each data point. For example, a house could be present in multiple photos.
For this research, the binary classification approach was selected, as this has been used by many researchers to solve similar problems, as discussed in Section 1 and Section 2. For the supervised ML algorithms used in this research, a brief description of these is provided below.
One of the most effective and noteworthy machine learning methods for predictive modeling is the decision tree (DT) algorithm, which performs exceptionally well when dealing with binary classification problems [59]. The decision tree algorithm operates by splitting data into subsets based on the value of the input features. This results in a treelike structure, where each node represents a feature, each branch represents a decision rule, and each leaf node represents an outcome. This hierarchical structure facilitates a straightforward interpretation and visualization of decision-making processes. Traditionally, the decision tree algorithm did not produce optimum results, however, recent advances utilize techniques to construct optimal decision trees and are able to balance the accuracy and complexity of the trees built and used [60]. Since this research aims to ascertain whether the network flow is malicious (banking malware traffic) or benign, the decision tree technique is a good fit for this prediction problem. Additionally, the decision tree algorithm learns and makes predictions extremely quickly [59].
In comparison to the decision tree algorithm, the random forest (RF) algorithm can be more effective, can produce better prediction results, and can lessen the likelihood of overfitting [61]. The random forest algorithm is a robust ensemble learning method that enhances the performances of decision trees by constructing a multitude of trees and then aggregating these results. This approach mitigates the overfitting commonly associated with individual decision trees and improves predictive accuracy. The ensemble approach used by RF reduces variance and enhances model stability. Each tree is trained on a different sample of the dataset, and RF randomly selects the features for training, which promotes diversity among the trees [62]. When utilizing the RF method, it is crucial to adjust the parameters of the algorithm in order to improve the prediction accuracy. It can be challenging to foresee the ideal values in advance, and the parameters are chosen by experimentation. One of these parameters is the quantity of the trees constructed during the training and testing phases, and research shows that constructing more than 128 trees can raise the cost of training and testing while offering no appreciable improvement in accuracy [63]. Constructing between 64 and 128 trees has been shown to be the ideal number of trees that should be used, so, the experimental analysis for this research also used between 64 and 128 trees [63].
The K-Nearest Neighbors (KNN) algorithm is a supervised learning algorithm that can be utilized for both classification and regression tasks. It operates on the principle that data points with similar features are likely to belong to the same class or share similar output values. For a given input, KNN computes the distance between this input and all other instances in the training dataset, which enables KNN to make predictions [64]. KNN is a non-parametric method [65], meaning that it makes no assumptions about the underlying data. Following the computation of the distance between each new data point and every other training data point, the algorithm can classify the new data point in relation to the trained data points [66]. KNN is a simple and adaptable ML algorithm that can solve various predication problems such as multi-class and binary classification problems, like the one being researched in this paper. However, research shows that KNN can be computationally complex to run, and the distance between points can become less meaningful in high-dimensional spaces [67].
An ensemble approach [68] is also used in this research, and for this, the random forest, decision tree, and the K-Nearest Neighbor ML algorithms are all used together in the ensemble approach. A voting classifier was used to combine the results of all the models, and for this research, a soft vote [69] was used for predicting the malware. The soft voting approach is useful, because it can select the average probability of each class [70].
4.2. System Architecture and Methodology
The system architecture shown in Figure 8 depicts the steps that are completed for the experimental work conducted during this research. These include the following:
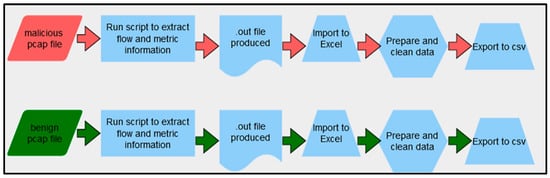
Figure 8.
Process for extracting and computing flow statistics.
- The datasets are identified and collected.
- Features are extracted from these datasets.
- The extracted features are transferred to a CSV file and prepared.
- The features are selected for training and testing.
- The algorithm is trained and tested, and a model is created. Only one dataset is used for the training.
- The model is tuned, trained, and tested again if required.
- The model is used to test and evaluate the remaining datasets.
- The final model is deployed, all the data samples are tested, and a report highlighting the evaluation metrics is created.
4.3. Data Samples
In this study, a variety of datasets were collected, and these datasets represent real-world activity that was captured by various reputable organizations. These datasets are represented as pcap files. Six datasets were used for this research, and these were collected from Zeustracker [71], Stratosphere [72], Abuse.ch [73], and Dalhousie University [74]. Abuse.ch correlates samples from commercial and open-source platforms such as VirusTotal, ClamAV, Karspersky, and Avast [73]. Dalhousie University’s botnet samples are part of the NIMS botnet research project and have been widely utilized by many researchers [74]. Table 10 defines all the data sets that were used during this research and provides some information around the banking malware variants collected and used during this research. Table 10 also specifies the year that the samples were detected and categorized by the antivirus vendor and depicts the number of flows extracted from these samples.
Table 10.
Datasets used in this research.
Each pcap file is made up of network flows, and for this research, the network characteristics for each flow were extracted from these pcap files. A flow is a sequence of packets flowing between a source and a destination (IP and port combination) during a certain period of time. Figure 9 shows the process used to extract the characteristics from each flow, and the first step was to set up and configure Netmate-flowcal on a virtual machine, which allowed the pcap files to be input into the Netmate-flowcal tool. Netmate-flowcal then calculated the key statistics of each flow within each pcap file and output these into an .out file, which had to be converted to a text file and cleaned. The text file was then converted into an excel file, and the data were prepared, cleaned, and then converted into a CSV file, which prepared the file for the machine learning algorithm. As there were thousands of pcap files, a script was developed to automate this process.
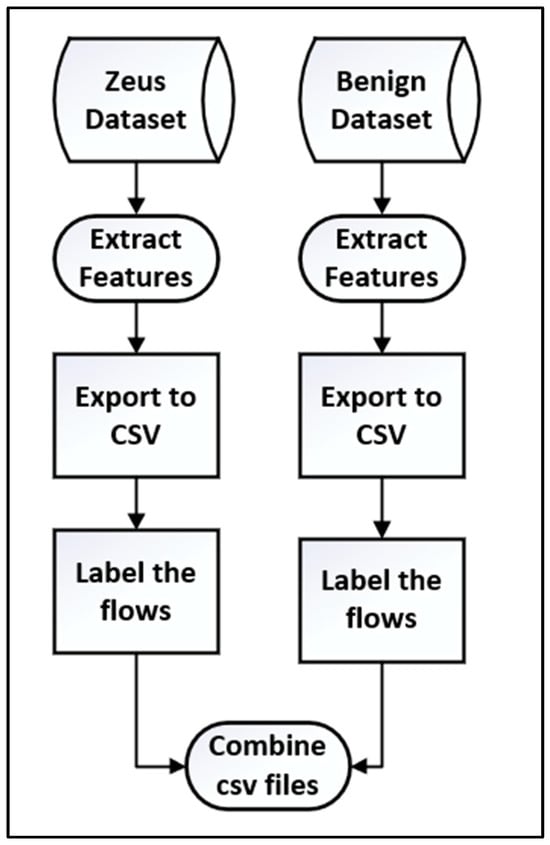
Figure 9.
Feature rankings calculated by SelectKBest.
Each sample in the CSV files was labeled, and this identified whether the sample was benign or malware. A label of ‘0’ was applied to the benign traffic samples and a label of ‘1’ was applied to the Zeus malware traffic samples. The Pandas library was used to create and manipulate the data frame and prepare the data for the machine learning tasks.
4.4. Feature Selection
The statistical features were extracted and exported into a CSV file, and these were used as the features. A total of 44 features were extracted, however, not all the features were used. It is important to select the appropriate and best features, as this helps to reduce overfitting and computational cost and helps the ML algorithm to learn faster [75,76]. Several approaches can be used to identify the appropriate features, and the three predominant approaches are the following [77]:
- Filter method—Feature selection is independent of the ML algorithm.
- Wrapper method—Features are selectively used to train the ML algorithm, and through continual experimental analysis, the best features are selected for the final model. This method can be very time-consuming.
- Hybrid—A fusion of the filter and wrapper approaches.
For this research, the features were analyzed using the filter-based approach, and three automated feature selection algorithms were used for this analysis, including the ANOVA [78], CFS [79], and SelectKBest [80] feature selection algorithms.
SelectKBest is a feature selection approach which selects the top K features from all the features available. This is based on a scoring function based on how well each feature correlates with the target variable, and for this research, f_classif was used for the scoring mechanism, which scores each feature and then ranks these based on the score. The score assigned to the feature measures the relationship between the feature and the target variable, in this case, malware or benign, and then selects the top K features. The formula for calculating the f_classif is shown in Equation (1) [81]. K is the number of classes (distinct target labels), is the number of samples in class i, N is the total number of samples in the dataset, is the mean of feature values for class i, is the overall mean of the feature across all samples, and is the value of the feature for sample j in class i.
SelectKBest compares the mean values of different groups. The two groups considered are the ‘between-group variances’ and ‘within-group variances’. A larger value assigned to a feature means that the feature is a good candidate for predicting the malware, whereas a smaller value means that the feature is unlikely to help predict the malware. The top 10 features calculated by SelectKBest were selected for this research, and this was performed by setting the K Value to 10. This was based on experimental analysis, and increasing the K value further did not influence the prediction results. Figure 10 shows the feature rankings calculated using SelectKBest.
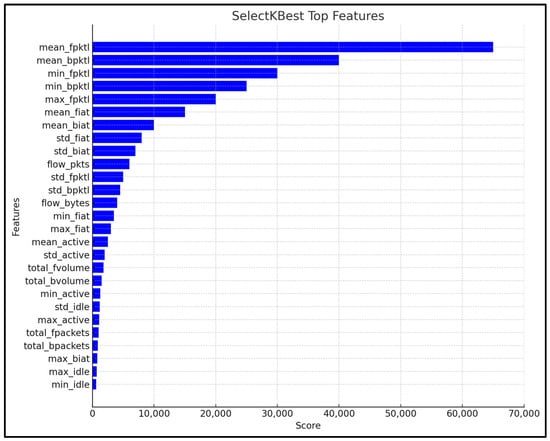
Figure 10.
Feature rankings calculated by SelectKBest.
CFS works by considering the correlation between each feature and the target variable and the correlations between the features themselves. CFS then selects the features that maximize and minimize the correlation between the features. A subset of these features is evaluated further, and this is based on the average correlations with the target variable and the inverse of the correlation between the features themselves. The formula for calculating the CFS is shown in Equation (2) [82]. S is the subset of selected features, is the correlation between the selected features and the target variable, is the correlation between the features themselves, k is the number of features in the subset S, and m is the total number of features in the dataset.
The features with the highest combined score are selected. Figure 11 shows the feature ranking scores calculated by CFS.
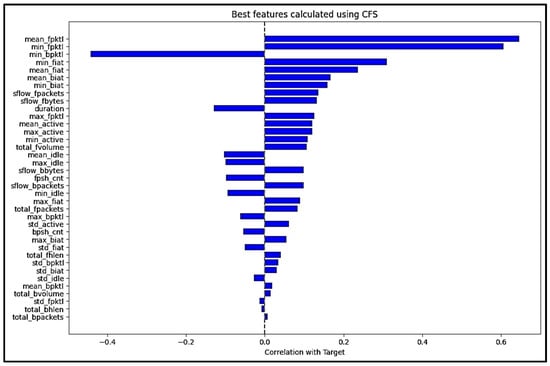
Figure 11.
Feature rankings calculated by CFS.
ANOVA is another feature selection approach that was used during this research. In ANOVA, the data are split into groups, and these groups represent the different categories being compared. The groups are compared to the target variable, and the differences between these groups are calculated. Several calculations are performed by ANOVA, and these can be seen in Equation (3) [83]. The first is SSB, which is the Sum of Squares Between groups, calculated as follows: k is the number of groups, is the number of observations in group i, is the mean of group i, and is the overall mean. The second calculation is SSW, which is the Sum of Squares within Groups and is calculated as follows: is the value of the observation in group I and is the mean of group i. The final calculation is F, which is the F-statistics, and in this formula, MSB is the Mean Square Between, MSW is the Mean Square Within, k is the number of groups, and N is the total number of observations.
A large value suggests that the groups are different and can be considered as a suitable feature to use for the experimental work, and a small number suggests that the feature might not be suitable. Figure 12 illustrates the scores calculated by ANOVA, and the scores are ranked from the highest to the lowest.
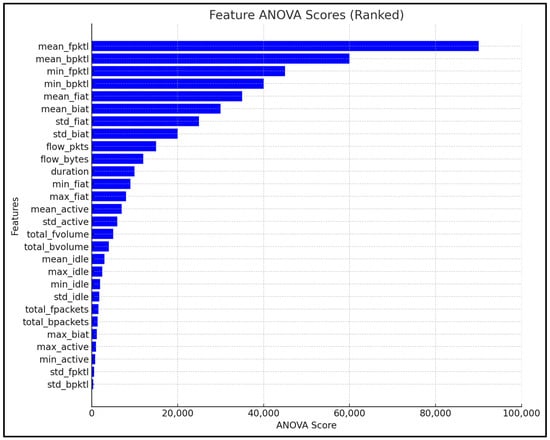
Figure 12.
Feature rankings calculated by ANOVA.
Several experiments were conducted using different features, and it was determined that the following ten features would be the most appropriate and minimum number of features required for predicting the different malware variants: mean_fpktl; min_fpktl; min_bpktl; min_fiat; mean_fiat; mean_biat; min_biat; sflow_fpackets; sflow_fbytes; and Duration.
Increasing the number of features does not help to improve the prediction results and using a lower number of features reduces the efficiency of ML algorithms. The above ten features were used in the training and testing of the machine learning algorithms, and the results of the experimental analysis can be viewed in Section 5.
4.5. Evaluation Approach of the Experimental Analysis
The evaluation metrics of precision, recall, and F1-score were used for the experimental analysis conducted for this research. Precision is the percentage of correctly identified positive cases from the whole data sample [84], and recall is the percentage of correctly identified positive cases from the positive samples only [85]. The formulas used are as follows:
The F1-score considers both the positive and negative cases combined, and the formula used to calculate the F1-score is set out as follows [86]:
A confusion matrix [87], as shown in Table 11, will also be generated for each experiment that is conducted. The confusion matrix calculates the true positive (TP), true negative (TN), false positive (FP), and false negative (FN) scores for each dataset.
Table 11.
Confusion matrix that will be used to measure the detection accuracy.
5. Results
This section presents the training and testing results for all the ML algorithms and compares the prediction results for each of the datasets. For each ML algorithm, two tables are presented. The first table shows the precision, recall, and F1-score results and the second table depicts the following information: the number of samples tested; the number of samples correctly classified (true positives); and the number of samples misclassified (false negatives). The table also depicts the prediction results of the benign C&C network samples.
5.1. Training and Testing the Decision Tree Machine Learning Algorithms
The DT ML algorithm was trained using the features defined in Section 4.4 and for the training, 3 folds were used. A training accuracy of 0.974 was achieved, and Table 12 shows the testing results and Table 13 depicts a confusion matrix for each of the datasets tested. By examining the key metric, which is the recall score for the malware, most of the recall scores were above 95. The lowest recall rate was 66 for dataset 6, and the highest recall score was 99 achieved by both datasets 3 and 4.
Table 12.
Testing results when using the decision tree ML algorithm.
Table 13.
Confusion matrices depicting the testing results of the decision tree ML algorithm.
5.2. Training and Testing the Random Forest (RF) Machine Learning Algorithm
The results of testing the RF ML algorithm can be seen in Table 14 and Table 15. A training accuracy of 0.997 was achieved, and by examining the key metric, which is the recall score for the malware, most of the recall results were above 95. The lowest recall score was for dataset 6, which was 66, and the highest recall score was obtained by datasets 3 and 4, which 99.
Table 14.
Testing results when using the random forest ML algorithm.
Table 15.
Confusion matrices depicting the testing results of the random forest ML algorithm.
5.3. Training and Testing the K-Nearest Neighbor (KNN) Machine Learning Algorithm
The KNN testing results can be seen in Table 16 and Table 17. A training accuracy of 0.950 was achieved, and by examining the key metric, which is the recall score for the malware traffic, most of the malware recall results were above 90. The lowest malware recall rate was 50, which was achieved by dataset t6, and the highest malware recall score was 100, achieved by dataset 3.
Table 16.
Testing results when using the K-Nearest Neighbor (KNN) ML algorithm.
Table 17.
Confusion matrices depicting the testing results of the K Nearest Neighbor (KNN) ML algorithm.
5.4. Training and Testing Using the Ensemble Machine Learning Approach
An ensemble approach was used to train and test all the datasets, and the results of this can be seen in Table 18 and Table 19. Again, focusing on the malware recall score for each dataset, the highest malware recall score was achieved with both datasets 3 and 4, with a score of 99. The lowest malware recall score achieved was for dataset 6, which was 66.
Table 18.
Testing results when using the ensemble machine learning approach.
Table 19.
Confusion matrices depicting the testing results of the ensemble ML approach.
5.5. Comparing the Predication Results of all the Algorithms Tested
The results obtained from testing all the algorithms are compared in this section. Figure 13 shows the malware recall results of all the algorithms when tested against all the datasets and Figure 14 shows the benign traffic recall scores. An expanded view of the results can be seen in Figure 15 and Figure 16, which show both the recall and precision scores for both the malware and benign traffic samples.
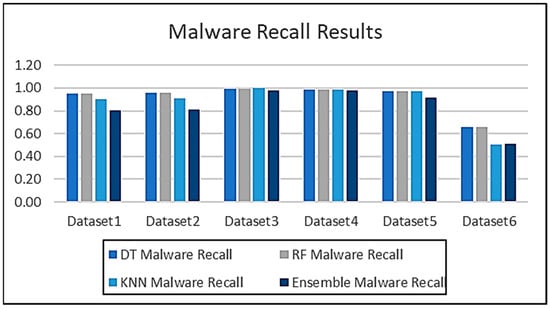
Figure 13.
Comparison of the prediction results for all three ML algorithms.
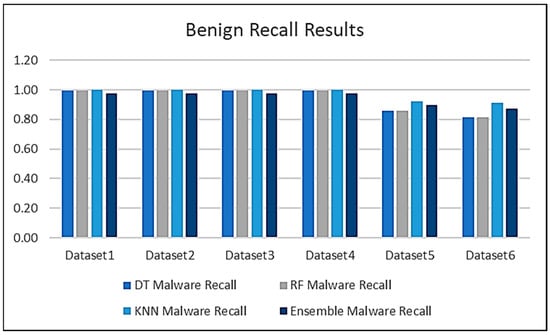
Figure 14.
Comparison of the prediction results for all three ML algorithms.
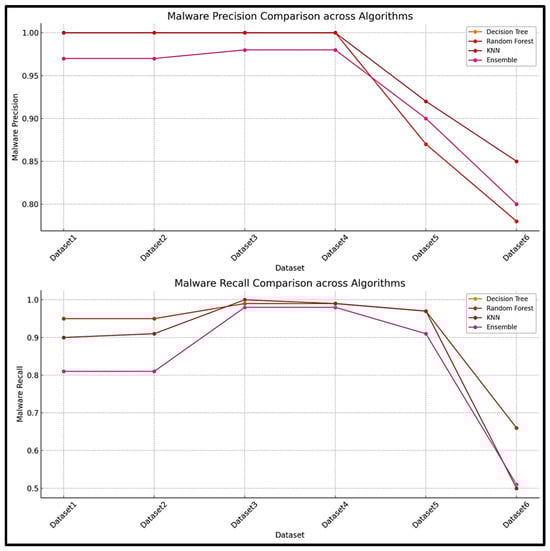
Figure 15.
Malware precision and recall scores.
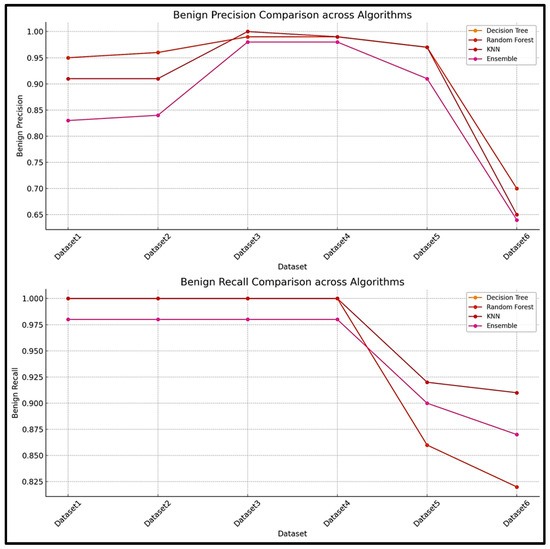
Figure 16.
Benign precision and recall scores.
The results obtained during the testing phase indicate that the decision tree algorithm performed consistently well across all the datasets, with high accuracy scores for datasets 1–4. The performance for dataset 6 did decrease slightly, which seems to indicate that the decision tree algorithm faced some challenges when used for testing on a large dataset. Similar results were obtained for both the random forest and KNN algorithms. The results demonstrate that the random forest algorithm performed the best and is the most suited for this type of problem.
All the results are compared in Figure 17, and the experimental results and the patterns observed suggest that the random forest and decision tree models were more robust and consistent across all the datasets, while the K-Nearest Neighbor and ensemble models may face some difficulties with larger or more complex data. Dataset 6 seems particularly challenging, reducing performance across all the datasets.
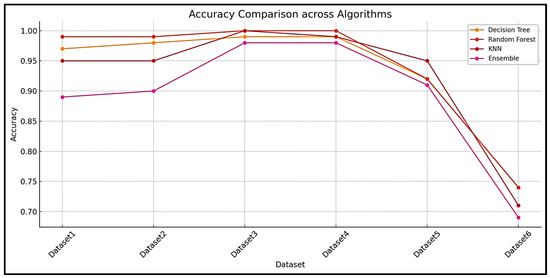
Figure 17.
Accuracy comparison across all the algorithms.
This paper has demonstrated an approach that can be used to detect banking malware and some its variants, and has demonstrated that the methodology does work across multiple datasets and other variants of the Zeus malware. The research also allows key inferences to be made, because one dataset was used for training and to create an ML model. This model was tested to evaluate its generalization and ability to classify other various banking malware variants. Metrics such as precision, recall, F1-score, and accuracy were used to assess the performance across these datasets. The model performed exceptionally well on datasets 2–4, achieving a high accuracy (≥97%) and balanced F1-scores, indicating that these datasets share similar feature distributions with dataset 1. However, its performance declined on datasets 5 and 6, with its accuracy dropping to 92% and 74%, respectively. The decline in the precision and recall scores suggests that there were some behavioral differences between the malware samples. This underscores the importance of using diverse training data and robust ensemble methods to improve generalization across malware variants.
5.6. Comparing the Predication Results with Previous Research
This section compares the results obtained in this research with the previous research identified and discussed in Section 2. Several experimental results are compared, and the first comparison is performed with the research conducted by [44]. The model developed in this paper is referred to as ‘User Model’. Figure 18 compares the performance of the user model with that of the models developed by [44].
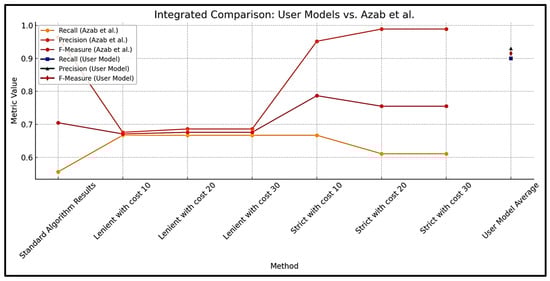
Figure 18.
Results of [44] compared to the results of this research.
The comparison between the results of this research and the results presented by [44] reveals several key insights. This research demonstrated a well-balanced performance and achieves a recall of approximately 0.90, significantly outperforming all the configurations from [44], where the highest recall was 0.667. This highlights that the model developed in this research has a greater ability to correctly identify malware patterns. In terms of precision, the strict configurations from [44] (cost 20 and 30) achieved slightly higher values (0.989) compared to the precision of 0.93 of this research. However, the trade-off for this higher precision is a lower recall, resulting in a less balanced performance. The F-measure, which balances precision and recall, was notably greater in this research (~0.914), exceeding all configurations from [44], except for the strict configuration with cost 10 (0.787). These results indicate that the model developed for this research is highly effective and achieves a balance between detecting true positives and minimizing false positives, making it more robust for practical implementations.
The results obtained by [45] are also compared with the user model, and Figure 19 compares these results. The comparison reveals that the model developed in this research had a TPR of 90%, which is competitive with or exceeds most methods tested by [45], except for the “Zeus (Snort)—SBB” and “Zeus (Snort)—C4.5”, which both achieved a TPR of 98%. However, the model developed in this research minimized the false positive rate (FPR), maintaining a consistent FPR of 5%, significantly outperforming methods like “Zeus-1—SBB” (27%) and “Zeus-1—C4.5” (17%). This highlights the robustness of the user model in accurately identifying true positives while reducing false alarms, making it highly effective in real-world scenarios. Overall, the user model provides a balanced approach with a strong performance in both detection and minimizing errors, positioning it as a reliable alternative to [45].
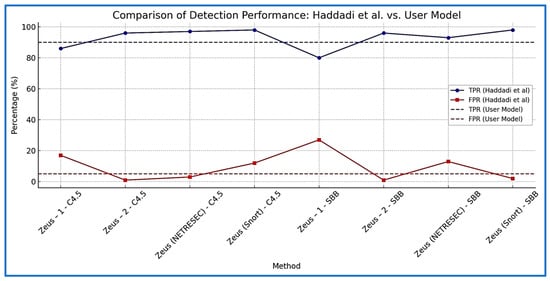
Figure 19.
Results of [45] compared to the results of this research.
6. Conclusions
The framework’s ability to identify banking malware and its variants were demonstrated by the empirical analysis conducted during this research. The research showed that the methodology and framework used for this study can identify both older and newer versions of the Zeus banking malware. It is possible that this approach can be used to detect a large number of banking malware variants without having to examine each one in order to understand its characteristics. This is because the framework and technique developed during this research identified key features that could be used and may also predict other banking malware variants. Also, this research showed that a reduced set of features can be used for detecting banking malware, and this should help to increase the performance and time required for training and testing machine learning or deep learning algorithms, especially for large datasets. This research will also benefit other researchers, as they should be able to adopt this approach in their own research and will have a good base to begin conducting experiments of a similar nature.
It may be possible to advance this research in the future by improving the methodology to include more banking malware variants, especially variants belonging to a different banking malware family. Additionally, more research may be conducted to identify other malware types and increase the prediction accuracy of these predictions. The results of this study may also be utilized by researchers to develop an intrusion detection system (IDS) that can identify a variety of malware, and by anti-virus manufacturers to support their development of malware detection tools. Once an infection has been identified, action can also be taken against malicious communications. Researchers can improve their work by using the results of this study to create their own malware prediction systems.
Funding
This research received no external funding.
Data Availability Statement
Data are contained within the article.
Conflicts of Interest
The author declares no conflicts of interest.
References
- Wadhwa, A.; Arora, N. A Review on Cyber Crime: Major Threats and Solutions. Int. J. Adv. Res. Comput. Sci. 2017, 8, 2217–2221. [Google Scholar]
- Morgan, S. Cybercrime to Cost the World 8 Trillion Annually in 2023. Cybercrime Magazine. 17 October 2022. Available online: https://cybersecurityventures.com/cybercrime-to-cost-the-world-8-trillion-annually-in-2023/ (accessed on 7 December 2024).
- Banking Malware Threats Surging as Mobile Banking Increases—Nokia Threat Intelligence Report. n.d. Nokia. Available online: https://www.nokia.com/about-us/news/releases/2021/11/08/banking-malware-threats-surging-as-mobile-banking-increases-nokia-threat-intelligence-report/ (accessed on 7 December 2024).
- Kuraku, S.; Kalla, D. Emotet malware—A banking credentials stealer. IOSR J. Comput. Eng. 2020, 22, 31–41. [Google Scholar]
- Etaher, N.; Weir, G.R.S.; Alazab, M. From zeus to zitmo: Trends in banking malware. In Proceedings of the 2015 IEEE Trustcom/BigDataSE/ISPA, Helsinki, Finland, 20–22 August 2015; Volume 1, pp. 1386–1391. [Google Scholar]
- Godfather Banking Trojan Spawns 1.2K Samples across 57 Countries. Darkreading.com. 2024. Available online: https://www.darkreading.com/endpoint-security/godfather-banking-trojan-spawns-1k-samples-57-countries (accessed on 16 January 2025).
- Nilupul, S.A. Evolution and Impact of Malware: A Comprehensive Analysis from the First Known Malware to Modern-Day Cyber Threats. Cyber Secur. 2024. [Google Scholar] [CrossRef]
- Mishra, R.; Butakov, S.; Jaafar, F.; Memon, N. Behavioral Study of Malware Affecting Financial Institutions and Clients. In Proceedings of the 2020 IEEE Intl Conf on Dependable, Autonomic and Secure Computing, Intl Conf on Pervasive Intelligence and Computing, Intl Conf on Cloud and Big Data Computing, Intl Conf on Cyber Science and Technology Congress (DASC/PiCom/CBDCom/CyberSciTech), Calgary, AB, Canada, 17–22 August 2020; pp. 79–86. [Google Scholar]
- Owen, H.; Zarrin, J.; Pour, S.M. A survey on botnets, issues, threats, methods, detection and prevention. J. Cybersecur. Priv. 2022, 2, 74–88. [Google Scholar] [CrossRef]
- Boukherouaa, E.B.; Shabsigh, M.G.; AlAjmi, K.; Deodoro, J.; Farias, A.; Iskender, E.S.; Mirestean, M.A.T.; Ravikumar, R. Powering the Digital Economy: Opportunities and Risks of Artificial Intelligence in Finance; International Monetary Fund: Washington, DC, USA, 2021. [Google Scholar]
- AMR. IT Threat Evolution in Q3 2022. Non-Mobile Statistics. Securelist.com. Kaspersky. 18 November 2022. Available online: https://securelist.com/it-threat-evolution-in-q3-2022-non-mobile-statistics/107963/ (accessed on 16 January 2025).
- Kazi, M.A.; Woodhead, S.; Gan, D. Comparing the performance of supervised machine learning algorithms when used with a manual feature selection process to detect Zeus malware. Int. J. Grid Util. Comput. 2022, 13, 495–504. [Google Scholar] [CrossRef]
- Punyasiri, D.L.S. Signature & Behavior Based Malware Detection. Bachelor’s Thesis, Sri Lanka Institute of Information Technology, Malabe, Sri Lanka, 2023. [Google Scholar]
- Gopinath, M.; Sethuraman, S.C. A comprehensive survey on deep learning based malware detection techniques. Comput. Sci. Rev. 2023, 47, 100529. [Google Scholar]
- Alaskar, H.; Saba, T. Machine learning and deep learning: A comparative review. In Proceedings of Integrated Intelligence Enable Networks and Computing: IIENC 2020; Springer: Singapore, 2021; pp. 143–150. [Google Scholar]
- Madanan, M.; Gunasekaran, S.S.; Mahmoud, M.A. A Comparative Analysis of Machine Learning and Deep Learning Algorithms for Image Classification. In Proceedings of the 2023 6th International Conference on Contemporary Computing and Informatics (IC3I), Gautam Buddha Nagar, India, 14–16 September 2023; Volume 6, pp. 2436–2439. [Google Scholar]
- Kazi, M.A.; Woodhead, S.; Gan, D. Comparing and analysing binary classification algorithms when used to detect the Zeus malware. In 2019 Sixth HCT Information Technology Trends (ITT); IEEE: Piscataway, NJ, USA, 2019; pp. 6–11. [Google Scholar]
- Bansal, M.; Goyal, A.; Choudhary, A. A comparative analysis of K-nearest neighbor, genetic, support vector machine, decision tree, and long short term memory algorithms in machine learning. Decis. Anal. J. 2022, 3, 100071. [Google Scholar] [CrossRef]
- Kazi, M.; Woodhead, S.; Gan, D. A contempory Taxonomy of Banking Malware. In Proceedings of the First International Conference on Secure Cyber Computing and Communications, Jalandhar, India, 15–17 December 2018. [Google Scholar]
- Falliere, N.; Chien, E. Zeus: King of the Bots. 2009. Available online: https://www.google.co.uk/url?sa=t&source=web&rct=j&opi=89978449&url=https://pure.port.ac.uk/ws/portalfiles/portal/42722286/Understanding_and_Mitigating_Banking_Trojans.pdf&ved=2ahUKEwizroXLwZqJAxU-VUEAHdgzKqEQFnoECDMQAQ&usg=AOvVaw1St11bbRwbhYj9IB4VdQv4 (accessed on 19 October 2024).
- Lelli, A. Zeusbot/Spyeye P2P Updated, Fortifying the Botnet. Available online: https://www.symantec.com/connect/blogs/zeusbotspyeye-p2p-updated-fortifying-botnet (accessed on 5 November 2019).
- Cluley, G. GameOver Zeus Malware Returns from the Dead. Graham Cluley. 14 July 2014. Available online: https://grahamcluley.com/gameover-zeus-malware/ (accessed on 16 January 2025).
- Brumaghin, E. Poisoning the Well: Banking Trojan Targets Google Search Results. [online] Cisco Talos Blog. 2017. Available online: https://blog.talosintelligence.com/zeus-panda-campaign/#More (accessed on 16 January 2025).
- Lamb, C. Advanced Malware and Nuclear Power: Past Present and Future; No. SAND2019-14527C; Sandia National Lab. (SNL-NM): Albuquerque, NM, USA, 2019. [Google Scholar]
- De Carli, L.; Torres, R.; Modelo-Howard, G.; Tongaonkar, A.; Jha, S. Botnet protocol inference in the presence of encrypted traffic. In Proceedings of the IEEE INFOCOM 2017-IEEE Conference on Computer Communications, Atlanta, GA, USA, 1–4 May 2017; pp. 1–9. [Google Scholar]
- Lioy, A.; Atzeni, A.; Romano, F. Machine Learning for Malware Characterization and Identification. Master’s Thesis, Politecnico di Torino, Turin, Italy, 2023. [Google Scholar]
- Paganini, P. HTTP-Botnets: The Dark Side of a Standard Protocol! Security Affairs. 22 April 2013. Available online: http://securityaffairs.co/wordpress/13747/cyber-crime/http-botnets-the-dark-side-of-an- (accessed on 16 January 2025).
- Sood, A.K.; Zeadally, S.; Enbody, R.J. An empirical study of HTTP-based financial botnets. IEEE Trans. Dependable Secur. Comput. 2014, 13, 236–251. [Google Scholar] [CrossRef]
- Niu, Z.; Xue, J.; Qu, D.; Wang, Y.; Zheng, J.; Zhu, H. A novel approach based on adaptive online analysis of encrypted traffic for identifying Malware in IIoT. Inf. Sci. 2022, 601, 162–174. [Google Scholar] [CrossRef]
- Black, P.; Gondal, I.; Layton, R. A Survey of Similarities in Banking Malware Behaviours. Comput. Secur. 2018, 77, 756–772. [Google Scholar] [CrossRef]
- Pilania, S.; Kunwar, R.S. Zeus: In-Depth Malware Analysis of Banking Trojan Malware. In Advanced Techniques and Applications of Cybersecurity and Forensics; Chapman and Hall/CRC: Boca Raton, FL, USA, 2024; pp. 167–195. [Google Scholar]
- CLULEY, Graham. Russian Creator of NeverQuest Banking Trojan Pleads Guilty in American Court. Hot for Security. 2019. Available online: https://www.bitdefender.com/en-us/blog/hotforsecurity/russian-creator-of-neverquest-banking-trojan-pleads-guilty-in-american-court/ (accessed on 16 January 2025).
- Fisher, D. Cridex Malware Takes Lesson from GameOver Zeus. Threatpost.com. Threatpost. 15 August 2014. Available online: https://threatpost.com/cridex-malware-takes-lesson-from-gameover-zeus/107785/ (accessed on 16 January 2025).
- Ilascu, I. Softpedia. 16 August 2014. Available online: https://news.softpedia.com/news/Cridex-Banking-Malware-Variant-Uses-Gameover-Zeus-Thieving-Technique-455193.shtml (accessed on 16 January 2025).
- Andriesse, D.; Rossow, C.; Stone-Gross, B.; Plohmann, D.; Bos, H. Highly resilient peer-to-peer botnets are here: An analysis of gameover zeus. In Proceedings of the 2013 8th International Conference on Malicious and Unwanted Software: “The Americas” (MALWARE), Fajardo, PR, USA, 22–24 October 2013; pp. 116–123. [Google Scholar]
- Sarojini, S.; Asha, S. Botnet detection on the analysis of Zeus panda financial botnet. Int. J. Eng. Adv. Technol. 2019, 8, 1972–1976. [Google Scholar] [CrossRef]
- Aboaoja, F.A.; Zainal, A.; Ghaleb, F.A.; Al-Rimy, B.A.S.; Eisa, T.A.E.; Elnour, A.A.H. Malware detection issues, challenges, and future directions: A survey. Appl. Sci. 2022, 12, 8482. [Google Scholar] [CrossRef]
- Chen, R.; Niu, W.; Zhang, X.; Zhuo, Z.; Lv, F. An effective conversation-based botnet detection method. Math. Probl. Eng. 2017, 2017, 4934082. [Google Scholar] [CrossRef]
- Jha, J.; Ragha, L. Intrusion detection system using support vector machine. Int. J. Appl. Inf. Syst. (IJAIS) 2013, 3, 25–30. [Google Scholar]
- Singla, S.; Gandotra, E.; Bansal, D.; Sofat, S. A novel approach to malware detection using static classification. Int. J. Comput. Sci. Inf. Secur. 2015, 13, 1–5. [Google Scholar]
- Wu, W.; Alvarez, J.; Liu, C.; Sun, H.M. Bot detection using unsupervised machine learning. Microsyst. Technol. 2018, 24, 209–217. [Google Scholar] [CrossRef]
- Yahyazadeh, M.; Abadi, M. BotOnus: An Online Unsupervised Method for Botnet Detection. ISeCure 2012, 4, 51–62. [Google Scholar]
- Soniya, B.; Wilscy, M. Detection of randomized bot command and control traffic on an end-point host. Alex. Eng. J. 2016, 55, 2771–2781. [Google Scholar] [CrossRef][Green Version]
- Azab, A. The effectiveness of cost sensitive machine learning algorithms in classifying Zeus flows. Int. J. Inf. Comput. Secur. 2022, 17, 332–350. [Google Scholar] [CrossRef]
- Haddadi, F.; Runkel, D.; Zincir-Heywood, A.N.; Heywood, M.I. On botnet behaviour analysis using GP and C4. 5. In Proceedings of the Companion Publication of the 2014 Annual Conference on Genetic and Evolutionary Computation, Vancouver, BC, Canada, 12–16 July 2014; pp. 1253–1260. [Google Scholar]
- Mohaisen, A.; Alrawi, O. Unveiling zeus: Automated classification of malware samples. In Proceedings of the 22nd International Conference on World Wide Web, Rio de Janeiro, Brazil, 13–17 May 2013; pp. 829–832. [Google Scholar]
- Wang, J.; Yang, Q.; Ren, D. An intrusion detection algorithm based on decision tree technology. In Proceedings of the 2009 Asia-Pacific Conference on Information Processing, Shenzhen, China, 18–19 July 2009; Volume 2, pp. 333–335. [Google Scholar]
- Sajjad, S.; Jiana, B. The use of Convolutional Neural Network for Malware Classification. In Proceedings of the 2020 IEEE 9th Data Driven Control and Learning Systems Conference (DDCLS), Liuzhou, China, 20–22 November 2020; pp. 1136–1140. [Google Scholar]
- Walker, A.; Sengupta, S. Malware family fingerprinting through behavioral analysis. In Proceedings of the 2020 IEEE International Conference on Intelligence and Security Informatics (ISI), Arlington, VA, USA, 9–10 November 2020; pp. 1–5. [Google Scholar]
- Ramakrishna, M.; Rama Satish, A.; Siva Krishna, P.S.S. Design and development of an efficient malware detection Using ML. In Proceedings of International Conference on Computational Intelligence and Data Engineering: ICCIDE 2020; Springer: Singapore, 2021; pp. 423–433. [Google Scholar]
- Ghafir, I.; Prenosil, V.; Hammoudeh, M.; Baker, T.; Jabbar, S.; Khalid, S.; Jaf, S. BotDet: A System for Real Time Botnet Command and Control Traffic Detection. IEEE Access 2018, 6, 38947–38958. [Google Scholar] [CrossRef]
- Agarwal, P.; Satapathy, S. Implementation of signature-based detection system using snort in windows. Int. J. Comput. Appl. Inf. Technol. 2014, 3, 3–93. [Google Scholar] [CrossRef]
- He, S.; Zhu, J.; He, P.; Lyu, M.R. Experience report: System log analysis for anomaly detection. In Proceedings of the 2016 IEEE 27th International Symposium on Software Reliability Engineering (ISSRE), Ottawa, ON, Canada, 23–27 October 2016; pp. 207–218. [Google Scholar]
- Zhou, J.; Qian, Y.; Zou, Q.; Liu, P.; Xiang, J. DeepSyslog: Deep Anomaly Detection on Syslog Using Sentence Embedding and Metadata. IEEE Trans. Inf. Forensics Secur. 2022, 17, 3051–3061. [Google Scholar] [CrossRef]
- Khraisat, A.; Gondal, I.; Vamplew, P.; Kamruzzaman, J. Survey of intrusion detection systems: Techniques, datasets and challenges. Cybersecurity 2019, 2, 20. [Google Scholar] [CrossRef]
- Sharma, P.; Said, Z.; Memon, S.; Elavarasan, R.M.; Khalid, M.; Nguyen, X.P.; Arıcı, M.; Hoang, A.T.; Nguyen, L.H. Comparative evaluation of AI-based intelligent GEP and ANFIS models in prediction of thermophysical properties of Fe3O4-coated MWCNT hybrid nanofluids for potential application in energy systems. Int. J. Energy Res. 2022, 46, 19242–19257. [Google Scholar] [CrossRef]
- Choi, R.Y.; Coyner, A.S.; Kalpathy-Cramer, J.; Chiang, M.F.; Campbell, J.P. Introduction to machine learning, neural networks, and deep learning. Transl. Vis. Sci. Technol. 2020, 9, 14. [Google Scholar] [PubMed]
- Ahsan, M.; Nygard, K.E.; Gomes, R.; Chowdhury, M.M.; Rifat, N.; Connolly, J.F. Cybersecurity Threats and Their Mitigation Approaches Using Machine Learning—A Review. J. Cybersecur. Priv. 2022, 2, 527–555. [Google Scholar] [CrossRef]
- Elmachtoub, A.N.; Liang, J.C.N.; McNellis, R. Decision trees for decision-making under the predict-then-optimize framework. In Proceedings of the International Conference on Machine Learning, Virtual, 12–18 July 2020; pp. 2858–2867. [Google Scholar]
- Liberman, N. Decision Trees and Random Forests. Towards Data Science. 27 January 2017. Available online: https://towardsdatascience.com/decision-trees-and-random-forests-df0c3123f991 (accessed on 16 January 2025).
- Demirović, E.; Lukina, A.; Hebrard, E.; Chan, J.; Bailey, J.; Leckie, C.; Ramamohanarao, K.; Stuckey, P.J. Murtree: Optimal decision trees via dynamic programming and search. J. Mach. Learn. Res. 2022, 23, 1–47. [Google Scholar]
- Schonlau, M.; Zou, R.Y. The random forest algorithm for statistical learning. Stata J. 2020, 20, 3–29. [Google Scholar] [CrossRef]
- Oshiro, T.M.; Perez, P.S.; Baranauskas, J.A. How many trees in a random forest? In Machine Learning and Data Mining in Pattern Recognition, Proceedings of the 8th International Conference, MLDM 2012, Berlin, Germany, 13–20 July 2012; Proceedings 8; Springer: Berlin/Heidelberg, Germany, 2012; pp. 154–168. [Google Scholar]
- Halder, R.K.; Uddin, M.N.; Uddin, M.A.; Aryal, S.; Khraisat, A. Enhancing K-nearest neighbor algorithm: A comprehensive review and performance analysis of modifications. J. Big Data 2024, 11, 113. [Google Scholar] [CrossRef]
- Suyal, M.; Goyal, P. A review on analysis of k-nearest neighbor classification machine learning algorithms based on supervised learning. Int. J. Eng. Trends Technol. 2022, 70, 43–48. [Google Scholar] [CrossRef]
- Aggarwal, C.C. (Ed.) Data Classification; Springer International Publishing: New York, NY, USA, 2015. [Google Scholar]
- Kazi, M.A.; Woodhead, S.; Gan, D. Detecting Zeus Malware Network Traffic Using the Random Forest Algorithm with Both a Manual and Automated Feature Selection Process. In IOT with Smart Systems: Proceedings of ICTIS 2022, Volume 2; Springer Nature Singapore: Singapore, 2022; pp. 547–557. [Google Scholar]
- Chung, J.; Teo, J. Single classifier vs. ensemble machine learning approaches for mental health prediction. Brain Inform. 2023, 10, 1. [Google Scholar] [CrossRef] [PubMed]
- Salur, M.U.; Aydın, İ. A soft voting ensemble learning-based approach for multimodal sentiment analysis. Neural Comput. Appl. 2022, 34, 18391–18406. [Google Scholar] [CrossRef]
- Jabbar, H.G. Advanced Threat Detection Using Soft and Hard Voting Techniques in Ensemble Learning. J. Robot. Control (JRC) 2024, 5, 1104–1116. [Google Scholar]
- Shomiron. Zeustracker. Available online: https://github.com/dnif-archive/enrich-zeustracker (accessed on 25 July 2022).
- Stratosphere. Stratosphere Laboratory Datasets. Available online: https://www.stratosphereips.org/datasets-overviewRetrieved (accessed on 20 September 2024).
- Abuse.ch. Fighting Malware and Botnets. Available online: https://abuse.ch/ (accessed on 13 May 2022).
- Haddadi, F.; Zincir-Heywood, A.N. Benchmarking the effect of flow exporters and protocol filters on botnet traffic classification. IEEE Syst. J. 2014, 10, 1390–1401. [Google Scholar] [CrossRef]
- Kasongo, S.M.; Sun, Y. A deep learning method with filter based feature engineering for wireless intrusion detection system. IEEE Access 2019, 7, 38597–38607. [Google Scholar] [CrossRef]
- Miller, S.; Curran, K.; Lunney, T. Multilayer perceptron neural network for detection of encrypted VPN network traffic. In Proceedings of the 2018 International Conference on Cyber Situational Awareness, Data Analytics and Assessment (Cyber SA), Glasgow, UK, 11–12 June 2018; pp. 1–8. [Google Scholar]
- Kazi, M.A.; Woodhead, S.; Gan, D. An Investigation to Detect Banking Malware Network Communication Traffic Using Machine Learning Techniques. J. Cybersecur. Priv. 2023, 3, 1–23. [Google Scholar] [CrossRef]
- Nasiri, H.; Alavi, S.A. A Novel Framework Based on Deep Learning and ANOVA Feature Selection Method for Diagnosis of COVID-19 Cases from Chest X-Ray Images. Comput. Intell. Neurosci. 2022, 2022, 4694567. [Google Scholar] [CrossRef] [PubMed]
- Alshanbari, H.M.; Mehmood, T.; Sami, W.; Alturaiki, W.; Hamza, M.A.; Alosaimi, B. Prediction and classification of COVID-19 admissions to intensive care units (ICU) using weighted radial kernel SVM coupled with recursive feature elimination (RFE). Life 2022, 12, 1100. [Google Scholar] [CrossRef] [PubMed]
- Kavya, D. Optimizing Performance: SelectKBest for Efficient Feature Selection in Machine Learning. Medium. 16 February 2023. Available online: https://medium.com/@Kavya2099/optimizing-performance-selectkbest-for-efficient-feature-selection-in-machine-learning-3b635905ed48 (accessed on 16 January 2025).
- dos Santos, C.H.M.; de Lima, S.M.L. XAI-driven antivirus in pattern identification of citadel malware. J. Comput. Sci. 2024, 82, 102389. [Google Scholar] [CrossRef]
- Liu, Z.; Wang, C.; Li, G. Feature Selection Algorithm Based on CFS Algorithm Emphasizing Data Discrimination. preprint 2023. [Google Scholar] [CrossRef]
- St, L.; Wold, S. Analysis of variance (ANOVA). Chemom. Intell. Lab. Syst. 1989, 6, 259–272. [Google Scholar]
- Luan, H.; Tsai, C.C. A review of using machine learning approaches for precision education. Educ. Technol. Soc. 2021, 24, 250–266. [Google Scholar]
- Davis, J.; Goadrich, M. The relationship between Precision-Recall and ROC curves. In Proceedings of the 23rd International Conference on Machine Learning, Pittsburgh, PA, USA, 25–29 June 2006; pp. 233–240. [Google Scholar]
- Fourure, D.; Javaid, M.U.; Posocco, N.; Tihon, S. Anomaly detection: How to artificially increase your f1-score with a biased evaluation protocol. In Joint European Conference on Machine Learning and Knowledge Discovery in Databases; Springer International Publishing: Cham, Switzerland, 2021; pp. 3–18. [Google Scholar]
- Visa, S.; Ramsay, B.; Ralescu, A.L.; Van Der Knaap, E. Confusion matrix-based feature selection. Maics 2011, 710, 120–127. [Google Scholar]
Disclaimer/Publisher’s Note: The statements, opinions and data contained in all publications are solely those of the individual author(s) and contributor(s) and not of MDPI and/or the editor(s). MDPI and/or the editor(s) disclaim responsibility for any injury to people or property resulting from any ideas, methods, instructions or products referred to in the content. |
© 2025 by the author. Licensee MDPI, Basel, Switzerland. This article is an open access article distributed under the terms and conditions of the Creative Commons Attribution (CC BY) license (https://creativecommons.org/licenses/by/4.0/).