1. Introduction
With the ubiquity and importance of information and communication technology (ICT) systems nowadays, organizations always have a primary concern that there may be vulnerabilities existing in their working environments that can compromise organizational data, disrupt business services, and jeopardize trust. It is therefore important for organizations to have shreds of evidence that show the security mechanisms are correctly and effectively put in place and carry out their intended functions to prevent, detect, or divert a risk or to reduce its impact on a system’s assets [
1]. Security assurance (SA) is a technique that helps organizations to appraise the trust and confidence that a system can be operated correctly and securely [
2]. In detail, SA evaluates, reports, and monitors the security posture of ICT systems to see whether the security features, practices, procedures, and architecture accurately mediate and enforce the security policy before being disseminated or delivered to the target audience [
3]. SA, however, is a complicated concept with many different functions such as technical countermeasures, organizational policies, security procedures, etc. Therefore, measuring the level of confidence is a non-trivial exercise in SA, and making reasonable decisions and prioritizations about the pipelined security tasks is ever more so.
To foster effective SA, there must be systematic techniques to reflect the fact that the system meets its security requirements and, at the same time, is resilient against security vulnerabilities and failures [
2]. Quantitative SA evaluation applies computational and mathematical techniques for deriving a set of SA metrics (hereinafter “metrics”) to express the assurance level that a system reaches [
4]. Researchers have identified advantages of quantitative methods in SA evaluation, including (1) providing models with useful information about the behavior of ICT systems in different contexts, (2) expressing the security with less complicated and more coherent mechanisms, and (3) supporting decision making by using and comparing metrics [
5]. Utilizing metrics to capture and evaluate the security posture of ICT systems has gained attention in recent years. Such metrics are intended to deliberate the assurance aspect of the system security to reliably transfer information [
6,
7]. A key factor in the success of quantitative SA evaluation is, therefore, the development of appropriate metrics that can consequently provide meaningful information used to answer essential questions. For example, to what extent does the system fulfill the requirements of security standards? How is the presence of vulnerabilities detected, and what is the priority to address first? By analyzing the answers, security analysts and stakeholders can examine the security-related issues and, consequently, identify what areas require improvements and find a way to organize the resources efficiently.
To facilitate proper decision making in such scenarios, there is a need for more methodological methods in advancing toward developing metrics to support quantitative SA evaluation. Despite existing work that is underway, scarce work has described how to combine SA evaluation while taking into account both metrics modeling and analysis. The aim of this paper, therefore, is to complement this research gap by proposing systematic approaches in quantitative SA as well as metric development, including the following components: (1) a quantitative SA metamodel for describing the structure of metrics calculation, (2) a comprehensive set of metrics and the corresponding computation algorisms, and (3) illustrated SA analytics for presenting and interpreting metrics. The rest of this paper is organized as follows. In
Section 2, we provide an overview of related work. Our methodological approach for quantitative SA evaluation is introduced in
Section 3.
Section 4 presents the illustrative security assurance analytics with the proposed metric. Lastly, the conclusion is presented in
Section 5.
2. Related Work
Research on security assurance and evaluation methods is vast. In the past, various frameworks and standards have been developed for evaluating security. One of the most representative works is Common Criteria (CC) [
8]. The CC is an international standard (ISO/IEC 15408) for the security evaluation of IT products. It provides a set of guidelines and specifications that can facilitate the specification of security functional requirements and security assurance requirements. With the strict, standardized, and repeatable methodology, the CC assures implementation, evaluation, and operation of a security product at a level that is commensurate with the operational environments. Despite being a standard, the drawback of such a comprehensive methodology is that the documentation is complicated and needs a large effort on preparation for the evaluation of a product or service against a specific CC assurance level [
9,
10]. Some other examples of security maturity models are the Building Security In Maturity Model (BSIMM) [
11] and OWASP Software Assurance Maturity Model (OpenSAMM) [
12] and OWASP Application Security Verification Standard (ASVS) [
13], which are provided for the software security domain. BSIMM is a study of how different organizations deal with software security, which resulted in a software security framework that is organized in 116 activities and 12 practices. Like BSIMM, OpenSAMM is an open software security framework developed by OWASP [
14], which provides guidelines on which software security practices should be used and how to assess them. Such maturity models provide frameworks, especially in a qualitative fashion, to evaluate the security posture of the process and culture practiced in an organization. OWASP ASVS provides guidelines for web application security testing and corresponding security controls. It also lists a set of security assurance requirements and an associated qualitative evaluation scheme that consists of three maturity levels.
In the past, however, few efforts have been made to provide a generic approach to quantify the security posture to support security assurance evaluation systematically. Several papers in this research area are highlighted below.
Liu and Jin [
15] conducted a study to analyze the security threats and attacks on the WLAN network architecture and developed a security assessment and enhancement system. This system is divided into two subsystems, a security assessment system and a security enhancement system. The security assessment system is based on fuzzy logic and analyzes the vulnerability of the physical layer (PHY) and medium access control (MAC) layer, key management layer, and identity authentication layer. This approach provides a quantitative value of the security level based on security indexes, whereas the security enhancement system is an integrated, trusted WLAN framework based on the trusted network connection that helps to improve the security level of WLAN. Agrawal et al. [
16] used the fuzzy analytical hierarchy process (Fuzzy-AHP) methodology to evaluate usable security. They also assessed the impact of security on usability and the impact of usability on security using a quantitative approach. Katt and Prasher [
2] proposed a general-purpose security assurance framework and its assurance evaluation process. The basic components of the proposed framework included are the security assurance scheme, security assurance target, security assurance metrics, security assurance technique, evaluation evidence, and assurance level. The framework and process depend on quantitative security assurance metrics that were developed too. They discussed the advantages of quantitative security assurance metrics considering both the security requirements and vulnerabilities.
Furthermore, several researchers have been working on SA metrics development and calculation. For instance, Pham and Riguidel [
17] introduced an aggregational method that can be applied in the calculation of the security assurance value of the whole system when combining several entities, which have been evaluated independently. The effects of the emergent relations are taken into account in the calculation of the security assurance value of an attribute in the context of a system. Ouedraogo et al. [
18] take advantage of quantitative risk measurement methodologies to develop metrics for IT infrastructure security assurance evaluation along with aggregation techniques, i.e., the assurance level of a system is a specific combination of assurance levels from underlying components. The main algorithms used for the operational aggregation include the recursive minimum algorithm, the recursive maximum algorithm, and the recursive weighted sum algorithm. Moreover, to help businesses address service security assurance, Ouedraogo [
19] presents a set of metrics that can estimate the level of confidence for both consumers and providers. The defined metrics can be categorized into three main areas: security-related metrics (existence, correctness, etc.), security verification-related metrics (coverage of verification, depth of verification, etc.), and privacy-related metrics (data confidentiality and service consumer anonymity).
Some SA metrics methodologies use evidence and arguments over security measure adequacy in a security case to build an acceptable level of confidence in system security. For instance, Rodes et al. [
20] propose the use of security arguments by facilitating security metrics that need to be complete and valid and propose a framework for argument assessment that generates and interprets security metrics on the example of software systems. Within the framework, security is quantified in terms of a level of belief, i.e., a confidence level of arguments. Several approaches take advantage of patterns to assess and evaluate system security. In this area, for instance, Heyman et al. [
21] associate security metrics with patterns, and exploit the relationships between security patterns and security objectives to enable the interpretation of measurements. Fernandez et al. [
22] evaluate the security of architecture by considering different misuse patterns. They propose to analyze how many misuse patterns for architecture can be countered when adding security patterns to improve the architecture. The calculated value then represents the level of security for the applied security patterns. Lastly, Villagrán-Velasco et al. [
23] evaluate system security based on threat enumeration and on verifying if these threats are or are not controlled in a specific software architecture. They also consider the effect of policies and the use of weights according to their impact.
3. Our Methodological Approach
Our methodological approach is divided into two parts: a modeling approach for quantitative SA evaluation, and the proposed metrics as well as the corresponding calculation rules based on the SA evaluation model.
3.1. Security Assurance Evaluation Model
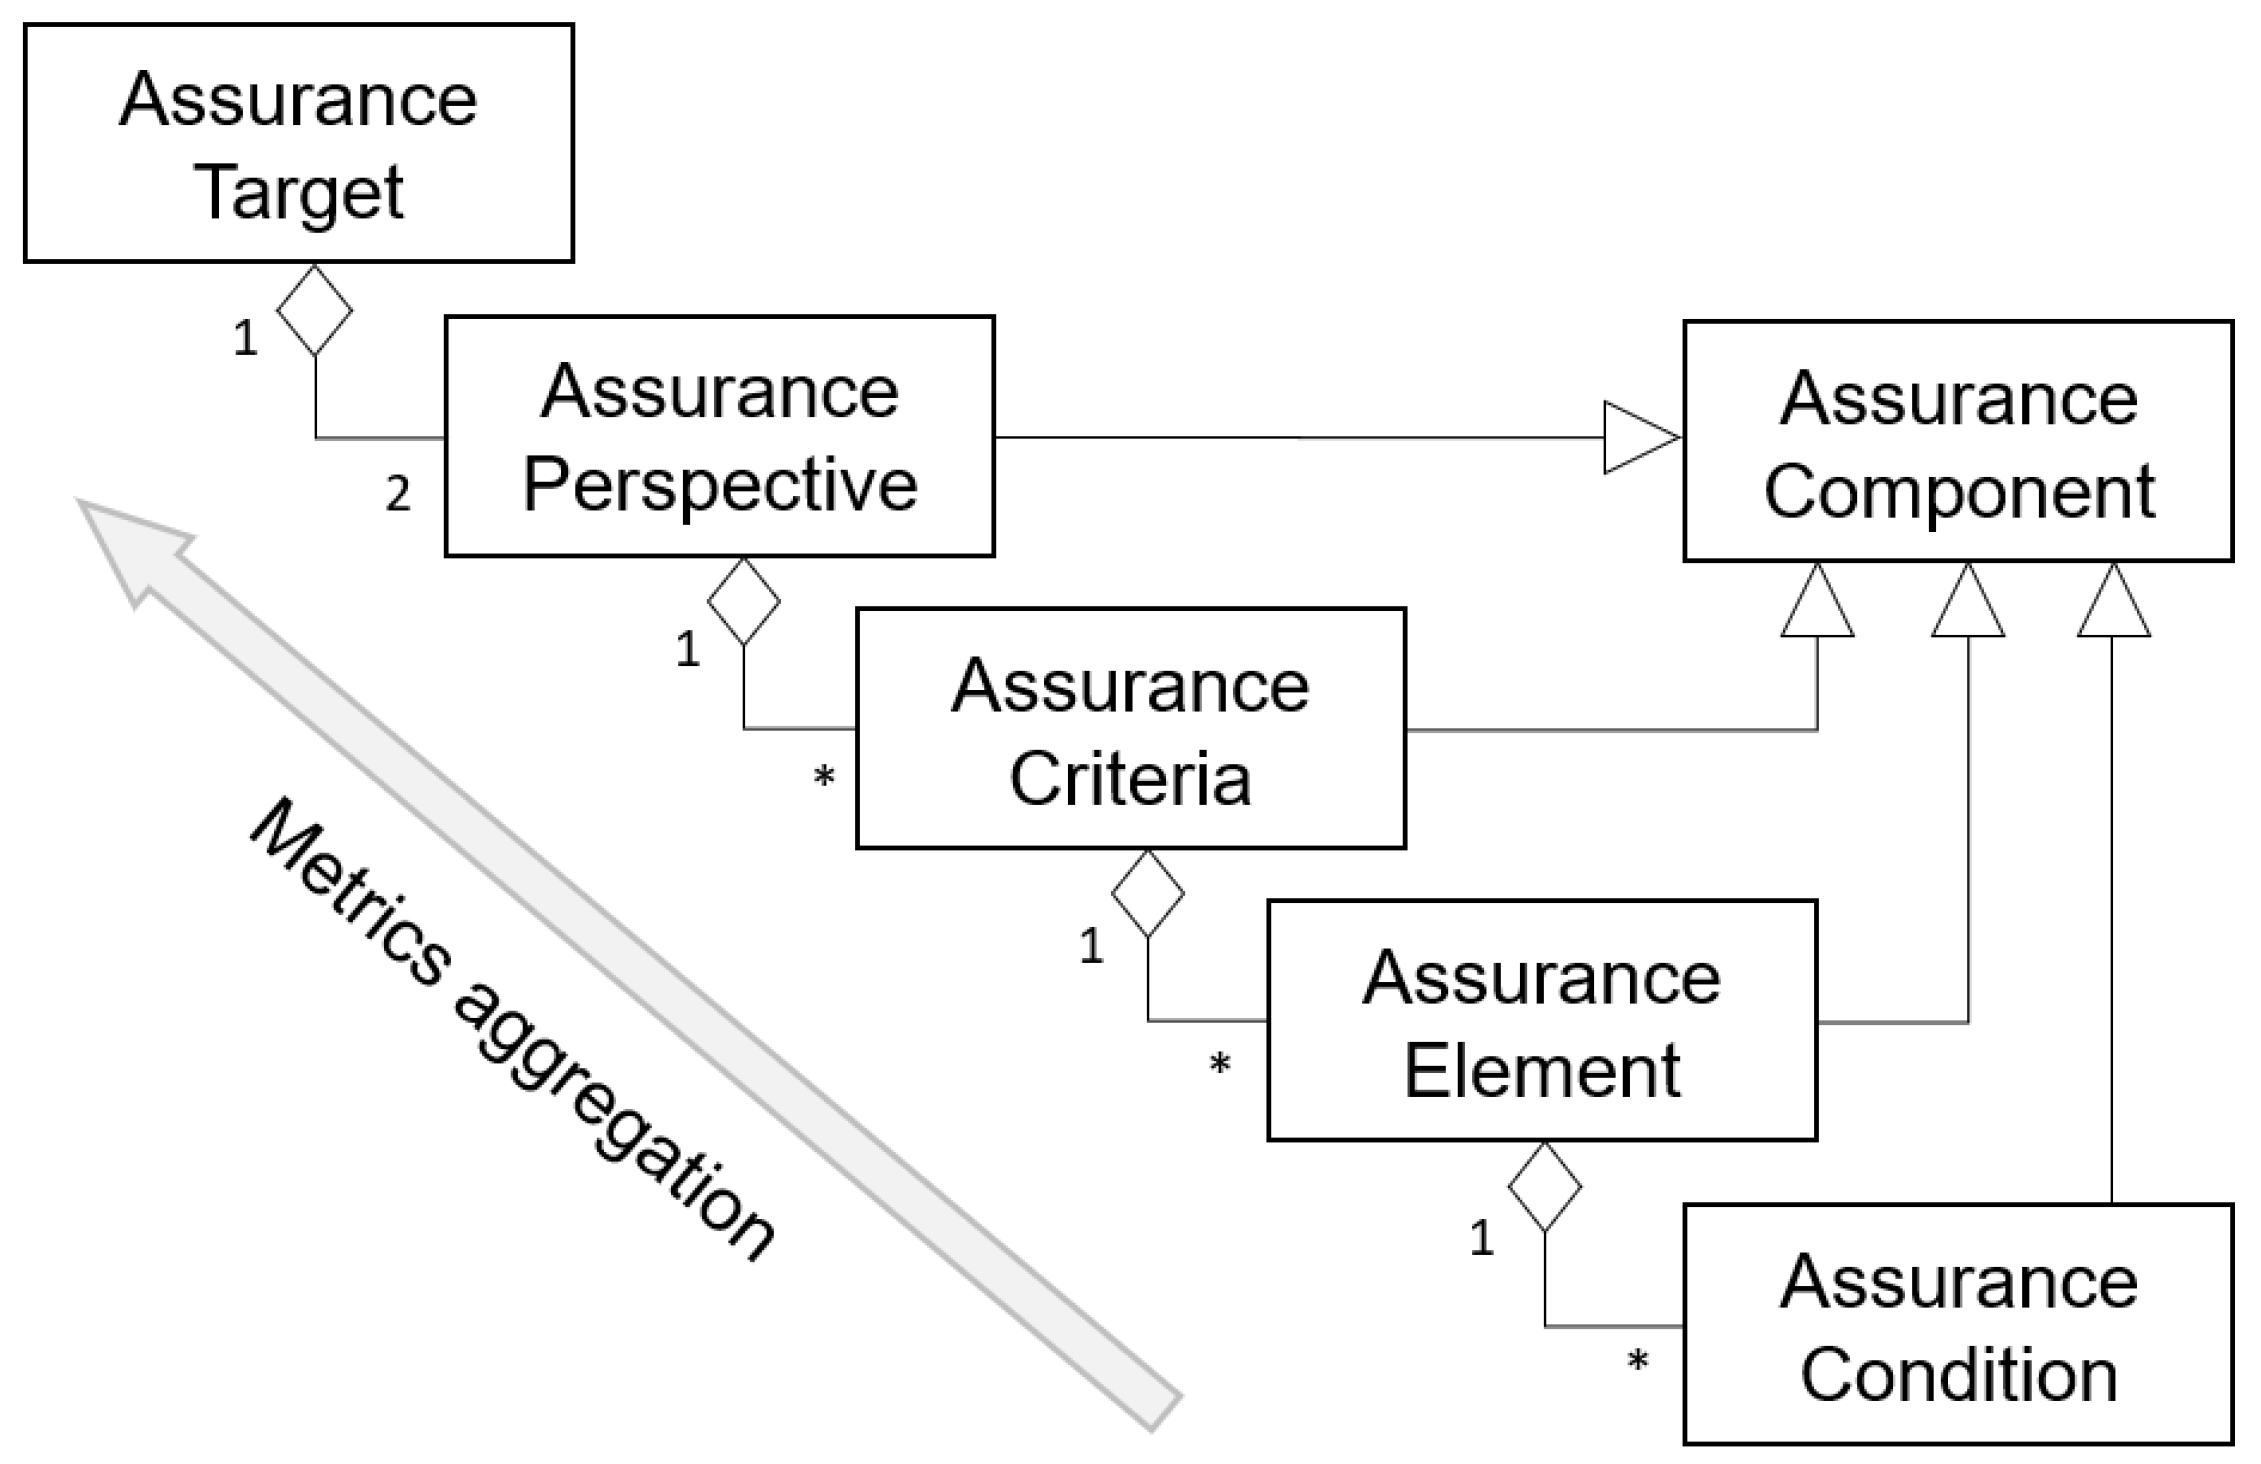
Given a complex IT system, direct measurement of its assurance level is generally not possible. Thus, the overall goal of the SA modeling is to transform SA evaluation into measurable works. In this respect, our modeling approach follows a five-level hierarchy, in which each node represents a distinct assurance component, as shown in
Figure 1. In our model, security assurance components constitute the essential parts of assurance metrics calculation. The assurance target is the product or system that is the subject under security assessment, such as an information system, part of a system or product, or a cloud ecosystem. The evaluation serves to validate claims made about the assurance target. One core principle behind our proposal is that the confidence in the system security is quantified through two critical assurance perspectives: the protection side and the weakness side of the assurance target. Each perspective is composed of one or more criteria, and each criterion is composed of one or several elements until reaching the lowest level (i.e., assurance conditions). Thereafter, the overall score of an assurance target is estimated from the test results of the assurance conditions and the criteria/elements of the evaluation model applied. These estimates are aggregated continuously in conjunction with predefined algorithms to arrive at a more fine-tuned final estimate at the top-level assurance target.
The concepts for each component are described below. For simplicity of presentation, we use “assurance” in short to represent the term “security assurance” for all component names in the model.
Assurance Perspective. Assurance perspectives describe the interrelation or relative significance in which an assurance target is evaluated. In our approach, two perspectives on cyber security are taken in the evaluation: security requirements and vulnerabilities. The former addresses the positive side of system security while the latter considers the negative side that involves looking inside the system for structural flaws and weaknesses. We assume that, on the one hand, fulfilling security requirements through implementing countermeasures and checking its correct functionality will give protection against unintentional errors. On the other hand, with proper identification and addressing of vulnerabilities, it can go a long way toward reducing the probability and impact of threats materializing in the system. We argue that even if security mechanisms are properly elucidated at the requirement stage, they could result in weakness if they are inappropriately implemented or deployed. Consequently, while evaluating security assurance, security requirement improves the assurance posture; contrariwise, the existence of vulnerabilities leads to a reduction in the assurance level. Such concepts will be inherited by the rest of the assurance components.
Assurance Criteria. Assurance criteria are the specific properties that will be selected, tested, and measured to confirm the sufficiency of system security to be offered to users. The term assurance criteria as used in this model refers to a higher, more abstract level of meaning that can be thought of as a standard in the assurance target’s application domain. These criteria are part of the “target” that the work is planned to achieve (or eliminate in the perspective of vulnerabilities). In our quantitative security assurance approach, assurance criteria play an especially important role in the assurance evaluation, which provides a basis for comparison among different assurance targets; a reference point against which another system can be evaluated. In
Table 1, we give exemplary criterion sets for an assurance target in the domain of web applications, in which the content is extracted from the OWASP Application Security Verification Standard (ASVS) [
13] (in defining security requirement criteria) and OWASP Top 10 [
24] (in defining vulnerability criteria). The former provides a rigorous list of security requirements for testers, developers, security professionals, and consumers, while the latter lists the ten most common web application security risks nowadays.
We argue that the foundation for quantifying and analyzing metrics in SA is to understand what “criteria” are of interest and of “how important” each is expected to be. The assurance criteria are formulated depending on the objectives and functions of the assurance target. Concerning security, not all security requirements should be treated as equally important [
2]. Likewise, the vulnerabilities in need of fixing must be prioritized based on which ones pose the most immediate danger. To reflect that, one must specify a numeric factor for each assurance criterion: “Weight” for security requirement criteria and “Risk” for vulnerability criteria. On the one hand, the weighing factor emphasizes the contribution of particular aspects of security requirements over others to the security assurance result, thereby highlighting those aspects in comparison to others in the SA analysis. That is, rather than each security requirement (criteria) in the whole dataset contributing equally to the result, some of the data are adjusted to make a greater contribution than others. The weight factor expresses how security is emphasized in the assurance target and it must be caried out based on the application context. For example, if authentication is necessary to make a specific API secure, that security requirement should be given particular importance, hence the weight is also high. On the other hand, from the perspective of vulnerabilities, the term risk can be defined as the probability and the consequence of an unwanted incident caused by existing vulnerabilities. That is, a risk is an impact of uncertainty on systems, organizations, etc. Several frameworks and methods have been developed for risk analysis, and organizations may choose their method depending on the type of risks they encounter, or their business area, for example, common vulnerability scoring system (CVSS) [
25] and damage, reproducibility, exploitability, affected users, and discoverability (DREAD) [
26].
Assurance Element. Assurance criteria are narrated in detail by a set of assurance elements. As in assurance criteria, assurance elements are divided into security requirement elements and vulnerability elements. The former represents requirement items needed to be fulfilled, while the latter indicate a particular kind of vulnerability potentially existing in the assurance target.
Table 2 lists the exemplary elements with the corresponding assurance criteria, extracted from OWASP ASVS as well.
Assurance Condition. An assurance condition describes the underlying constraints (or terms) of assurance elements that need to be taken into consideration in assurance evaluation. It is specifically defined according to the organizational contexts, which include special circumstance items, such as the deployment environment, the organization’s current state, and the security concerns. In addition, assurance conditions can also be represented as test cases performed to check to what extent the security requirements’ conditions and the vulnerabilities’ conditions are true.
Table 3 represents the exemplary security requirement conditions under the element of “Password Security”.
3.2. Assurance Metrics Calculation: The Core Concept
SA evaluation is a systematic process of assigning meaningful scores to the assurance target that indicate its security posture [
27]. The higher the value, the better the trustworthiness of the system product against its security mechanisms. For deriving the final score, in our approach, metrics of assurance components are computed using a bottom-up approach, which involves the estimation of at the lowest possible level of detail. It is essential to be able to define what is meant and how to measure it when SA is evaluated. We suggest an aggregation method for doing so by using the model as the structure for estimating values related to SA into a single measure.
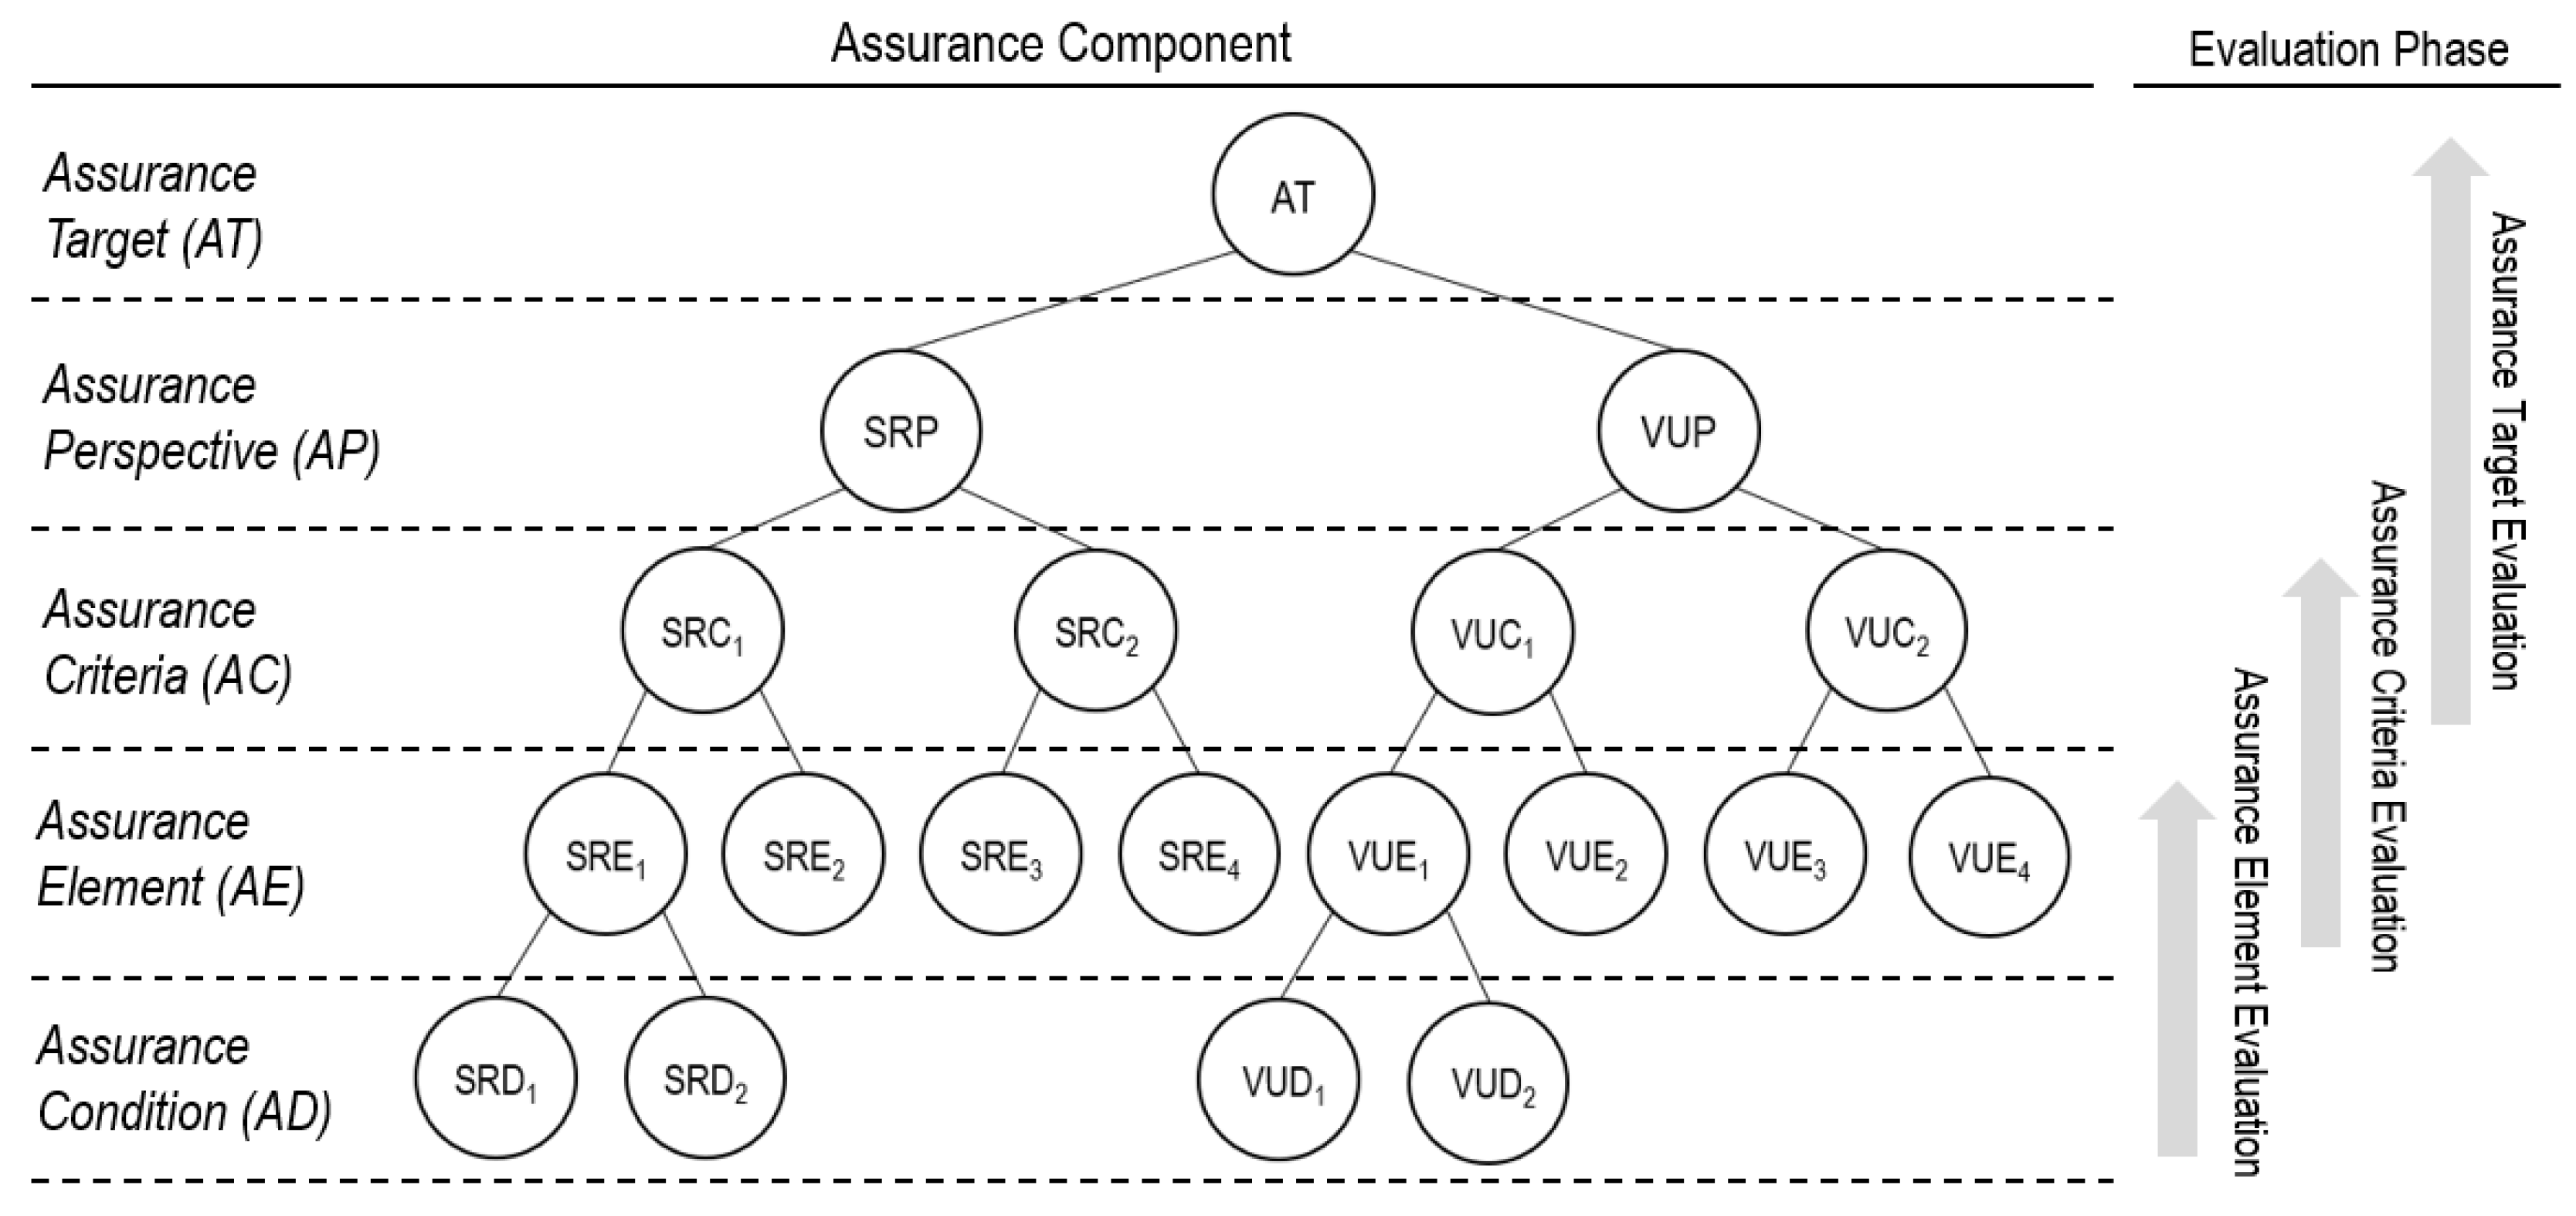
Figure 2 depicts the hierarchical structure of the SA evaluation based on the proposed SA evaluation model, while
Table 4 describes each notion. Our quantitative approach divides the SA evaluation into three sequential phases: the first phase of evaluation is responsible for the assessment of the assurance elements; the second phase for the evaluation of the assurance criteria; and the third for the assurance perspectives, in turn, of the overall assurance level of the assurance target. With the term “evaluation”, we refer to the assignment of a metric to each component in the model. Metrics represent measurement or evaluation indexes that are given attributes to satisfy the security assurance evaluation. The three-phase quantitative process is discussed in the following subsections.
3.2.1. Assurance Element Evaluation Phase
The first phase of assurance evaluation is responsible for the assessment of the assurance elements of the SA evaluation model, from the quantification of the corresponding assurance conditions. In our test-based methodology, each assurance condition is mapped to one test case to decide fulfillment scores (for SRD) or existence scores (for VUD). For SRD, results for test cases are primarily pass or fail, where a pass indicates that the corresponding SRD is “Fully fulfilled” (fulfillment score = 1), while a failure of a test case means that the SRD is “Not fulfilled” (fulfillment score = 0). However, in some test cases, the result can be considered a ‘Partial fulfillment’. Partial fulfillment means that the actual result matches its expected result, however, there are more rigorous criteria/specifications needing to be met in order to strongly claim the full fulfillment. In addition, an unnecessary (or superfluous) exception/message that is caught during the test-case execution can be also treated as a partial fulfillment [
28,
29]. Such a test execution state is usually applied in the context of manual testing, heavily reliant on the tester’s judgment [
30]. For example, it is assumed that the SHA-1 encryption algorithm is found in testing the SRD “The system stores account password in approved encrypted formats”. In this case, even though there is evidence showing the password is encrypted, we see this test case to be a partial pass, as the SHA-1 is not considered a strong-enough password encryption function [
31]. Therefore, the assurance score of the SRD is assigned a value of 0.5, indicating “Partially fulfilled”. Similarly, the existence score for VUD has two value options, where 0 means no vulnerability indicated by the test results, and 1 represents the existence of the vulnerability.
The scores for SRE and VUE are calculated separately. For an SRE, once the fulfillment scores are decided in all associated SRDs, its score can be calculated. We define a metric
ActSRD as a measurement to reflect the actual (calculated) score of SRE. The value of
ActSRE is obtained by averaging the fulfillment scores of the related SRD. Since the SRDs we add together are similar ones, by using the “Average” function, we can consider all the relevant items to derive a representative score of the whole dataset. Additionally, the assurance conditions are designed in such a way that each condition will cover one perspective of the assurance element. Failing the whole element if one condition fails is not fair for the rest of the conditions. The following formula represents the calculation of the
i-th SRE score (represented as
ActSREi):
where:
ActSRDij: the actual (fulfillment) score of the j-th SRD associated with the i-th SRE;
n: the number of SRDs associated with the i-th SRE.
Similarly, the formula used for calculating the actual VUE score (
ActVUE) is defined as the average of the corresponding VUD existence score, represented below:
where:
: the existence score of the j-th VUD associated with the i-th VUC;
n: the number of VUDs associated with the i-th VUE.
3.2.2. Assurance Criteria Evaluation Phase
The second phase of assurance evaluation is responsible for the calculation of assurance criteria scores. Based on the previous discussion, the actual score of the
i-th SRC, represented by
ActSRCi, is measured based on the average value of its respective SRE and obtained by multiplying a weight factor to express the levels of importance. The scale of the weight factor ranges from 1 to 10, where 1 is assigned to SRCs that are least essential, while 10 is the maximum expressing a vital requirement. The formula to calculate
ActSRCi is defined as:
where:
ActSRCij: the actual score of the j-th SRE associated with the i-th SRE;
WghSRCi: the weight factor that corresponds to the i-th SRC;
n: the number of SREs associated with the i-th SRC.
Based on Equation (3), it can be derived that ActSRC has a maximum value, equaling its weight factor when all the underlying security requirements are fulfilled (i.e., ActSREi = 1).
The assurance metric
ActVUCi, represented by the
i-th vulnerability criteria, can be calculated using the average value of correspondent VUEs, considering the risk factor of vulnerabilities as well. It has to be mentioned that the risk is usually derived using the standard risk model:
Risk. With this flexible model, the scale of the resulting risk value could range from 0 to 10, where 0 represents that the corresponding VUC is least likely to fail, while 10 is considered the maximum risk. The formula to derive the
i-th
ActVUC is defined as:
where:
ActVUCij: the actual score of the j-th VUE associated with the i-th SRC;
RskVUCi: the risk that corresponds to the i-th VUC;
n: the number of VUEs associated with the i-th VUC.
3.2.3. Assurance Target Evaluation Phase
The third phase of evaluation is responsible for the calculation of the overall assurance score for the assurance target. This is achieved by aggregating the score of the assurance criteria and perspectives at the following three levels of calculation.
Level 1. The first level is to obtain a summative assurance score for each assurance perspective by accumulating the correspondent assurance criteria. For the assurance perspective SRP, we define a metric
ActSRP to present the overall security requirement score of the assurance target. The formula is as follows:
where:
ActSRCi: the actual score of the i-th SRC;
n: the number of SRCs.
Correspondingly, the formula used for the calculation of the overall vulnerability score is presented below:
where:
ActVUCi: the assurance score of the i-th vulnerability criterion;
n: the number of VUCs.
Level 2. At the second level, the security assurance score (
ActSAS) of the assurance target is derived by using the difference between the security requirement score (
ActSRP) and vulnerability score (
ActVUP). Thus, the formula is as follows:
Level 3. It can be noticed that the scale of
ActSAS is highly influenced by the number of security requirements as well as vulnerabilities included in the evaluation model (Equations (5) and (6)). This leads to a variable range of assurance scores among different assurance targets and, further, makes it difficult to interpret to make decisions among various systems. In this regard,
ActSAS must be normalized to a common scale for a more comprehensive and understandable value, named the assurance level (
SAL). We adopt the min–max normalization method [
32], which preserves the relationships among the original data values. This method will encounter an out-of-bounds error if a future input case for normalization falls outside the first data range for the attribute. The formula of this generic normalization method is presented as follows:
where:
minA and maxA: the minimum and maximum values of an attribute;
newminA and newmaxA and: the new minimum and maximum values after normalization;
v: the old value of an attribute;
v’: the new value after normalization.
The convention we follow for the
SAL is that it lies in the interval between 0 and 10, where 0 corresponds to the worst possible level of security assurance, while 10 to an excellent assurance level. Thus, the formula for the metric
SAL can be simply defined as:
.
To derive MaxSAS, we can refer to Equation (7), from which we know that SAS can be maximum when the following two conditions are met:
1. all security requirements are fulfilled, which causes the value of ActSRP to be maximum, and
2. all possible vulnerabilities do not exist. This makes ActVUP minimum (zero).
SAS, on the other hand, can become minimum if (i) all protection mechanisms are ineffective to fulfill the defined security requirements (ActSRP is minimum), and (ii) all listed vulnerabilities are found to exist in the assurance target, and all have maximum risk value (ActVUP is maximum).
3.3. More Metrics
In the previous section, we have presented the core concept of how the overall assurance score of an assurance target is calculated based on the hierarchical SA evaluation model. Calculation of these scores is the first step toward quantitative SA evaluation. In this section, we introduce more metrics to conduct a comprehensive analysis and evaluation for both perspectives of security requirements and vulnerabilities.
3.3.1. Security Requirement Metrics
Security requirement metrics relate to a measurement that evaluates whether security protection mechanisms exist and fulfill defined security requirements. We identified metrics as part of the security requirement metrics category when the metric is primarily a measure of requirements and their specification. We identified three subcategories of security requirement metrics: performance metrics, impact metrics, and prioritization metrics.
Security Requirement Performance. These metrics are used to gauge to what extent security protection mechanisms exist and fulfill defined security requirements. This performance metric is measured mainly at the level of assurance perspectives as well as assurance criteria, derived using the ratio between the actual score and maximum score. Thus, the formula to calculate the performance of the
i-th SRC is:
Consequently, the formula to calculate the performance of the SRP is defined as follows.
where:
n: the number of SRCs.
Security Requirement Impact. These metrics are used to measure and identify the positive effects (or contribution) of security requirement fulfillment on the security assurance score. Knowing the impact will allow stakeholders to figure out ways to maximize the positive in alignment with the security goal. To measure the impact of security requirements, we adopt two categories of metrics: (1) the impact on the overall security requirement (i.e., SRP), and (2) the impact on the security assurance score (i.e., SAS). The former metrics constrain the impact evaluation within the perspective of security requirements only, while the latter expands the scope to the whole assurance score (including the vulnerability perspective). To investigate the range of the security requirement impact, for each category, we calculate its maximum and actual value. As a result, four metrics are defined to evaluate the security requirements impact.
Table 5 presents the four metrics for the evaluation of the security requirement impact at the level of SRC and the corresponding formula. We also apply the impact metrics at the level of SRP, but only consider the category of “Impact to SAS”.
Table 6 lists the two metrics for SRP.
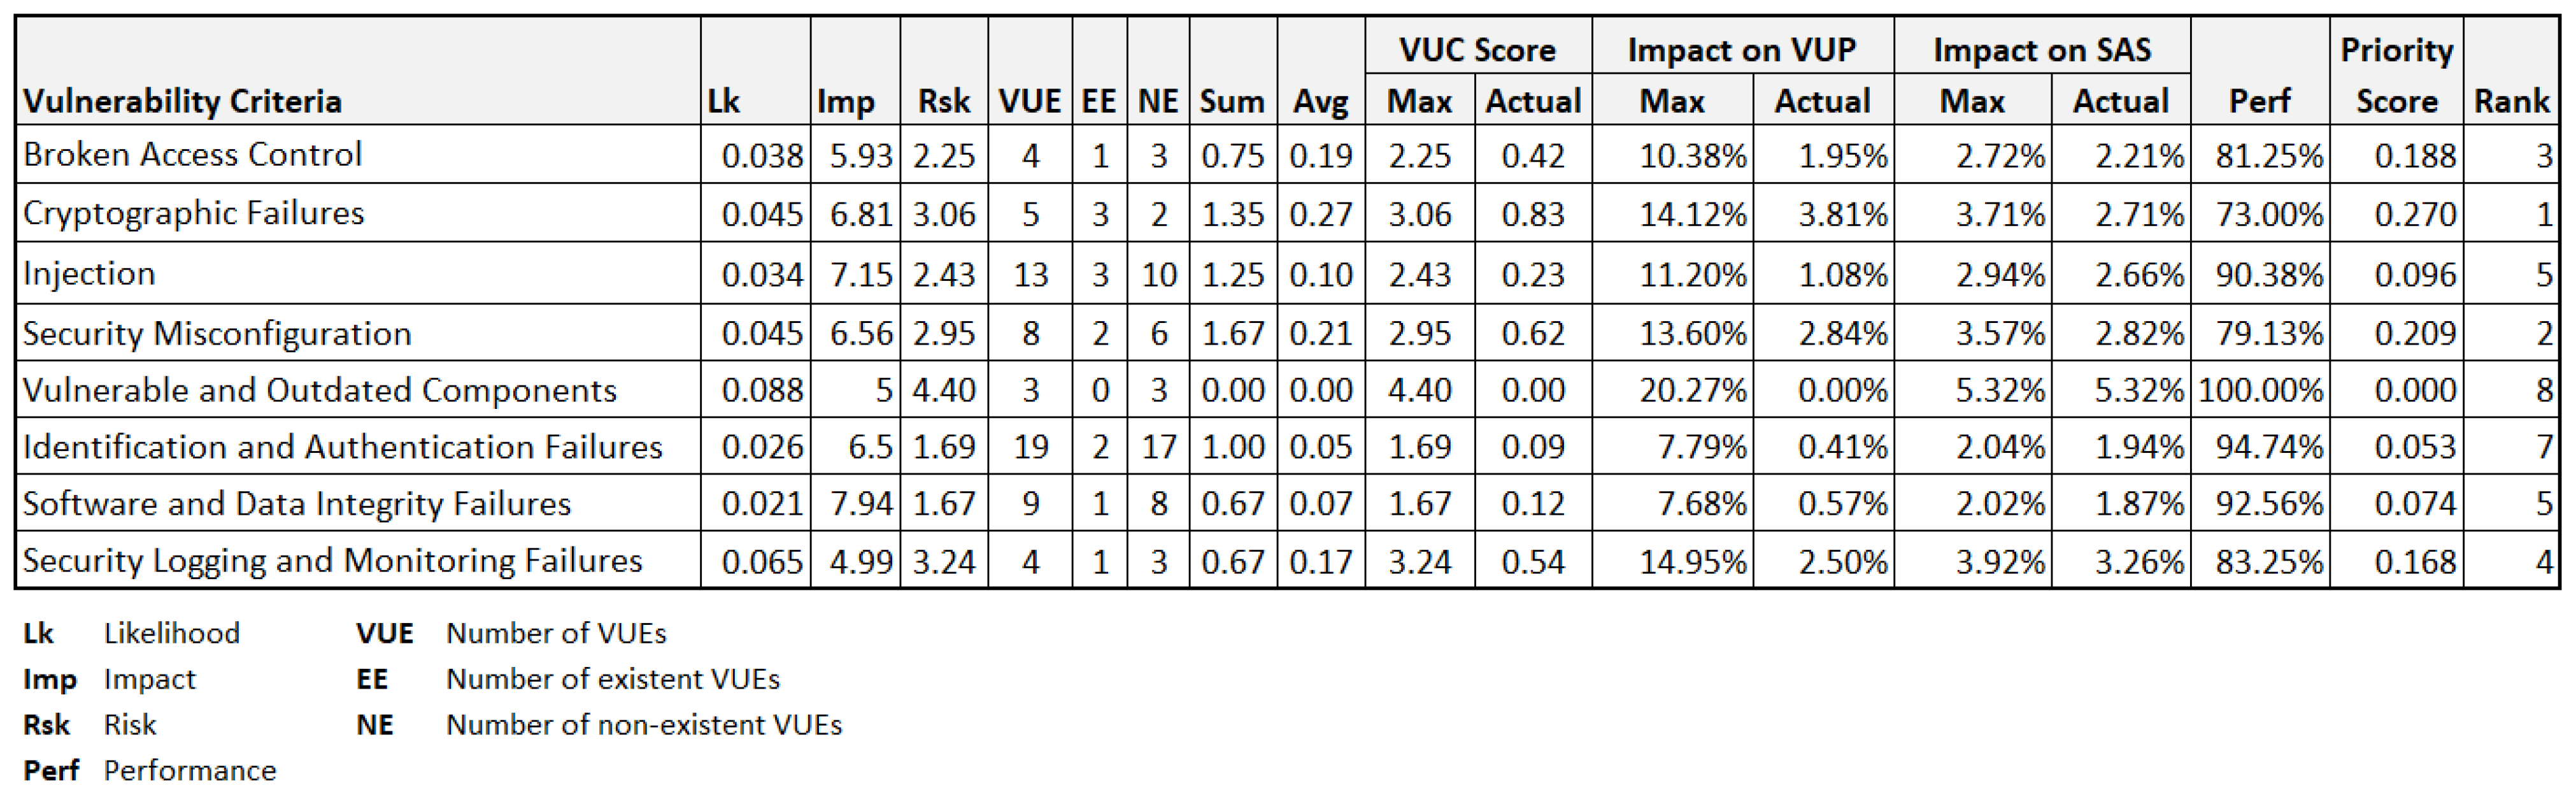
Security Requirement Prioritization. After the performance and impact of security requirements are measured through the above metrics, it is necessary for stakeholders taking action to implement corresponding security mechanisms to fulfill the expected requirements. However, with limited resources in organizations, it is difficult for security stakeholders to fulfill these security requirements simultaneously. To help stakeholders determine the order of implementation, we define a metric at the level of SRC, named Priority Score (
PrsSRC), which is calculated using the formula as follows:
3.3.2. Vulnerability Metrics
Following the same concept practices in the development of security requirement metrics, we define a set of vulnerability metrics to evaluate the weakness of the assurance target, listed in
Table 7. In contrast to the positive contribution of security requirement scores on the overall assurance score, in the perspective of vulnerabilities, the higher the actual score, the more severe an assurance component is. That means the scores of all vulnerability components always result in a negative effect on the result. In this regard, there are slight differences in formula definitions in terms of the performance, the actual impact, and the priority score of vulnerabilities.
5. Conclusions
This paper aims to develop a novel approach for the modeling, calculation, and analysis of SA metrics that could ultimately enhance quantitative SA evaluation. This paper first presents a modeling approach to structuring the SA component for the quantitative SA evaluation, which is followed by a description of a comprehensive set of SA metrics with corresponding calculation algorithms. We also show the way to use the metrics by demonstrating examples of SA analytics, to gauge the confidence of the deployed security mechanisms on the assurance target.
At one level, in terms of a methodological approach to modeling the SA components and calculating metrics, this paper has provided some indication that it has value. First, to achieve the reusability of the SA evaluation models as well as flexibility in SA score calculation, the model is designed in a sufficiently generic fashion that can be applied to any application domain, regardless of the subject of the evaluation. Second, the approach considers the adaptivity and accuracy of SA metrics regarding the application domain and the organizational context. To address this, our model considers the context of the intended environment (i.e., assurance conditions) that the assurance target operates in. We conceive the SA metrics as the aggregated value of the score of contextual conditions that are directly quantified from the test results. In addition, assessing scores for test results of assurance conditions and aggregating these scores to the corresponding assurance components is easier than directly finding a single score for them.
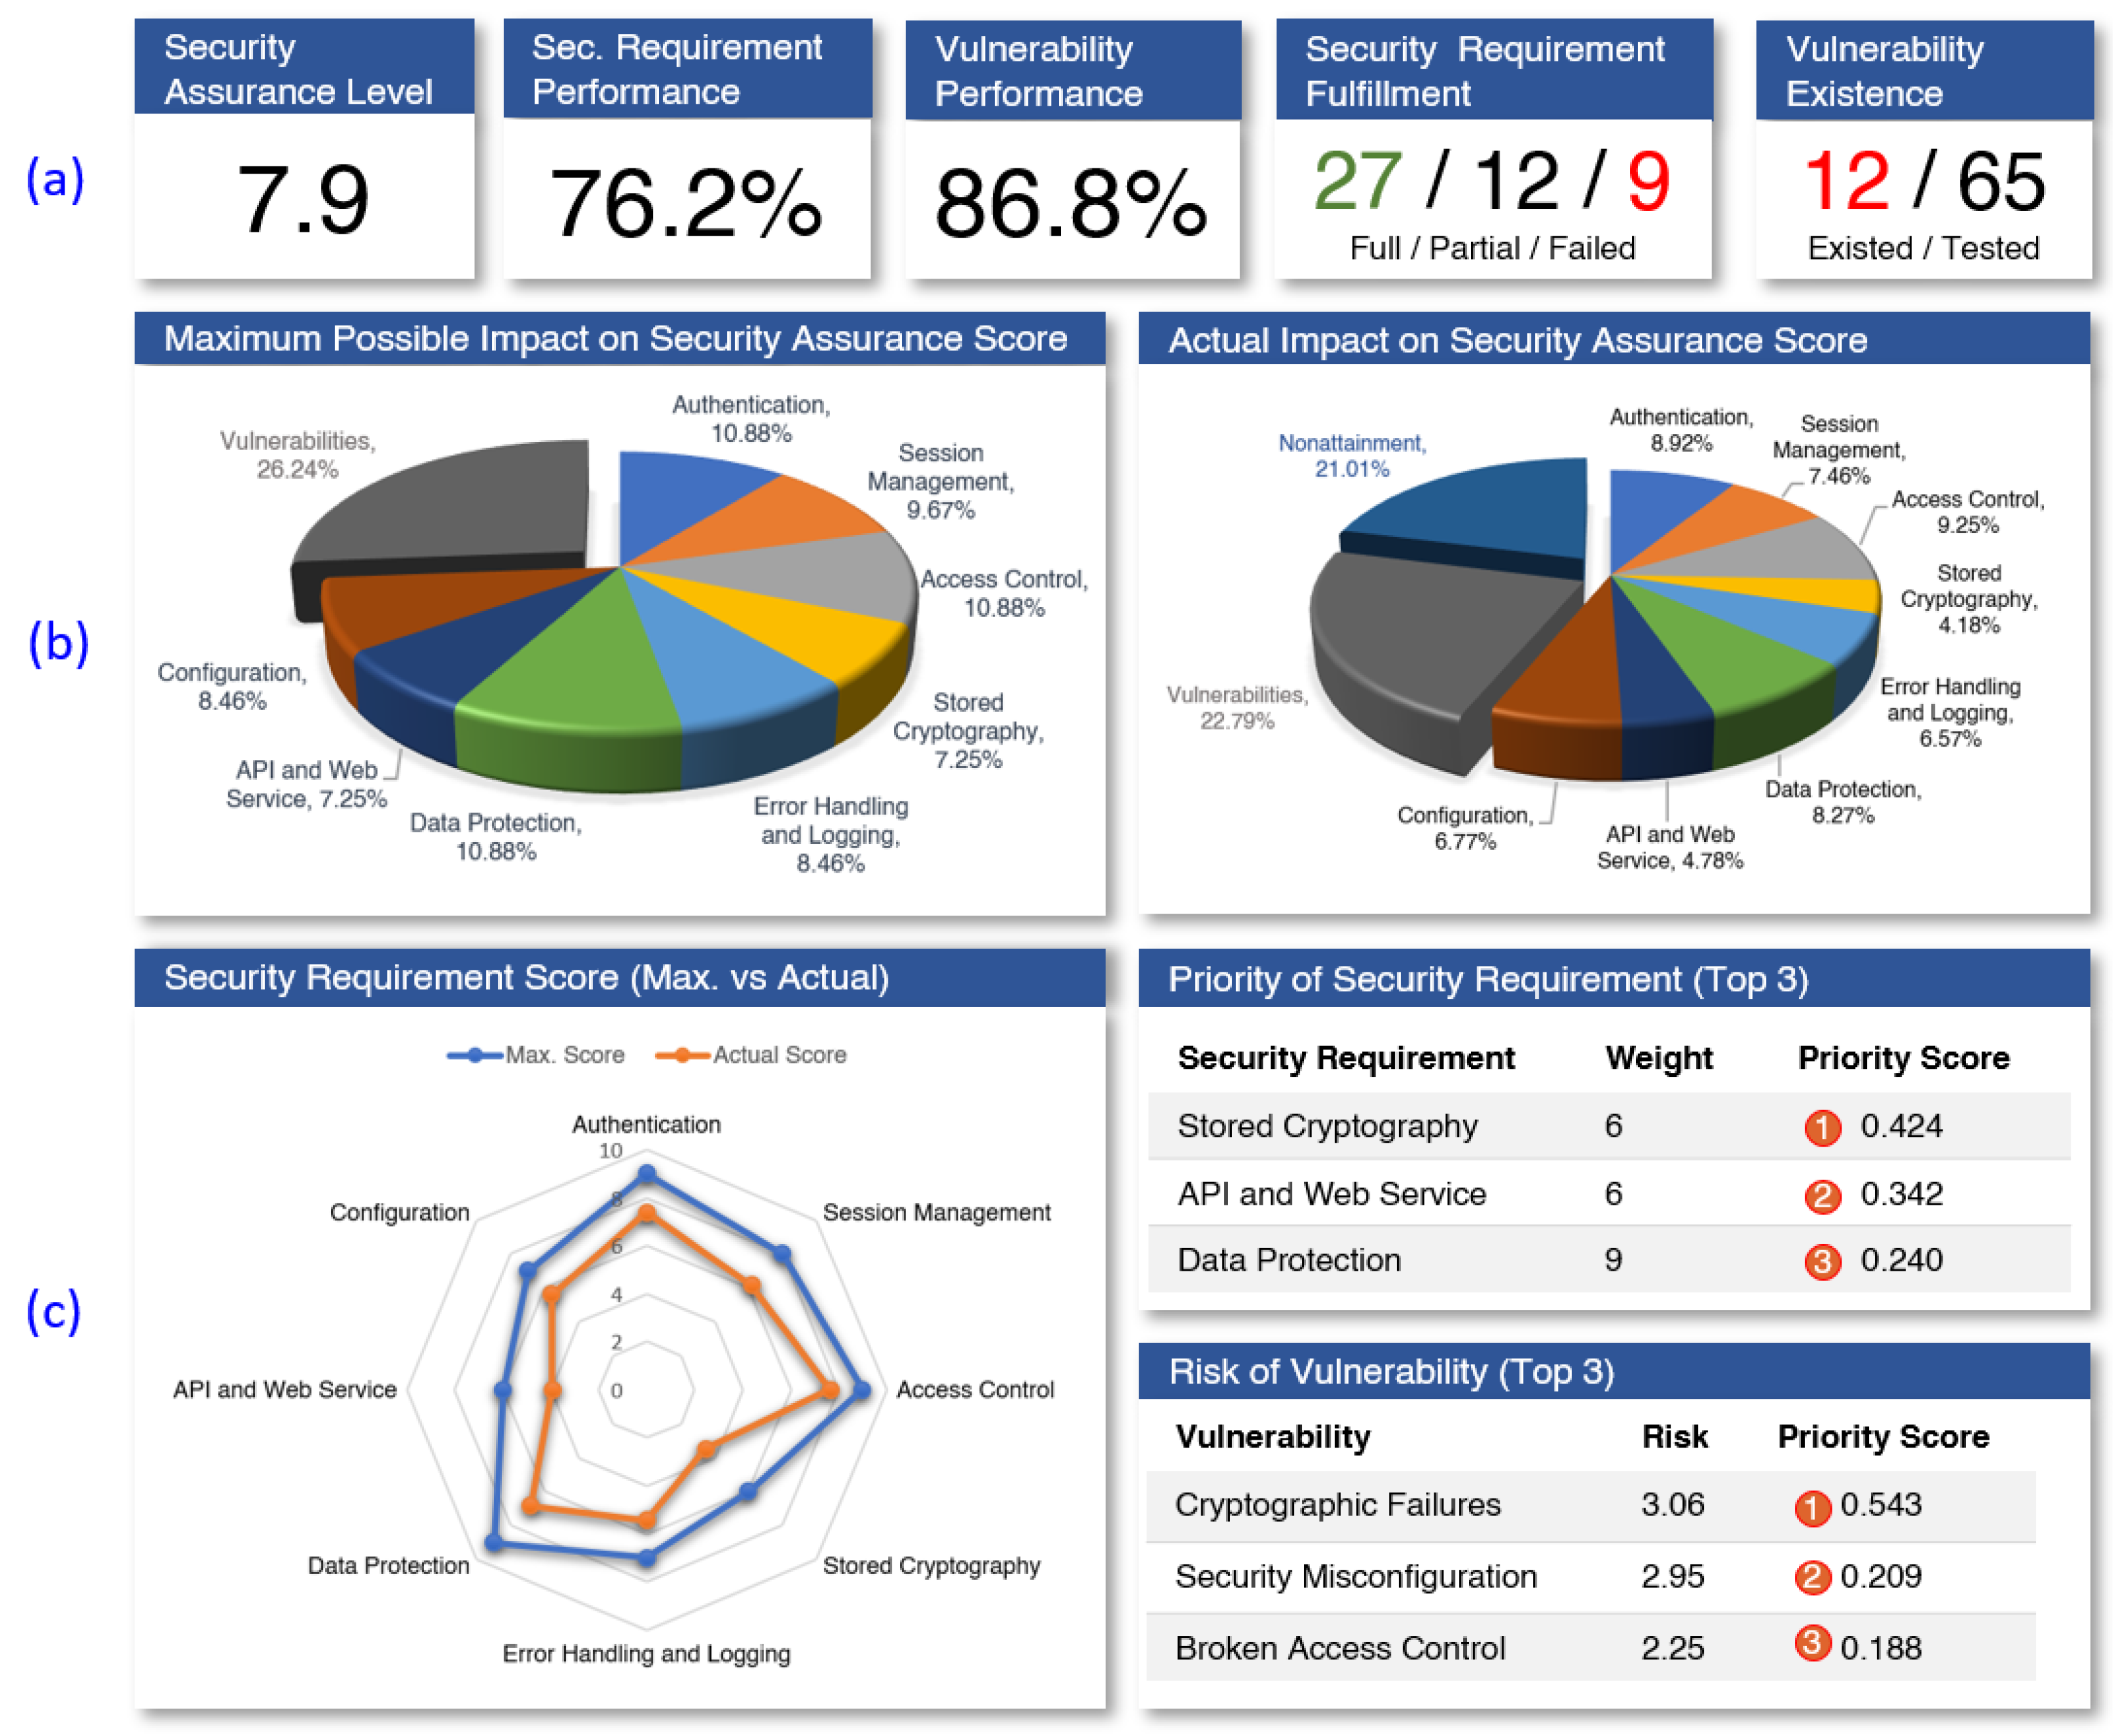
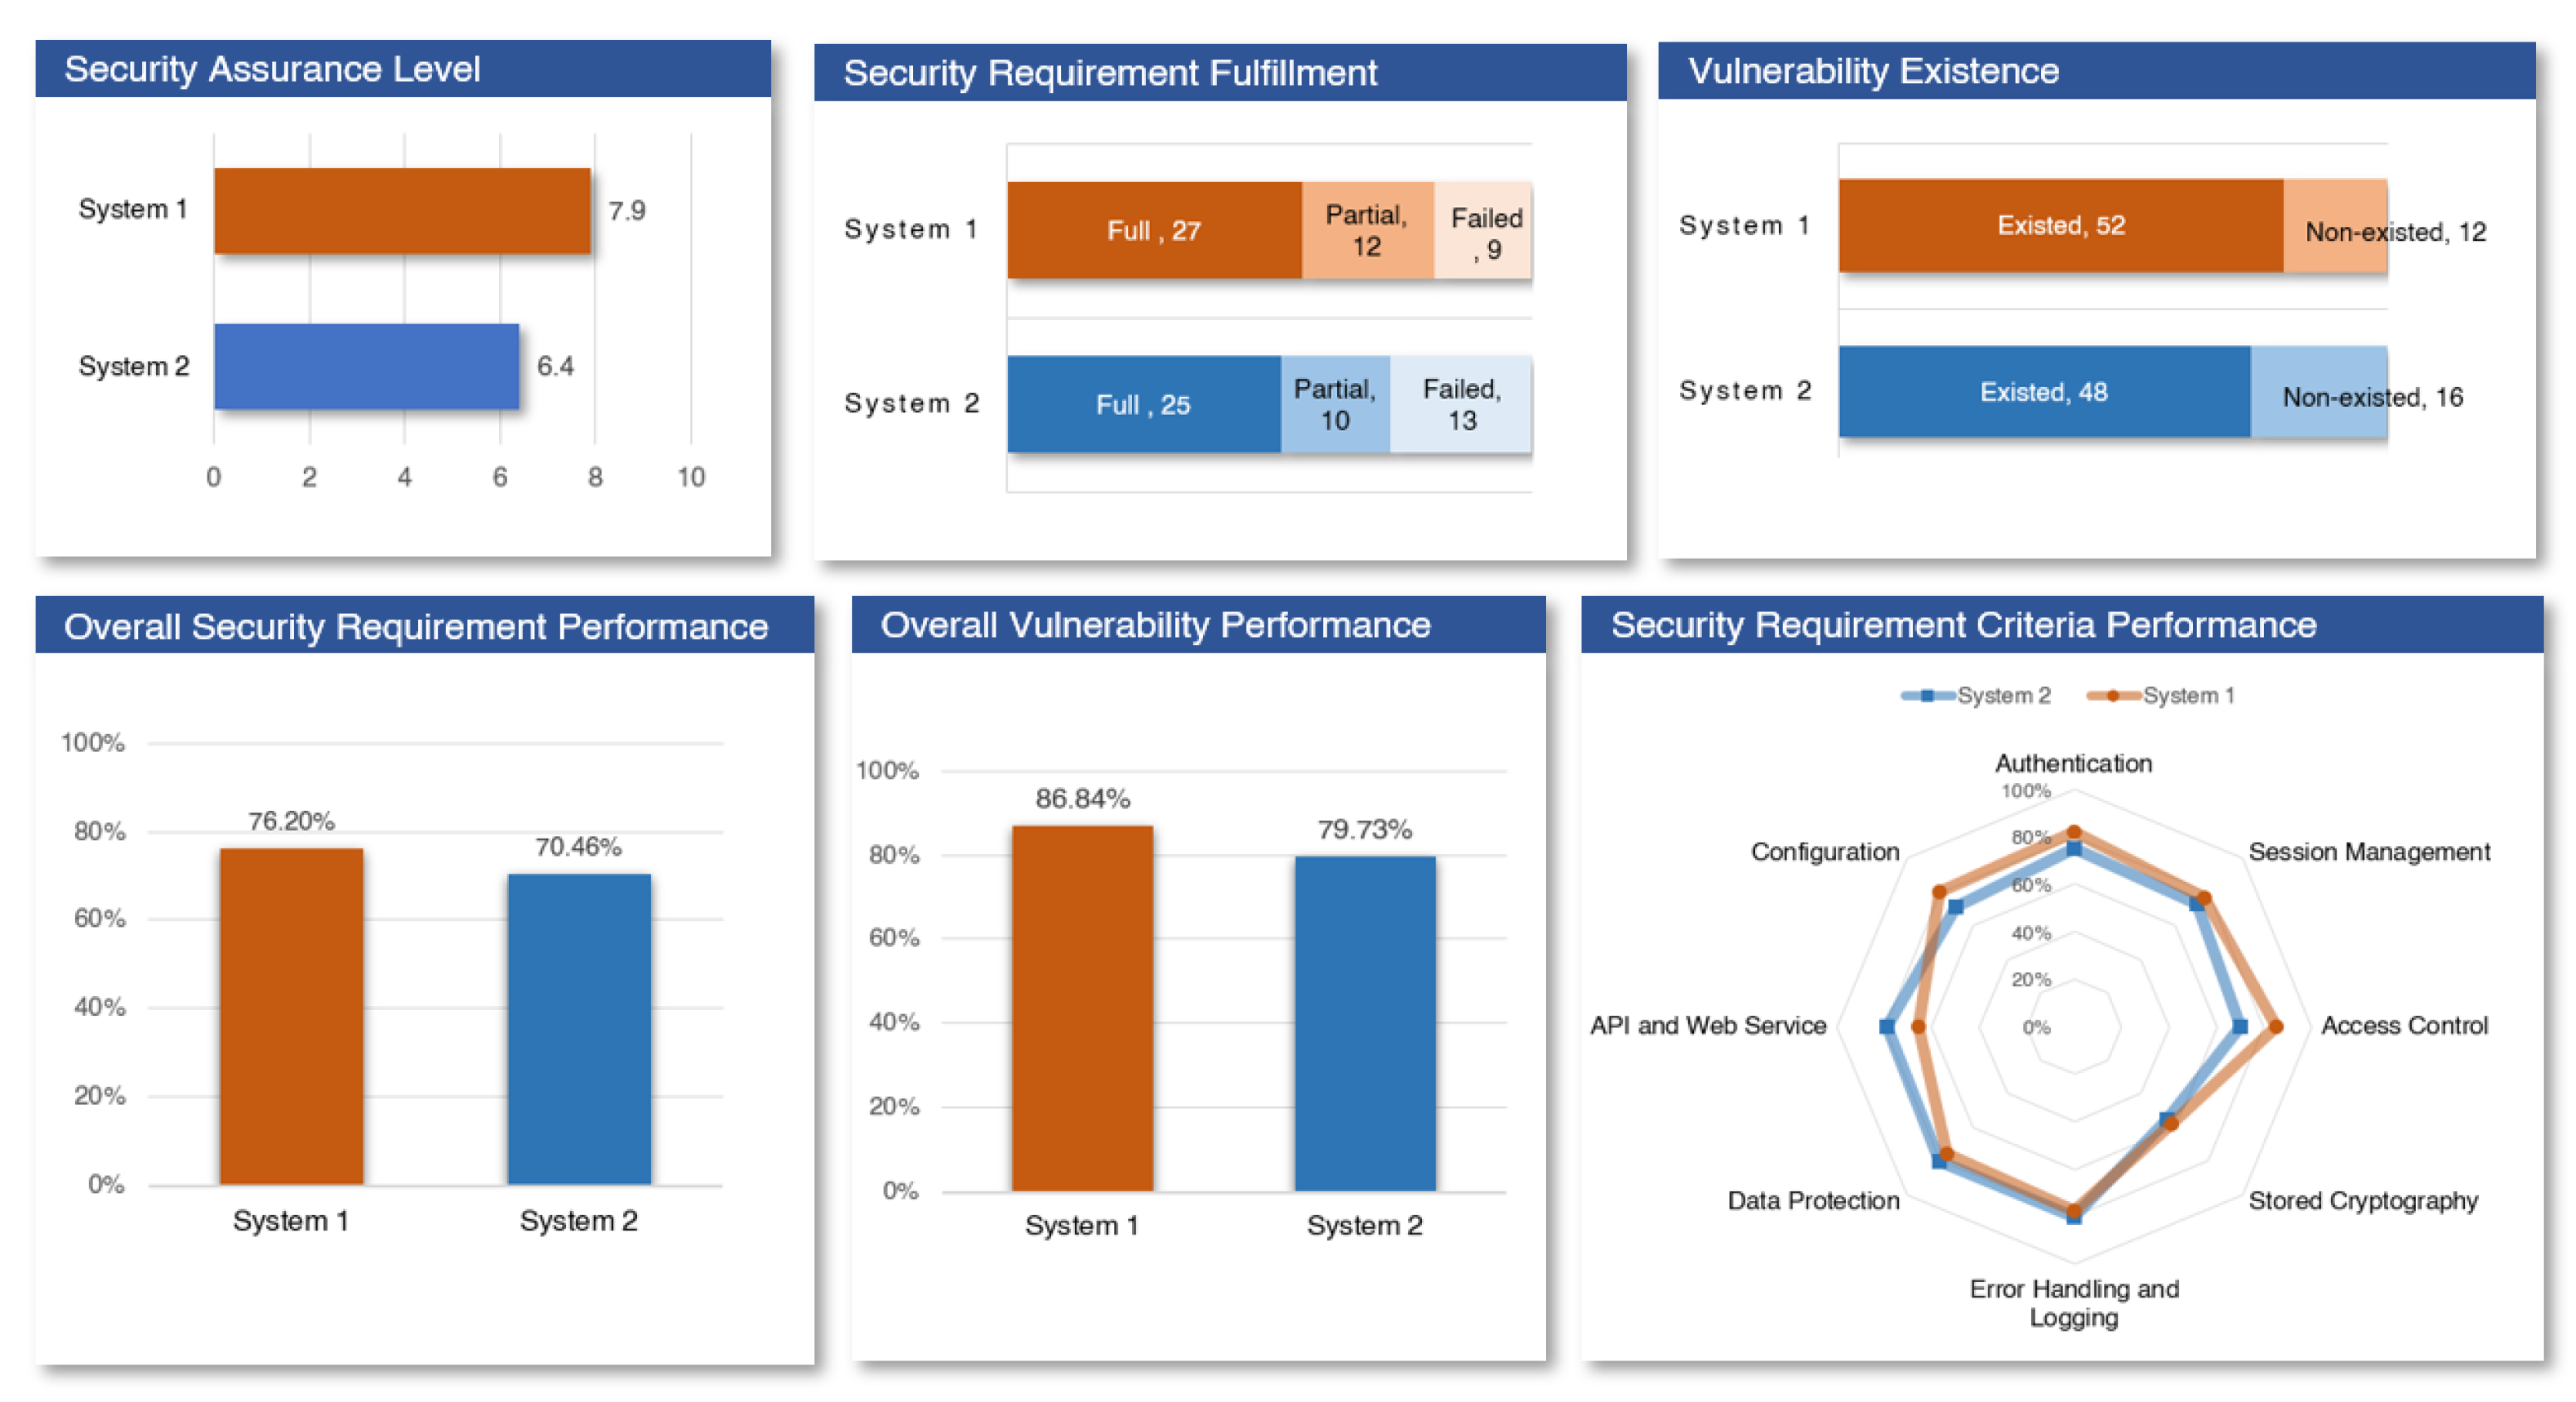
In terms of SA analysis, except for measuring the basic score of the assurance components, we make further steps in the evolution of metrics toward better SA evaluation and analysis. For example, the impact of security requirements (or vulnerabilities) on the overall assurance score, and the recommendation on the prioritizing improvement. Knowing the impact will allow stakeholders to figure out ways to maximize the positive in alignment with the security goal, while prioritization allows the identification of critical areas that require work, addressing organizational concerns, and improving the ability to properly allocate resources. The presentations and analyses of the metrics are then demonstrated using two illustrated analytics: the SA scoreboard and the SA dashboard. The proposed SA analytics focus on using the meaningful information derived from the assurance metrics to know more about the security posture of the assurance target and, further, make informed decisions to improve the security performance. As shown by the examples, our proposed assurance metrics provide a picture of clear measurements of the key components of security assurance as well as an overall score of an assurance target. In addition, the strength and weaknesses of security requirements and vulnerabilities are appropriately quantified that can be used to support improved decision making and strategic planning initiatives.
With that being said, there are some limitations to the work presented here that will have to be addressed in future work. Firstly, the presented SA evaluation model in this article does not consider the interdependency among different assurance criteria, for example, authentication vs. session management in the perspective of security requirement, and broken access control vs. injection in the vulnerability perspective. In addition, it does not discuss the possible interaction between security requirements and vulnerabilities that might result in a double count of the assurance score calculation. To mitigate such limitations, we put forward a restricted test-case design, in which the test cases for security requirements and vulnerabilities are made into separate datasets. Under this prerequisite, the two sets have no element in common but complement each other to form a completed dataset. In more depth, the security requirement testing is designed to verify compliance with security controls, asserting the expected security functionality. For example, when the application deals with personally identifiable information (PII) and sensitive data, the test case to be validated is the compliance with the company information security policy requiring encryption of such data in transit and storage. On the other hand, vulnerability testing (or penetration testing) is designed to identify gaps in security control, driven by risk, which validates the application for unexpected behavior. For example, the test case to be validated for password security could be “Verifying the authentication can be broken through a brute force or dictionary attack of passwords and account harvesting vulnerabilities in the application”. Nevertheless, to improve the precision of the assurance score calculation, our future work will concentrate on modeling constraints and interdependent criteria (e.g., how the score of a criterion affects the effectiveness/correctness of others) as well as the score deduction algorithm between security requirements and associated vulnerabilities. Secondly, to assess the usability of the SA metrics and analytics reported here, there is a need to verify them on a more representative sample of security stakeholders in the SA domain. Lastly, future development of this work should also include a comparison of our proposal with more systematic approaches to categorical data collection and analysis, for instance, with business intelligence (BI). This is an important step to make as it will also allow us to improve the methodological efficacy of this approach.
Overall, it can be said that this quantitative SA approach offers the potential for disclosing more informative content to the management concerning SA evaluation. This can only be seen as yet another positive shift in the iterative process of developing and shaping the security posture and provision of metrics and analytics for appraising the system security.


