1. Introduction
Communication networks rely on a series of wired or wireless channels between intermediate nodes. In addition to noise, these channels may be affected by any combination of three malicious attack vectors: Denial of Service (DoS), data injection, or eavesdropping. A DoS attack may involve cutting a wire or overpowering a particular frequency (jamming). A data injection, or spoofing attack, involves the adversary sending fabricated data that takes the place of actual data. Finally, and the most difficult to discover, is an eavesdropping attack, which involves an adversary intercepting and extracting useful information from the channel. Managing those threats requires an ability to accurately gauge the likelihood or severity of the threat, and adapt the security features available in the system to meet it.
This paper describes a mathematical model for quantifying the Quality of Secure Service (QoSS) deployed in static communications networks. Just as Quality of Service (QoS) metrics describe measurable aspects of the available network, QoSS describes, in measurable and repeatable terms, the security available to an end-user, facilitating meaningful comparisons.
Even when security is momentarily adequate in a communication system, security mechanisms tend to be static, implemented at installation or while running [
1], and cannot be adjusted dynamically based on changing environmental conditions or adversarial capability. This document illustrates the mathematical framework and analysis to define the design requirements for networks and provides a foundation for subsequent work analyzing dynamic network security performance in the presence of varied environmental characteristics
1. The final model demonstrates the probability of data surviving intact against multiple forms of adversarial actions.
2. Goals and Approach
The current literature suggests three primary characteristics that define the security of traditional Information Technology (IT) systems. These are confidentiality, integrity, and availability, i.e., the CIA triad [
2,
3]. To quantify an overall level of security, we must have objective metrics to represent each of these individual characteristics. While objective metrics for availability are well established as QoS metrics, confidentiality and integrity [
4] remain rather subjective and without commonly accepted quantifiable definitions. In addition, the user requirements for security may change based on changing operational conditions. Then, what are the appropriate measures for communication security?
To address the need, we propose a model to quantify the security characteristics of point-to-point communication between two devices
2. The model is patterned after existing quantification models [
5,
6], and helps to define security requirements that, in the presence of adversarial actions, would enable communications to be successful. By comparison, this model does not rely on the application of security controls [
7], but rather the analysis of the system architecture and probabilistic aspects of the network.
3. Components of a Security Model
According to Lundin [
1], an equation to describe the tunable security for a communication system could be
where
is the tunable security, which may be dynamically adjusted based on the user security requirements. The transmitter capabilities
3 are represented by
T, the environmental descriptions are represented by
, and the overall system security requirements are represented by
R. The goal is to map the tunable security services to the system security requirements. To achieve this, the tunable security services must first be decomposed into the constituent parts, such as the available number of channels, the use or disuse of encryption, and the amount of fragmentation across the network. In many cases, the environmental descriptions are directly reflected in the traditional QoS measurements available from the service provider.
This initial version of the QoSS model is a static snap-shot, reflecting the system security at one point in time. The multiplication operator in Equation (
1) does not adequately address the numerous non-linear relationships between system capability and environmental aspects. Instead, QoSS captures those factors as an array of features or values and then relates the transmitter capabilities and the environmental description to the CIA triad, where confidentiality,
C, and integrity,
I, replace the transmitter capabilities, and availability,
A, replaces the environmental descriptors.
Security measures are typically subjective. To achieve objectivity, we substitute measurements of confidentiality and integrity with the probability of each, designated as
and
, respectively, as discussed in subsequent sections. Although it is unconventional to consider a DoS attack as impacting data integrity (described in subsequent sections), doing so has the added benefit of collecting all adversarial influences into the metrics for confidentiality and integrity, leaving only the system and network capabilities to be considered as availability. Availability is a specific set of objective performance metrics, or QoS, provided by the transmitter, e.g., data or bit rate, jitter, bandwidth, transmission frequency, or power. The resulting QoSS equation is
representing a snapshot of QoSS metrics mapped to the security requirements. If the array of metrics does not directly map to the security requirements, then the QoSS for that network is inadequate, and the system must be redesigned. The array of metrics also provides a foundation to perform one-to-one comparisons between two networks.
3.1. Probability of Confidentiality
Numerous researchers have attempted to quantify confidentiality with varying success [
8,
9]. Confidentiality is the aspect of a network that protects against unauthorized message receipt, i.e., preventing an eavesdropper from either receiving or decoding messages. One approach to quantifying confidentiality is to redefine it as a probability so that
where
is the probability of confidentiality and
is the probability of leakage. Leakage refers to an untrusted listener having access to an “information flow from secret inputs to public outputs” [
10]. Inspired by Perfectly Secure Message Tranmission (PSMT) [
11], the set of all adversarial listeners,
, maps to a set of wires (channels),
, that the listeners have access to; if one of the members of
has access to the information, then the probability of leakage exists.
For leakage to occur, a listener must intercept the message, decrypt it (if applicable), and then decode the data contained in the message. The probability of interception,
, quantifies the probability that a listener with channel access will receive the message. The probability of decryption,
, quantifies the probability that the adversary will decrypt it
4. Finally, the probability of decoding,
, quantifies the probability that an adversary will decode the message
5.
Consider the relationship between the probabilities of interception, decryption, and decoding. For data leakage to occur, an adversary must be able to achieve all three actions, i.e., decryption is irrelevant if the adversary is unable to receive any messages. Conversely, receiving every transmission ever sent is irrelevant if an adversary is unable to decrypt or decode the messages. The logical binary relationship of how
relates to
,
, and
is captured in
Table 1. The proposed equation to describe
in terms of
,
, and
is
3.2. Probability of Integrity
Quantifying integrity is equally challenging. Integrity is a measure of the consistency, accuracy, and trustworthiness of data. Integrity implies that data has not been changed by unauthorized users in transit. One method of quantifying integrity is the “prevention of unauthorized modification of information” [
10]. Under this assumption, unauthorized modification is
corruption, resulting in
where
is the probability of integrity and
is the probability of corruption. Corruption here captures any damage to integrity yielding “two notions of corruption ” where the “first leads us to a measure that we call
contamination” and the “second leads us to ...
suppression” [
10]. Contamination may arise from adversarial action,
injection, or non-adversarial input,
noise. Further, an adversary may carefully inject portions of false data (a spoofing attack), inject massive amounts of false data to disable communications (the traditional DoS attack), or overtly jam a message with a false signal (traditional RF jamming).
Therefore, we choose to classify DoS attacks as being an attack on the integrity of the data or message, not as an attack on the availability of the network. Again, inspired by PSMT [
11], the set of all adversarial disruptors,
, maps to a number of wires,
, that the disruptors have access to; if one of the members of
has access to the information, then the probability of corruption exists.
We, therefore, posit that corruption has three components: noise, data suppression, and data injection. The probability of noise occurring in a message,
, is the probability that a message will be adversely affected by noise. Noise is a natural phenomenon that happens regardless of the transmitter’s capability. The probability of suppression,
, quantifies the probability that an adversary will suppress or jam the message, thus, preventing the receiver from obtaining the message
6. Finally, the probability of injection,
, quantifies the probability that an adversary will inject false data into the message.
requires the ability to insert malicious data into a data stream, a much more sophisticated activity than that of jamming
7. Since noise is a natural phenomenon, it is consistently present and may influence
and
. Noise works cooperatively with
since both cause the receiver to incorrectly receive the intended message. Based on these probabilities, the logical binary relationship for
is shown in
Table 2 and reflected as
Equation (
6) does not adequately capture the behavior of the system. Noise may be detrimental to data injection, making the injected data unusable. Due to the interaction between
and
, namely that noise affects both intended and malicious transmissions, a more comprehensive equation is
While less elegant than Equation (
6), Equation (
7) provides realistic results that account for all probabilities between 0 and 1 for each of the factors.
3.3. Availability
Methods exist for assessing and improving the performance of a system based on QoS measures [
12]. For the QoSS model, the metrics used to describe availability are already conveyed in the QoS metrics. This is reflected as
, where QoS is the set of metrics that include cost, jitter, latency, bandwidth, and bit rate, which already provide a repeatable method of measuring availability.
3.4. Multiple Channels
Using multiple channels can improve the performance of data-in-transit in diverse ways. A straightforward example is directly increasing the data rate, such that additional channels provide more bandwidth, e.g., channel bonding within IEEE 802.11 [
13,
14,
15,
16]. Another example is frequency hopping through multiple channels, which is one of several techniques known as the spread spectrum and which provides protection from noise or jamming as the signal is “spread across a channel greater than that necessary to transmit the information” [
17]. This technique is currently used in Bluetooth, and such transmission diversity is also a key element of 5G wireless [
18,
19].
An example of data-at-rest performance improvement through multiple channels is found in the Redundant Array of Inexpensive Disks (RAID) architecture. Developed in 1987, RAID demonstrated that by utilizing redundancy, an array could be more reliable than any one disk drive while allowing greater data throughput (In a RAID array, data is split across various disks so that if one disk should fail, the data may be fully recovered despite not having all the original blocks of data. Various combinations of nested RAID levels may be used to reduce the vulnerabilities of simultaneous disk failures [
20]. The data may also be encrypted before or after splitting, or both, as a manner of increasing confidentiality.). Despite significant overhead, the ability to survive disk failures has made it very attractive in critical server environments.
Many applications in control systems maintain separate channels for data and control. For example, in SS7
8, the signaling path is separate and distinct from the voice channels that carry the telephone conversation. Having different channels, at different frequencies and differing bandwidths, allows for greater flexibility and higher-speed communications between network assets without the need to rely upon the availability or limitations of analog voice channels (In reality, these two channels are not entirely separated. The dual-tone, multi-frequency (DTMF) digits dialed by a caller begin within the voice channel, but are recognized by the control channel and are an example of the signaling messages, including dialing a phone number, entering control functions like call-forwarding, or advanced billing information [
21,
22]).
An abstract form of multi-channel communication is two-factor authentication (2FA), a subset of multi-factor authentication. This is an authentication methodology that requires a user to present two or more pieces of evidence to confirm the user’s identity via separate delivery paths
9 [
23]. By using multiple authentication factors sent via divergent paths, the likelihood that both messages are intercepted decreases. Even if a malicious actor intercepts one factor, full authentication by the malicious actor cannot occur without intercepting the other. Numerous other forms of 2FA also exist [
24].
Central to the theme of this paper,
multiple channel architecture may also be used to improve security through data fragmentation across heterogeneous channels [
25,
26,
27,
28]. This security focused capability, in concert with the performance advantages of multi-channel communications, is the motivation for creating a tunable multi-channel communication protocol and associated analysis techniques to determine the appropriate trade-offs under varying security and performance requirements.
4. The Quality of Secure Service Model
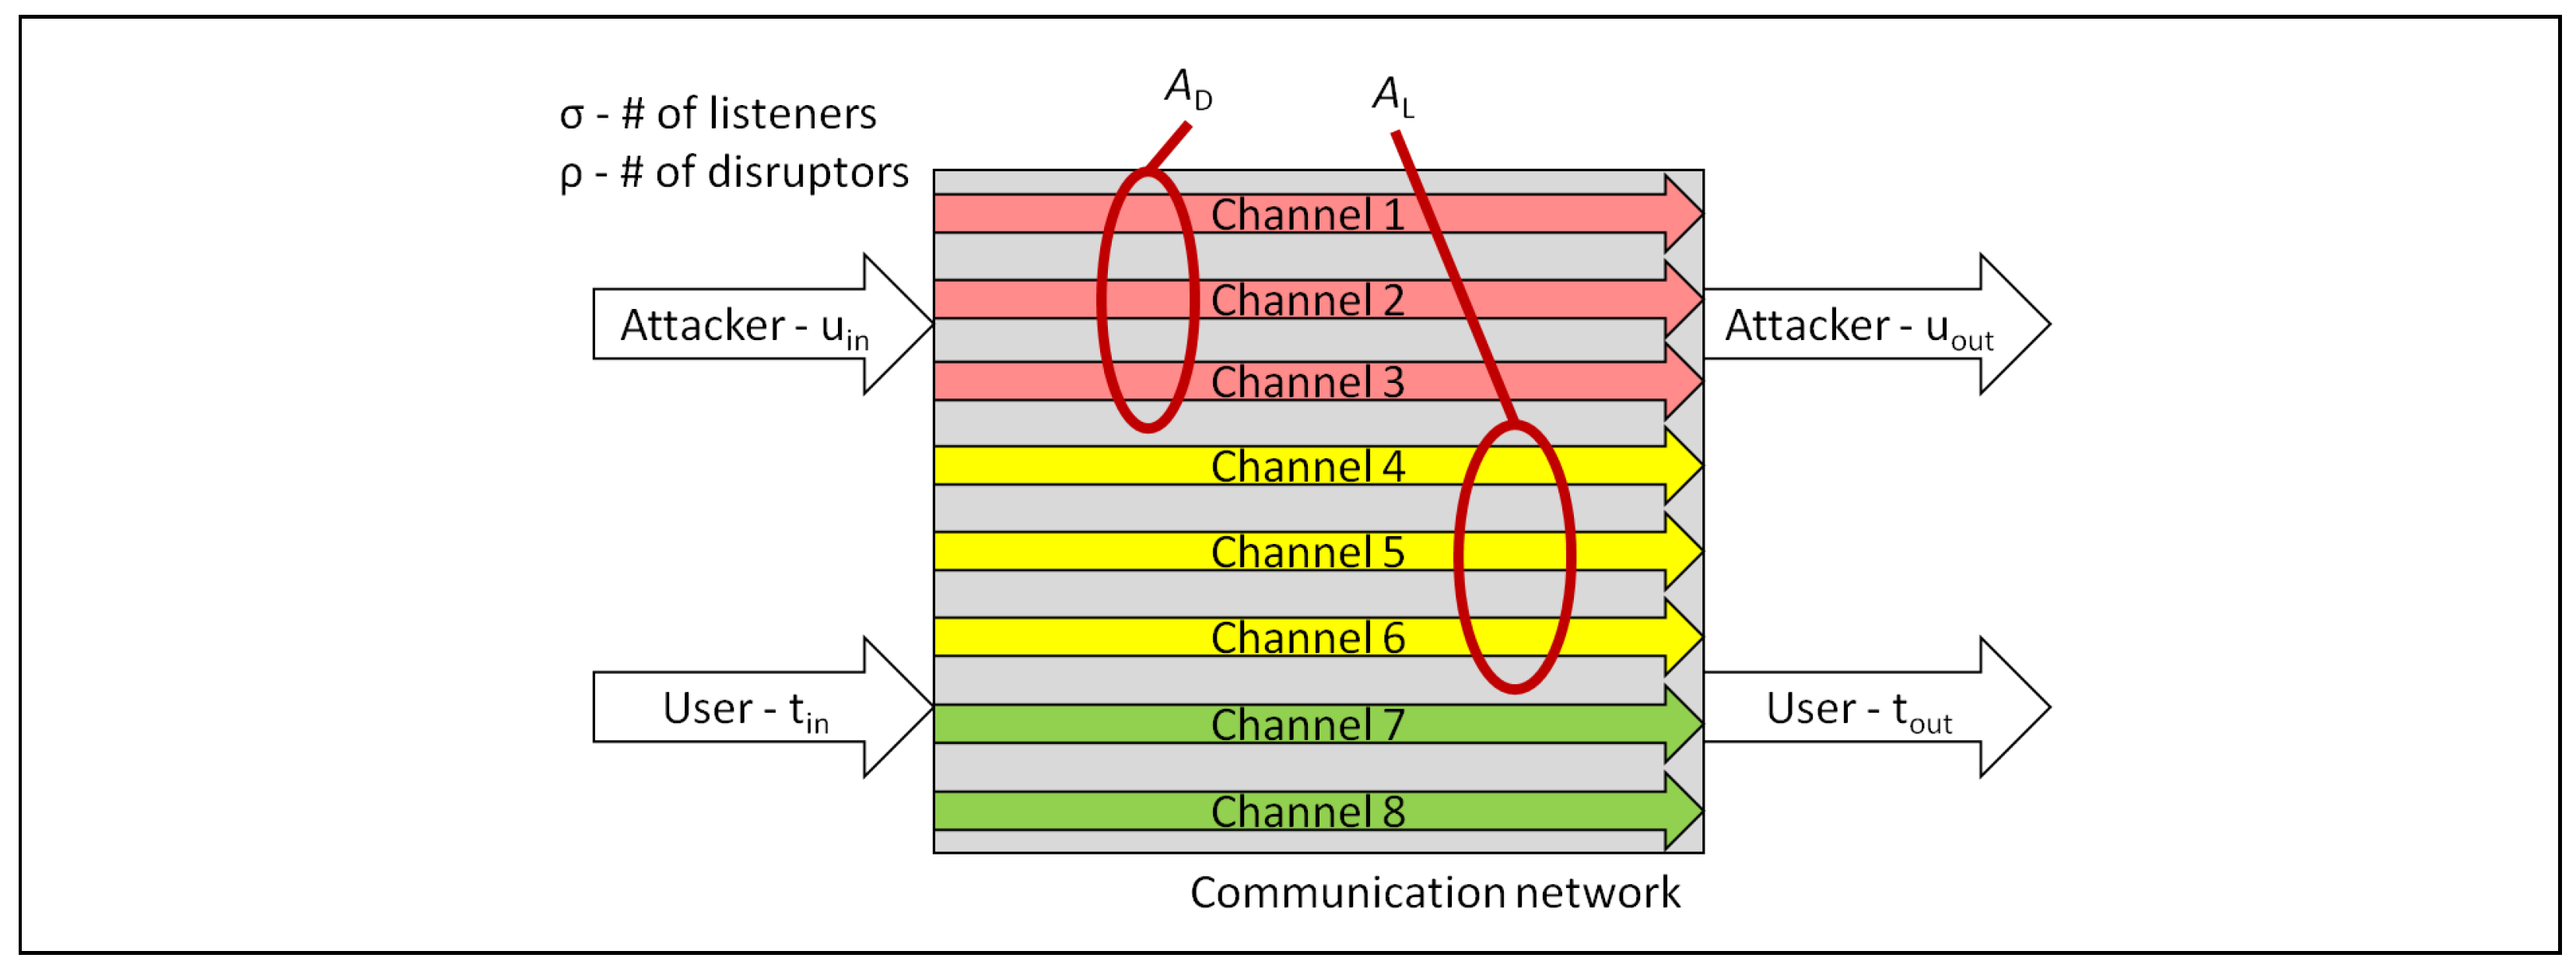
Although a communication network typically uses only one network channel between two given nodes, the possibility exists to utilize multiple paths between nodes, as shown in
Figure 1. This figure shows an arbitrary network with eight individual channels, any of which may be used to transport data. A message sent through the network in
Figure 1 may travel across one of the channels influenced by the set of adversarial listeners,
, or the set of adversarial disruptors,
.
The relationship between listeners, disruptors, and the total number of needed channels is described by PSMT, which “abstract[s] away the network entirely and concentrate[s] on solving the Secure Message Transmission Problem” for a single transmitter and receiver pair [
11]. Additional articles explore multi-channel architectures [
29,
30], while others strive to prove the general case and optimize the statistical reliability and secrecy [
31,
32].
In our model,
represents the number of wires (channels) between the transmitter and receiver available to the adversarial listener set,
, and
is the number of channels between the transmitter and receiver available to the adversarial disruptor set,
10. Communication is two-way between the transmitter and receiver and, following PSMT, the number of channels that must exist between transmitter and receiver is given by
With this equation, we know how many channels must be used to maintain secure and reliable communication. If a channel is unavailable, then it must not be counted as part of
n. If we assume the number of channels accessible to a listener or disruptor, then we can arrive at a specific quantification of
n. For example, when
and
, the probability that any one channel of the eight could be listened to is
. The probability of leakage for each channel within a multi-channel architecture becomes
Similarly, the probability of corruption for each channel within multi-channel architecture becomes
Therefore, the more channels there are in a network, the lower the probability of adversarial interference of the data
11. This, then, follows the premise of PSMT: to have more channels than the combined set of listeners and disruptors
∪
.
In the same manner that multiple channels may thwart adversarial interference, message fragmentation may also thwart eavesdropping. Message fragmentation is the splitting of data across the available channels, effectively parallelizing the data. Fragmentation describes how many portions the original message is divided into. Various methods of fragmentation are possible, including uniform or non-uniform fragmentation from 1-bit to the total
m-bits in message
M. Research has been published on particular approaches to fragmentation [
28,
33]; however, in this paper, we focuse on the security effects and apply the assumption that fragments are of equal size across the network. If
is the set of
n channels, and
is the set of
k fragments of
-bits of the message
M, then
where each fragment is unique. The channel load,
L, is the percentage of
M on a particular channel
j, such that
and the Average Loading (AL) for the set of channels is
For example, is the set of eight fragments of message M on a network that has channels, and each channel transmits two fragments. Therefore, . Message fragmentation also allows for duplicating data across channels. The Duplication Factor (DF) measures the average number of times a given fragment is transmitted, indicating the network redundancy. The DF may increase as compensatory tuning for known adversarial interactions. For the previous example, , since each fragment is sent across two channels and, thus, duplicated twice. For these calculations of DF and AL, the fragment sizes are uniform.
The AL and DF directly affect and . Of the constituent parts of , is only affected by DF in aggregation across all channels because the probability of interception of a single channel is not necessarily improved by duplication or fragmentation. However, may be increased by the message M being duplicated across multiple channels, offering an adversary more opportunities to intercept portions of the message.
Therefore, DF is only multiplied by
when averaging all the channels into a composite probability of leakage. For the constituent parts of
, duplication directly affects
because sending fragments multiple times decreases the probability of lost data through suppression.
and
are not directly influenced by duplication. Thus,
is divided by
for each channel, giving
Fragmentation does not necessarily increase or decrease
except that it allows for duplication. However, fragmentation does directly affect
since each fragment sent needs to be modified by the adversary in order to have malicious data accepted at the receiver. Thus,
is multiplied by AL for each channel, giving
Applying the PSMT and decomposing the network into constituent channels yields
which highlights that each channel has its own characteristics. From the end-user perspective, only the aggregated QoSS for the entire network is apparent. With insight into each channel’s QoSS, an analyst may suggest a different quantity of channels, different fragmentation or duplication, or a different encoding or encryption algorithm if adversarial actors attempt to influence communications.
5. Case Studies of Multi-Channel QoSS
The three example networks presented here are used to highlight the initial estimates and are intended to be refined as the network understanding is increased. For simplicity, the probabilities used in the following examples are discrete values; however, any value between 0 and 1 is possible. In developing the QoSS model, estimating the intermediate values is a challenge. As a starting point, 0 may be used for a network that has absolutely no encryption, 0.5 may be used for a system that has minimal or sub-standard encryption, and 1 may be used for a system that employs strong encryption.
Incremental changes may be employed as desired or as needed after a baseline understanding is developed, much like understanding the incremental difference between AES-128 and AES-256, or the difference between DES, triple-DES, and AES. The primary goal of the initial model development is to apply estimates for each of the constituent elements as implied by [
34]. Further refinement of those estimates may be applied after more thorough system analyses.
During the early stages of analysis, the difference between a probability of 0.76 and 0.77 remains undefined and the numbers tend to be more arbitrary. This serves to assign a starting point for analysis, thus, establishing a baseline. Given the three example networks that follow and some initial probabilistic estimates for the various characteristics, the QoSS model is applied. Each case has a realistic configuration that allows for one-to-one comparison.
5.1. Single-Channel Network
The first example is a network that utilizes a single wireless channel to provide a realistic baseline. With
, there is
listener, and
disruptor.
because the message cannot be split, and
since, for this architecture, the message is only sent once.
Table 3 shows notional probabilities for a network that has no encryption, standard data encoding, and a moderate probability of interception because it uses a standard broadcast frequency and a moderately strong broadcast signal, which also results in a low probability of noise.
We assign a high probability of suppression under the assumption of an omnidirectional receiver, susceptible to jamming. The probability for injection is moderately high, though not as high as the probability of suppression, because injection is more challenging than suppression. These values serve as a baseline to demonstrate the effects of multiple channels in the subsequent examples.
Based on these constraints, the single-channel network has a high probability of leakage, with a corresponding probability of confidentiality. The probability of corruption is also very high, with a correspondingly low probability of integrity. These probabilities may be improved by using encryption and by using directional receivers or a wired connection.
5.2. Three-Channel Network
The second example applies PSMT to the communication architecture, and demonstrates the initial application of multiple channels. In this example, the communication network uses three discrete, heterogeneous channels to communicate between the transmitter and the receiver. For this example, , listener, and disruptor. One difference between the single channel case and the three-channel case is the AL. The original message is fragmented into three equal portions, , , and , which are each transmitted twice as follows: on Channel 1, on Channel 2, and on Channel 3. For this case , and (because each fragment is sent twice).
Table 4 shows the theorized characteristics for a network with various probability of interception and fixed values for probability of decryption and decoding. Additionally,
Table 4 shows that the network has various probabilities of injection with fixed values for probability of noise and suppression.
Channel 1 has identical input factors to the single-channel network as demonstrated in
Table 3; however, the message is fragmented across multiple channels, which causes the probability of confidentiality and probability of integrity to increase, not only for Channel 1, but for each channel in the network
12. The average probability of confidentiality is 0.83 even without encryption, indicating that fracturing data across the multiple channels improves the probability of confidentiality and over-all QoSS, partially mitigating the lack of encryption.
5.3. Eight-Channel Network
The third example presents a communication network with eight discrete, heterogeneous channels. In this example,
,
listeners, and
disruptors. The original message is fragmented into eight equal portions,
, of which
are transmitted on Channel 1,
on Channel 2,
on Channel 3, and so on. Here,
, and
because each fragment is sent twice.
Table 5 shows the theorized input for the eight-channel network.
Of particular note,
Table 5 has the same input as
Table 4 for Channels 1–3, and other values for Channels 4–8, although with different results
13. The only difference from the three-channel case is that, with eight channels, the message is fragmented across more channels, causing the confidentiality and integrity to increase. The average values for
,
, and
are the same for the single-channel, three-channel, and eight-channel networks, although the average
and
are notably different.
As expected, the single-channel network has the lowest theorized QoSS values. With a slightly higher percentage of listeners, the eight-channel network has a slightly higher
and correspondingly lower
than the three-channel network
14. Similarly, the average values for
,
, and
are the same for the single-channel, three-channel, and eight-channel networks, yet the
and
are significantly different.
5.4. Implications of Results
The most difficult aspect of developing the QoSS metrics is making assumptions about the network characteristics. For these examples, we began with an assumption that was a baseline value that an adversary would be able to access all critical data. What does this mean for ? Perhaps the assumption implies that no encryption is used, despite the fact that the use of encryption is strongly encouraged for all communications systems.
Similarly, is this possible for ? This assumption implies that the encryption is unbreakable at this time and under these communication and environmental conditions. The fact that we do not know the adversary’s fullest capabilities, nor do we know the adversary’s intentions, are considerations that must be included, within a range, in the estimate for the probabilistic aspect of our metrics. More accurately, we estimate what is possible within the current state-of-the-art and under a set of operational characteristics.
Adversarial intention is much more difficult to estimate; intentions may change rapidly or may vary on a case-by-case basis. In light of that, we have attempted to reflect all the adversarial intentions, whether it is jamming, spoofing, or eavesdropping, within the generalized probability of confidentiality and probability of integrity. With these estimations, both adversarial capability and intention are difficult to concretely quantify in the initial pass, and they are, thus, cast in probabilistic terms.
This version of the QoSS model is a single snap-shot in time; a time-varying QoSS model is in development in which the model estimations may be updated based on new research, information, or changing environmental and systemic conditions. As the QoSS model becomes more mature and broadly adopted, future iterations will benefit from increased understanding of these probabilistic approaches and an initial coarse estimate for design requirements may converge to refined security requirements if applied in an iterative manner.
These iterations point directly to the eventual need for a simulation environment and all the supporting protocols that allow for the verification and validation of the security metrics. To achieve that end, the network performance will need to be influenced by a simulated adversarial actor, and the amount of data leakage or corruption will be directly quantified based on the amount of transmitted data. Only with that final step of validation will we be certain that the model portrays a realistic version of a communication network.
6. Conclusions and Future Work
This manuscript represents an initial model intended to be used in developing an understanding of how real-world networks function in the presence of adversarial influence. The current analysis does not address the nuances of specific communication scenarios, and there is no existing network to validate our model. Quantifying security in real-world communication networks is difficult and mostly subjective. Without a metric for confidentiality and integrity, it is nearly impossible to state how secure one network is compared to another.
Using a probabilistic model that considers data leakage and data corruption in place of confidentiality and integrity, a set of metrics may be used to quantify the QoSS. This model allows the direct and repeatable quantification of the security available in a single- or multi-channel network under static configurations. The quantification of security is based directly upon the probabilities that adversarial listeners and disruptors are able to gain access to or change the original message.
Traditional measurements of QoS provide a foundation, and message fragmentation and duplication across the available channels provide demonstrably improved theoretical performance. A fully developed simulation would be useful in validating the modeled results. However, at this time, there is no existing network or simulation of a real network to validate the theoretical QoSS model. A simulation environment is in the process of development in order to include the ability to estimate an adversary’s influence, as are the experiments and the network prototype that will be used to test the theoretical QoSS model.
Two additional manuscripts are nearing completion that will address two of the many thorny issues contained within real networks—in particular, multi-hop networks and the changes to the QoSS metrics that occur over time. This future work may require building specific data-handling protocols, and would monitor how the network end-points respond. With the simulation environment developed, the modeled results may be verified and the QoSS model may be validated or improved with additional data and insight.


