Abstract
Critical transmission lines frequently traverse geologically complex mountainous regions, where harsh environments and variable climatic conditions pose significant geohazard risks. Utilizing 163 Sentinel-1A scenes (January 2018 to October 2023), we employed Multi-Temporal InSAR (MT-InSAR) to derive the deformation field along the transmission corridor. Time-series analysis of the Lingshao (LS) line towers, interpreted through the principles of mining subsidence, revealed the mechanisms behind their differential tilt. Simultaneously, time-series deformation at the tower footings was input to a deep learning model for 365-day prediction; the accuracy and practical applicability of which were rigorously assessed. The results demonstrate that (1) a unidirectional subsidence funnel within the transmission corridor deformation field, in the absence of zonal settlement features, strongly indicates the presence of a goaf beneath the line; (2) the integrated approach combining time-series InSAR with the settlement trough method proves feasible for monitoring transmission tower tilt, as validated through field verification; (3) the magnitude and direction of tower tilt correlate directly with their position in the mining-induced subsidence basin, showing convergent tilt in tensile zones, divergent tilt in compressive zones, and uniform settlement in neutral zones; (4) for the eight selected typical tower footings, predicted deformation values ranged from −284.6 mm to −186.3 mm, showing excellent agreement with measurements through correlation coefficients of 0.989–0.999 and Root Mean Square Error (RMSE) values of 0.54–2.17 mm. The framework enables proactive hazard avoidance during line routing and provides early warning for tower defects, significantly enhancing power infrastructure resilience in mining-affected regions.
1. Introduction
In recent years, the frequency of geological hazards has risen significantly, influenced notably by extreme weather events. Against the backdrop of frequent extreme weather in Henan Province in 2021, areas such as western and northern Henan experienced the “7.20 Extreme Rainstorm” and subsequent rounds of heavy rainfall. These events resulted in saturated rock and soil masses, slope instability, and a heightened frequency of geological disasters. Given their extensive spatial distribution, transmission lines are critical to the stability and security of power grids [1]. Furthermore, once geological hazards act upon transmission towers causing power supply failures, they can readily trigger a chain reaction of secondary disasters, leading to more extensive socioeconomic losses [2].
Current methodologies for monitoring transmission tower tilt primarily include manual inspection [3], sensor-based monitoring [4], manned helicopter patrols [5], unmanned aerial vehicle (UAV) surveys [6], and robotic inspection systems [7]. While these approaches can partially address tilt monitoring and safety management for localized sections of the line, they present significant limitations. Manual inspections, though effective in identifying hazards, lack real-time capability, prove challenging to sustain consistently under harsh geological conditions, and heavily rely on individual expertise [8,9,10]. Sensor-based systems, typically employing Global Navigation Satellite System (GNSS) modules with 5G data transmission, resolve the real-time monitoring constraints of manual methods. However, their performance is susceptible to signal interference, weather conditions, wind, and temperature variations, leading to high false alarm rates. Furthermore, they demonstrate limited effectiveness in providing early warning for abrupt, disaster-induced deformations [11,12,13,14,15]. Manned helicopter inspections are largely unaffected by terrain, cover extensive areas, and offer high precision. However, their operational scope is limited by aviation regulations and weather conditions, accompanied by high costs and an inability to maintain prolonged hovering for fixed-point inspections [16,17,18,19]. Unmanned Aerial Vehicle (UAV) surveys provide greater flexibility and the ability to hover for detailed imaging, yet they involve complex airspace application procedures. Their operational safety is highly dependent on pilot skill, introducing risks of accidental damage to line equipment [20,21]. Robotic inspection systems, while precise, require substantial human intervention, demand high levels of autonomy for effective operation, and exhibit slower inspection speeds compared to other methods [21,22,23,24]. In recent years, the rapid advancement of remote sensing technology, coupled with significant improvements in image resolution, has established remote sensing monitoring as a major developmental direction for power line inspection [25,26,27,28,29,30]. In recent years, with the rapid advancement of artificial intelligence, a series of sophisticated algorithms, including CNN, LSTM, and Transform, have emerged. These algorithms have demonstrated unparalleled superiority over traditional methods in the field of geological hazard prediction. Despite the progress in predictive algorithms, their application to power transmission tower inspection remains scarcely reported in the literature [31,32]. While each aforementioned method has distinct advantages, all exhibit limitations and none adequately addresses the challenge of providing early warning for tower tilt in goaf areas. Consequently, tower collapse incidents continue to occur [33]. The underlying causes of this challenge are complex, but can be attributed to three primary factors: inadequate risk assessment of transmission towers and corridor safety hazards, coupled with poorly defined susceptibility zoning for geohazard development in goaf areas; unclear distribution of mining rights within transmission corridors, which limits multi-source inspection methods to surface-level monitoring; And the difficulty in predicting tower foundation deformation lies in the challenges associated with acquiring long-term time-series data, while modeling complex non-linear time-series predictions remains a complex process.
To address these challenges, this project proposes an integrated methodology that combines Multi-Temporal Interferometric Synthetic Aperture Radar (MT-InSAR) monitoring [34,35,36] with the principles governing surface movement in mining-induced subsidence basins [37,38,39]. This approach will be employed to investigate the mechanisms leading to tower instability and tilt above goaf areas. Furthermore, a deep learning-based prediction algorithm will be developed using the MT-InSAR time-series data to forecast deformation at transmission tower foundations [40]. The outcomes of this research are intended to provide a theoretical foundation and technical support for risk assessment of overhead transmission lines traversing goaf areas.
2. Materials and Methods
2.1. Study Area
The LS ±800 kV transmission line spans 1720 km in total. It connects the Lingzhou Converter Station in Yinchuan, Ningxia, to the Shaoxing Converter Station in Shaoxing, Zhejiang. A 564.3 km segment of the line passes through Henan Province. Five tower foundations are located above the mining area of L Coal Mine. The mine is situated at the boundary between Shanxian and Mianchi counties in Sanmenxia City, Henan Province (Figure 1). The study area lies in the low mountainous and hilly region of western Henan. Elevations are higher in the northeast and lower in the southwest. The landscape is dominated by loess landforms, primarily loess hills. The subsurface stratigraphy consists of Quaternary loess in the upper layers. Below these layers lies Neogene mudstone. The groundwater table is at depths greater than 15 m. The region has shown negligible tectonic activity since the Quaternary period. No evidence of activity has been observed since the Late Pleistocene. Natural geological hazards in the area pose no significant threat to the stability of the UHV tower foundations.
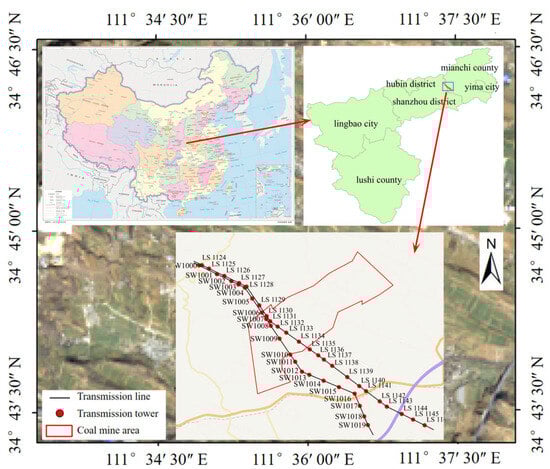
Figure 1.
Overview of the study area.
2.2. Data Source
This study employs five key data sources: SAR satellite imagery, Digital Elevation Model (DEM) data, precise orbit ephemerides, surface deformation data, and transmission tower locations with geometric parameters. The SAR dataset includes 163 C-band Sentinel-1A scenes from the European Space Agency. These scenes were acquired between 1 January 2018, and 8 September 2023. The data exhibit VV polarization and utilize the Interferometric Wide Swath (IW) imaging mode. The spatial resolution is 5 m × 20 m (range × azimuth). The external DEM was generated from NASA’s 30 m SRTM global elevation dataset. Precise orbit ephemerides for Sentinel satellites were sourced from the POD archives. These archives are accessible via the ASF database.
2.3. Methodologies of Data Process
2.3.1. Data Preprocessing
This study investigates surface deformation in the L Coal Mine area crossed by the UHV transmission line. The Small Baseline Subset (SBAS) InSAR technique is employed for this purpose. The SBAS method uses a primary master image along with all slave images. Interferometric pairs are generated among the slave images under short-baseline constraints. From these interferometric pairs, three key products are produced: interferograms, coherence maps, and unwrapped phase maps. Residual topographic phases are removed from the unwrapped phase maps. Surface deformation velocity maps are then derived using the Singular Value Decomposition (SVD) method.
However, the conventional SBAS approach necessitates manual selection of Ground Control Points (GCPs), which may introduce substantial errors if erroneously placed in regions exhibiting residual topography, phase discontinuities, or active deformation. To mitigate this limitation, we propose an integrated framework combining Persistent Scatterer InSAR (PS-InSAR) with the SBAS-InSAR. High-coherence PS points, identified through a deformation velocity threshold ranging from −0.001 mm/year to 0.001 mm/year, were systematically employed as GCPs within the SBAS processing workflow. A comprehensive analysis identified 46,211 high-coherence PS points distributed across stable features including road networks, residential settlements, and exposed bedrock formations within the study area.
The integrated processing workflow comprised three sequential stages: (1) systematic screening of PS points against predefined quality criteria, (2) rigorous coordinate projection and transformation into a consistent SAR geometry, and (3) precise refinement of satellite orbit parameters to enable accurate deformation time series inversion within the SBAS framework.
2.3.2. SBAS-InSAR Methodology
Assuming a time series of Single Look Complex (SLC) SAR images acquired over the study area at epochs . we first select suitable SAR image pairs based on predefined spatiotemporal baseline thresholds. These selected pairs are then grouped into subsets for differential interferometric processing. Each subset undergoes standard interferometric procedures to generate corresponding interferograms, resulting in total interferograms. When is an odd number, the mathematical relationship between and (the number of interferograms) can be expressed as follows:
For two time periods and , with > , the -th interferogram is generated, where has azimuth coordinate and range coordinate .
where represents the time series index; denotes the interferogram index; is the radar center wavelength; and represent the cumulative deformation along the radar line of sight relative to time .
Following the removal of residual topographic phases, atmospheric delay components, and various noise contributions through rigorous phase filtering procedures, the average surface subsidence rate can be quantitatively expressed by Equation (4) as
This equation can be simplified to
Further simplification yields
The matrix is solved using the SVD method to obtain the least squares solution in the minimum norm sense. The phase rate is derived from this solution, enabling the calculation of the linear deformation time series using the above information.
2.3.3. Fbprophet Algorithm
The Fbprophet algorithm [41] decomposes the forecasting target into four components:
where represents the trend component, the seasonal component, the effects of holidays or abrupt anomalies, and the residual term.
The trend component is modeled using either a logistic growth function or a piecewise linear function, thereby accommodating diverse types of time series data. Equation (8) presents the logistic growth function used in the Fbprophet algorithm:
where is a parameter to be set, denotes an indicator function, represents the rate adjustments over time, while and are intermediate variables that ensure function continuity.
Equation (9) expresses the piecewise linear trend function within the Fbprophet framework:
where represents the piecewise slope.
The seasonal component employs Fourier series to model seasonality or periodicity in the time series, adapting to different periodic types by setting varying day parameters. Equation (10) shows the Fourier series expression in the Fbprophet algorithm:
where denotes the period. For annual cycles (, is set to 10; for weekly cycles (), is set to 3. Coefficients and represent the Fourier series coefficients.
To account for holidays with varying durations and impacts, the algorithm defines unique time windows for each holiday event. For holidays, represents the time period before and after each holiday. The holiday component is expressed in Equation (11):
where denotes an indicator function with , and follows a normal distribution .
3. Results
3.1. Deformation Rate Field
Following the methodology described above, the surface deformation field over the study area was inverted using the SARscape 5.6.2 platform. The spatial extents of three mining panels (1208, 1206, and 1116) in L Coal Mine were overlaid with the deformation field, as illustrated in Figure 2. The surface subsidence basins exhibit movement directions consistent with the advance of underground mining activities, demonstrating the strong reliability of InSAR technology for monitoring dynamic mining-induced subsidence.
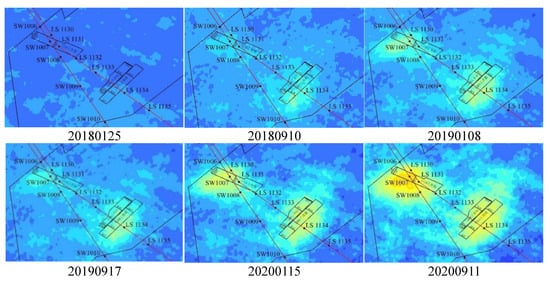
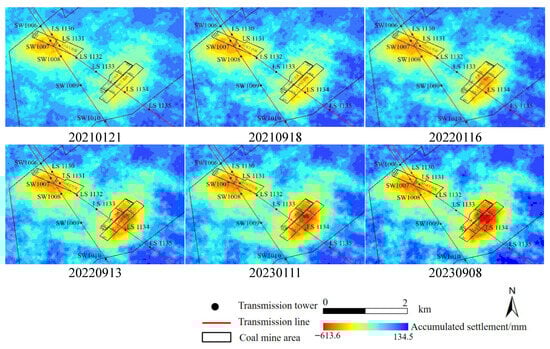
Figure 2.
Spatiotemporal evolution process of surface deformation in the study area.
Transmission towers SW1006 to SW1010 and LS1130 to LS1134 were superimposed on the subsidence field. The results indicate that the subsidence basins have affected towers LS1134 and SW1007. As underground mining operations progressed, both the magnitude of subsidence at the basin centers and the areal extent of the basins increased, subsequently impacting eight additional towers. As of 8 September 2023, two distinct subsidence basins have been identified within the study area.
3.2. Surface Deformation Results
Differential interferometric processing of 163 Sentinel-1A scenes using the SBAS-InSAR technique yielded the surface deformation velocity field for the study area, as shown in Figure 3, where red areas indicate surface subsidence. Superimposing the transmission line routes and tower locations revealed that two subsidence funnels within the mining concession of L Coal Mine are affecting the foundation stability of towers along the LS and SW UHV transmission lines. Specifically, towers SW1006–SW1010 and LS1130–LS1134 are potentially experiencing tilt.
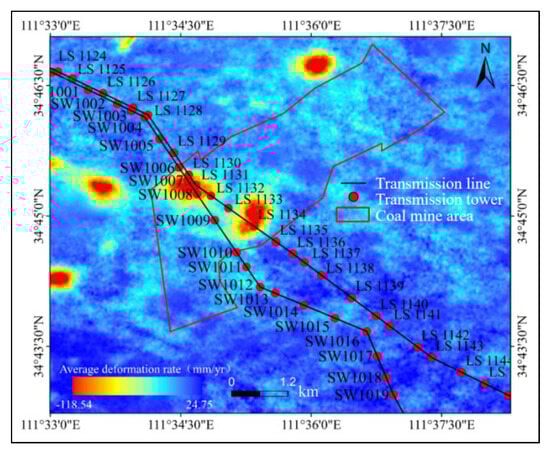
Figure 3.
Deformation velocity map.
Between January 2018 and September 2023, the maximum cumulative settlement near LS1131 reached approximately −444.3 mm, corresponding to an average annual deformation rate of about −94.8 mm/a. In the vicinity of LS1134, the cumulative settlement reached approximately −613.6 mm, with an average annual deformation rate of about –106.6 mm/a.
To investigate the influence of the two subsidence funnels’ spatiotemporal evolution on the UHV transmission line, we analyzed the time-series deformation field of the study area, as shown in Figure 2. A subsidence funnel initially developed near tower LS1134. In May 2018, settlement was observed on the right side of tower LS1134 (relative to the increasing stake number direction along the line), indicating a potential risk of tilt toward the right. Over time, the subsidence funnel progressively extended toward the left. By September 2021, the magnitude of settlement on the left side exceeded that on the right, suggesting a subsequent risk of leftward tilt for tower LS1134.
In September 2018, settlement near tower LS1131 emerged on the right side of towers LS1130, SW1006, and SW1007. The subsidence funnel continued to propagate predominantly toward the right side of the line, potentially causing the affected towers to tilt progressively to the right and threatening their structural integrity as the funnel develops.
The unidirectional development of the subsidence funnels may be attributed to two primary mechanisms. First, the progressive extraction of the underground coal seam, advancing from the right side of the line towards the left, caused the roof strata to collapse and propagate upwards, resulting in surface subsidence. Second, surface erosion and soil loss due to rainfall could lead to a reduction in ground elevation. Given that the study area experiences a warm temperate semi-humid monsoon climate with an annual precipitation of 400–700 mm, and critically, no extensive areal subsidence patterns were observed, the second cause can be reasonably ruled out.
3.3. Prediction Results
When transmission towers experience tilt, the inability to accurately forecast future deformation poses significant challenges for maintenance planning by decision-making departments. The capability to determine the magnitude of future tower deformation enables proactive maintenance scheduling, which is crucial for disaster prevention and mitigation.
Based on MT-InSAR monitoring data, this study selected towers LS1130 and LS1132 as representative cases, extracting time-series data from their four footing locations. Using the Fbprophet algorithm implemented in Python 3.8 (For a comprehensive technical implementation of the programming methodology, readers are directed to the author’s dedicated monograph on Slope Deformation Prediction [34]), a prediction model was developed with normalized time-series data (15-day sampling intervals) as the training set to forecast deformations at the eight tower footings over the subsequent 365 days. The results are presented in Figure 4 and Figure 5.
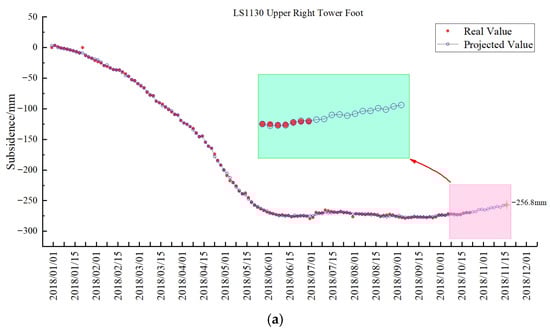
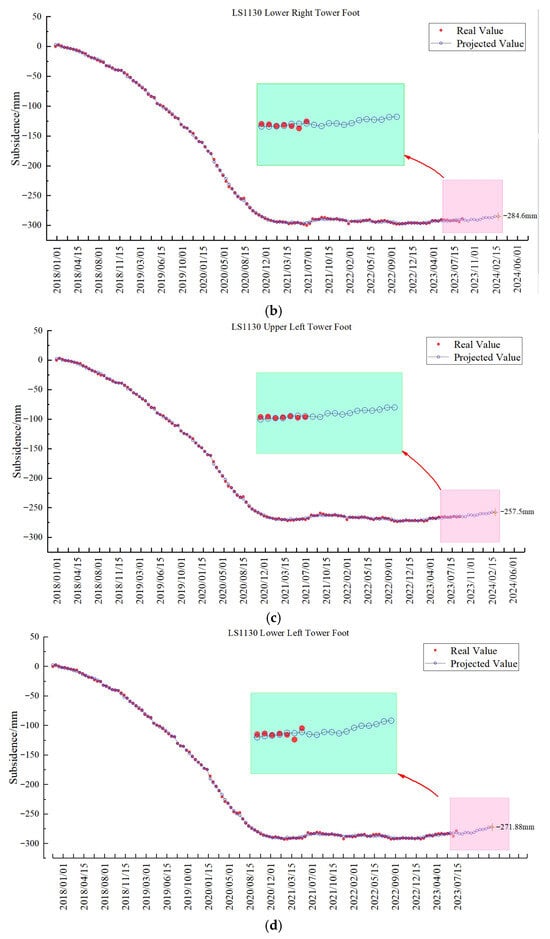
Figure 4.
Deformation prediction for Tower LS1130 footings. (a) Northeast footing prediction; (b) Southeast footing prediction; (c) Northwest footing prediction; (d) Southwest footing prediction.
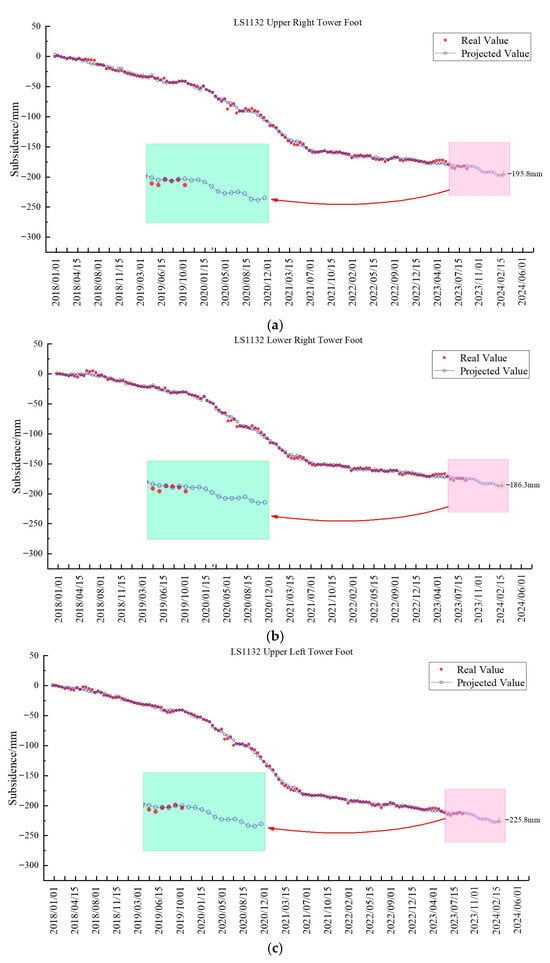
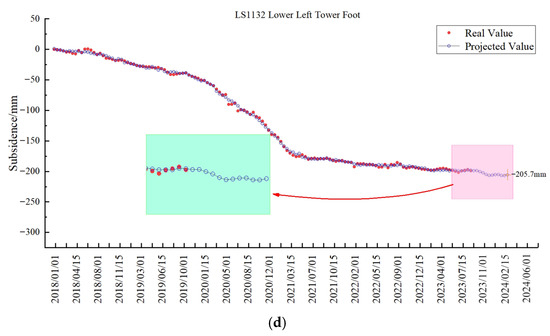
Figure 5.
Deformation prediction for Tower LS1132 footings. (a) Northeast footing prediction; (b) Southeast footing prediction; (c) Northwest footing prediction; (d) Southwest footing prediction.
(1) As shown in Figure 4, the foundation deformation of tower LS1130 exhibited minor fluctuations but had largely stabilized by September 2023. The predicted cumulative deformations by June 2024 are: −256.8 mm at the northeast footing (Figure 4a), −284.6 mm at the southeast footing (Figure 4b), −257.5 mm at the northwest footing (Figure 4c), and −271.9 mm at the southwest footing (Figure 4d).
(2) Figure 5 indicates that the foundation deformation of tower LS1132 continued to follow a fluctuating downward trend through September 2023. The predicted cumulative deformations by June 2024 are: −198.5 mm at the northeast footing (Figure 5a), −186.3 mm at the southeast footing (Figure 5b), −225.8 mm at the northwest footing (Figure 5c), and −205.7 mm at the southwest footing (Figure 5d).
(3) Although seasonal fluctuations are expected to persist in the predictions for the coming year, the overall downward trend remains consistent. Differential settlement between the left and right sides of the foundations is predicted: for LS1130, the southern footings show significantly greater settlement than the northern ones, suggesting a potential backward tilt; for LS1132, the northern footings exhibit more substantial settlement than the southern ones, indicating a possible forward inclination.
4. Discussion
4.1. Tower Tilt Analysis Based on Settlement Trough Method
To further evaluate the tilt behavior of individual towers, characteristic points were extracted along cross-sections perpendicular to the transmission line centered on each tower. Cross-sectional settlement curves were plotted for towers LS1130–LS1134 of the LS line and towers SW1006–SW1010 of the SW line, as shown in Figure 6.
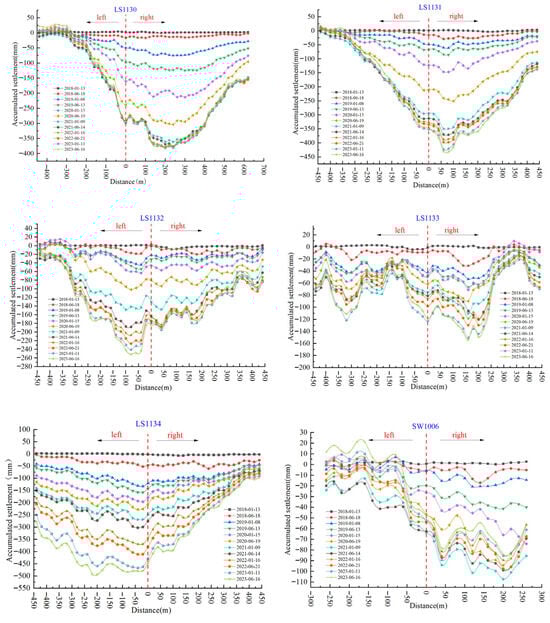
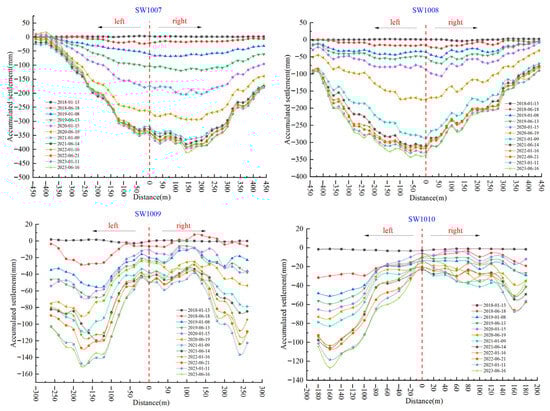
Figure 6.
Cross-sectional settlement variation curves.
Analysis reveals that among the five LS line towers located within the subsidence funnel, LS1130 and LS1134 exhibit significant differential settlement between the left and right sides of their cross-sections. Specifically, the cumulative settlement curve for LS1130 shows a decreasing trend from left to right, indicating a tendency for the tower to tilt toward the right. In contrast, LS1134 and LS1132 display an increasing cumulative settlement trend from left to right, suggesting a potential leftward tilt. For LS1131 and LS1133, the annual cumulative settlements on both sides are approximately equal, resulting in minimal tilt.
Examination of the five SW line towers within the settlement funnel indicates that SW1006 shows substantial differential settlement across its cross-section, with surface settlement decreasing from left to right. This pattern suggests a tendency for the tower to tilt to the right. Although SW1007 also exhibits a decreasing settlement trend from left to right, the gradient is relatively gentle, indicating a lower probability of significant rightward tilt. Meanwhile, SW1008, SW1009, and SW1010 demonstrate nearly uniform settlement on both sides, making them unlikely to experience notable tilt in the cross-sectional direction.
Characteristic points were extracted along the alignment of the transmission lines to plot longitudinal settlement variation curves for the LS and SW lines (see Figure 7 and Figure 8). The longitudinal profile of the LS line indicates distinct differential settlement patterns along the direction of the line at towers LS1130 and LS1132. The cumulative settlement curve for LS1130 shows a decreasing trend along the line direction, whereas LS1132 exhibits an increasing trend. This suggests that towers LS1130 and LS1133 have a tendency to tilt forward (along the line direction), while LS1132 tends to tilt backward.
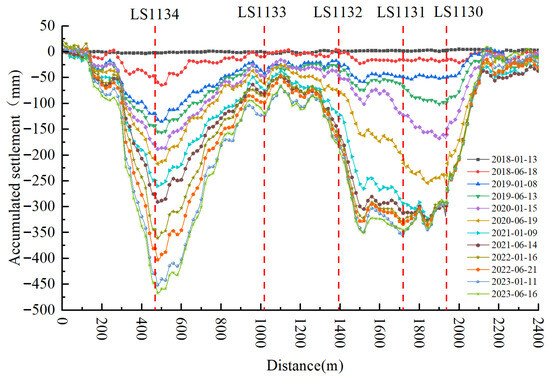
Figure 7.
Longitudinal settlement variation curves for transmission towers LS1130–LS1134.
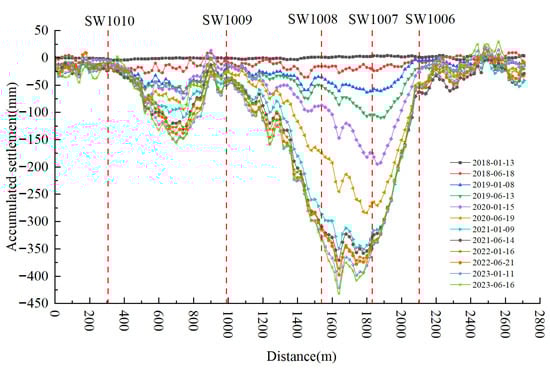
Figure 8.
Longitudinal settlement variation curves for transmission towers SW1006–SW1009.
The longitudinal profile of the SW line reveals that SW1007 and SW1008 exhibit decreasing and increasing settlement trends along the line, indicating forward and backward tilting tendencies, respectively. The settlement at SW1006 also shows a decreasing trend along the line, suggesting a forward tilt. In contrast, SW1009 and SW1010 demonstrate nearly uniform settlement along the longitudinal direction, showing no significant tilting tendency in the forward-backward direction.
By integrating the spatial relationship between tower locations and the settlement funnel from the previous cross-sectional analysis with the longitudinal settlement curves through time-series cross-comparison, it can be concluded that towers LS1130, LS1131, LS1132, LS1133, LS1134, SW1006, and SW1007 are likely experiencing tilt.
4.2. Field Verification and Analysis
Based on the InSAR monitoring results, seven tower foundations were initially identified as potentially unstable. Following the principles of geological hazard investigation—comprising preliminary, detailed, and verification surveys—field inspections revealed evidence of corrective measures at towers SW1006 and SW1007. Specifically, specialized steel plates had been inserted beneath the tower base and foundation top surfaces (Figure 9), indicating that these towers had previously experienced tilt. This finding confirms the feasibility of using the cross-section method for monitoring tower inclination.
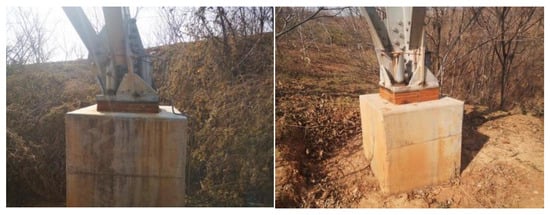
Figure 9.
Evidence of tower realignment.
Additionally, unusual opposite-direction tilting was observed in the optical cable and ground wire clamps of towers LS1130 and LS1132. In routine line maintenance, ground wire clamps typically tilt in the same direction; opposite tilting is considered abnormal, as shown in Figure 10.
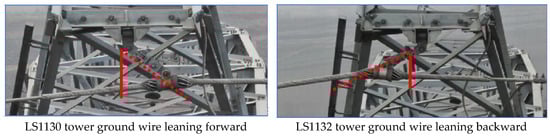
Figure 10.
Abnormal ground wire alignment at site.
Given the observed tilting defects at LS1130 and LS1132, further verification was conducted using leveling instruments, tower inclination sensors, and foundation reference marks. The results are summarized in Table 1. Tower LS1130 is situated on a hilltop at the northern edge of the subsidence area, where the high rock content in the soil creates complex stress conditions and severe differential settlement. As a result, the tower body has been subjected to imbalanced stress, causing bending in some auxiliary members (Figure 11).

Table 1.
Verification Results of Tower Foundation Settlement.
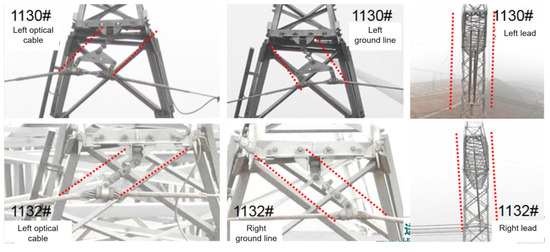
Figure 11.
Deformation of tower auxiliary members.
Tower LS1132, located at the southeastern edge of the subsidence zone, also exhibits uneven settlement. Circular step-shaped cracks have appeared near the tower footings (Figure 12), leading to tower inclination. As the subsidence center has shifted from northwest to southeast, the tower initially tilted toward the northwest and currently tilts toward both the northwest and due north. Since the surrounding area consists of farmland with relatively uniform soil load-bearing capacity, the foundation settlement is consistent on each side, and the tower structure remains stable.
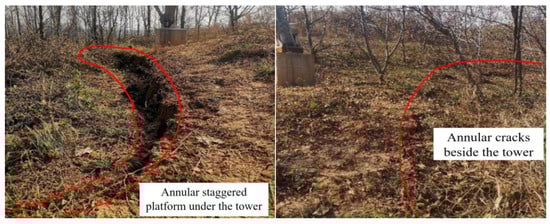
Figure 12.
Ground deformation at tower foundation.
Analysis of Table 1 indicates significant foundation settlement at towers LS1130 and LS1132. The tilt of tower LS1132 reached 3.64‰, exceeding the specified threshold for straight-line towers in the operational code DL/T 5235-2010 (maximum allowable tilt: 3‰) as well as the requirement in the overhead transmission line operation code DL/T 741-2019 (maximum allowable tilt: 2.5‰). Field verification confirms that the tilt magnitudes at LS1130 and LS1132 constitute general defects, further validating the feasibility of using InSAR technology for monitoring tilt-induced hazards along transmission line corridors.
4.3. Mechanism Analysis of Differential Tower Foundation Tilting
Review of as-built route agreements and related documentation confirms that the LS line traverses the L Coal Mine area. Field verification and consultations with relevant authorities confirm that the observed tower tilting results from ground subsidence due to goaf formation. Tower LS1131, situated directly above the protective coal pillar on the upslope of the first mining area, experienced relatively uniform settlement after coal extraction, resulting in controllable tilt levels. In contrast, Tower LS1132, located at the edge of the same upslope pillar, underwent differential settlement induced by partial extraction. This process initiated around September 2020 and has continued progressively, causing tilting in the optical cable, ground wire clamp, and conductor insulator at both LS1132 and LS1133. Although Tower LS1133, positioned at the boundary of the mining panel, currently exhibits tilt within acceptable limits, future mining activities may trigger additional differential settlement. Tower LS1134, situated at the upper section of the mining panel, remains susceptible to ongoing mining impacts. The current tilt distribution across the towers in the LS line study area is illustrated in Figure 13.
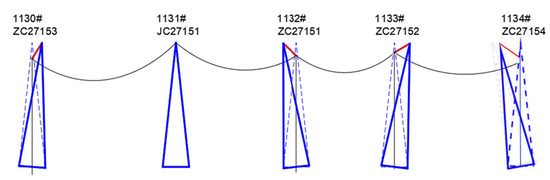
Figure 13.
Schematic diagram of tilt distribution.
As shown in Figure 14, Towers LS1130, LS1131, and LS1132 are located within the same goaf area but exhibit distinct tilt behaviors. Tower LS1130 lies above the upper section of Panel 1116 (red frame in Figure 14), LS1131 is positioned above the protective coal pillar for the upslope entry of the first mining area, and LS1132 sits above the protective pillar of the main roadway, adjacent to the upslope entry protection zone. Panel 1116 was fully extracted in 2014, while mining of the protective pillars commenced in September 2019, advancing from northwest to southeast, and is now largely completed. The working face is currently located approximately 20 m to the left (northwest) of Tower LS1132. By November 2020, a funnel-shaped subsidence zone (surface movement basin) had formed and has since continued to propagate southeast. According to mining subsidence theory, under supercritical mining conditions, the surface subsidence basin can be divided into three distinct zones, as indicated by the gray segments in Figure 14.
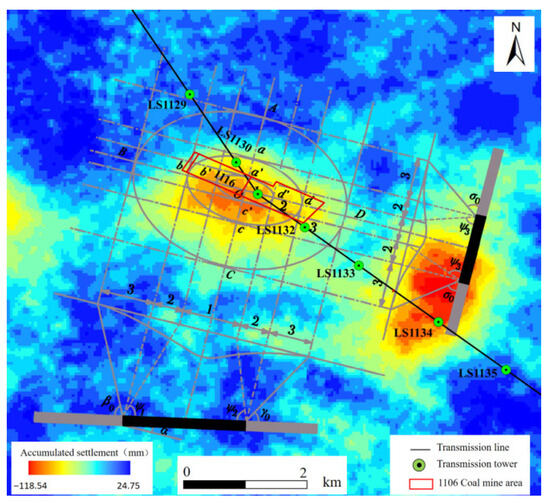
Figure 14.
Spatial relationship between subsidence basin and transmission towers.
Neutral Zone: Located in the central part of the subsidence basin, this area experiences uniform settlement with negligible differential movement and deformation, and no significant surface cracking. This corresponds to the gray segment labeled “1” in Figure 14.
Compression Zone: Situated at the inner edge of the basin, this zone exhibits differential settlement. The ground surface moves toward the basin center, forming a concave profile. The area undergoes compressive deformation without developing significant cracks, as shown in the gray segment labeled “2” in Figure 14.
Tension Zone: Found at the outer edge of the basin, this region experiences non-uniform settlement with ground movement directed toward the basin center, forming a convex profile. Tensile deformation prevails, resulting in surface cracking, as indicated by the gray segment labeled “3” in Figure 14.
The degree of tower tilt correlates directly with its position within the mining-induced subsidence basin. Towers located in the tension and compression zones tend to tilt toward the basin center, while those in the neutral zone undergo uniform settlement. As illustrated in Figure 14, LS1130 lies within the compression zone, LS1131 in the neutral zone, and LS1132 in the tension zone. This spatial distribution accounts for the differential tilt behavior observed among the three towers within the same subsidence basin.
4.4. Predictive Model Reliability Validation and Accuracy Assessment
- (1)
- Model reliability validation
To validate the prediction model’s reliability, we compared the model’s forecasts with the training data. The MT-InSAR monitoring data from eight tower footings (2018–2023) were compared with corresponding predicted values. The absolute extreme error values between predicted and monitored measurements were statistically analyzed to evaluate the model’s predictive reliability, as summarized in Table 2.
Table 2.
Maximum or minimum error for sample points.
- (2)
- Model prediction accuracy assessment
To evaluate the prediction accuracy of tower footing deformation, the MT-InSAR measurements were treated as observed values and compared with the predicted values. Two evaluation metrics were employed: the correlation coefficient and the Root Mean Square Error (), calculated using Equations (12) and (13), respectively. The evaluation results are summarized in Table 3.
Table 3.
Results of accuracy evaluation.
As shown in Table 3, the correlation coefficient R ranges from 0.989 to 0.999, indicating a strong correlation between predicted and observed values. The RMSE values vary between 0.54 mm and 2.17 mm. These results demonstrate the applicability of the Python-implemented Fbprophet algorithm for predicting foundation deformation at transmission tower footings, confirming the scientific soundness and reliability of the predictions.
5. Conclusions
This study employed 163 Sentinel-1A scenes and MT-InSAR technology to derive the deformation field along the overhead transmission line corridor in the study area. Using the cross-section method, we analyzed the spatiotemporal deformation patterns of towers along the LS line and investigated the mechanisms underlying their differential settlement. The main conclusions are as follows:
(1) Analysis of the time-series InSAR deformation field revealed unidirectional development of subsidence funnels in the study area. Combined with the absence of areal ground settlement patterns and considering local industrial characteristics, these funnels are attributed to the progressive extraction of underground coal mining panels from the right to the left side of the line. Roof collapse propagating to the surface has induced ground subsidence, threatening the safety of the transmission line corridor.
(2) The settlement trough method was applied to assess the development of individual tower defects. By analyzing the spatial relationship between tower cross-sections and longitudinal profiles with the goaf area, and conducting cross-comparisons of time-series settlement curves, potential tilt was identified at towers LS1130, LS1131, LS1132, LS1133, LS1134, SW1006, and SW1007. Field verification confirmed tilting in ground wire clamps and conductor insulators, demonstrating the feasibility of integrating InSAR with the settlement trough method for monitoring transmission tower inclination.
(3) Based on mining subsidence theory, the mechanisms for differential settlement among towers LS1130–LS1133 within the same subsidence basin were analyzed. Towers located in the neutral zone of the basin experienced uniform foundation settlement without structural or ancillary component defects. Zoning of the subsidence basin can provide data references and theoretical support for tower siting of overhead transmission lines.
(4) Using ENVI 5.6 time-series analysis tools, deformation curves were extracted for eight footings of two towers. The cumulative deformation time series exhibited fluctuations. A deep learning algorithm was applied to predict the fluctuating deformation time series of the tower foundations, with predicted values ranging from −284.6 mm to −186.3 mm. Comparisons between predicted and measured values showed correlation coefficients of 0.989–0.999 and Root Mean Square Errors of 0.54–2.17 mm.
The prediction framework proposed in this study is applicable to forecasting foundation deformation at UHV transmission tower footings, providing early warning of deformation. Using predictions to analyze risks and identify potential hazards can enhance the technical capacity for comprehensive slope disaster prevention. While the combined MT-InSAR and Fbprophet approach in this research focused on predicting foundation deformation at UHV transmission tower footings, the methodology is not limited to this application. It can also be extended to deformation prediction in projects such as the South-to-North Water Diversion, landslide risk assessment, and urban land subsidence monitoring. Furthermore, it holds potential for monitoring and predicting deformation in cultural heritage preservation, including ancient monuments, historical buildings, and city walls. Although the prediction method in this study accurately captured deformation at tower footings, it is currently best suited for rapidly changing data. To better address data seasonality and achieve future advances, integrating neural networks with seasonal indicators may be necessary.
Author Contributions
Conceptualization, L.D. and Y.Z. (Yi Zhou); methodology, L.D.; software, Y.Z. (Yuesong Zheng); validation, Z.M., D.W. and Y.G.; formal analysis, Z.W.; investigation, Y.J., L.D.; resources, Y.Z. (Yuesong Zheng); data curation, Y.Z. (Yuesong Zheng); writing—original draft preparation, L.D.; writing—review and editing, Y.Z. (Yuesong Zheng); visualization, Y.Z. (Yuesong Zheng); supervision, D.W.; project administration, Y.Z. (Yuesong Zheng); funding acquisition, Y.Z. (Yuesong Zheng). All authors have read and agreed to the published version of the manuscript.
Funding
This research was funded by Science and Technology Project of State Grid Henan Electric Power Company, Project Title: Research on Risk Assessment and Early Warning Technology for Adverse Geological Disasters Along Transmission Lines, grant number 5217L0230004.
Data Availability Statement
The datasets presented in this article are not readily available because China′s precise power line data is classified information. Requests to access the datasets should be directed to the corresponding author.
Conflicts of Interest
The authors declare no conflicts of interest.
References
- Zhang, R.Z. Safety risk assessment method for forest power corridor based on multi-source data. Acta Geod. Cartogr. Sin. 2022, 51, 784–794. [Google Scholar]
- LaCommare, K.H.; Eto, J.H. A review of the causes, consequences, and policy implications of electricity outages. Renew. Sustain. Energy Rev. 2006, 10, 395–420. [Google Scholar]
- Matikainen, L.; Lehtomäki, M.; Ahokas, E.; Hyyppä, J.; Karjalainen, M.; Jaakkola, A.; Kukko, A.; Heinonen, T. Remote sensing methods for power line corridor surveys. ISPRS J. Photogramm. Remote Sens. 2016, 119, 10–31. [Google Scholar] [CrossRef]
- Moschas, F.; Stiros, S. Measurement of the dynamic displacement of an engineering structure using a geodetic robotic total station. J. Surv. Eng. 2011, 137, 99–104. [Google Scholar]
- Zhou, R.Q.; Xu, Z.H.; Peng, C.G.; Zhang, F.; Jiang, W.S. A classification method for airborne laser point cloud of high-voltage transmission corridor. Sci. Surv. Mapp. 2019, 44, 21–27+33. [Google Scholar]
- Siebert, S.; Teizer, J. Mobile 3D mapping for surveying earthwork projects using an Unmanned Aerial Vehicle (UAV) system. Autom. Constr. 2014, 41, 1–14. [Google Scholar] [CrossRef]
- Debenest, P.; Guerrini, E.; Takita, K. Expliner—Toward a practical robot for inspection of high-voltage lines. In Field and Service Robotics; Springer: Berlin/Heidelberg, Germany, 2014; pp. 107–119. [Google Scholar]
- Liu, Z.; Du, Y.; Chen, Y. Simulation and test of safety distance for UAV inspection of ±500kV DC transmission line tower. High Volt. Eng. 2019, 45, 426–432. [Google Scholar]
- Youssef, A.M.; Pradhan, B.; Tarabees, E. Integrated evaluation of urban development suitability based on remote sensing and GIS techniques: Contribution from the analytic hierarchy process. Arab. J. Geosci. 2011, 4, 463–473. [Google Scholar] [CrossRef]
- Hallermann, N.; Morgenthal, G. Visual inspection strategies for large bridges using unmanned aerial vehicles (UAVs). Struct. Infrastruct. Eng. 2014, 10, 834–843. [Google Scholar]
- Meng, X.; Roberts, G.W. Detecting bridge dynamics with GPS and triaxial accelerometers. Eng. Struct. 2005, 27, 317–325. [Google Scholar] [CrossRef]
- Naghoosi, E.; Izadi, I.; Chen, T. Estimation of alarm chattering. J. Process Control 2011, 21, 1243–1249. [Google Scholar] [CrossRef]
- Yang, F.; Shah, S.L.; Xiao, D. Correlation analysis of alarm data and alarm limit design for industrial processes. In Proceedings of the 2010 American Control Conference, Baltimore, MD, USA, 30 June–2 July 2010; IEEE: Piscataway, NJ, USA, 2010; pp. 5850–5855. [Google Scholar]
- Sharma, V.; Varma, A.S.; Singh, A.; Singh, D.; Yadav, B.P. A critical review on the application and problems caused by false alarms. Intell. Commun. Control. Devices 2018, 624, 371–380. [Google Scholar]
- Intrieri, E.; Raspini, F.; Fumagalli, A.; Lu, P.; Del Conte, S.; Farina, P.; Allievi, J.; Ferretti, A.; Casagli, N. The Maoxian landslide as seen from space: Detecting precursors of a failure with Sentinel-1 data. Landslides 2018, 15, 123–133. [Google Scholar] [CrossRef]
- Jones, D. A review of the use of helicopters for overhead power line inspection. IEEE Proc. Gener. Transm. Distrib. 2002, 149, 367–371. [Google Scholar]
- Rohan, A.; Rabah, M. A review of power line inspection systems. J. Electr. Eng. Technol. 2015, 10, 2341–2348. [Google Scholar]
- Lin, Z.H. Discussion of helicopter inspection for EHV transmission lines. Fujian Power Electr. Eng. 2004, 24, 16–18. [Google Scholar]
- Zhang, K.; Li, H.F.; Wang, W. Analysis of helicopter patrol application prospect in China’s UHV grid. High Volt. Eng. 2006, 32, 45–46+55. [Google Scholar]
- Cirillo, D.; Cerritelli, F.; Agostini, S.; Bello, S.; Lavecchia, G.; Brozzetti, F. Integrating Post-Processing Kinematic (PPK)-Structure-from-Motion (SfM) with Unmanned Aerial Vehicle (UAV) Photogrammetry and Digital Field Mapping for Structural Geological Analysis. ISPRS Int. J. Geo Inf. 2022, 11, 437. [Google Scholar] [CrossRef]
- Huang, C. Research on Structure and Precise Control of High-Voltage Line Inspection Robot. Master’s Thesis, Beijing Forestry University, Beijing, China, 2021. [Google Scholar]
- Liu, W.M.; Huang, Z.T.; Wan, R.Y. Application of UAV low-altitude photography technology in intelligent inspection of overhead transmission lines. China Plant Eng. 2025, 13, 183–185. [Google Scholar]
- Portugal, D.; Almeida, L.; Santos, L. A survey on multi-robot patrolling algorithms. Phys. A Stat. Mech. Its Appl. 2014, 410, 383–397. [Google Scholar]
- Metni, N.; Hamel, T. A UAV for bridge inspection: Visual servoing control law with orientation limits. Autom. Constr. 2007, 17, 3–10. [Google Scholar] [CrossRef]
- Liao, C.; Wang, J. Automatic detection of transmission towers in aerial images based on deep learning. IEEE Trans. Geosci. Remote Sens. 2020, 58, 5197–5208. [Google Scholar]
- Fei, Y.; Sawaya, K.E.; Loeffelholz, B.C.; Bauer, M.E. Land cover classification and change analysis of the Twin Cities (Minnesota) metropolitan area by multitemporal Landsat remote sensing. Remote Sens. Environ. 2005, 98, 317–328. [Google Scholar]
- Peng, Q.J.; Jiang, X.W.; Zhang, L.S.; Ma, Y.; Zhou, F.; Qian, G.; Zhou, X.; Zhai, S.; Zhou, T. Analysis of electric field distribution at acquisition terminal of portable intelligent patrol video collection for transmission line based on finite element method. High Volt. Appar. 2018, 54, 194–199. [Google Scholar]
- Carle, M.V.; Wang, L.; Sasser, C.E. Mapping freshwater marsh species distributions using WorldView-2 high-resolution multispectral satellite imagery. Int. J. Remote Sens. 2014, 35, 4698–4716. [Google Scholar] [CrossRef]
- Li, Y.; Li, W.; Zhang, H. Automatic detection of power line insulator defects based on deep learning. IEEE Trans. Power Deliv. 2020, 35, 2034–2044. [Google Scholar]
- Jwa, Y.; Sohn, G. A multi-pass, multi-resolution approach for 3D modeling of power line corridors from airborne LiDAR data. Can. J. Remote Sens. 2010, 36, 511–526. [Google Scholar]
- Li, H.; Li, B.; Yao, J.; Hu, S.; Yang, F. Refined Simulation of Strong Convective Winds in Jiangsu and Its Application to Tower Level Disaster Prevention and Forecast of Power Grid. Procedia Comput. Sci. 2023, 224, 395–400. [Google Scholar] [CrossRef]
- Khojasteh, M.; Bahreinian, S.; Riasi, A. Predictive modeling for savonius hydrokinetic turbine performance: A machine learning investigation. Energy 2025, 340, 139109. [Google Scholar] [CrossRef]
- Tapia-Hernández, E.; Ibarra-González, S.; De-León-Escobedo, D. Collapse mechanisms of power towers under wind loading. Struct. Infrastruct. Eng. 2017, 13, 766–782. [Google Scholar] [CrossRef]
- Ding, L.; Li, C.; Wei, L.; Guo, Z.; Jia, P.; Wang, W.; Gao, Y. Slope deformation prediction based on MT-InSAR and Fbprophet for deep excavation section of South-North Water Transfer Project. Sustainability 2022, 14, 10873. [Google Scholar] [CrossRef]
- Chen, Z.; Gao, X.; Lei, J. Monitoring of wind erosion in the southern Aral Sea using SBAS-InSAR technology. Int. Soil Water Conserv. Res. 2025, 13, 551–563. [Google Scholar] [CrossRef]
- Hussain, S.; Pan, B.; Hussain, W.; Sajjad, M.M.; Ali, M.; Afzal, Z.; Abdullah-Al-Wadud, M.; Tariq, A. Integrated PSInSAR and SBAS-InSAR analysis for landslide detection and monitoring. Phys. Chem. Earth 2025, 139, 103956. [Google Scholar] [CrossRef]
- Khan, A.B.; Zhao, C.; Kakar, N.; Chen, X. SBAS-InSAR monitoring of landslides and glaciers along the Karakoram Highway between China and Pakistan. Remote Sens. 2025, 17, 605. [Google Scholar] [CrossRef]
- Jiang, C.; Wang, L.; Yu, X.; Chi, S.; Wei, T.; Wang, X. DPIM-Based InSAR Phase Unwrapping Model and a 3D Mining-Induced Surface Deformation Extracting Method: A Case of Huainan Mining Area. KSCE J. Civ. Eng. 2020, 25, 654–668. [Google Scholar] [CrossRef]
- Ng, A.H.M.; Ge, L.; Du, Z.; Wang, S.; Ma, C. Satellite radar interferometry for monitoring subsidence induced by longwall mining activity using Radarsat-2, Sentinel-1 and ALOS-2 data. Int. J. Appl. Earth Obs. Geoinf. 2017, 61, 92–103. [Google Scholar] [CrossRef]
- Hu, J.; Li, Z.W.; Ding, X.L.; Zhu, J.J.; Zhang, L.; Sun, Q. Resolving three-dimensional surface displacements from InSAR measurements: A review. Earth-Sci. Rev. 2014, 133, 1–17. [Google Scholar] [CrossRef]
- Taylor, S.J.; Letham, B. Forecasting at Scale. Am. Stat. 2018, 72, 37–45. [Google Scholar] [CrossRef]


Disclaimer/Publisher’s Note: The statements, opinions and data contained in all publications are solely those of the individual author(s) and contributor(s) and not of MDPI and/or the editor(s). MDPI and/or the editor(s) disclaim responsibility for any injury to people or property resulting from any ideas, methods, instructions or products referred to in the content. |
© 2025 by the authors. Licensee MDPI, Basel, Switzerland. This article is an open access article distributed under the terms and conditions of the Creative Commons Attribution (CC BY) license (https://creativecommons.org/licenses/by/4.0/).