Article

Geospatial Analysis of Soil Quality Parameters and Soil Health in the Lower Mahanadi Basin, India

by
Sagar Kumar Swain
1,
Bikash Ranjan Parida
1,
Ananya Mallick
1,
Chandra Shekhar Dwivedi
1,
Manish Kumar
1,
Arvind Chandra Pandey
1 and
Navneet Kumar
2,*
1
School of Natural Resource Management, Central University of Jharkhand, Ranchi 835222, India
2
Division of Ecology and Natural Resources Management, Center for Development Research (ZEF), University of Bonn, Genscherallee 3, 53113 Bonn, Germany
*
Author to whom correspondence should be addressed.
GeoHazards 2025, 6(4), 71; https://doi.org/10.3390/geohazards6040071
Submission received: 1 September 2025 / Revised: 22 October 2025 / Accepted: 28 October 2025 / Published: 1 November 2025

Abstract

The lower Mahanadi basin in eastern India is experiencing significant land and soil transformations that directly influence agricultural sustainability and ecosystem resilience. In this study, we used geospatial techniques to analyze the spatial-temporal variability of soil quality and land cover between 2011 and 2020 in the lower Mahanadi basin. The results revealed that the cropland decreased from 39,493.2 to 37,495.9 km2, while forest cover increased from 12,401.2 to 13,822.2 km2, enhancing soil organic carbon (>290 g/kg) and improving fertility. Grassland recovered from 4826.3 to 5432.1 km2, wastelands declined from 133.3 to 93.2 km2, and water bodies expanded from 184.3 to 191.4 km2, reflecting positive land–soil interactions. Soil quality was evaluated using the Simple Additive Soil Quality Index (SQI), with core indicators bulk density, organic carbon, and nitrogen, selected to represent physical, chemical, and biological components of soil. These indicators were chosen as they represent the essential physical, chemical, and biological components influencing soil functionality and fertility. The SQI revealed spatial variability in texture, organic carbon, nitrogen, and bulk density at different depths. SQI values indicated high soil quality (SQI > 0.65) in northern and northwestern zones, supported by neutral to slightly alkaline pH (6.2–7.4), nitrogen exceeding 5.29 g/kg, and higher organic carbon stocks (>48.8 t/ha). In contrast, central and southwestern regions recorded low SQI (0.15–0.35) due to compaction (bulk density up to 1.79 g/cm3) and fertility loss. Clay-rich soils (>490 g/kg) enhanced nutrient retention, whereas sandy soils (>320 g/kg) in the south increased leaching risks. Integration of LULC with soil quality confirms forest expansion as a driver of resilience, while agricultural intensification contributed to localized degradation. These findings emphasize the need for depth-specific soil management and integrated land-use planning to ensure food security and ecological sustainability.

1. Introduction

Land use/land cover (LULC) refers to the physical characteristics and human utilization of the Earth’s surface, including natural vegetation, urban areas, agriculture, water bodies, and barren lands. LULC data is essential for understanding the spatial distribution and dynamics of these land cover types, providing critical insights for natural resource management, particularly soil degradation. Shifts in LULC represent a pressing environmental issue worldwide, posing significant challenges to agro-ecosystems and human societies [1]. Such changes have a profound influence on soil erosion, which is widely acknowledged as a central concern in agricultural research [2]. Evaluating LULC alterations and their links to erosion processes provides critical information for policymakers and land managers [3]. Severe erosion negatively impacts landscape processes by reducing agricultural productivity, altering hydrological cycles, and affecting human livelihoods. Accordingly, assessing soil erosion dynamics and land degradation are crucial to understanding landscape stability and function. At both global and regional levels, LULC monitoring is particularly relevant in agriculture ecosystems, where rapid transformations have been observed [4] leading to soil degradation and loss of soil fertility.
Soil erosion is a major driver of land degradation and is widely regarded as a critical environmental challenge [5,6,7,8]. In recent years, both land degradation and surface mining have emerged as pressing issues across many parts of the world, particularly in developing regions where agriculture remains the dominant livelihood source [9,10,11,12,13]. The consequences of these processes are profound, with reduced soil fertility being one of the most significant impacts, ultimately constraining agricultural productivity and hindering socio-economic progress on a global scale [14]. In this context, soil quality assessment has gained increasing attention over the past few decades as a framework to evaluate the performance of soils under different land-use systems [15]. The Soil Quality Index (SQI) is generally defined as the capacity of soil to function within the boundaries of both natural and managed ecosystems, maintaining crop productivity while safeguarding against degradation and ensuring long-term sustainability [16,17].
In many parts of the world, soil quality has been deteriorating rapidly due to factors such as land use change and intensification of agricultural practices [18]. Evaluating the soil health is, therefore, vital for tracking soil health and ensuring the long-term sustainability of farming systems [19]. Some studies used the SQI as a comprehensive tool to monitor soil health, that generally relies on a minimum dataset composed of carefully chosen soil indicators that reflect physical, chemical, and biological attributes [20]. Soil texture is regarded as a relatively stable property that strongly influences variations in crop yield [21], while pH, soil depth, soil water content, and nitrate availability are dynamic characteristics that must be monitored regularly to capture management-induced changes [22]. These dynamic indicators help explain how agricultural practices, such as fertilizer application or irrigation, influence plant productivity. Shifts in land use can also degrade soil quality by reducing organic carbon and total nitrogen levels. Moreover, the presence of heavy metals in soils poses additional challenges, as it threatens human and ecosystem health, diminishes land suitability for cultivation, and contributes to food insecurity and tenure-related issues [23]. The accumulation of potentially toxic elements further hampers plant growth, yield, and quality through phytotoxic effects [24]. Constructing an SQI requires selecting appropriate indicators, assigning scores, and integrating them into a composite index that represents overall soil functioning [25].
The Mahanadi basin, situated in eastern India, is among the country’s most important river systems, encompassing diverse landscapes such as forests, croplands, and urban settlements. It sustains millions of people by providing resources for agriculture, industry, and water supply. In recent years, land-use change within the basin has exhibited a dual character: forest clearance near expanding urban-agricultural zones contrasts with signs of forest regeneration in other regions [26,27]. These alterations have disrupted hydrological processes, accelerated soil erosion, and contributed to widespread land degradation, with direct consequences for soil quality [27,28]. Earlier research has emphasized the necessity of integrated studies on both LULC dynamics and soil health to assess their long-term impacts on basin ecosystems. The lower reaches of the Mahanadi basin, in particular, have witnessed substantial conversion of natural and forested areas into agricultural and urban land uses, raising concerns regarding sustainable land management and soil conservation [29]. Considering the basin’s ecological and socio-economic importance, it is vital to evaluate how such LULC changes are influencing soil quality and to formulate strategies to minimize adverse effects. The application of geospatial techniques and remote sensing datasets offers valuable opportunities to capture these dynamics, thereby supporting informed policy-making and effective resource management. Soil degradation across the basin constitutes a gradually evolving geohazard with extensive environmental and socio-economic repercussions. The combined effects of soil compaction, nutrient exhaustion, and the decline of organic matter diminish water infiltration capacity, intensify surface runoff, and heighten vulnerability to flooding and erosion. Over time, these interlinked processes undermine soil fertility, agricultural productivity, and ecological resilience, highlighting the geohazard nature of land and soil degradation in the lower Mahanadi basin.
Understanding the interactions between land use dynamics and soil quality is essential for promoting sustainable agriculture and effective environmental management, particularly in fast-changing river basins such as the lower Mahanadi. The present study focuses on detecting LULC changes in the lower Mahanadi basin between 2011 and 2020 and evaluating soil quality through the Simple Additive SQI. Using satellite imagery combined with geospatial modelling techniques, this study provides an integrated perspective on the influence of LULC transitions on soil health, offering valuable insights for sustainable farming practices and improved soil conservation strategies in the region.

Study Area

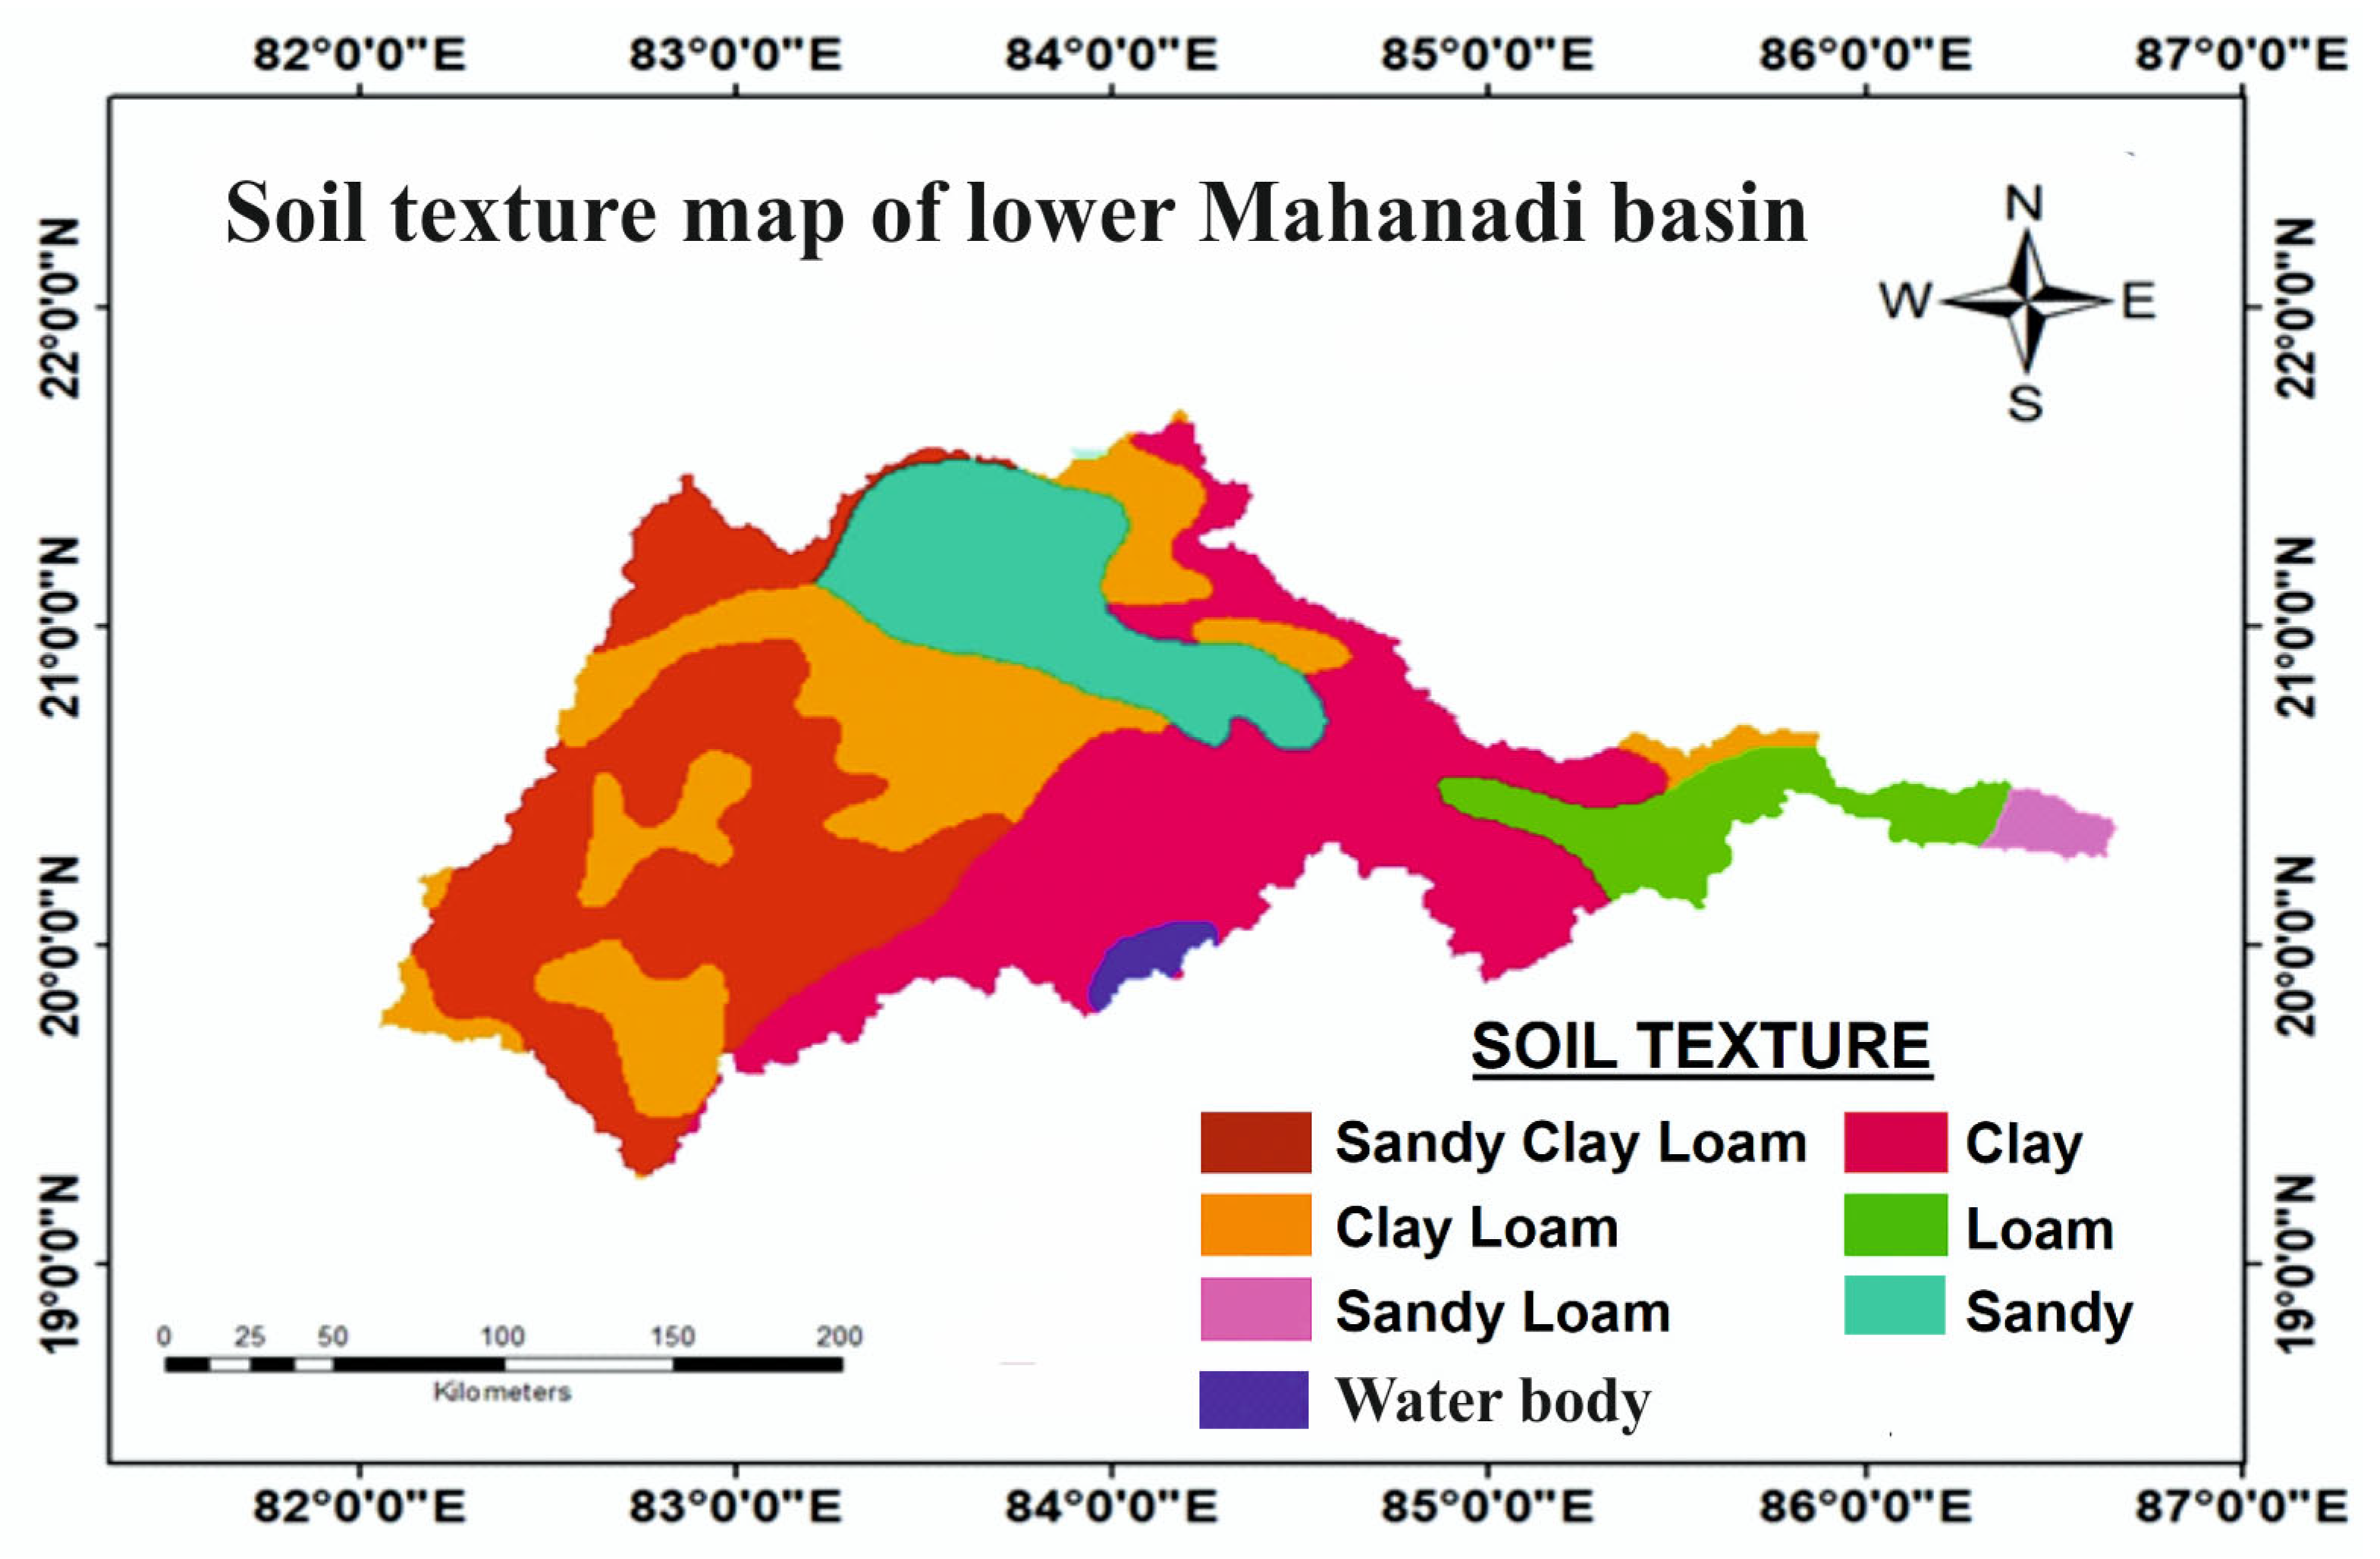
The Mahanadi basin lies across the states of Chhattisgarh and Odisha, with smaller sections extending into Jharkhand, Maharashtra, and Madhya Pradesh, covering an area of about 141,589 km2, which accounts for nearly 4.3% of India’s total geographical area (Figure 1). The basin stretches to a maximum length of 587 km and a width of 400 km [28]. Geographically, it is bounded by the Central India Hills to the north, the Eastern Ghats on the south and east. Our study area is lower Mahanadi basin, which comprises a geographical area of 57,169 km2, which forms a vital region in eastern India, located between 19.0° N–20.5° N latitude and 82.0° E–86.0° E longitude, encompassing the downstream reaches of the Mahanadi River, which originates in Chhattisgarh and flows eastward into the Bay of Bengal [29]. This portion of the basin extends across Odisha and Chhattisgarh and is characterized by heterogeneous landscapes such as fertile alluvial plains, deltaic tracts, and coastal belts. The dominant soil textures include Sandy Clay Loam and Clay Loam, supporting a variety of land uses. Climatically, the basin receives an average annual rainfall ranging between 1200 and 1600 mm, with mean annual temperatures fluctuating between 24 °C and 32 °C [30,31]. Ecologically, the lower basin is home to wetlands, forests, and coastal ecosystems that support high biodiversity and play a crucial role in sustaining ecological balance. Thus, the lower Mahanadi basin holds immense significance, not only as a driver of socio-economic development but also as a key region for environmental sustainability.

2. Materials and Methods

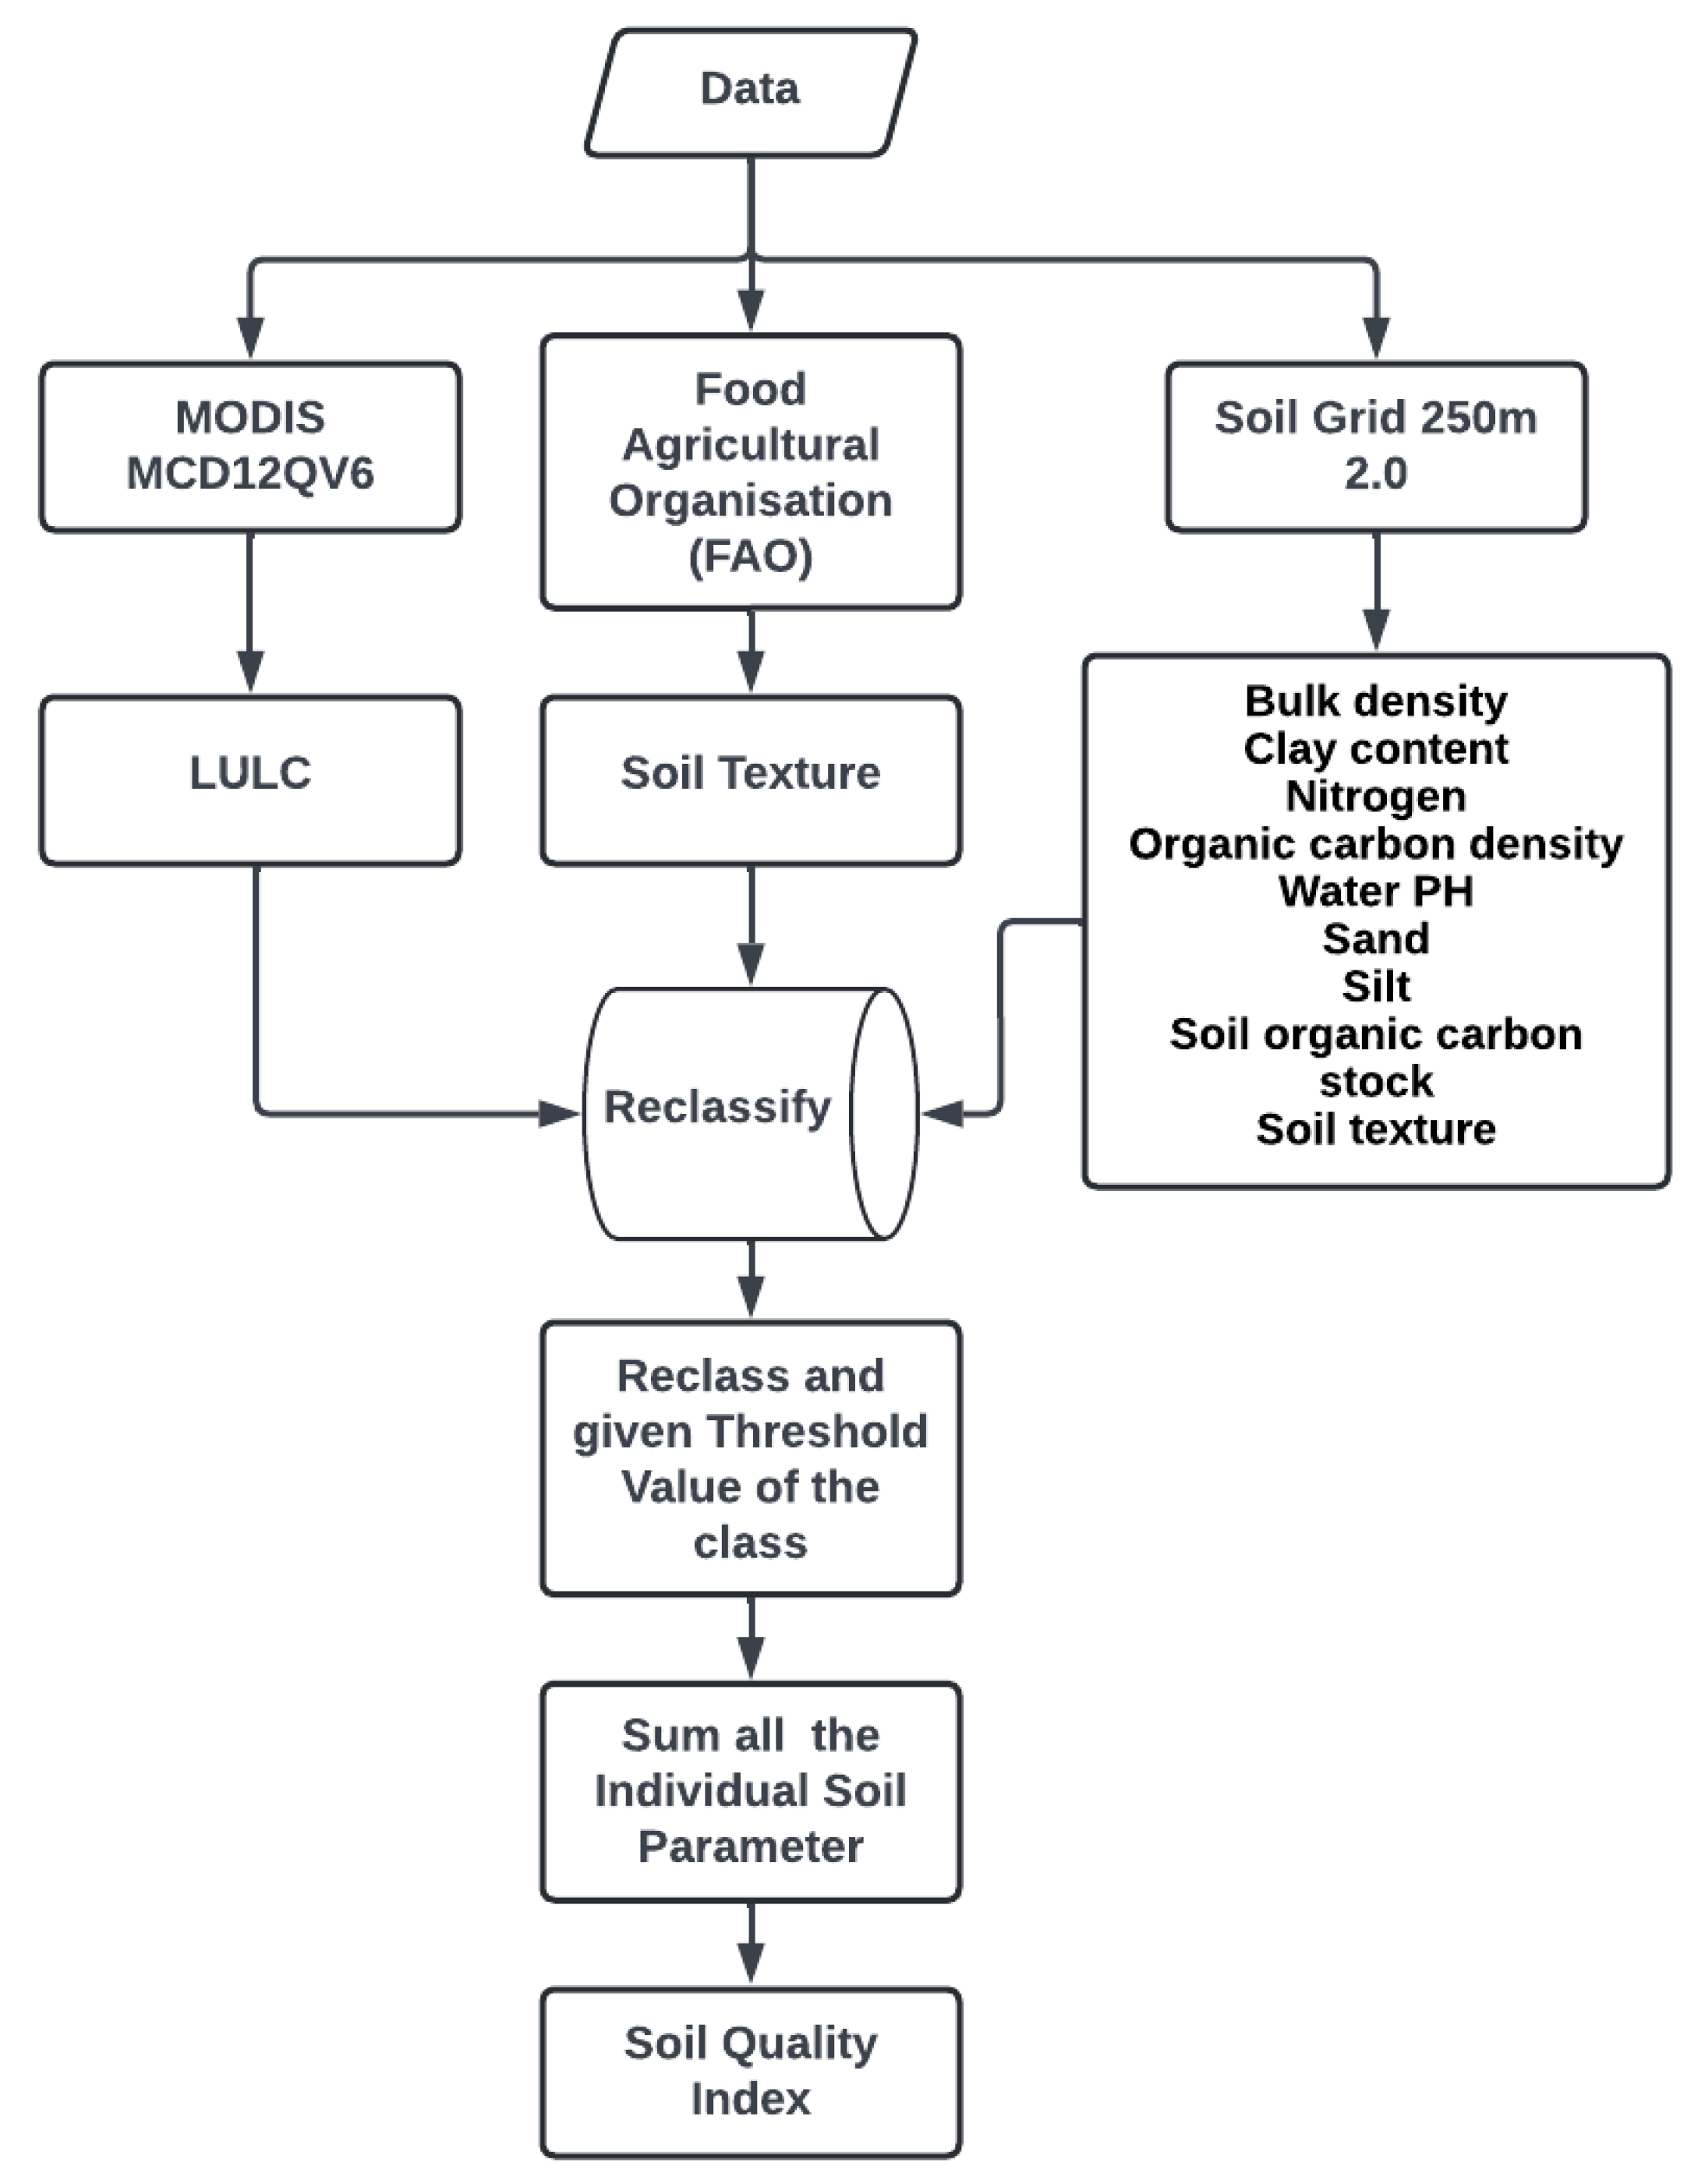
For this study, land use and land cover (LULC) maps of the lower Mahanadi basin for the years 2011, and 2020 were generated using MODIS (Moderate Resolution Imaging Spectroradiometer) satellite data, specifically the MCD12Q1, as detailed in Table 1 [32]. The MCD12Q1 dataset compiles information from multiple MODIS acquisitions over an eight-day cycle and provides a spatial resolution of 500 m per pixel. It categorizes the Earth’s surface into distinct classes, including forest, shrubland, grassland, cropland, water bodies, and urban areas, with each pixel being assigned its dominant land cover. This dataset has been extensively applied in land cover change detection, urban and agricultural planning, climate modelling, and ecological research, and is available through NASA’s Earth Observing System Data and Information System (EOSDIS). A schematic representation of the overall methodology employed in this study is shown in Figure 2.

Soil Quality Assessment

To evaluate soil quality in the lower Mahanadi basin, multiple parameters were considered using data from SoilGrid250m 2.0 [33] and the FAO [34]. soil texture database. The selected indicators included bulk density (g/cm3), clay content (g/kg), nitrogen (g/kg), organic carbon density (g/kg), water pH, sand (g/kg), silt (g/kg), and soil organic carbon (SOC) stock (t/ha), all mapped at a spatial resolution of 250 m. These indicators were chosen because they represent the essential physical (bulk density), chemical (organic carbon), and biological (nitrogen) components influencing soil functionality and fertility. A Simple Additive SQI was formulated by assigning threshold values to each parameter, based on expert knowledge and published literature [35]. These thresholds were used to generate individual parameter scores, which were subsequently aggregated to obtain a composite SQI for each location. The resulting index was normalized to ensure comparability across the basin, thereby providing an integrated representation of soil health. The SQI method was adopted for its transparency and proven applicability in large-area assessments where detailed sampling is logistically limited.
Table 1. Data utilized for soil quality mapping of the lower Mahanadi basin.
DataSpatial ResolutionYearPurposeSource
MCD12Q1 V6500 m2011, 2020LULC mapLPDAAC [32]
Soil texture250 m2011Soil healthFAO [34]
Soil quality parameters (PH, Bulk density, SOC, Nitrogen)250 m2020Soil healthSoilGrid250m 2.0 [33]
The soil quality indicators were classified into three levels—0 (poor), 1 (moderate), and 2 (good)—depending on their contribution to overall soil quality. Table 2 outlines the selected indicators, their value ranges, and the assigned scores, organized by soil depth, land use categories, and soil textures. The cumulative index values were summed to derive the total SQI (Equation (1)) and later standardized to a 0–1 scale following established procedures [36] (Equation (2)).
S Q I =   I n d i v i t u a l   s o i l   p a r a m e t e r   i n d e x   v a l u e s  
S Q I =   ( S Q I S Q I M i n ) ( S Q I M a x S Q I M i n )
where S Q I M i n is   the   minimum   values   of   S Q I   and   S Q I M a x   is   the   maximum   value   of   S Q I .

3. Results

3.1. Parameters Used in Soil Quality Assessment

The soil quality of the lower Mahanadi basin was evaluated using the Simple Additive SQI, focusing on ten key parameters that are critical to soil health and agricultural productivity.

3.1.1. Land Use Land Cover (LULC) Map

LULC data is essential for understanding the soil quality of the basin. In the lower Mahanadi basin, LULC analysis was conducted for the years 2011 and 2020 to assess changes in land use patterns over time. Table 3 presents the areas of different land cover classes in km2 for each year. In 2011 (Figure 3a), cropland was the dominant land cover, occupying 39,493.2 km2 (68.91%), followed by forest with 12,401.2 km2 (21.64%) and grassland with 4826.3 km2 (8.42%). Minor land classes included built-up area (131.2 km2, 0.23%), wasteland (133.3 km2, 0.23%), and water bodies (184.3 km2, 0.32%). By 2020 (Figure 3b), cropland further declined to 37,495.9 km2 (65.46%), while forest cover expanded to 13,822.2 km2 (24.11%). Grassland showed a slight recovery, increasing to 5432.1 km2 (9.48%). Built-up areas grew marginally to 134.4 km2 (0.23%), wasteland reduced significantly to 93.2 km2 (0.16%), and water bodies increased to 191.4 km2 (0.33%).

3.1.2. Soil Texture

The soil texture map of the lower Mahanadi basin illustrates the spatial distribution of different soil textures across the region. These textures influence the soil’s capacity to retain water and nutrients, which are vital for crop growth. The distribution of these textures is illustrated in Figure 4. The map highlights the dominance of Sandy Clay Loam in the central and southern parts of the basin, while Clay Loam is prominently found in the western and northwestern regions. The northeastern part of the basin is characterized by Loam and Sandy Loam, indicating a variation in soil properties across the landscape. To ensure reliability, the soil texture map of this basin was prepared using the FAO soil data (250 m resolution) [34] and cross-validated with SoilGrid250m [33]) datasets.

3.1.3. Clay Content

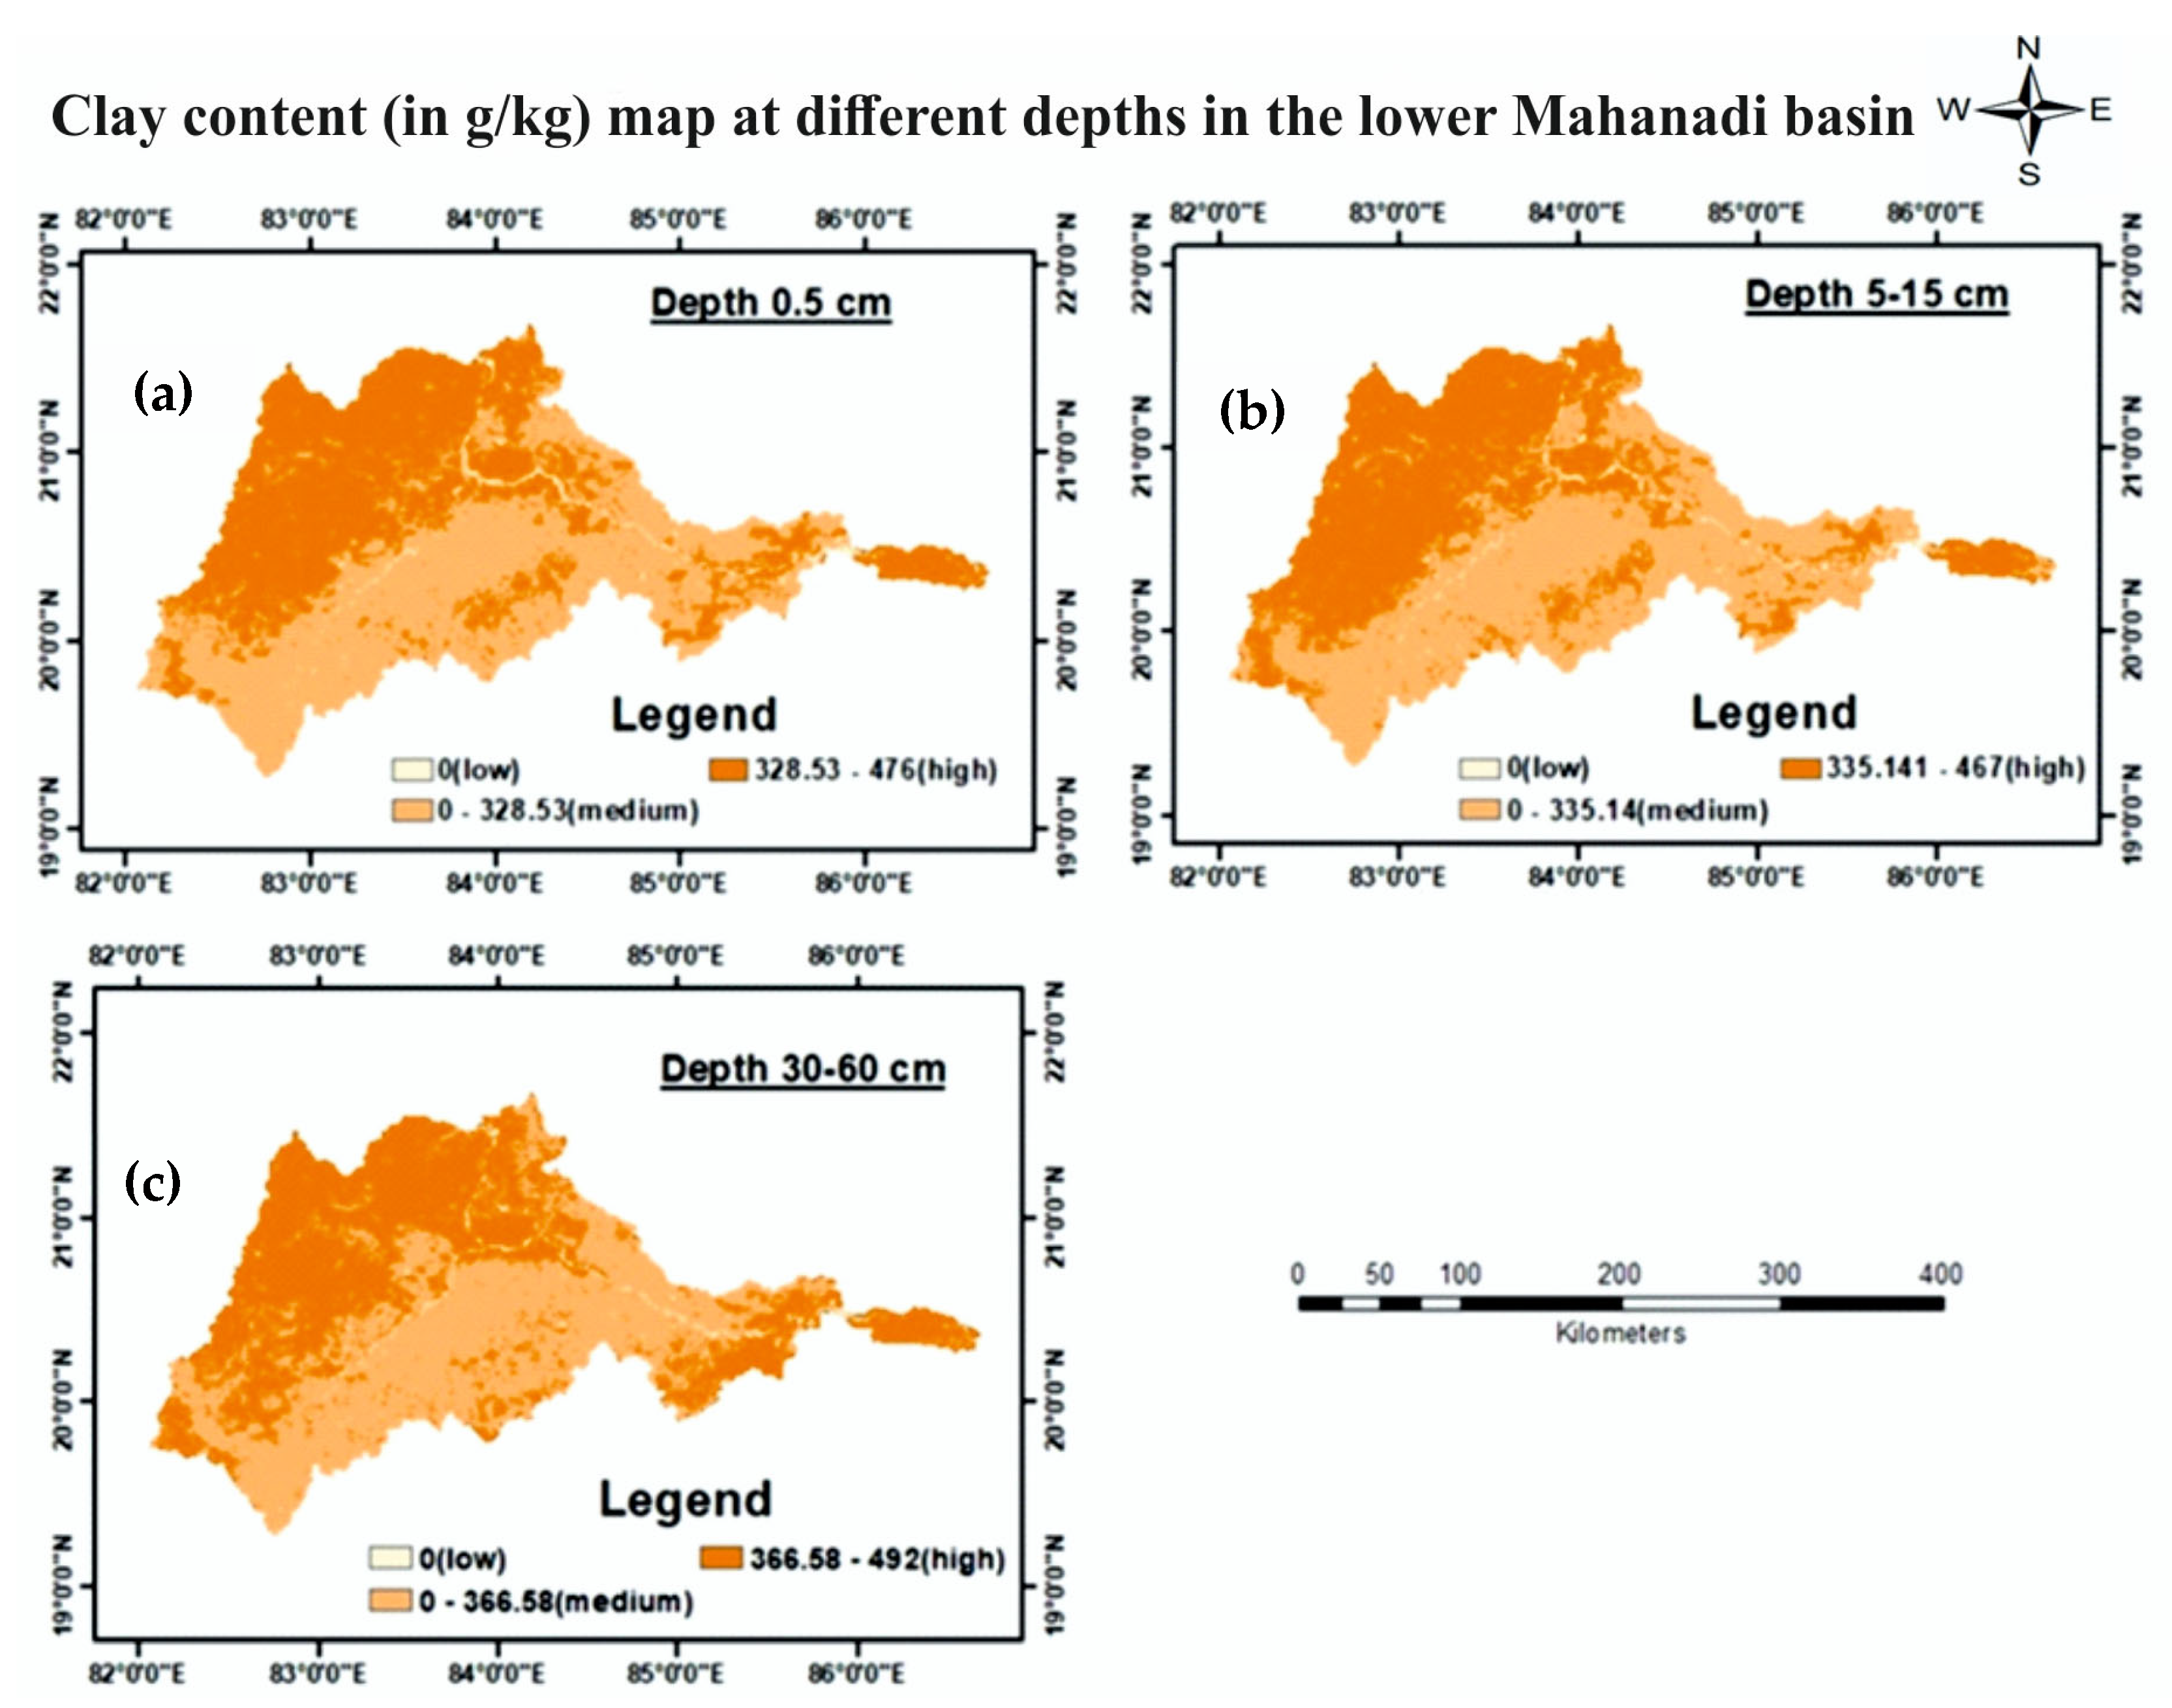
Clay content is a significant factor in determining soil properties such as water retention and nutrient holding capacity. The clay content maps of the lower Mahanadi basin, depicted at various soil depths (0.5 cm, 5–15 cm, and 30–60 cm), illustrate the distribution of clay particles across the region (Figure 5a–c). At the surface depth of 0.5 cm, the basin predominantly exhibits medium clay content (0–328.5 g/kg), with high clay concentrations (328.5–476 g/kg) appearing in scattered patches, particularly in the central and eastern parts of the basin. As the depth increases to 5–15 cm, there is a noticeable increase in areas with high clay content, particularly in the central region, while the medium clay zones expand towards the basin’s periphery. By 30–60 cm depth, high clay content areas (366.6–492 g/kg) further intensify, covering a substantial portion of the basin, particularly in the central and southern regions.

3.1.4. Sand Content

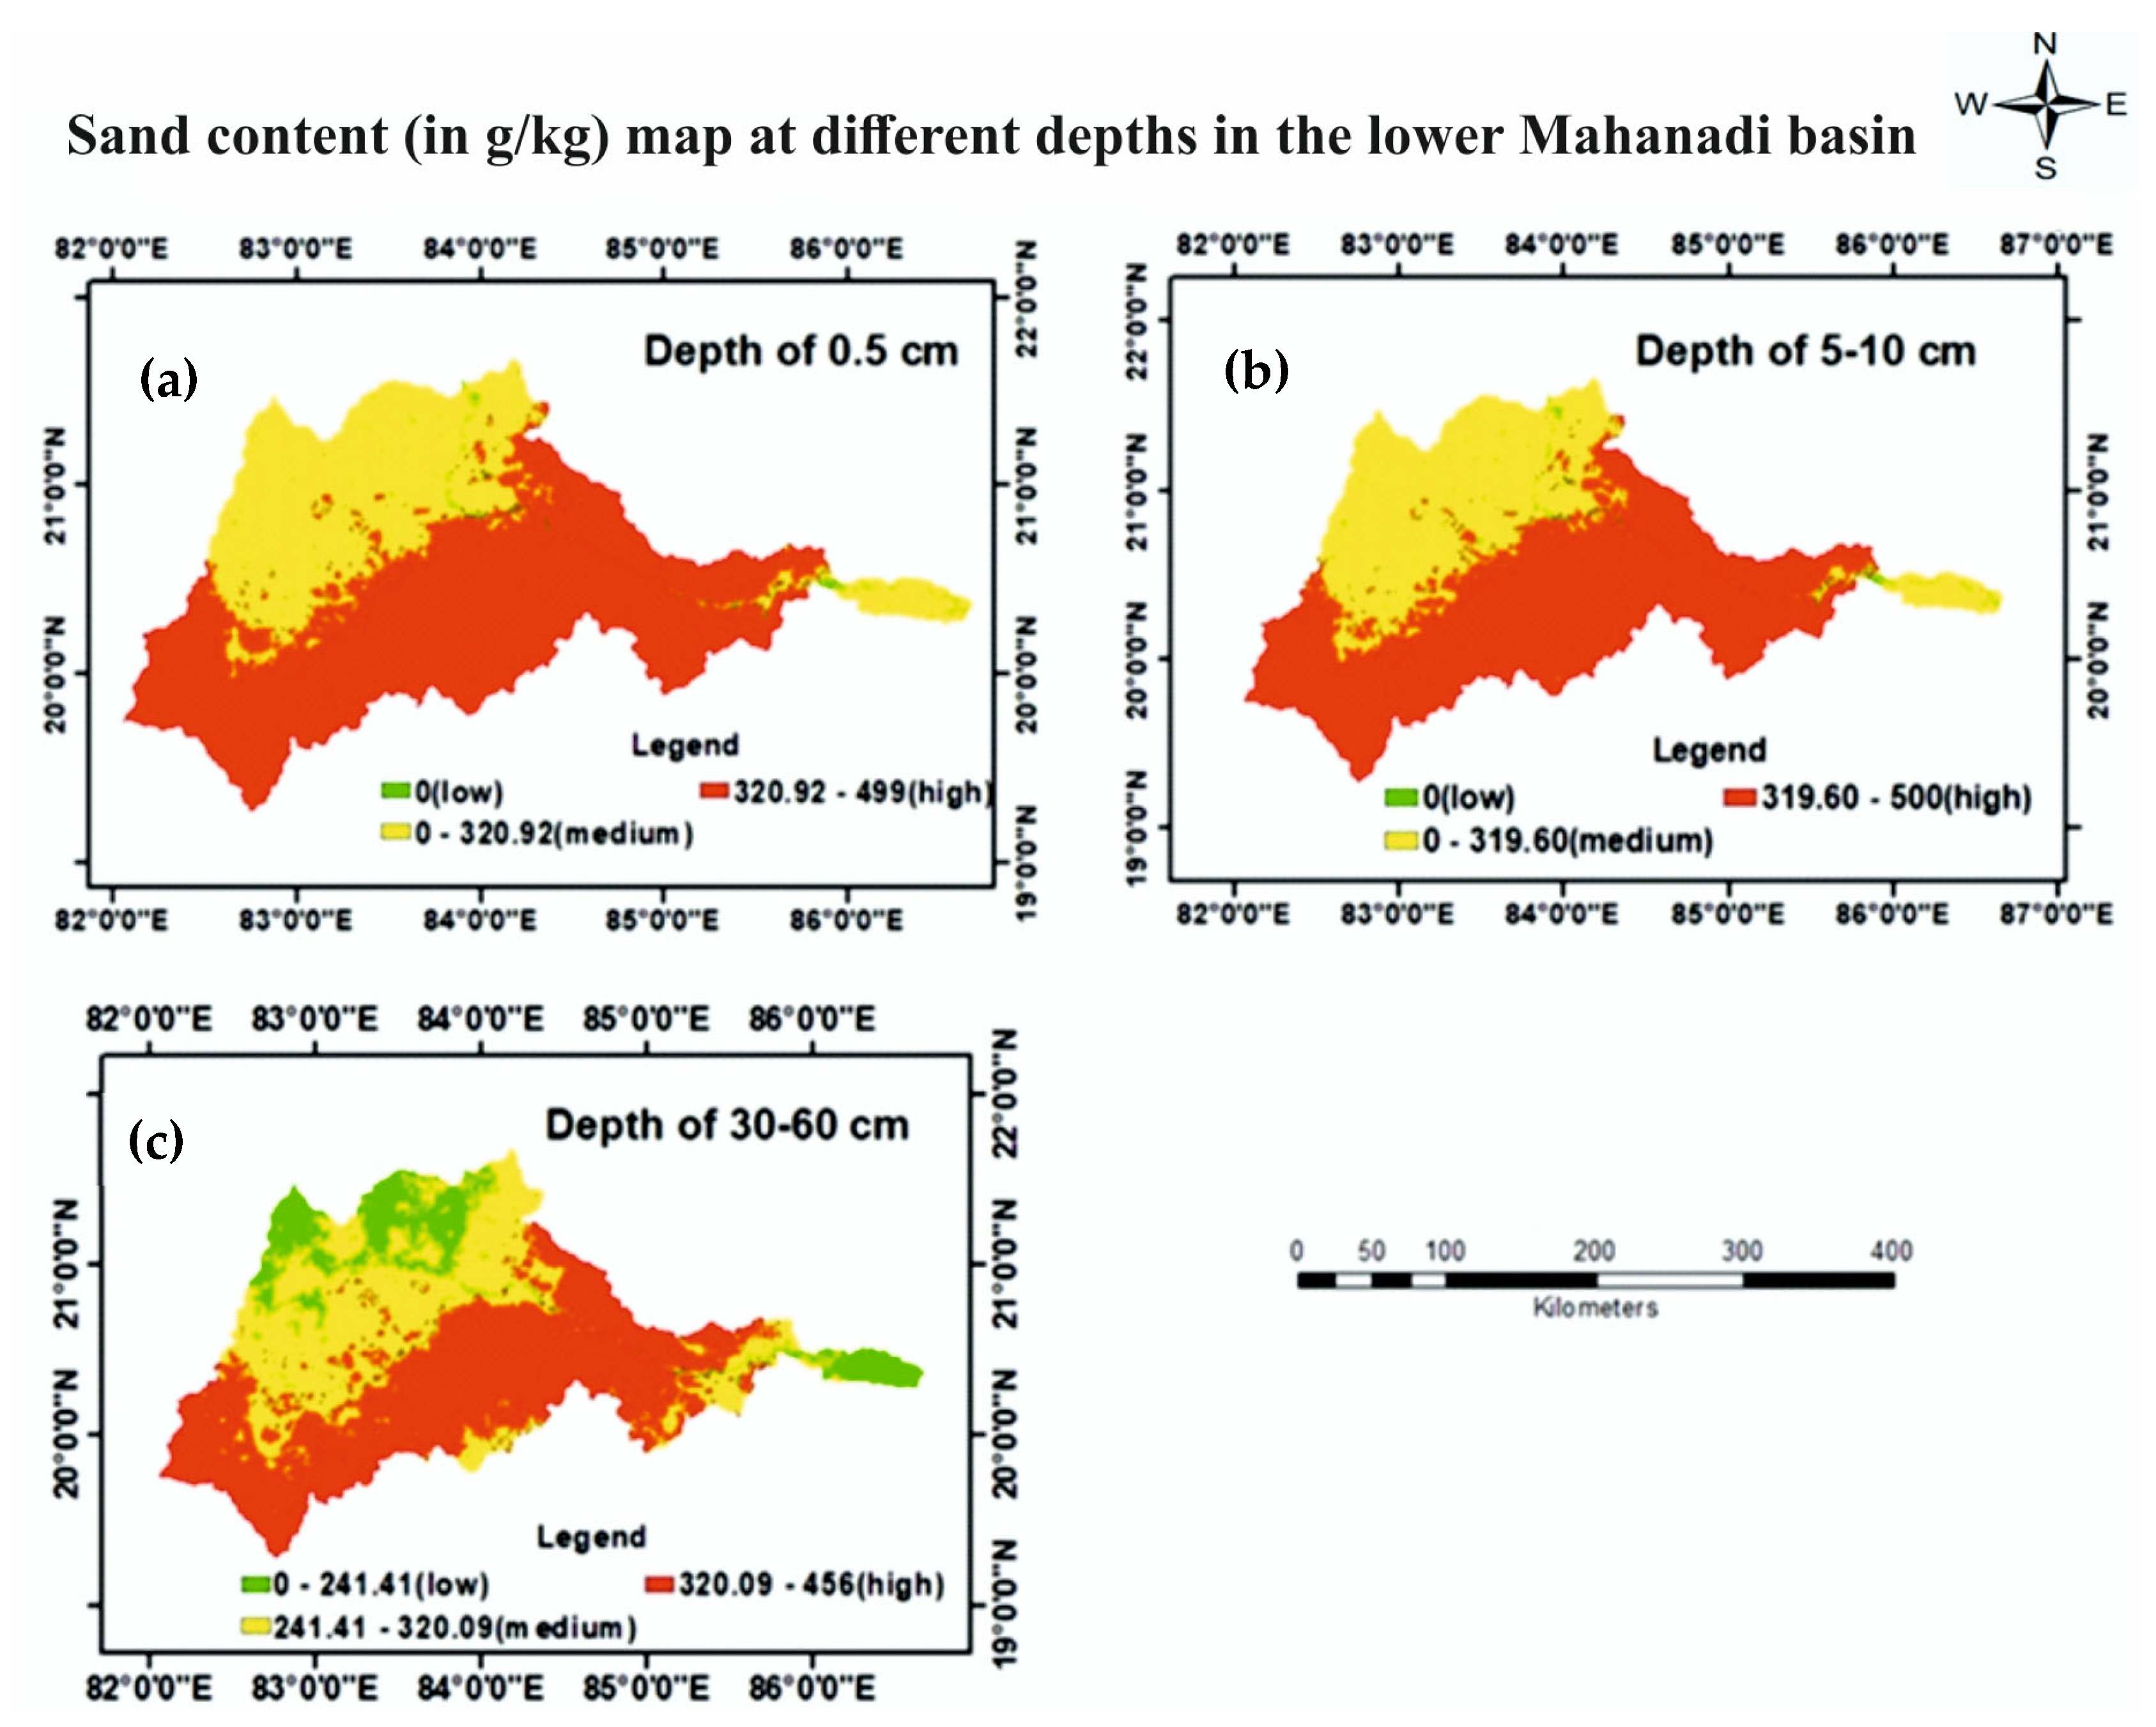
The sand content of the soil influences its drainage and texture. High sand content can lead to well-drained soils but may also reduce nutrient retention. The sand content maps of the Lower Mahanadi basin at different depths (0.5 cm, 5–10 cm, and 30–60 cm) illustrate the spatial distribution of sand across the region (Figure 6a–c). At the shallow depth of 0.5 cm, a large portion of the southern and southeastern regions exhibits high sand content (320.9–499 g/kg), while medium sand content (166.3–320.9 g/kg) is observed in the northern and western areas. As the depth increases to 5–10 cm, the pattern remains similar, with high sand content continuing to dominate the southern and eastern regions, while medium and low sand content areas are more prominent in the northern part of the basin. At the deepest level of 30–60 cm, high sand content is still prevalent in the southern regions, while medium sand content covers a significant portion of the central and northern areas.

3.1.5. Silt Content

Silt content affects the soil’s ability to hold water and nutrients. The silt content maps of the lower Mahanadi basin at different depths (0.5 cm, 5–10 cm, and 30–60 cm) reveal the distribution of silt across the region’s soils (Figure 7a–c). At the 0.5 cm depth, a significant portion of the basin, particularly in the western and central areas, exhibits high silt content (338.3–493 g/kg), with medium silt content (166–338.3 g/kg) observed in the northern and eastern regions. As the depth increases to 5–10 cm, the pattern remains consistent, with high silt content dominating most of the basin, especially in the central and southern parts. At the deepest level of 30–60 cm, high silt content is still prominent in the central and western regions, with medium content areas visible in the northern and eastern parts. These maps are crucial for understanding soil texture, which affects soil fertility, water retention, and overall agricultural productivity in the basin.

3.1.6. Organic Carbon Density and Soil Organic Carbon Stock

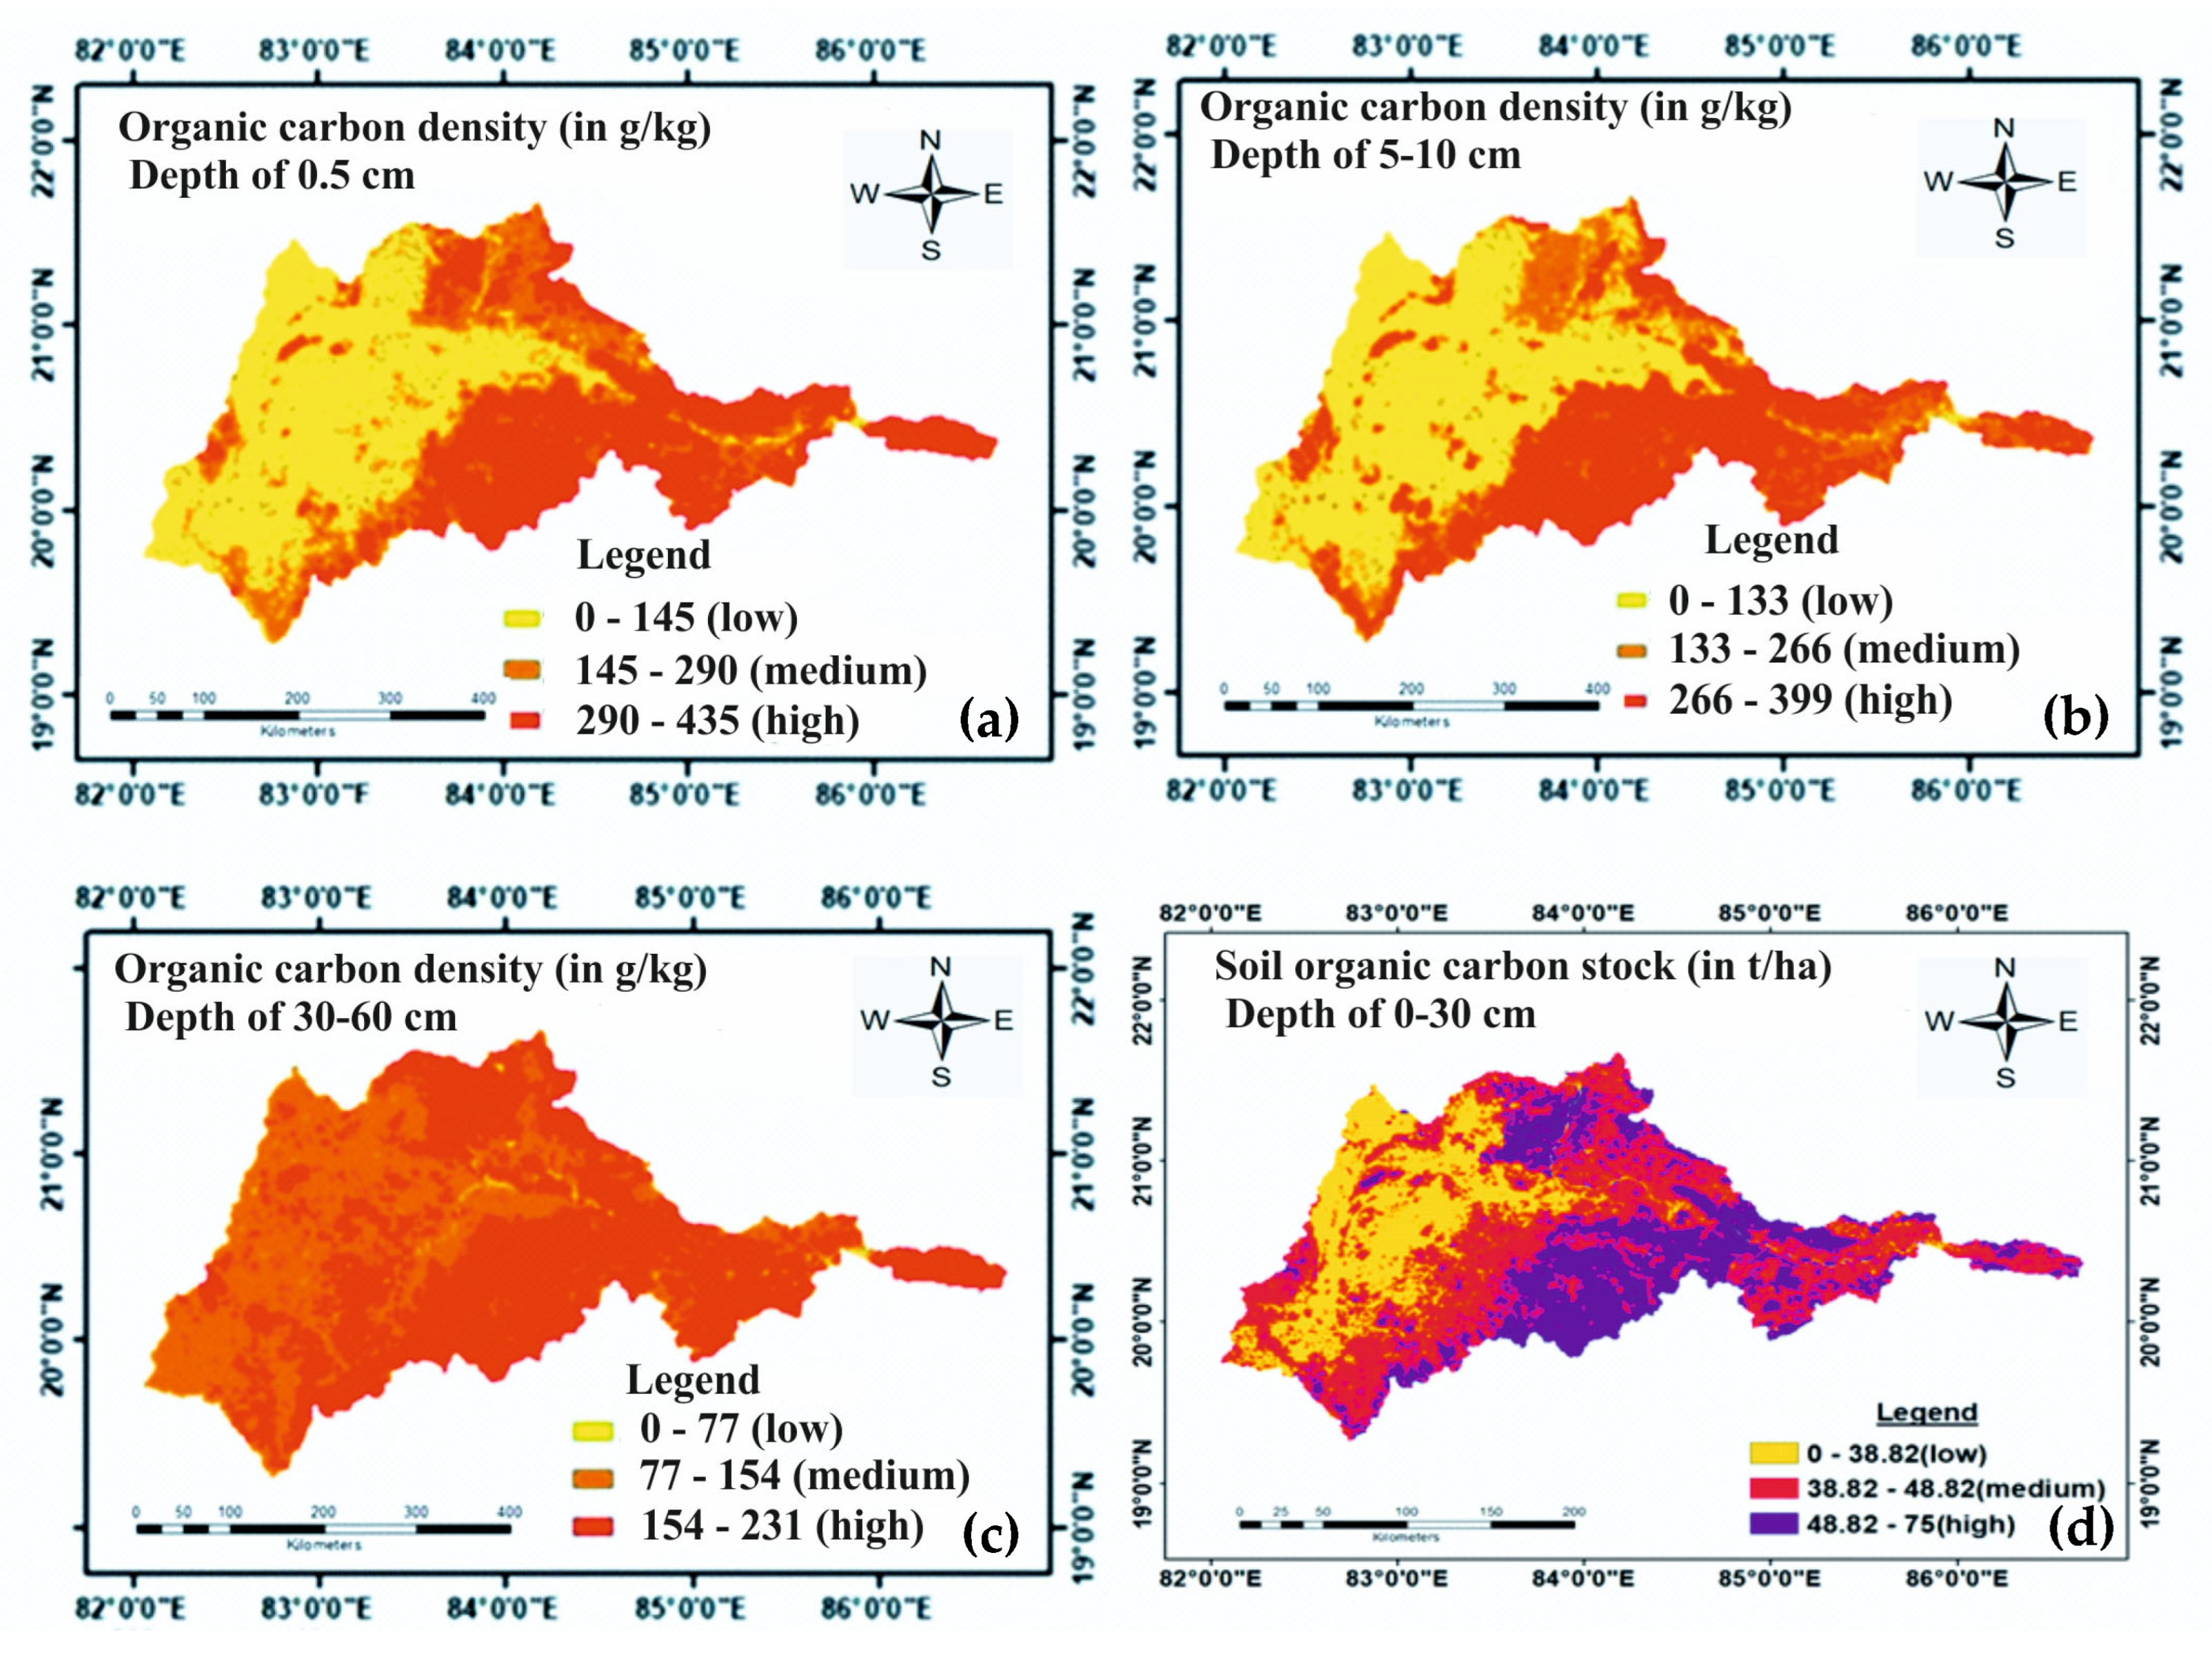
Organic matter content, particularly soil organic carbon (SOC), is essential for maintaining soil fertility. It improves soil structure, enhances water retention, and supports microbial activity. The organic carbon density maps of the lower Mahanadi basin illustrate the distribution of soil organic carbon across four different soil depths: 0.5 cm, 5–10 cm, and 30–60 cm (Figure 8a–c). At the shallowest depth (0.5 cm), there is a noticeable variation, with areas of high organic carbon density (290–435 g/kg) concentrated in the eastern and northeastern regions, while low-density areas (0–145 g/kg) dominate the western and central parts. As the depth increases to 5–10 cm, the maps show a shift, with medium and high organic carbon densities becoming more prominent in the eastern and central regions. At the deepest level (30–60 cm), high organic carbon density is observed predominantly in the eastern and southeastern regions, while low-density areas become less extensive.
Soil organic carbon stock is a key indicator of the soil’s ability to sequester carbon and maintain fertility. The soil organic carbon stock map of the lower Mahanadi basin at a depth of 0–30 cm provides a detailed representation of the region’s carbon storage capacity (Figure 8d). The map highlights three distinct zones based on organic carbon content: low (0–38.8 t/ha), medium (38.8–48.8 t/ha), and high (48.8–75 t/ha). The central and southern parts of the basin predominantly show medium to high organic carbon stock, indicating a healthier soil profile with greater potential for supporting vegetation and maintaining soil fertility. In contrast, the northern and northwestern regions display low organic carbon stock, which may require targeted soil management practices to improve soil health.

3.1.7. Nitrogen Content

Nitrogen is a crucial nutrient for plant growth, and its availability in the soil directly impacts crop productivity. The Nitrogen content maps of the lower Mahanadi basin, represented at various depths (0.5 cm, 5–10 cm, and 30–60 cm), display the spatial distribution of nitrogen across the basin (Figure 9a–c). At a shallow depth of 0.5 cm, the majority of the basin shows low nitrogen levels (0–1.91 g/kg), particularly in the western and southern regions. However, medium to high nitrogen concentrations (1.91–5.72 g/kg) are evident in the central and northeastern parts of the basin. As the depth increases to 5–10 cm, there is a notable increase in areas with medium nitrogen content (2.01–4.02 g/kg), especially in the central region, with high nitrogen pockets (4.02–6.03 g/kg) becoming more pronounced in the eastern parts. At the deepest level, 30–60 cm, medium to high nitrogen levels (3.53–5.29 g/kg) dominate the central and northeastern regions, indicating a stronger nitrogen presence at greater soil depths.

3.1.8. Bulk Density

Bulk density is a measure of soil compaction, which affects root penetration and water infiltration. High bulk density can indicate compacted soils that may restrict plant growth. The Bulk Density maps of the lower Mahanadi basin, displayed across four different soil depths (0.5 cm, 5–10 cm, and 30–60 cm), reveal significant spatial variation in soil compaction (Figure 10a–c). At the shallow depth of 0.5 cm, high bulk density values (1.11–1.66 g/cm3) are prevalent in the western and central regions, indicating more compacted soils, while medium-density areas (0.55–1.11 g/cm3) are concentrated in the eastern part of the basin. As depth increases to 5–10 cm, the trend of high bulk density extends, particularly in the western and central regions, suggesting consistent soil compaction through these layers. At the deepest level (30–60 cm), the high-density areas (1.19–1.79 g/cm3) continue to dominate the western region, with some expansion towards the central part of the basin. These bulk density patterns are crucial for understanding soil health, as higher bulk density can restrict root growth and reduce water infiltration, affecting agricultural productivity in the basin.

3.1.9. Water pH

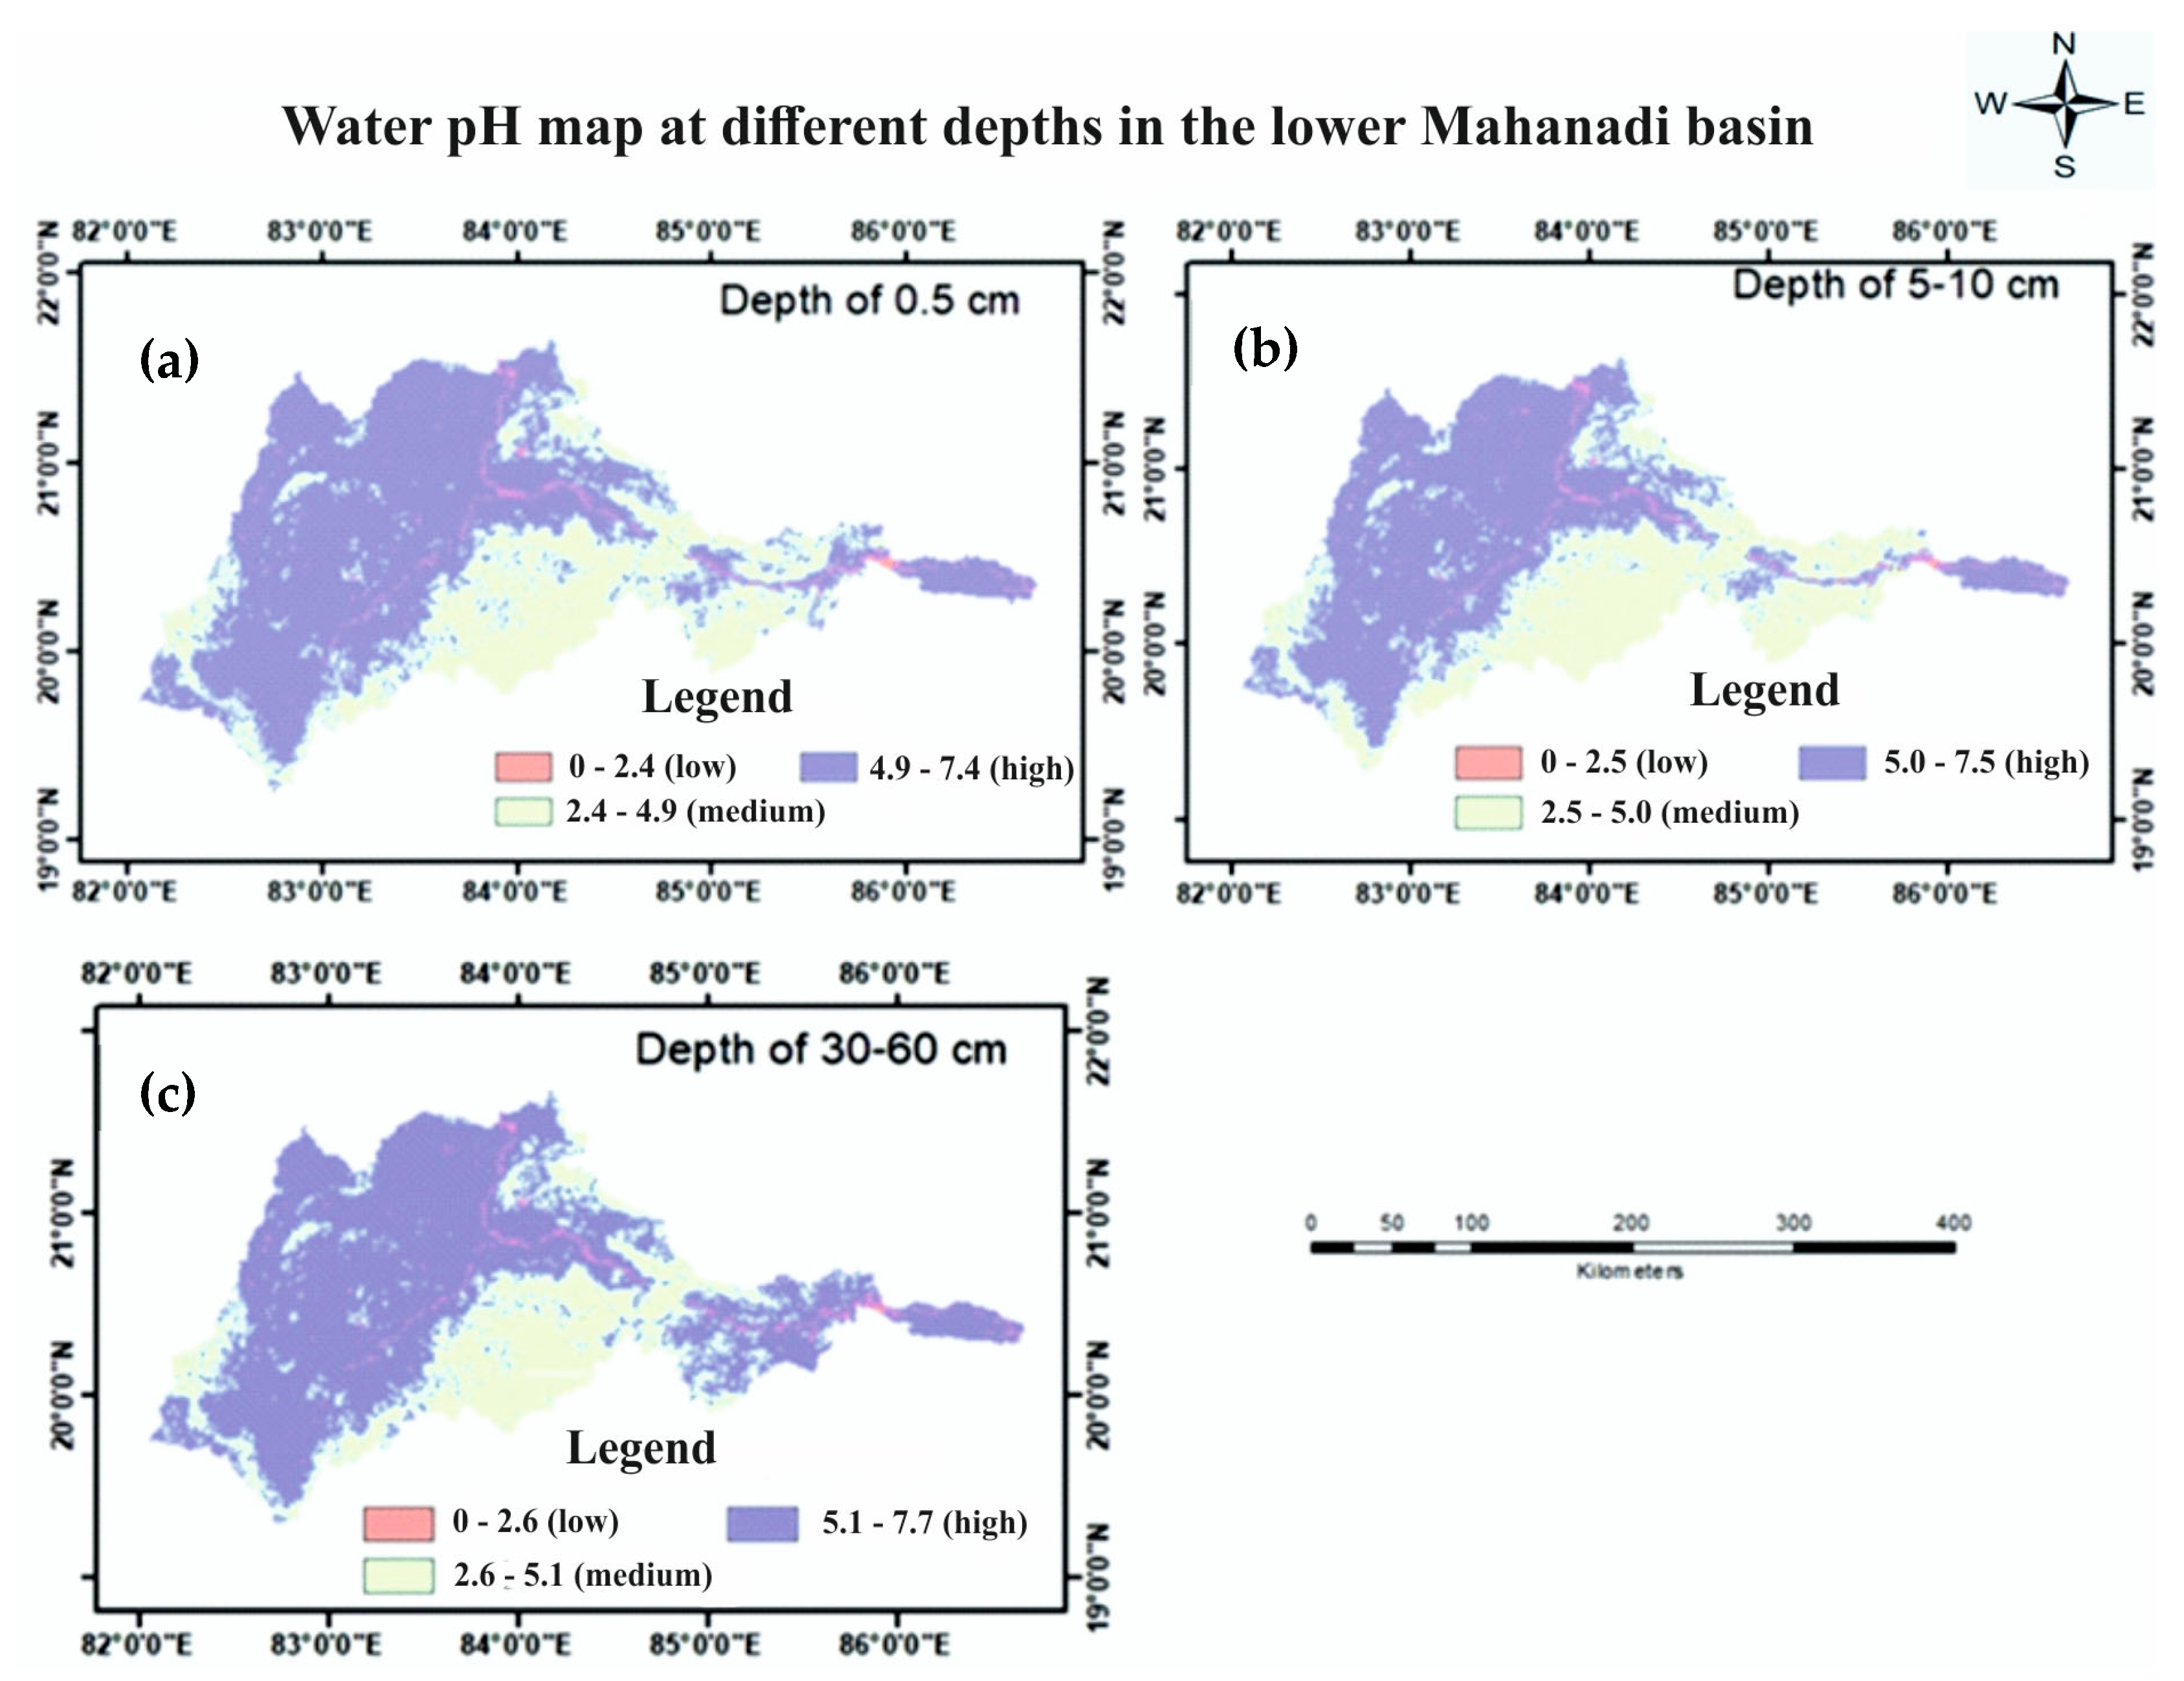
Soil pH is a critical parameter that affects nutrient availability and microbial activity. The Water pH maps of the lower Mahanadi basin at different soil depths (0.5 cm, 5–10 cm, and 30–60 cm) illustrate the spatial distribution of soil acidity and alkalinity across the region (Figure 11a–c). At a shallow depth of 0.5 cm, a significant portion of the basin, especially in the central and northern regions, exhibits a high pH range (6.2–7.4), indicating neutral to slightly alkaline conditions, while medium pH levels (4.9–6.2) are observed in the southern and eastern areas. As the depth increases to 5–10 cm, the pattern remains similar, with high pH areas expanding slightly towards the western part of the basin. At the deepest level of 30–60 cm, high pH values are most widespread, covering nearly the entire basin, particularly in the central and northern regions.

3.2. Soil Quality Map as Derived from SQI

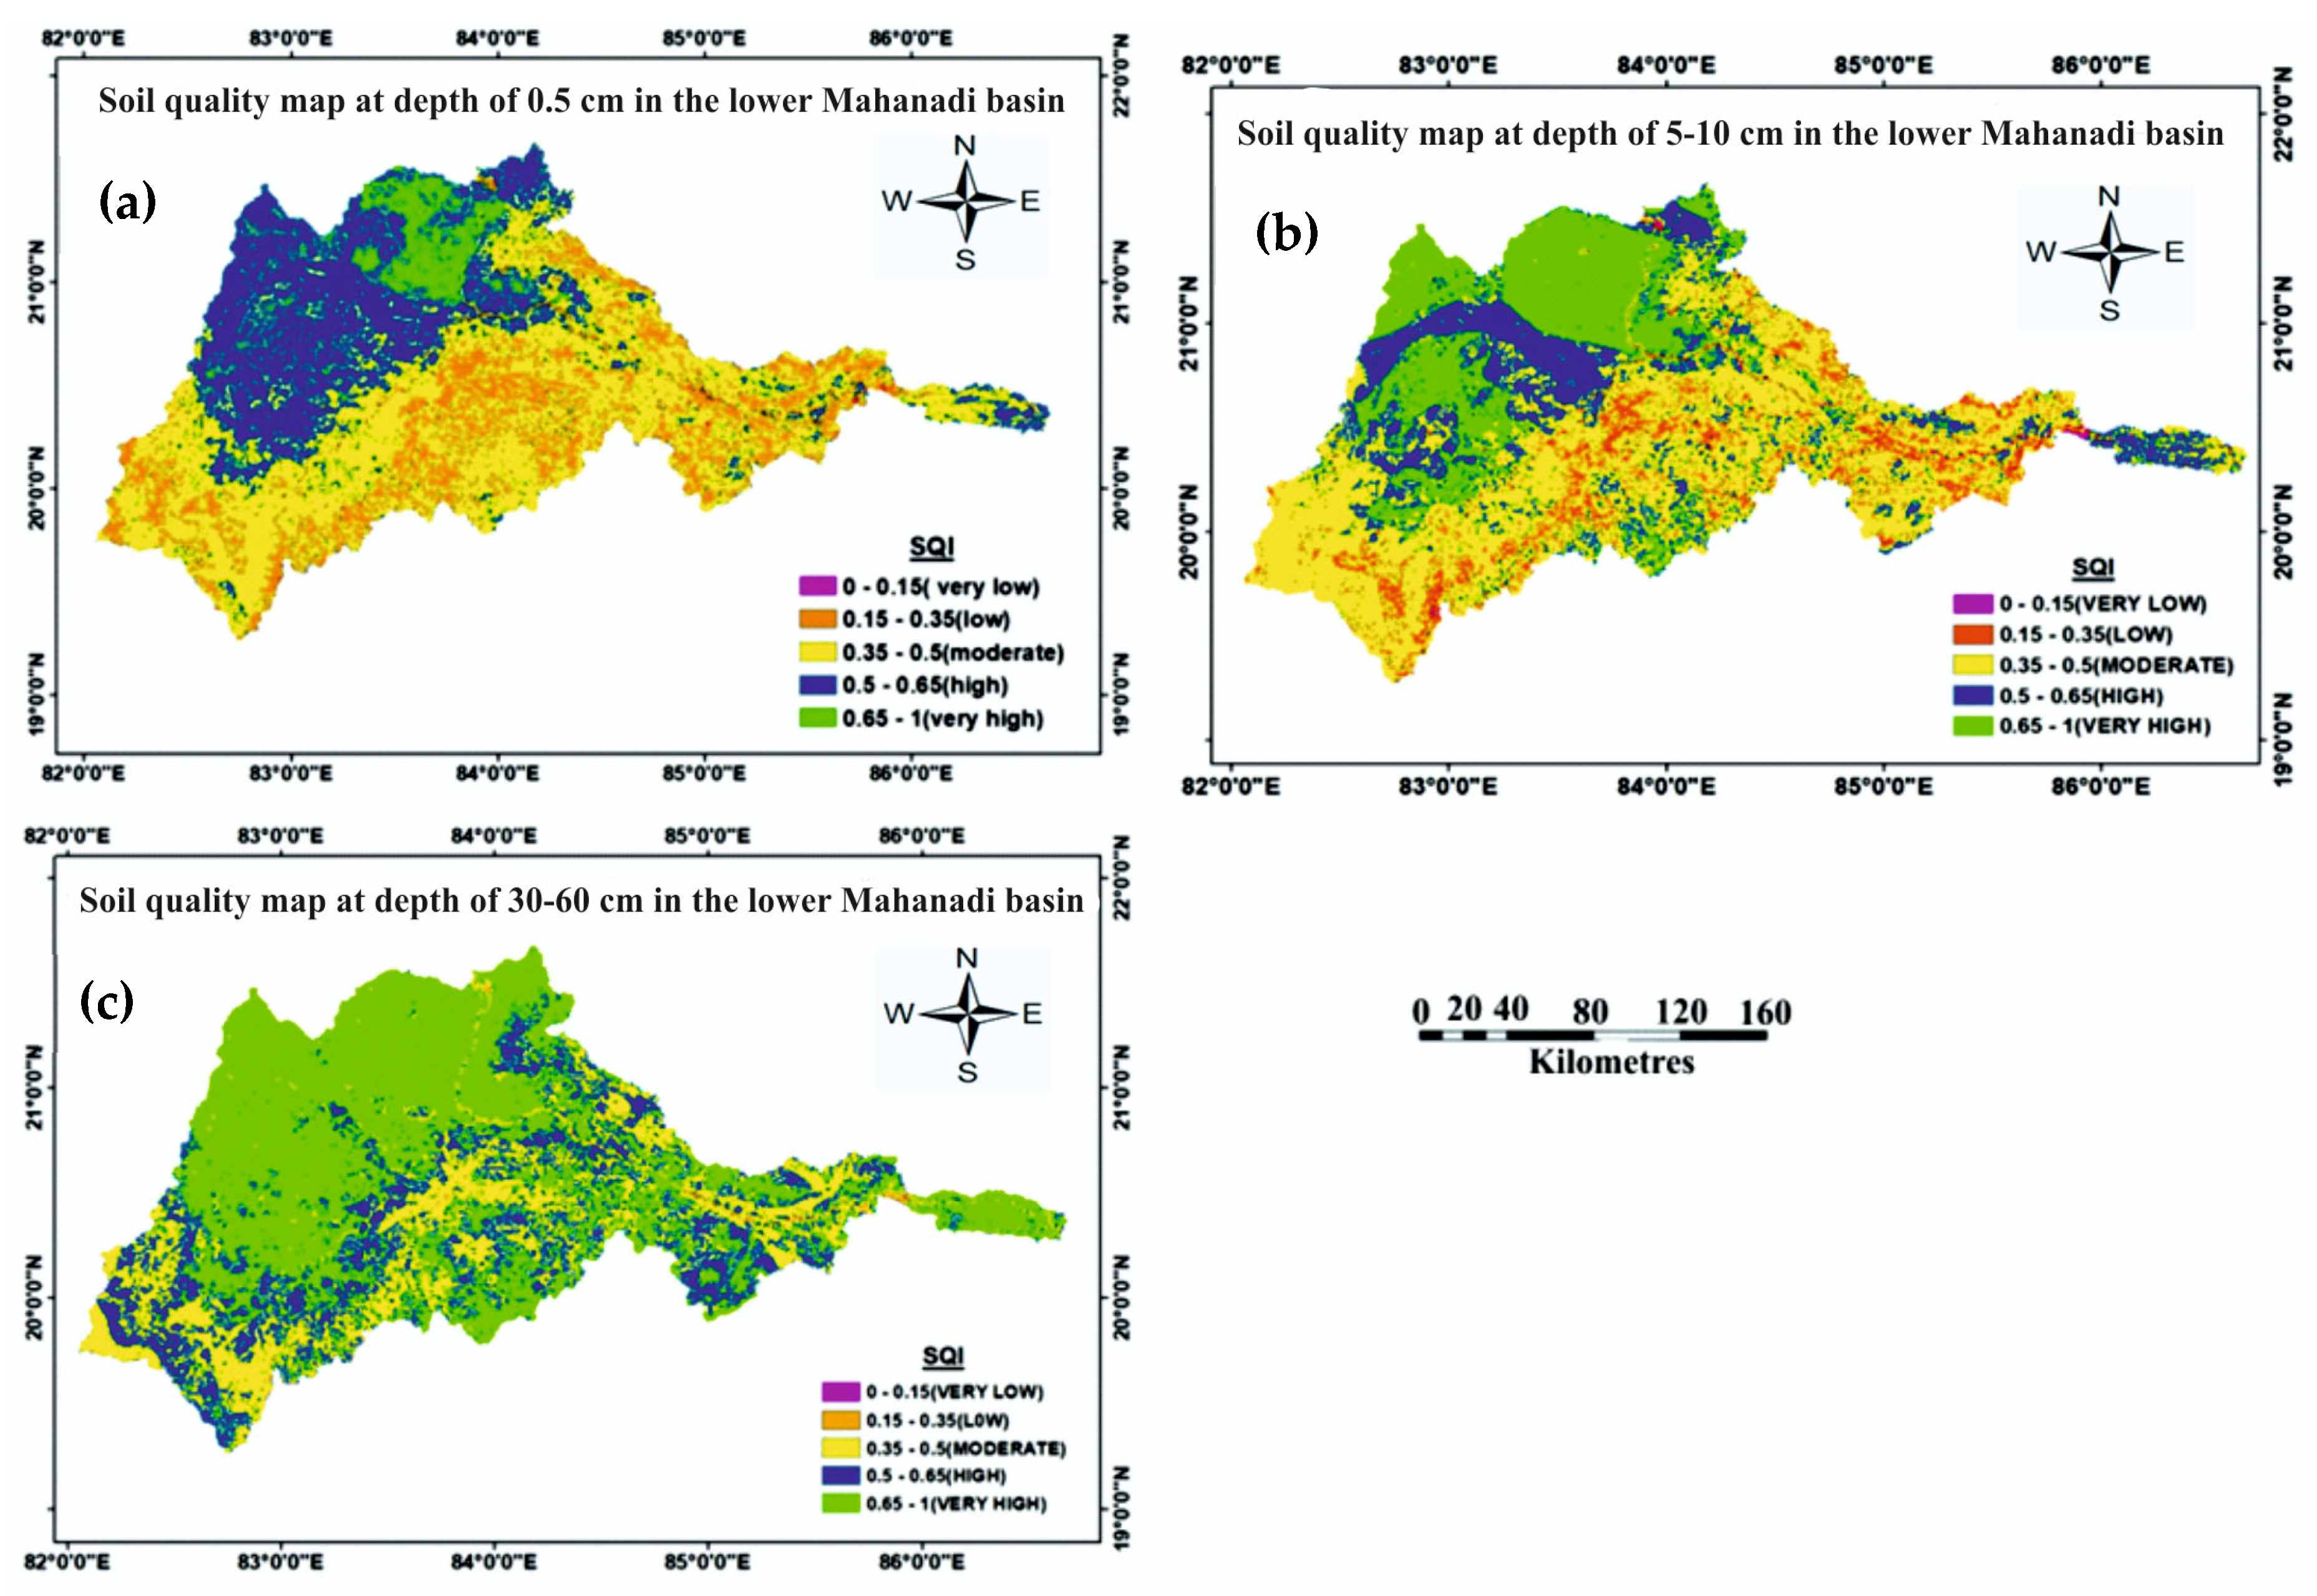
The soil quality analysis of the lower Mahanadi basin, conducted at various depths, reveals significant spatial variability, highlighting critical areas that require attention for sustainable agricultural practices. The SQI map at a depth of 0–5 cm (Figure 12a) categorizes soil quality into five classes: very low (0–0.15), low (0.15–0.35), moderate (0.35–0.5), high (0.5–0.65), and very high (0.65–1). The northern and northwestern regions predominantly exhibit high to very high soil quality, indicating favourable conditions for agriculture. Conversely, central and eastern regions are characterized by moderate to low soil quality, which suggests the need for targeted soil management interventions. The southwestern part of the basin displays patches of very low soil quality, possibly due to significant soil degradation or poor land management practices.
At a depth of 5–10 cm (Figure 12b), the SQI map shows considerable spatial variability in soil quality. The northwestern and northern areas continue to exhibit high to very high soil quality, which is optimal for agricultural activities. However, central and southern regions show moderate to low soil quality, indicating areas that may require improved soil management practices. The concentration of very low soil quality areas in the central parts suggests ongoing soil degradation or suboptimal agricultural practices.
At a depth of 30–60 cm (Figure 12c), the basin exhibits predominantly high to very high soil quality, particularly in the northwestern and northeastern regions. These areas, marked by extensive green zones on the map, suggest high fertility and suitability for sustainable agriculture. Central and southern regions display a mixture of moderate to high soil quality, with only small pockets of low-quality soil, indicating overall good soil health at this depth. The minimal presence of very low soil quality areas, primarily in scattered regions, indicates that deeper soils are well-preserved and less impacted by surface-level degradation factors.

4. Discussion

The soil quality assessment of the lower Mahanadi basin, integrating multiple parameters including LULC, demonstrates substantial spatio-temporal and depth-wise variability. LULC acts as a critical parameter as it influences erosion control, nutrient cycling, and organic matter input. Between 2011 and 2020, cropland decreased by 5.1%, whereas forest cover expanded by 11.5%. However, this aggregate increase masks the persistence of deforestation in peri-urban zones and intensively farmed landscapes. The coexistence of localized loss and widespread recovery underscores the complexity of land-use transitions, highlighting how overall afforestation can occur alongside persistent, site-specific forest depletion. Grassland showed an increase of 1% during the same period. These transitions directly affect soil quality, as supported by earlier studies linking land use changes to soil ecosystem [1,26,27].
Sandy clay loam dominated the southern and central basin, covering more than 45% of the area, supporting moderate infiltration and nutrient storage, while clay loam in the west enhanced water retention but introduced drainage limitations. Soil organic carbon density ranged from 0 to 145 g/kg in low-carbon zones to 290–435 g/kg in high-density zones, concentrated in the eastern and southeastern basin. This enrichment is consistent with earlier studies that highlight soil organic carbon as a primary determinant of soil fertility [16,22]. Bulk density values ranged from 1.35 to 1.66 g/cm3 in the surface layer and 1.79 g/cm3 at deeper layers, particularly in the western basin. Higher bulk density implies soil compaction, which hinders root penetration and water movement conditions often resulting from intensive cultivation or poor land use practices [37]. Intensive agricultural practices such as paddy–rice monocropping, double cropping under irrigated conditions, and excessive application of chemical fertilizers (urea and DAP) are common. These practices, though enhancing short-term productivity, have led to soil compaction (bulk density up to 1.79 g/cm3), depletion of organic carbon, and nutrient imbalance. Continuous paddy flooding also restricts aeration, alters nitrogen dynamics, and accelerates fertility decline in central and southwestern zones. Such patterns of degradation under intensive cultivation have been reported in eastern India [28,29]. Therefore, adopting conservation agriculture, crop rotation, and organic matter is essential for improving soil productivity. Soil degradation in the basin, caused by compaction, loss of fertility, and decline of organic matter, is a slow-moving geohazard with serious environmental and social effects. When the soil loses its ability to absorb water, more surface runoff occurs, which increases the chances of floods and sediment buildup. At the same time, poor soil structure and low fertility reduce crop productivity and weaken the ecosystem. Together, these problems make the region more vulnerable to natural hazards and threaten long-term farming sustainability. Understanding these connections is important to recognize soil degradation as a growing geohazard in the lower Mahanadi basin.
Increasing clay content with depth (up to 492 g/kg) influenced soil structure and nutrient dynamics, while nitrogen content ranged from 0 to 1.91 g/kg at shallow depths to 5.29 g/kg at deeper layers, suggesting higher nutrient retention in subsurface soils. Soil pH largely remained in the neutral to slightly alkaline range (6.2–7.4), providing favorable chemical conditions for diverse cropping systems. High sand content, ranging from 320.92 to 499 g/kg, was concentrated in southern and southeastern areas, enhancing drainage but increasing leaching risks. Conversely, high silt content (338.33–493 g/kg) in the central and western regions improved water and nutrient retention, supporting soil productivity. These textural impacts are consistent with soil fertility assessments in other semi-arid basins [15,25]. Organic carbon stock across the basin varied between 0 and 75 t/ha, with higher values in central and southern areas and lower reserves (<38.82 t/ha) in the north, underscoring the need for organic matter management practices such as residue retention and green manuring [35]. Such land use–soil interactions, including deforestation and cultivation, have been shown to strongly influence erosion, nutrient cycling, and soil degradation [4,7]. Remote sensing studies further confirm that vegetation cover and LULC transitions significantly affect runoff and soil erosion [6,11].
The SQI, developed from multiple parameters, demonstrated clear spatial and depth-wise variability across the lower Mahanadi basin and offering a robust decision-support tool for soil health assessment. In the surface layer (0–5 cm), higher SQI values (>0.65) were concentrated in the northern and northwestern zones, associated with favorable texture, improved land cover, and higher organic carbon levels. Conversely, the central and southwestern areas exhibited moderate to low SQI scores (0.15–0.35), reflecting soil compaction and reduced organic matter. At depths of 5–10 cm, SQI values in the range of 0.35–0.50 were widespread in central and southern regions, whereas deeper profiles (30–60 cm) recorded SQI values exceeding 0.50 in the northeast, indicating better resilience of sub-surface soils. These observations are consistent with previous findings that identified bulk density, organic carbon, and clay content as major determinants of soil quality [17,20]. GIS-based SQI mapping proved effective in highlighting soil heterogeneity and provided a useful framework for site-specific land management [19].
While this study effectively utilized satellite-derived and geospatial datasets, certain limitations are acknowledged. Specifically, the moderate spatial resolution of MODIS (500 m) and the generalized nature of global soil databases may introduce some degree of uncertainty. Due to the extensive spatial scope, field validation and on-site sampling were not feasible; however, the analytical robustness was enhanced through parameter cross-verification and comparison with findings from existing literature. Despite these limitations, the results exhibit strong consistency with known soil–land cover dynamics observed in comparable tropical river basins, thereby reinforcing the credibility of the SQI framework employed. Future research is to incorporate higher-resolution datasets, in situ calibration, and temporal analyses to improve model accuracy and deepen understanding of underlying processes. Furthermore, future work will include ground validation, sensitivity testing, and comparative evaluation with alternative frameworks such as PCA- and MDS-based SQI models to improve the model’s robustness and interpretive reliability.
Integrating soil quality parameters with land cover dynamics strengthens the reliability of SQI, linking vegetation shifts with soil processes and aligning with international goals for sustainable agriculture and land degradation neutrality [18]. The observed reduction in cropland (−5.1%) alongside forest expansion (+11.5%) strongly influenced soil quality trends in the basin. While increasing forest cover enhanced soil carbon storage and resilience, intensified agricultural practices contributed to higher soil compaction and declining fertility. These outcomes underscore the need for conservation-oriented farming, soil restoration strategies, and integrated land–soil planning to secure agricultural sustainability, ecosystem stability, and climate resilience in the lower Mahanadi basin. The main limitation of this study is that it does not include detailed soil factors such as microbial activity and mineral interactions. Without these, the understanding of soil changes and their direct effects on crop productivity remains incomplete. Future research should focus on seasonal and inter-annual soil variability, crop–soil yield linkages, and the combined impacts of climate variability, soil fertility, and land cover transitions to inform adaptive management strategies in the Lower Mahanadi Basin.

5. Conclusions

This geospatial assessment of soil quality in the lower Mahanadi basin, incorporating LULC as one of the key parameters, reveals pronounced spatial and temporal variability with critical implications for sustainable land management. Decreasing cropland (−5.1%) reflects contraction of agricultural land, while increasing forest cover (+11.5%) highlights the effectiveness of afforestation and reforestation measures. The integration of LULC within soil quality assessment demonstrates that forest expansion improved resilience, whereas agricultural contraction and intensification contributed to localized degradation, underscoring the need for conservation agriculture, organic matter enhancement, and integrated land-use planning to ensure long-term soil fertility and food security. Soil quality assessment using the SQI revealed depth-wise heterogeneity, with northern and northwestern zones exhibiting better soil health, supported by favorable texture, high organic carbon, and balanced pH. By contrast, central and southwestern regions recorded moderate to lower soil health, reflecting soil compaction and fertility decline. Overall, the study emphasizes the importance of depth-specific soil management, high-resolution monitoring, and adaptive land-use strategies to secure agricultural sustainability and ecological resilience in the lower Mahanadi basin.

Author Contributions

Conceptualization, S.K.S. and B.R.P.; methodology, S.K.S., B.R.P., A.M., C.S.D., M.K., A.C.P. and N.K.; software, A.M. and B.R.P.; validation, S.K.S., B.R.P., A.M., C.S.D., M.K. and A.C.P.; formal analysis, A.M. and B.R.P.; investigation, S.K.S., B.R.P., A.M., C.S.D., M.K. and A.C.P.; resources, B.R.P., A.M. and C.S.D.; data curation, B.R.P., M.K. and N.K.; writing—original draft preparation, S.K.S., B.R.P. and A.M.; writing—review and editing, S.K.S., B.R.P., A.M., C.S.D., M.K., A.C.P. and N.K.; visualization, S.K.S., B.R.P., A.M. and M.K.; supervision, B.R.P., C.S.D., A.C.P. and N.K.; project administration, B.R.P. and C.S.D. All authors have read and agreed to the published version of the manuscript.

Funding

This research received no external funding.

Data Availability Statement

The original contributions presented in this study are included in the article. Further inquiries can be directed to the corresponding author.

Acknowledgments

The authors are grateful to the Land Processes Distributed Active Archive Center (LP DAAC) for the LULC dataset, FAO and ISRIC—World Soil Information for soil related data free of cost.

Conflicts of Interest

The authors declare no conflicts of interest.

References

  1. Lambin, E.F.; Turner, B.L.; Geist, H.J.; Agbola, S.B.; Angelsen, A.; Bruce, J.W.; Coomes, O.T.; Dirzo, R.; Fischer, G.; Folke, C.; et al. The Causes of Land-Use and Land-Cover Change: Moving beyond the Myths. Glob. Environ. Change 2001, 11, 261–269. [Google Scholar] [CrossRef]
  2. Senanayake, S.; Pradhan, B.; Huete, A.; Brennan, J. Assessing Soil Erosion Hazards Using Land-Use Change and Landslide Frequency Ratio Method: A Case Study of Sabaragamuwa Province, Sri Lanka. Remote Sens. 2020, 12, 1483. [Google Scholar] [CrossRef]
  3. Waltner, I.; Saeidi, S.; Grósz, J.; Centeri, C.; Laborczi, A.; Pásztor, L. Spatial Assessment of the Effects of Land Cover Change on Soil Erosion in Hungary from 1990 to 2018. ISPRS Int. J. Geo-Inf. 2020, 9, 667. [Google Scholar] [CrossRef]
  4. Guzha, A.C.; Rufino, M.C.; Okoth, S.; Jacobs, S.; Nóbrega, R.L.B. Impacts of Land Use and Land Cover Change on Surface Runoff, Discharge and Low Flows: Evidence from East Africa. J. Hydrol. Reg. Stud. 2018, 15, 49–67. [Google Scholar] [CrossRef]
  5. Eswaran, H.; Lal, R.; Reich, P.F. Land Degradation: An Overview. In Response to Land Degradation; Bridges, E.M., Hannam, I.D., Oldeman, L.R., De Vries, F.W.T.P., Scherr, S.J., Sombatpanit, S., Eds.; CRC Press: Boca Raton, FL, USA, 2019; pp. 20–35. ISBN 978-0-429-18795-7. [Google Scholar]
  6. Panagos, P.; Borrelli, P.; Meusburger, K.; Yu, B.; Klik, A.; Jae Lim, K.; Yang, J.E.; Ni, J.; Miao, C.; Chattopadhyay, N.; et al. Global Rainfall Erosivity Assessment Based on High-Temporal Resolution Rainfall Records. Sci. Rep. 2017, 7, 4175. [Google Scholar] [CrossRef]
  7. Poesen, J. Soil Erosion in the Anthropocene: Research Needs. Earth Surf Process. Landf. 2018, 43, 64–84. [Google Scholar] [CrossRef]
  8. Steinmetz, A.A.; Cassalho, F.; Caldeira, T.L.; Oliveira, V.A.D.; Beskow, S.; Timm, L.C. Assessment of Soil Loss Vulnerability in Data-Scarce Watersheds in Southern Brazil. Ciênc. Agrotecnologia 2018, 42, 575–587. [Google Scholar] [CrossRef]
  9. Dwivedi, C.S.; Dishant; Parida, B.R.; Pandey, A.C.; Kumar, R.; Kumar, N. Geoinformatics-Based Mapping of Environmental Sensitive Areas for Desertification over Satara and Sangli Districts of Maharashtra, India. GeoHazards 2024, 5, 415–440. [Google Scholar] [CrossRef]
  10. Kumar, M.; Swain, S.K.; Parida, B.R.; Panda, A.; Dwivedi, C.S. Evaluating Impacts of Opencast Mining of Gondwana Coalfield (India) on Environment and Socioeconomic Using Multitemporal Satellite Data. Discov. Geosci. 2025, 3, 31. [Google Scholar] [CrossRef]
  11. Rawat, K.S.; Mishra, A.K.; Bhattacharyya, R. Soil Erosion Risk Assessment and Spatial Mapping Using LANDSAT-7 ETM+, RUSLE, and GIS—A Case Study. Arab. J. Geosci. 2016, 9, 288. [Google Scholar] [CrossRef]
  12. Saha, A. GIS Based Soil Erosion Estimation Using Rusle Model: A Case Study of Upper Kangsabati Watershed, West Bengal, India. Int. J. Environ. Sci. Nat. Res. 2018, 13, 555871. [Google Scholar] [CrossRef]
  13. Samanta, S.; Koloa, C.; Pal, D.K.; Palsamanta, B. Estimation of Potential Soil Erosion Rate Using RUSLE and E30 Model. Model. Earth Syst. Environ. 2016, 2, 149. [Google Scholar] [CrossRef]
  14. Kouli, M.; Soupios, P.; Vallianatos, F. Soil Erosion Prediction Using the Revised Universal Soil Loss Equation (RUSLE) in a GIS Framework, Chania, Northwestern Crete, Greece. Environ. Geol. 2009, 57, 483–497. [Google Scholar] [CrossRef]
  15. Tesfahunegn, G.B. Soil Quality Assessment Strategies for Evaluating Soil Degradation in Northern Ethiopia. Appl. Environ. Soil Sci. 2014, 2014, 646502. [Google Scholar] [CrossRef]
  16. Lal, R. Restoring Soil Quality to Mitigate Soil Degradation. Sustainability 2015, 7, 5875–5895. [Google Scholar] [CrossRef]
  17. Vasu, D.; Singh, S.K.; Ray, S.K.; Duraisami, V.P.; Tiwary, P.; Chandran, P.; Nimkar, A.M.; Anantwar, S.G. Soil Quality Index (SQI) as a Tool to Evaluate Crop Productivity in Semi-Arid Deccan Plateau, India. Geoderma 2016, 282, 70–79. [Google Scholar] [CrossRef]
  18. Kopittke, P.M.; Menzies, N.W.; Wang, P.; McKenna, B.A.; Lombi, E. Soil and the Intensification of Agriculture for Global Food Security. Environ. Int. 2019, 132, 105078. [Google Scholar] [CrossRef] [PubMed]
  19. AbdelRahman, M.A.E.; Tahoun, S. GIS Model-Builder Based on Comprehensive Geostatistical Approach to Assess Soil Quality. Remote Sens. Appl. Soc. Environ. 2019, 13, 204–214. [Google Scholar] [CrossRef]
  20. Andrews, S.S.; Karlen, D.L.; Mitchell, J.P. A Comparison of Soil Quality Indexing Methods for Vegetable Production Systems in Northern California. Agric. Ecosyst. Environ. 2002, 90, 25–45. [Google Scholar] [CrossRef]
  21. Dwivedi, C.S.; Kumari, S.; Pandey, A.C.; Parida, B.R.; Sikka, G. Site Suitability Analysis of a Municipal Solid Waste Management System in Ranchi City Using AHP: A Multi-Criteria Decision Approach. Environ. Qual. Manag. 2024, 34, e22312. [Google Scholar] [CrossRef]
  22. Ou, Y.; Rousseau, A.N.; Wang, L.; Yan, B. Spatio-Temporal Patterns of Soil Organic Carbon and pH in Relation to Environmental Factors—A Case Study of the Black Soil Region of Northeastern China. Agric. Ecosyst. Environ. 2017, 245, 22–31. [Google Scholar] [CrossRef]
  23. Ling, W.; Shen, Q.; Gao, Y.; Gu, X.; Yang, Z. Use of Bentonite to Control the Release of Copper from Contaminated Soils. Soil Res. 2007, 45, 618. [Google Scholar] [CrossRef]
  24. El-Ramady, H.; Alshaal, T.; Bakr, N.; Elbana, T.; Mohamed, E.; Belal, A.-A. (Eds.) The Soils of Egypt; World Soils Book Series; Springer International Publishing: Cham, Switzerland, 2019; ISBN 978-3-319-95515-5. [Google Scholar]
  25. Abuzaid, A.S.; Abdellatif, A.D.; Fadl, M.E. Modeling Soil Quality in Dakahlia Governorate, Egypt Using GIS Techniques. Egypt. J. Remote Sens. Space Sci. 2021, 24, 255–264. [Google Scholar] [CrossRef]
  26. Behera, M.D.; Tripathi, P.; Das, P.; Srivastava, S.K.; Roy, P.S.; Joshi, C.; Behera, P.R.; Deka, J.; Kumar, P.; Khan, M.L.; et al. Remote Sensing Based Deforestation Analysis in Mahanadi and Brahmaputra River Basin in India since 1985. J. Environ. Manag. 2018, 206, 1192–1203. [Google Scholar] [CrossRef]
  27. Verma, S.; Verma, M.K.; Prasad, A.D.; Mehta, D.; Azamathulla, H.M.; Muttil, N.; Rathnayake, U. Simulating the Hydrological Processes under Multiple Land Use/Land Cover and Climate Change Scenarios in the Mahanadi Reservoir Complex, Chhattisgarh, India. Water 2023, 15, 3068. [Google Scholar] [CrossRef]
  28. Panigrahi, B.; Paramjita, D.; Giri, M.A.; Paul, J.C. Frequency Analysis for Prediction of Maximum Flood Discharge in Mahanadi River Basin. Int. J. Curr. Microbiol. Appl. Sci. 2020, 9, 3626–3639. [Google Scholar] [CrossRef]
  29. Sahu, G.; Vidyarthi, V.K. Modeling Land Use/Land Cover Transformations in Mahanadi River Basin in Chhattisgarh, India: Trends and Future Projections. GeoJournal 2024, 89, 132. [Google Scholar] [CrossRef]
  30. CWC. Water and Related Statistics; Central Water Commission, Government of India: New Delhi, India, 2020. [Google Scholar]
  31. IMD. Climate of India; India Meteorological Department, Ministry of Earth Sciences, Government of India: New Delhi, India, 2021. [Google Scholar]
  32. LPDAAC. MODIS Land Cover Type Product (MCD12Q1 Version 6); NASA Land Processes Distributed Active Archive Center (LP DAAC), USGS Earth Resources Observation and Science (EROS) Center: Sioux Falls, SD, USA, 2021.
  33. ISRIC. SoilGrids250m Version 2.0: Global Gridded Soil Information at 250 m Resolution; ISRIC: Wageningen, The Netherlands, 2020. [Google Scholar]
  34. FAO. Harmonized World Soil Database (Version 1.2); FAO: Rome, Italy; IIASA: Laxenburg, Austria, 2012. [Google Scholar]
  35. Mukherjee, A.; Lal, R. Comparison of Soil Quality Index Using Three Methods. PLoS ONE 2014, 9, e105981. [Google Scholar] [CrossRef]
  36. Jamal Nasir, M.; Farooq Haider, M.; Ali, Z.; Akhtar, W.; Alam, S. Evaluation of Soil Quality through Simple Additive Soil Quality Index (SQI) of Tehsil Charsadda, Khyber Pakhtunkhwa, Pakistan. J. Saudi Soc. Agric. Sci. 2024, 23, 42–54. [Google Scholar] [CrossRef]
  37. Hu, W.; Cichota, R.; Beare, M.; Müller, K.; Drewry, J.; Eger, A. Soil Structural Vulnerability: Critical Review and Conceptual Development. Geoderma 2023, 430, 116346. [Google Scholar] [CrossRef]
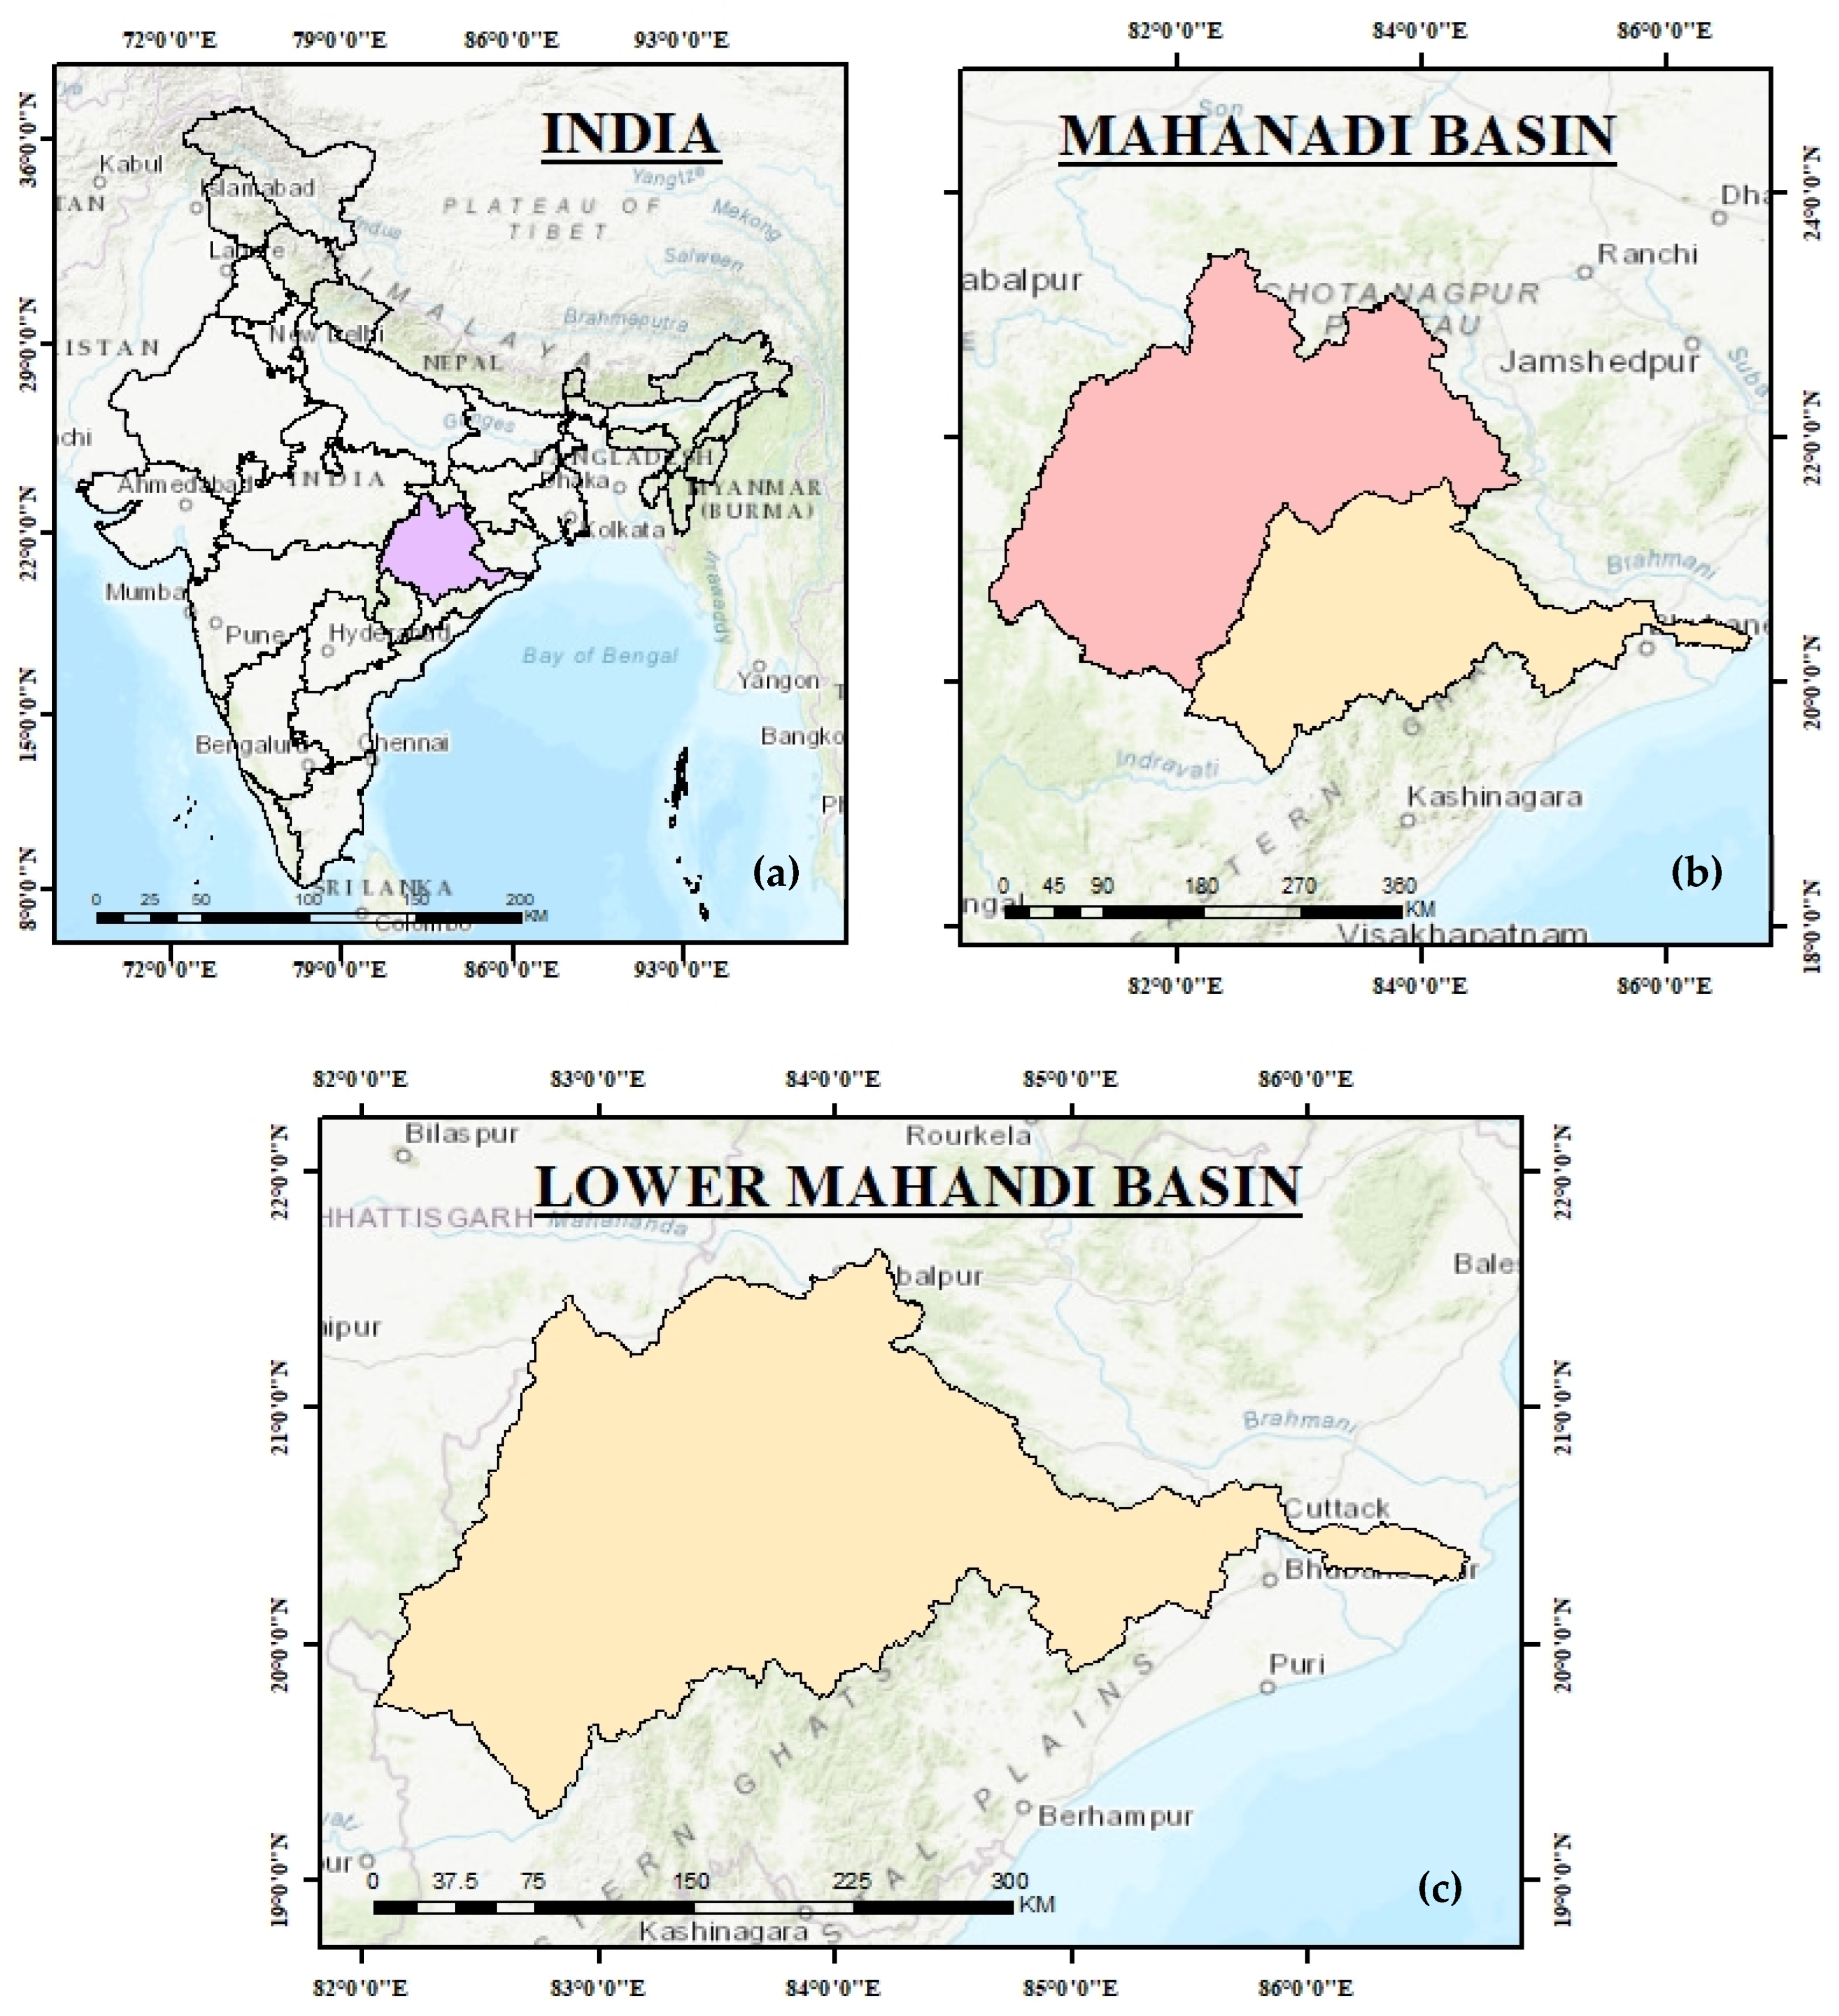
Figure 1. (a) Location map showing the Mahanadi basin in India. (b) the Mahanadi basin is divided into upper (pink) and lower sub-basin (yellow), and (c) our study area: detailed extent of the lower Mahanadi basin in eastern India.
Geohazards 06 00071 g001
Figure 2. Flowchart of the methodology adopted in this study.
Geohazards 06 00071 g002
Figure 3. (a) LULC maps showing the lower Mahanadi basin for the year 2011 and (b) year 2020.
Geohazards 06 00071 g003
Figure 4. Map showing soil texture of the lower Mahanadi basin.
Geohazards 06 00071 g004
Figure 5. (a) Map illustrating the clay content (g/kg) at depth of 0–0.5 cm, (b) depth of 5–10 cm, and (c) depth of 30–60 cm in the lower Mahanadi basin.
Geohazards 06 00071 g005
Figure 6. (a) Map showing the sand content (g/kg) at depth of 0–0.5 cm, (b) depth of 5–10 cm, and (c) depth of 30–60 cm in the lower Mahanadi basin.
Geohazards 06 00071 g006
Figure 7. (a) Map illustrating the silt content (g/kg) at depth of 0–0.5 cm, (b) depth of 5–10 cm, and (c) depth of 30–60 cm in the lower Mahanadi basin.
Geohazards 06 00071 g007
Figure 8. (a) Map illustrating the organic carbon density (g/kg) at depth of 0–0.5 cm, (b) depth of 5–10 cm, and (c) depth of 30–60 cm, whereas (d) soil organic carbon stock (t/ha) is at depth of 0–30 cm in the lower Mahanadi basin.
Geohazards 06 00071 g008
Figure 9. (a) Map showing the nitrogen content (g/kg) at depth of 0–0.5 cm, (b) depth of 5–10 cm, and (c) depth of 30–60 cm in the lower Mahanadi basin.
Geohazards 06 00071 g009
Figure 10. (a) Map showing Bulk density (g/cm3) at depth of 0–0.5 cm, (b) depth of 5–10 cm, and (c) depth of 30–60 cm in the lower Mahanadi basin.
Geohazards 06 00071 g010
Figure 11. (a) Map illustrating the Soil water pH at depth of 0–0.5 cm, (b) depth of 5–10 cm, and (c) depth of 30–60 cm in the lower Mahanadi basin.
Geohazards 06 00071 g011
Figure 12. (a) Map showing the soil quality at depth of 0.5 cm, (b) depth of 5–10 cm, and (c) depth of 30–60 cm of the lower Mahanadi basin.
Geohazards 06 00071 g012
Table 2. Indicators, ranges, and scores used for assessing soil quality at three different depths.
IndicatorsDepth RangesScore
0–5 cm5–10 cm30–60 cm
LULCBuilt-upBuilt-upBuilt-up0
ForestForestForest2
GrasslandGrasslandGrassland1
CroplandCroplandCropland2
Waste landWaste landWaste land0
waterbodieswaterbodieswaterbodies1
Soil textureSandy clay loamSandy clay loamSandy clay loam2
Clay loamClay loamClay loam2
Sandy loamSandy loamSandy loam1
ClayClayClay2
LoamLoamLoam1
SandySandySandy1
Clay content (g/kg)0–158.70–155.70–164.00
158.7–317.3155.7–311.3164.0–328.01
317.3–476.0311.3–467.0328.0–492.02
Sand content (g/kg)0–166.30–166.70–152.02
166.3–332.7166.7–333.3152.0–304.01
332.7–499.0333.3–500.0304.0–456.00
Silt content
(g/kg)
0–164.30–166.00–155.30
164.3–328.7166.0–332.0155.3–310.71
328.7–493.0332.0–498.0310.66–4662
Organic carbon density (g/kg)0–1450–1330–770
145–290133–26677–1541
290–435266–399154–2312
Soil organic carbon stock (t/ha)0–250–250–250
25–5025–5025–501
50–7550–7550–752
Nitrogen (g/kg)0–1.910–2.010–1.760
1.91–3.812.01–4.021.76–3.531
3.81–5.724.02–6.033.53–5.292
Bulk density (g/cm3)0–0.550–0.560–0.592
0.55–1.110.56–1.120.59–1.191
1.11–1.661.12–1.681.19–1.790
Water pH0–2.40–2.50–2.60
2.4–4.92.5–5.02.6–5.11
4.9–7.45.0–7.55.1–7.72
Note: A score of 0 indicates poor quality, 1 indicates moderate quality, and 2 indicates good quality.
Table 3. Area distribution of LULC types in the lower Mahanadi basin for the years 2011 and 2020.
LULC Classes2011 (km2)2020 (km2)
Cropland39,493.237,495.9
Grassland4826.35432.1
Forest12,401.213,822.2
Built-up131.2134.4
Wasteland133.093.2
Waterbody184.3191.4
Disclaimer/Publisher’s Note: The statements, opinions and data contained in all publications are solely those of the individual author(s) and contributor(s) and not of MDPI and/or the editor(s). MDPI and/or the editor(s) disclaim responsibility for any injury to people or property resulting from any ideas, methods, instructions or products referred to in the content.