Article

A Geotechnical–Hydrogeological Property Zonation Approach for Landslide Hazard Modelling in the eThekwini Metropolitan Region, Eastern South Africa


by
Sibonakaliso Goodman Chiliza
1,2,*,
Egerton D. C. Hingston
2 and
Molla Demlie
2
1
Council for Geoscience, 280 Pretoria Street, Silverton, Pretoria 0001, South Africa
2
School of Agriculture and Science, Discipline of Geological Sciences, College of Agriculture, Engineering and Science, University of KwaZulu-Natal, Westville Campus, Private Bag X54001, Durban 4000, South Africa
*
Author to whom correspondence should be addressed.
GeoHazards 2026, 7(4), 110; https://doi.org/10.3390/geohazards7040110
Submission received: 7 July 2026 / Revised: 6 August 2026 / Accepted: 11 August 2026 / Published: 8 September 2026

Abstract

Rainfall-induced landslides pose a significant threat to communities and infrastructure in the eThekwini Metropolitan Region, South Africa. This paper presents a geotechnical–hydrogeological property zonation and parameterisation framework developed to support future physically based slope stability modelling. Using a weighted sum analysis in a GIS environment, the landscape was subdivided into distinct property zones by integrating lithology, slope gradient, and landform, with weights derived from a fully reproducible renormalisation of a previously published regional frequency ratio (FR) susceptibility model. This procedure provided the foundation for assigning zone-specific parameters, including effective shear strength parameters (c′ and ϕ′) and saturated hydraulic conductivity (Ksat), derived from laboratory testing, borehole pump testing analysis, and empirical relationships. The approach delineated four geotechnical–hydrogeological zones. A correlation of these zones against an inventory of 819 landslides revealed that over 82% of failures have occurred within Zones 2 and 3. While the hydrogeological conditions of these two susceptible zones range from intermediate to low permeability (Ksat = 10−5 to 10−8 m/s), which promotes transient pore pressure build-up, their high failure frequency corresponds closely with shared low shear strength (c′ = 5 kPa) and comparatively low effective friction angle (ϕ′ = 27.5–30°). This identifies shear strength as an important predisposing control on instability, relative to the inherently more stable Zones 1 and 4 (c′ = 10–15 kPa, ϕ′ = 30–35°). Consequently, this zonation and parameterisation approach advances landslide hazard assessment by providing a reproducible, model-ready dataset intended for future transient rainfall-infiltration simulations (e.g., TRIGRS), laying the groundwork for physically based early-warning systems, and supporting risk-informed urban development.

1. Introduction

Landslides are a prevalent global natural hazard that result in significant economic losses, infrastructure damage, and fatalities [1,2]. These events are typically triggered by factors that either increase shear stress, such as earthquakes and human activities, or decrease shear strength, such as saturation and weathering [3,4]. Rainfall-triggered landslides are particularly destructive [5,6]. In South Africa, recent events in 2019 and 2022 within the eThekwini Metropolitan Region of KwaZulu-Natal, South Africa, caused hundreds of deaths. Furthermore, damage to infrastructure during these events was estimated at USD 1.57 billion [7]. These disasters highlight the urgent need for improved prediction and hazard assessment, particularly in vulnerable informal settlements [2] and along critical infrastructure corridors, given the scale of damage already documented in the region [7].
Globally, landslide research is concentrated in Asia and Europe, leaving Africa largely underrepresented [8,9,10]. Continental-scale initiatives have emerged, such as the Africa-wide susceptibility map by [11]. However, these regional models are often constrained by coarse resolution. Such generalised data limit their applicability for local-scale hazard assessments, where many rainfall-induced landslides are driven by steep terrain, deeply weathered lithologies, and increasingly intense rainfall linked to climate variability [12].
Physically based models such as the Shallow Landslide Stability Model (SHALSTAB) [13], Transient Rainfall Infiltration and Grid-Based Regional Slope-Stability (TRIGRS) [14,15], and Fast Shallow Landslide Assessment Model (FSLAM) [16] simulate slope responses to hydrometeorological triggers. However, these models require detailed, spatially distributed geotechnical parameters. Their predictive reliability is often challenged in data-scarce regions, where logistical and financial limitations constrain high-resolution subsurface data [12]. Consequently, landslide studies in South Africa frequently rely on empirical or statistical approaches that may inadequately capture subsurface heterogeneity [17,18].
Furthermore, a key limitation of landslide research in the region is the lack of a spatially differentiated zonation methodology that integrates terrain-forming attributes (e.g., geology and slope gradient) with directly measured geotechnical properties (e.g., shear strength, permeability, and unit weight). Without such a systematic approach, parameter input for physically based models remains fragmented and inconsistent, reducing overall modelling reliability [18,19].
This paper presents a novel, reproducible, data-driven geotechnical–hydrogeological zonation approach tailored to the geomorphological and infrastructural conditions of the study area for physical model-based landslide assessment. The approach integrates field-validated terrain classification with laboratory and empirically determined geotechnical and hydrogeological parameters to generate spatially distributed inputs for physically based models [20].
Conventional GIS-based susceptibility mapping methods, such as the Analytic Hierarchy Process (AHP) or Weight of Evidence (WoE), often rely on qualitative terrain attributes and historical correlations [9,21,22,23,24,25,26]. In contrast, this study employs a quantitative methodology to delineate geotechnical zones by integrating geology, slope gradient, and landform classification, along with their associated geotechnical and hydrogeological properties.
Thus, the main aim of this study is to develop a reproducible, data-driven geotechnical–hydrogeological zonation methodology for the eThekwini Metropolitan Region. This was done by delineating distinct property zones. In this study, the term ‘property zone’ refers to a geotechnical–hydrogeological terrain unit characterised by a unique combination of lithological, geomorphological, geotechnical and hydrogeological characteristics. Quantifying key mechanical and hydraulic parameters per zone facilitates future transient rainfall-infiltration modelling.
By integrating field-validated terrain classification with measured parameters, this zonation approach produces high-resolution, spatially distributed data that overcome the limitations of current empirical models and enable reliable landslide hazard assessment and the development of early-warning systems.

2. The Study Area

2.1. Location and Climate

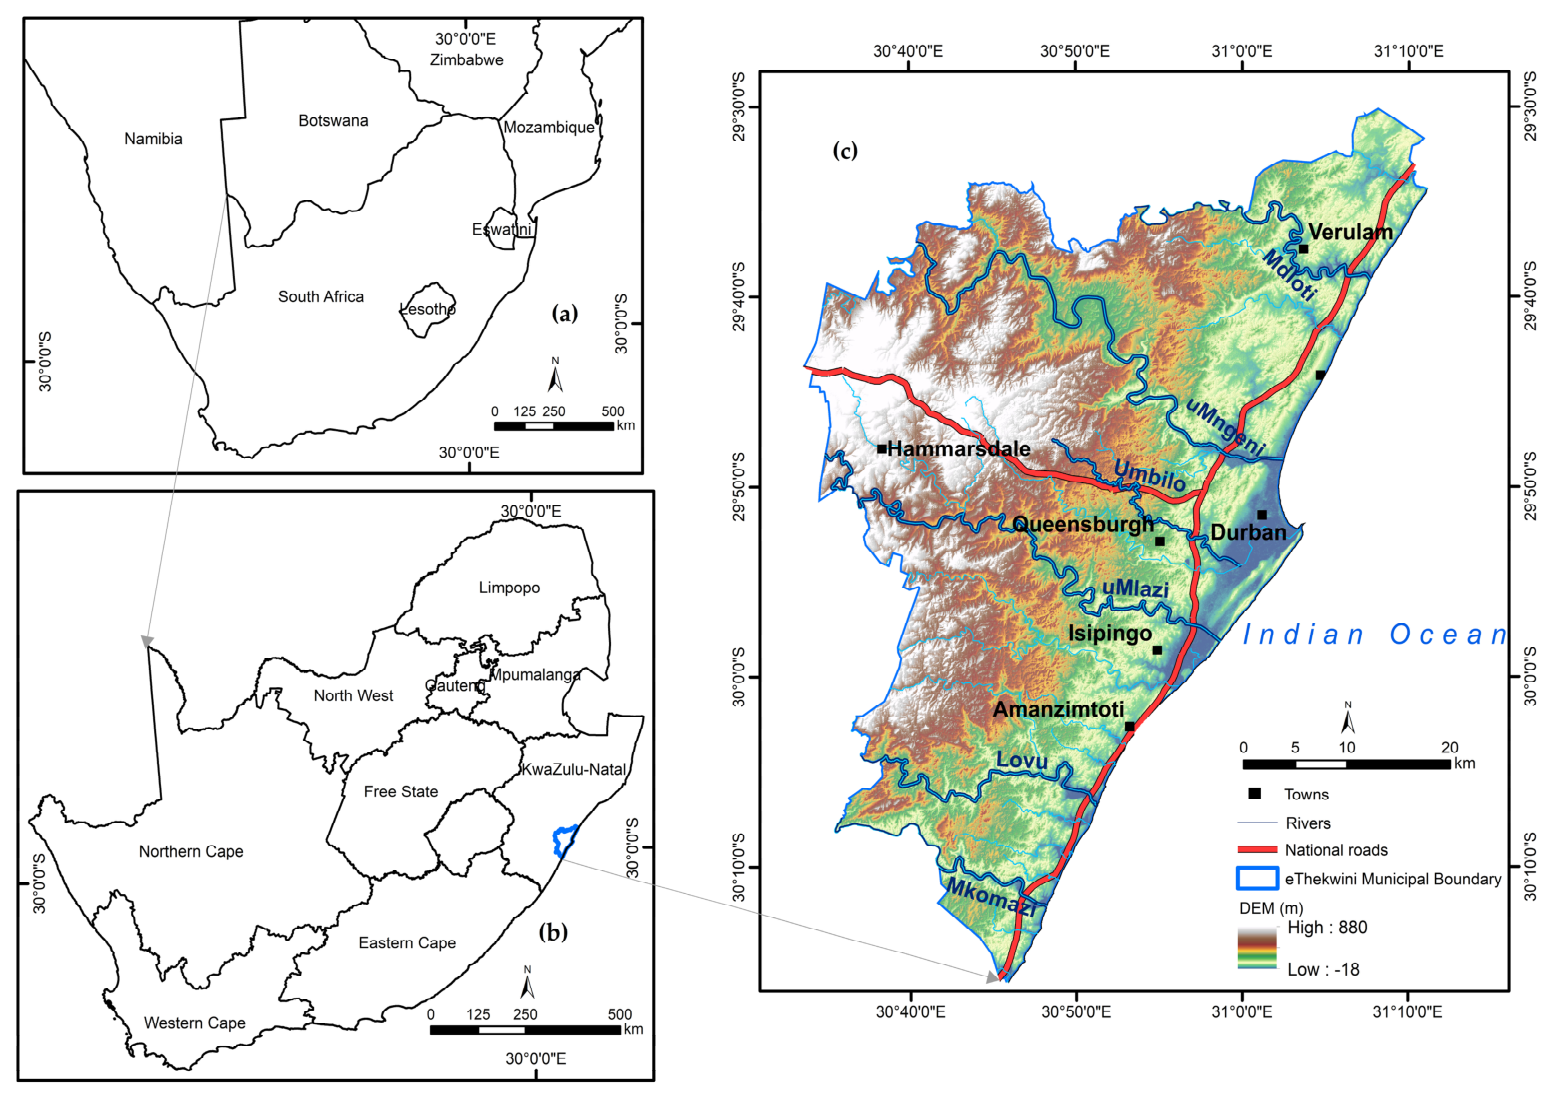
The eThekwini Metropolitan Region is located on the eastern coast of KwaZulu-Natal province in eastern South Africa and spans an area of 2555 km2 (Figure 1). Geographically, the area covers the south-eastern hinterland of the province, extending from the dissected interior plateau margin to the low-lying coastal plains [27]. The hinterland has dissected valleys and ridges with orthogonally meandering rivers, while the narrow coastal plain features straight river courses. The major rivers include the uMkhomazi, Lovu, uMlazi, uMbilo, uMngeni, and uMdloti Rivers, which drain west-to-east into the Indian Ocean (Figure 1). The land use comprises ~32% urban (including the Durban CBD with residential, commercial, and industrial zones) and 68% peri-urban/rural areas with settlements, wetlands, reserves, and recreational spaces [28]. Economic activity clusters along the N2 and N3 highways, while a comprehensive road and rail network ensures regional connectivity [29].
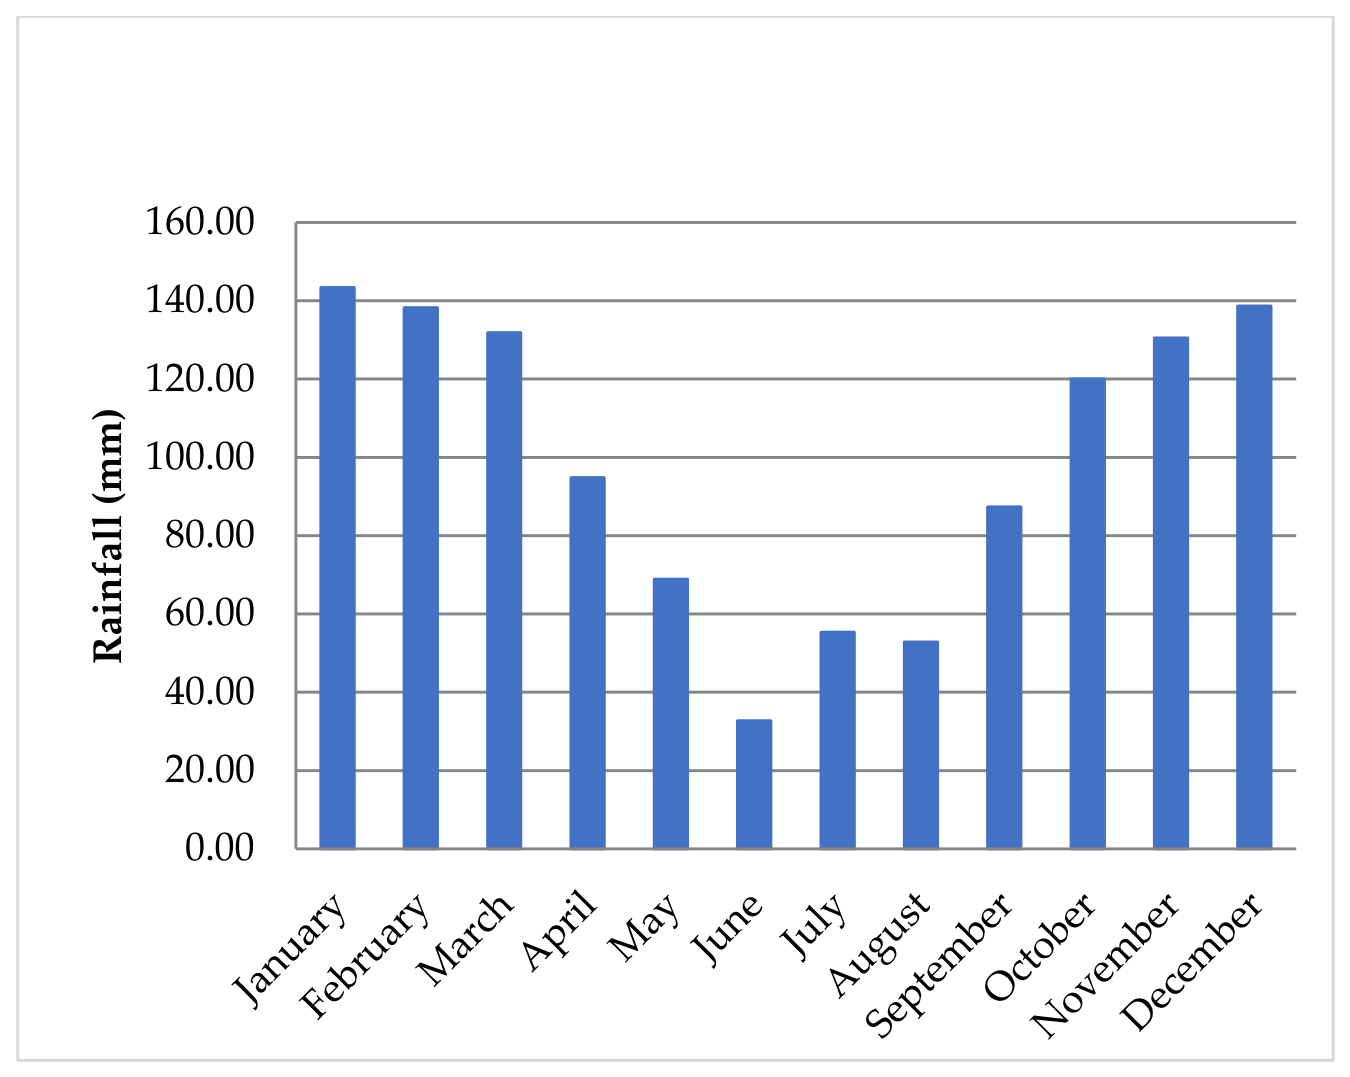
The region has a humid subtropical climate with warm, wet summers (mean 23.5 °C) and cool, dry winters (mean 17.3 °C), with an annual mean of ~20.7 °C. The region receives a mean annual rainfall of about 1000 mm, predominantly occurring in summer (September to April) (Figure 2), often associated with low-pressure systems trapped by high-pressure cells over the Indian Ocean [30].

2.2. Geological and Hydrogeological Setting of the Study Area

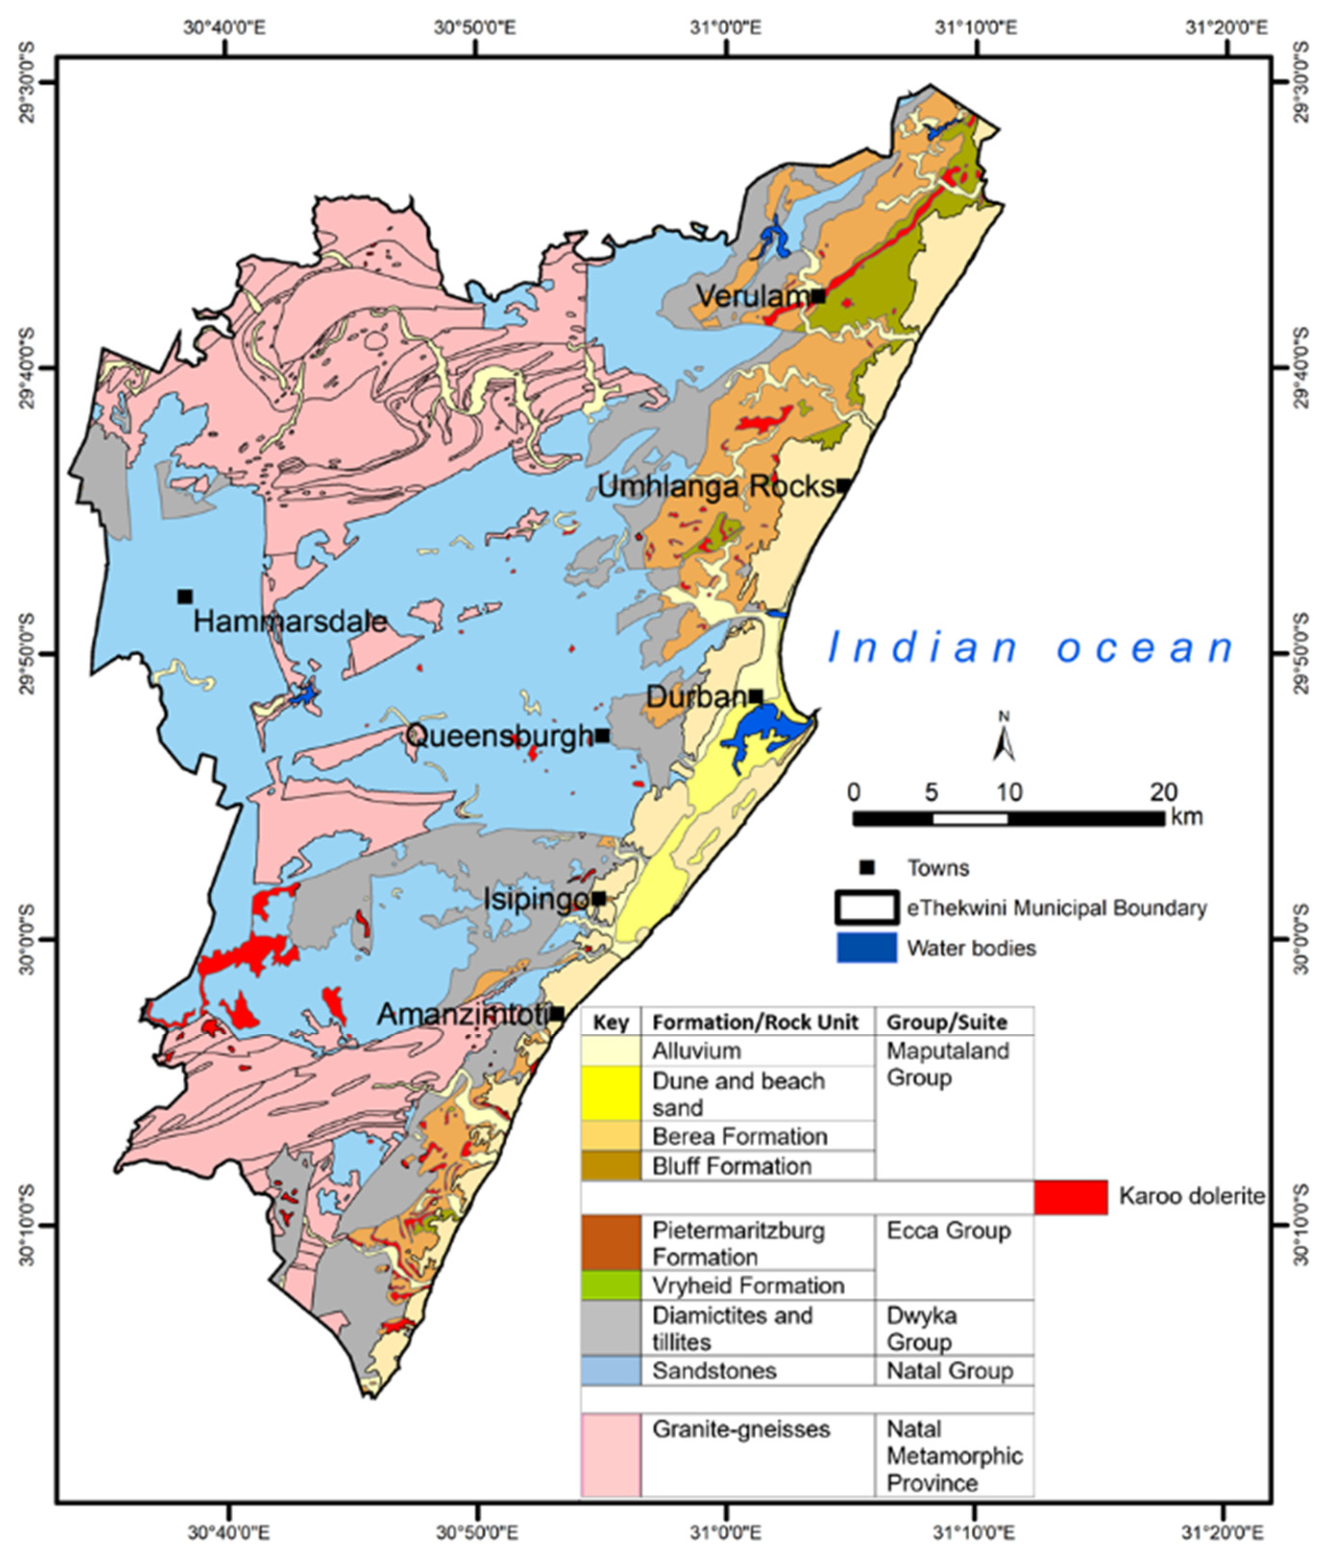
The study area is characterised by a geological setting comprising the Natal Metamorphic Province (NMP) rocks that are mainly granite gneiss forming the basement [31]. These basement rocks are unconformably overlain by the Ordovician Natal Group sandstones, which cover a large area (Figure 3). These sandstones are usually covered by thick, highly erodible sandy soil [29]. The late Carboniferous unconformably overlies the Natal Group sandstone and the early Permian Dwyka Group, the basal unit of the Karoo Supergroup. The Dwyka Group comprises mainly diamictites and tillites, showing a wide range of depositional environments. The early Permian Pietermaritzburg Formation of the Ecca Group overlies the Dwyka Group. This formation comprises a homogeneous sequence of black to light grey carbonaceous siltstone and shale. The overlying Permian Vryheid Formation of the Ecca Group comprises an alternating sequence of mudrock and sandstone. Jurassic dolerite sills and dykes intrude extensively into the Ecca Group sequences [32].
The youngest geological units in the study area are the Cenozoic (Neogene to Quaternary) Maputaland Group sediments, which are unconsolidated to semi-consolidated coastal deposits. These include the Bluff Formation, the Berea Formation, and the Harbour Beds Formation, which are alluvial, aeolian and estuarine sediments occurring along the coast [32].
These diverse lithologies exhibit varying degrees of weathering and geotechnical properties. The residual soils, colluvium, alluvium, and recent coastal sands that cap the bedrock may exhibit deep weathering profiles, particularly on steep slopes prone to shallow landslides and debris flows [29]. For instance, sandy soils above the Natal Group sandstone generally exhibit high permeability under normal rainfall infiltration [33], though this behaviour is moderated locally by fine-fraction content (discussed further below). Water infiltration into the bedding planes of the Pietermaritzburg Formation shales also significantly contributes to slope instability, causing translational landslides, typically controlled by bedding orientation and failures at the soil–rock interface [34].
Hydrogeological, groundwater in the region occurs within three primary aquifer modes that dictate the hydraulic conditions preceding slope failure [35]. The late Cenozoic Maputaland Group deposits form intergranular aquifers in which groundwater typically occurs at shallow depths (2 to 7 m below ground level) under unconfined or water table conditions. The Natal Group sandstone and Vryheid Formation are fractured aquifers, in which interconnected fractures, faults, and joints control groundwater storage and transmission. The granitic basement rocks and the Pietermaritzburg Formation form weathered and fractured aquifers [35].
The hydrogeological behaviour of these units during prolonged precipitation is a primary control on slope stability. In the sandy soils overlying the Natal Group sandstone, high permeability generally allows for efficient drainage under normal conditions. However, the presence of minor silt and clay fractions can inhibit drainage during rapid infiltration. This creates a “bottleneck” effect, leading to rapid saturation and a localised rise in pore water pressure. This transition from unsaturated to saturated conditions reduces the effective shear strength of the material, frequently triggering earth flows following heavy rainfall [33].
Conversely, the Pietermaritzburg Formation shales and Dwyka Group diamictites exhibit very low hydraulic conductivities and may be considered non-aquifers acting as aquitards [35]. In these argillaceous units, instability is driven by water ingress into bedding planes. This process generates high pore water pressures along structural discontinuities, thereby facilitating translational landslides. These failures are typically controlled by bedding orientation and occur preferentially at the soil–rock interface where a permeability contrast exists.
Regional groundwater flow is topography-driven, moving from the western highlands toward the primary discharge zone along the Indian Ocean [36]. Local flow patterns result in steeper hydraulic gradients in the granitic basement and gentler gradients in the sedimentary sequences. Depth to groundwater generally increases with elevation from east to west, though shallow water tables persist along coastal areas, valley bottoms, and near rivers [36]. These areas serve as local discharge sites, where the high antecedent moisture content and saturation-induced loss of apparent cohesion suction can render slopes particularly susceptible to failure during extreme weather events.

3. Methodology

Data and Software: The zonation and parameterisation workflow was implemented in ArcGIS Pro (version 3.5.3). Terrain analysis (slope, curvature-derived landforms, and raster reclassification/weighted sum operations) was performed using a Council for Geoscience digital elevation model with a 30 m spatial resolution that covered the entire study area. Remote sensing verification of landslide records used Maxar VHR satellite imagery at 0.3–0.5 m resolution, accessed via Google Earth Pro (version 7.3.7). Field verification of representative landslide sites and terrain facets used a handheld GPS with ±5 m accuracy. Laboratory geotechnical testing was conducted in accordance with [37] for shear strength, and [38,39] for index properties and soil classification, using standard geotechnical laboratory equipment at SANAS-accredited Steyn-Wilson Laboratories in Cape Town, South Africa.
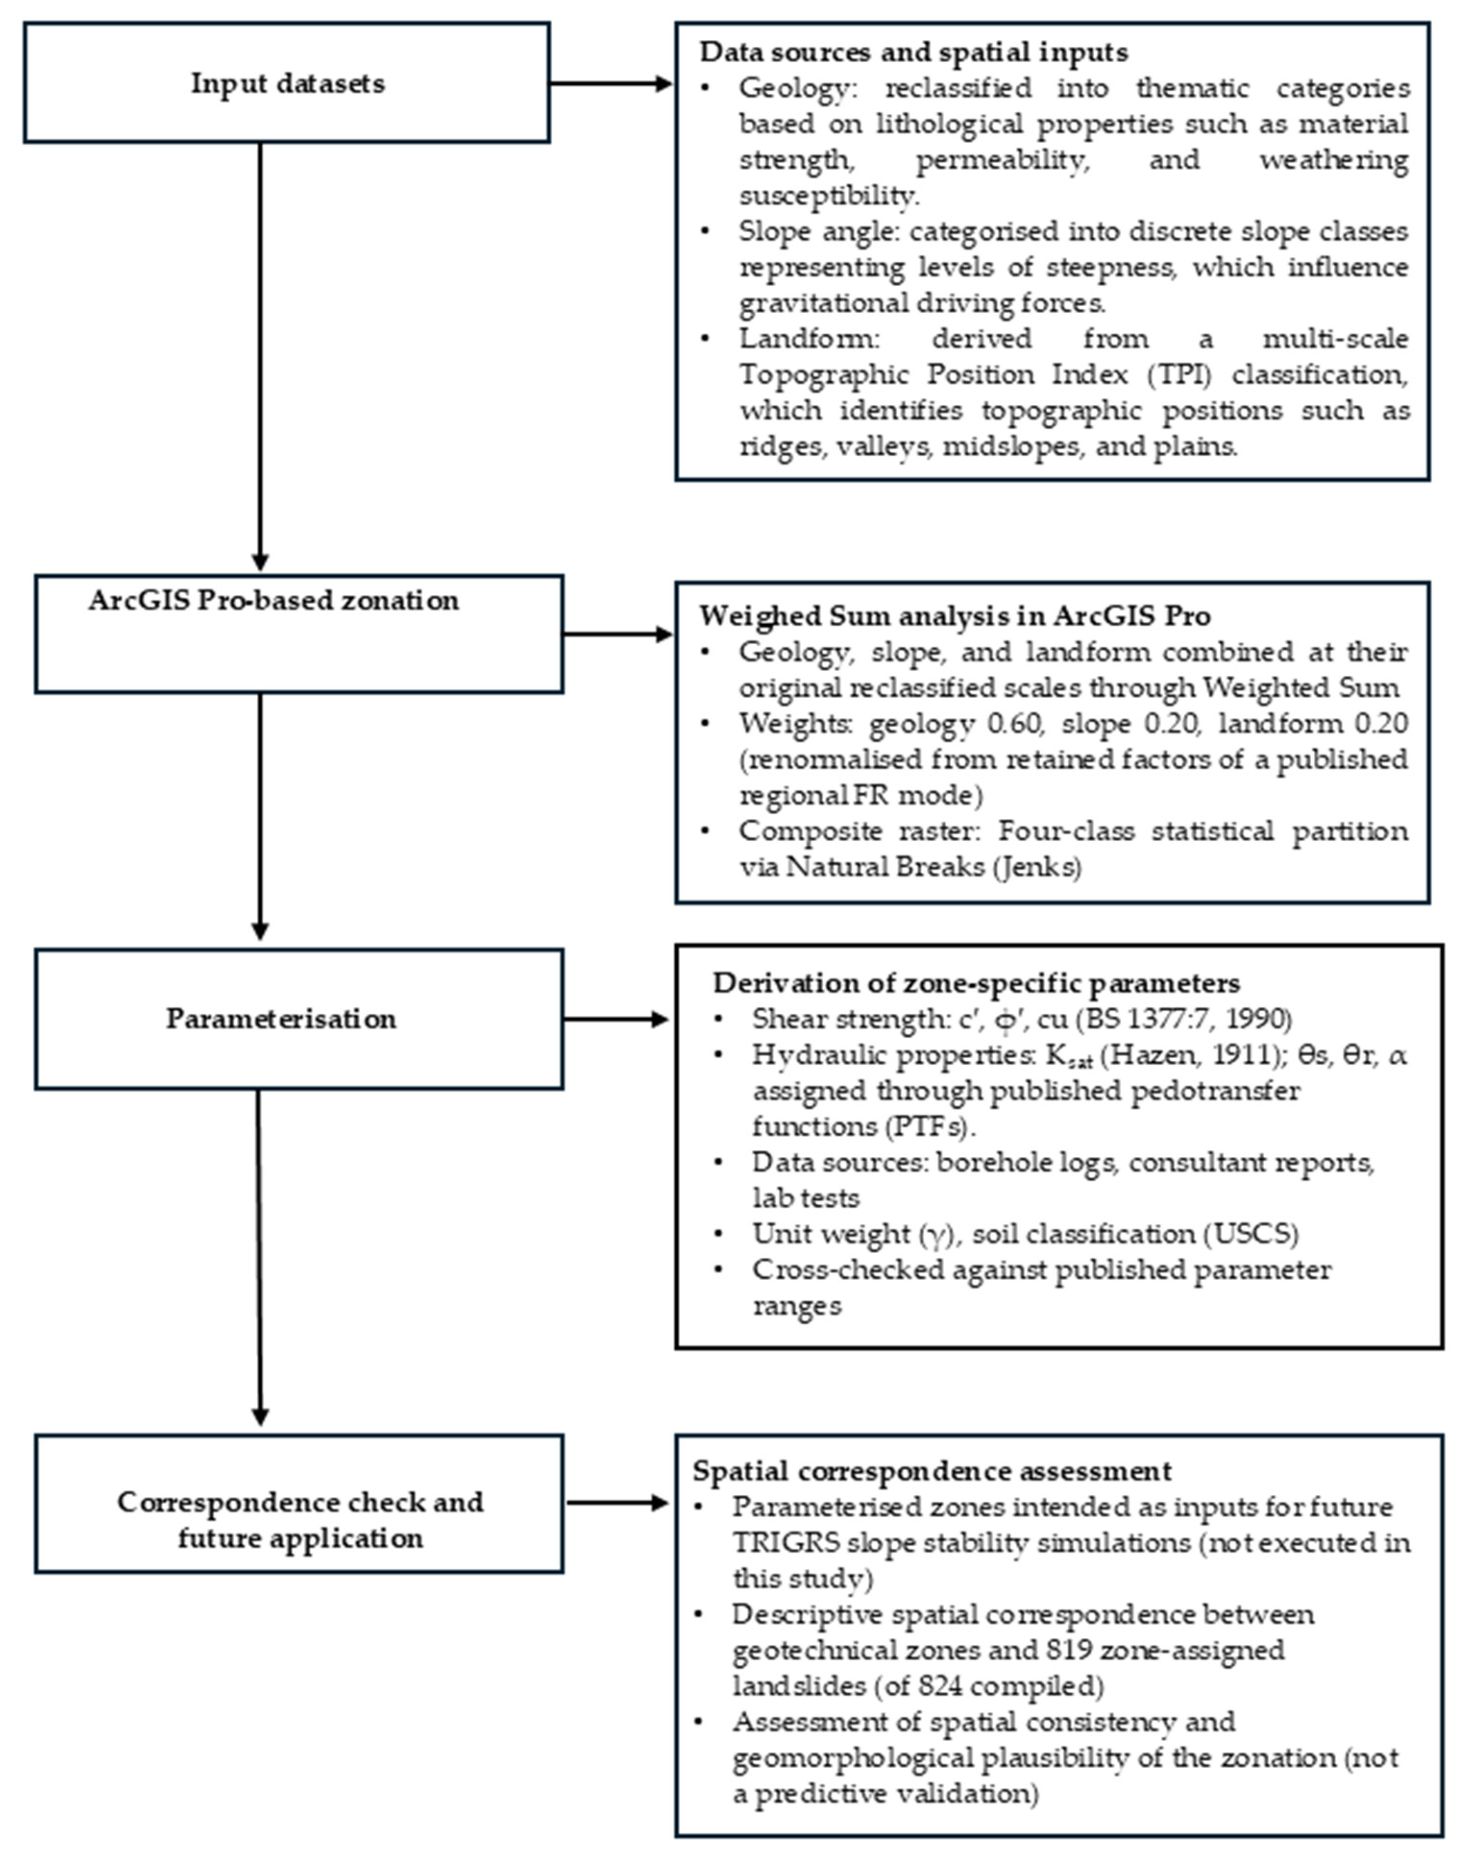
The geotechnical zonation methodology employed is designed to support physically based landslide modelling in the study area. The conceptualisation of the zonation is illustrated in Figure 4, which systematically integrates geological, geomorphological, and geotechnical datasets to delineate terrain units with internally consistent hydrological and geotechnical properties. This approach enables a more reliable parameterisation of surficial materials for slope stability analysis.

3.1. Geotechnical Zonation Approach

This study employed the land-facet concept to delineate engineering-geological mapping units characterised by internally consistent geotechnical and hydrological characteristics [40,41]. This approach aligns with the International Association for Engineering Geology and the Environment (IAEG) [42] guidelines and with the terrain mapping (TMU) methodology described by Meijerik [43] and Soeters and Van Western [44], in which terrain morphology, lithology, and near-surface conditions are integrated to delineate relatively homogeneous terrain units. In this study, the resulting units were interpreted as representative geotechnical–hydrogeological zones for parameterisation of the TRIGRS model in future studies.
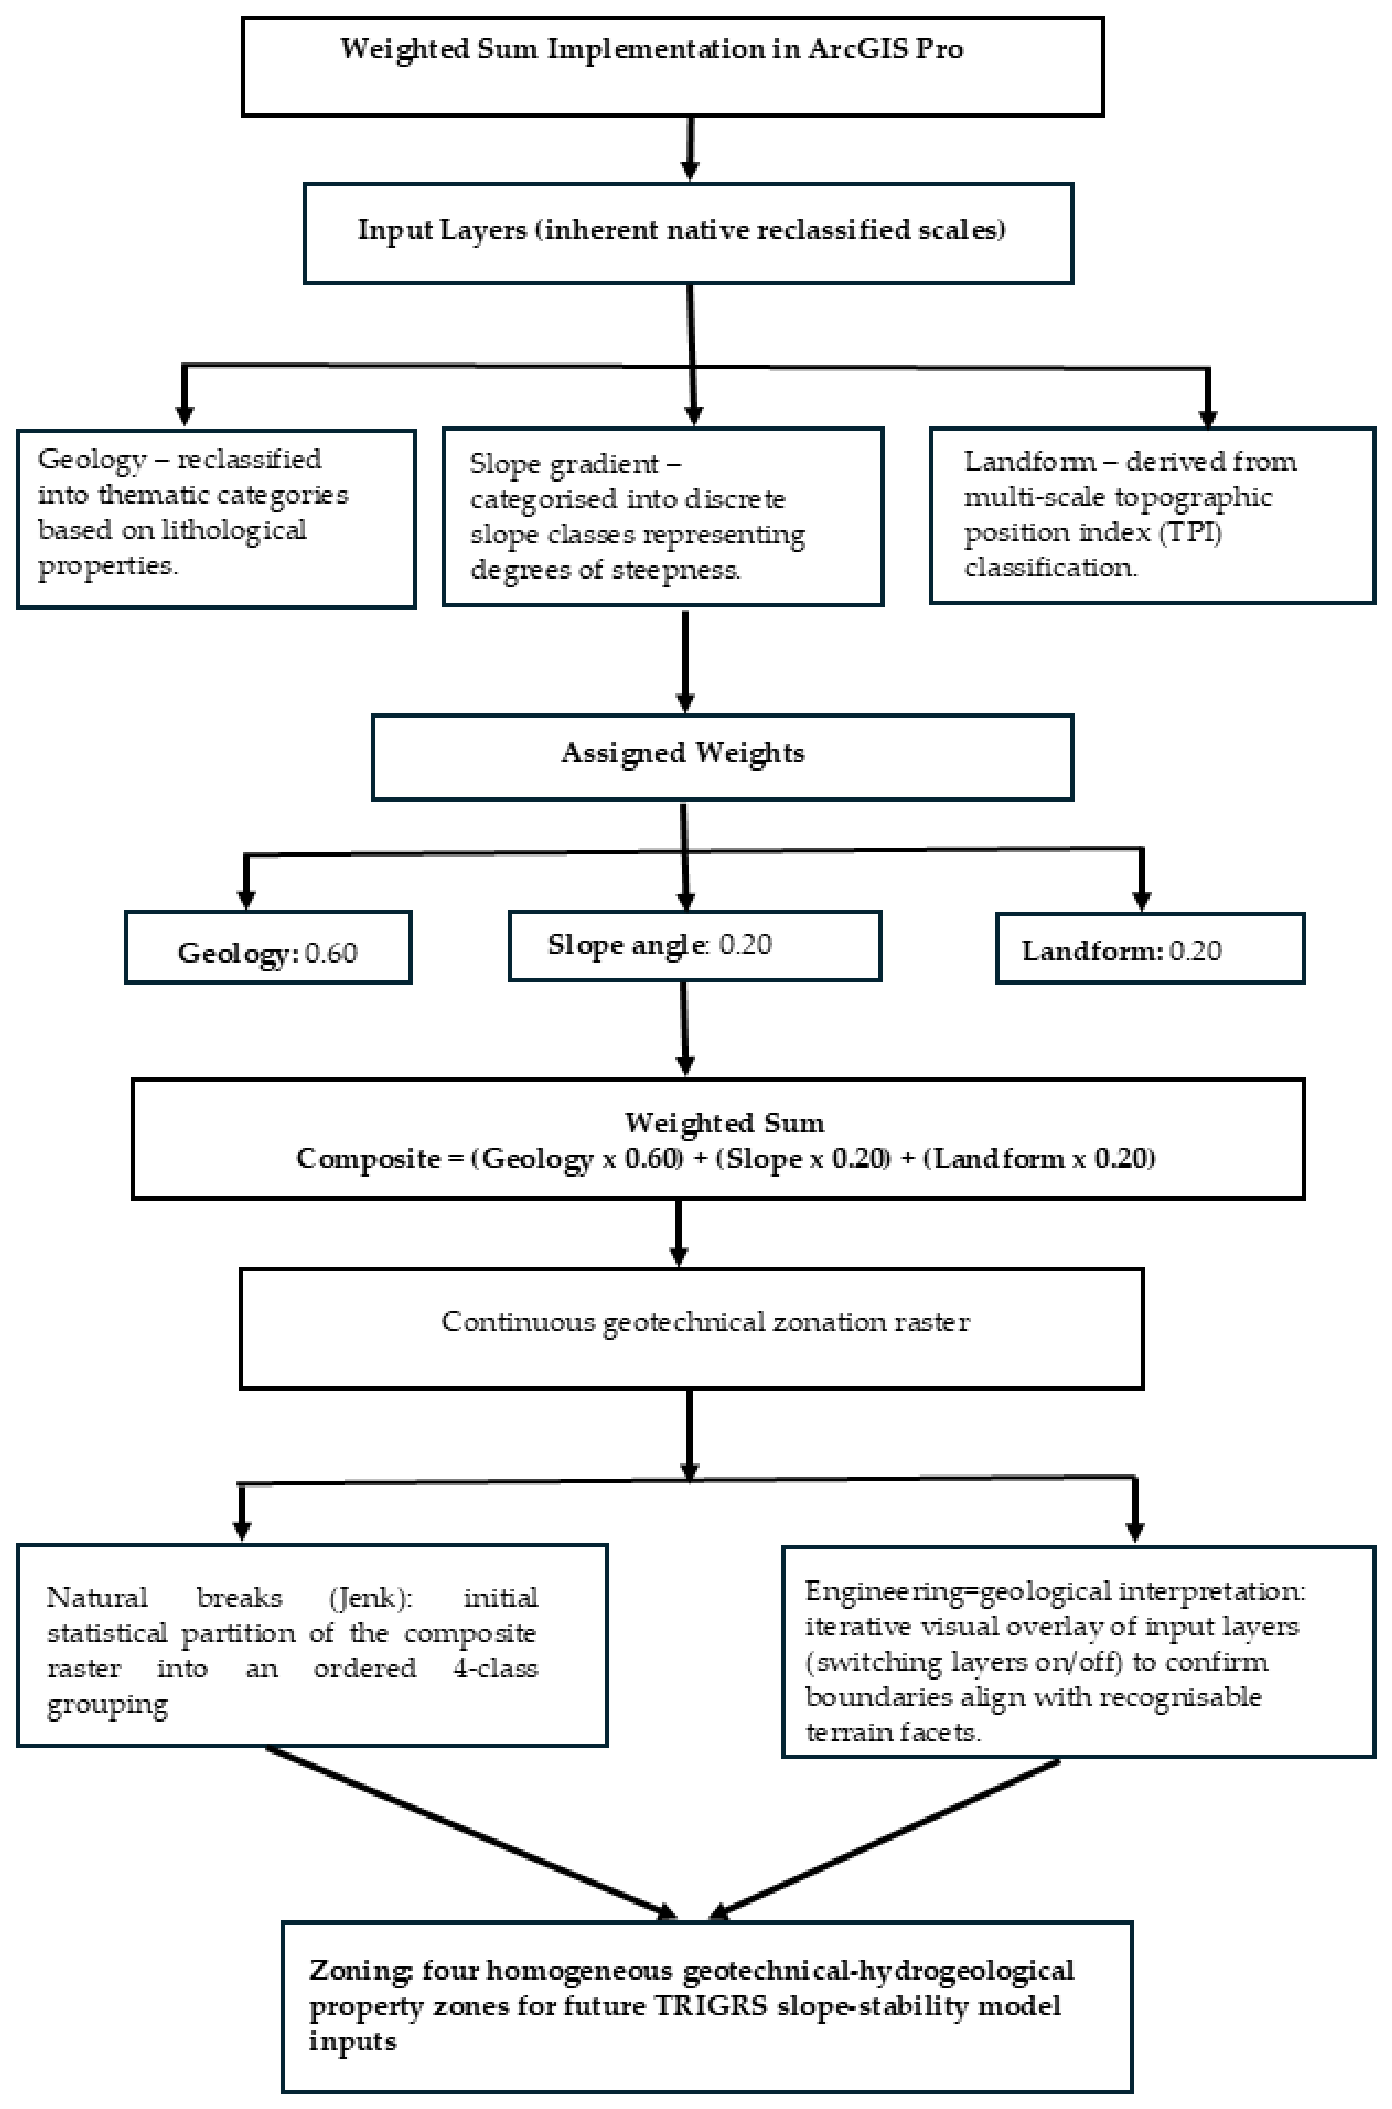
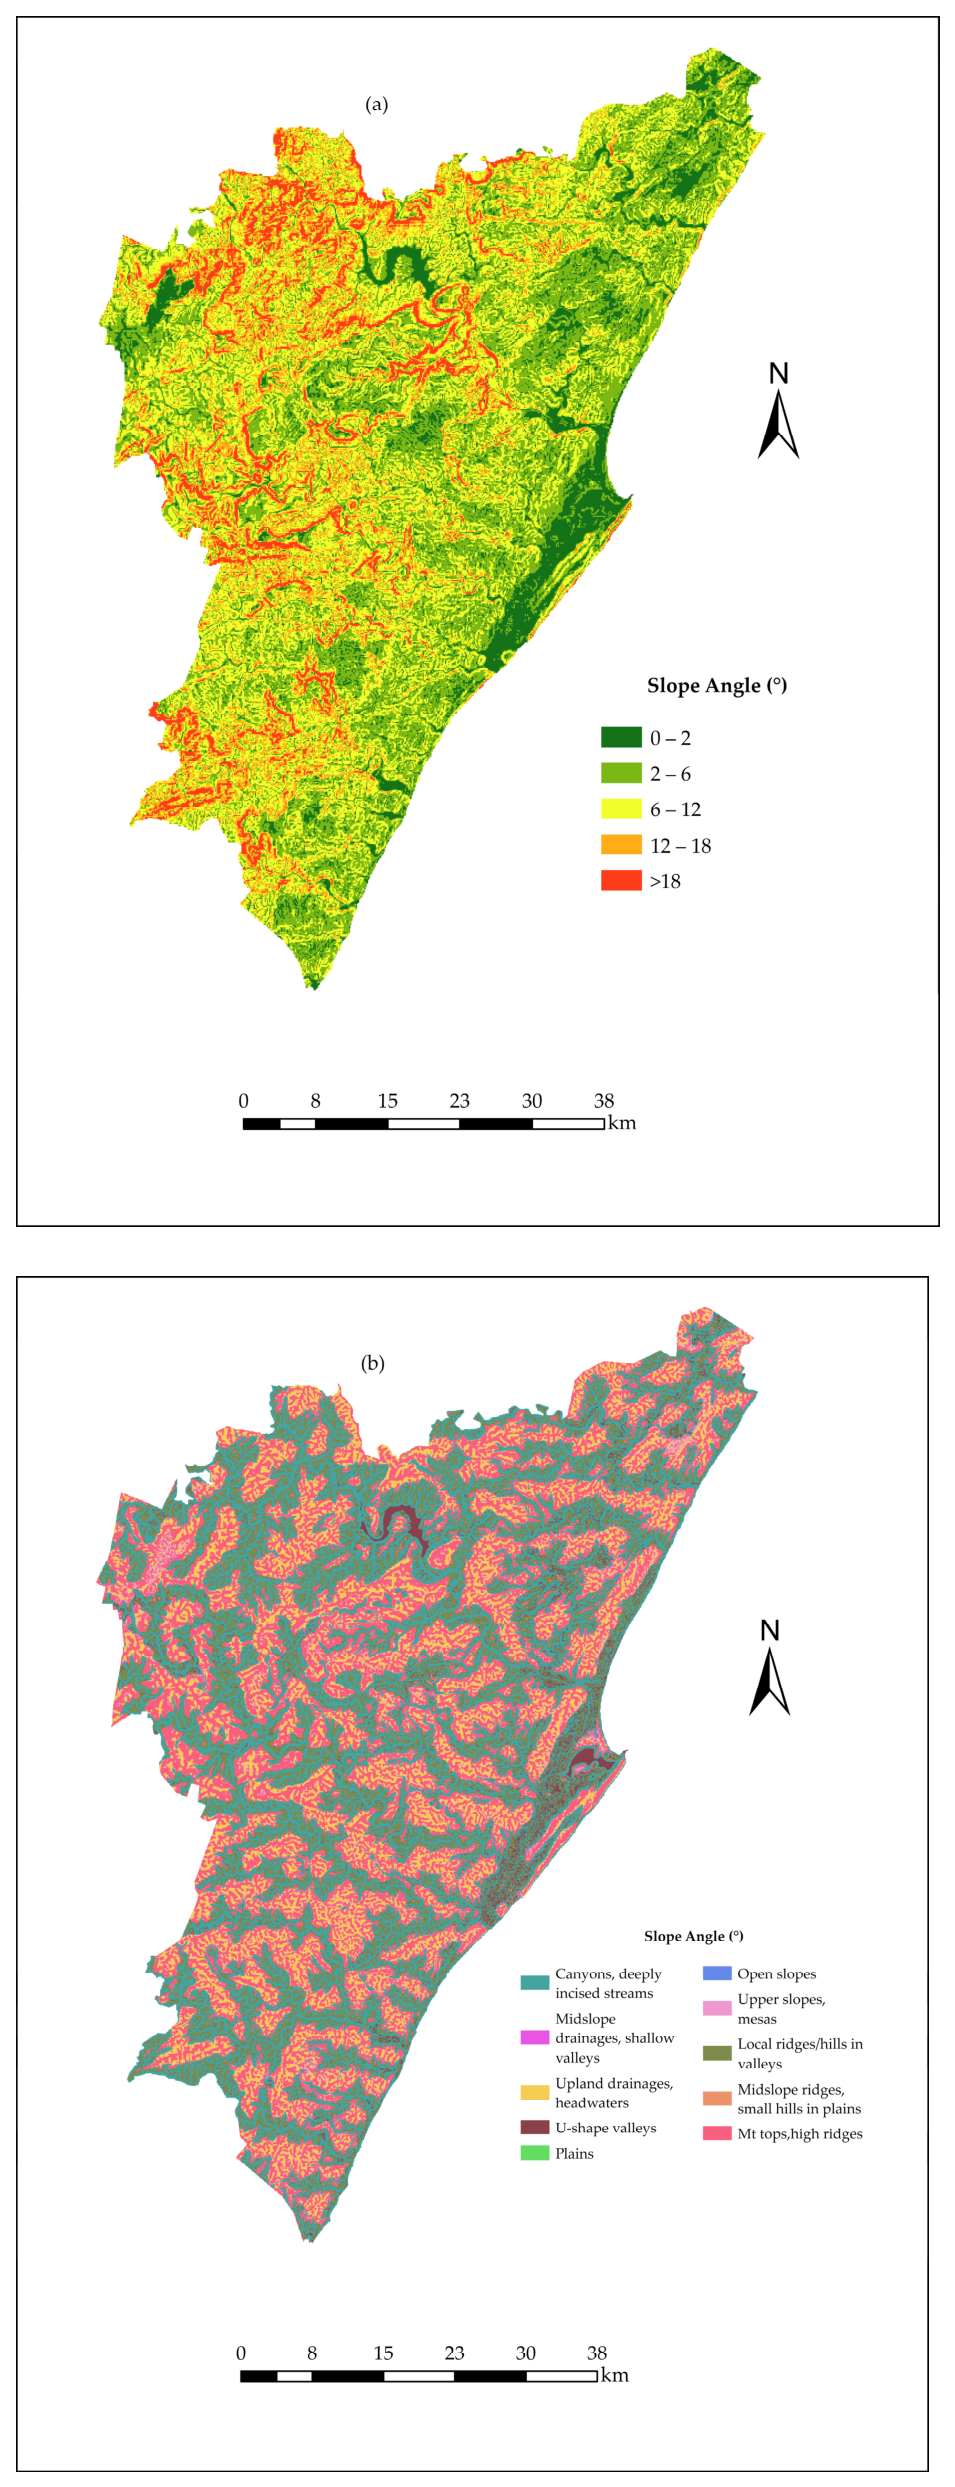
The methodology for delineating these facets was implemented using a weighted sum (map algebra) in ArcGIS Pro (Figure 5). Three primary landslide conditioning factors were integrated: geology (based on Figure 3), assigned a weight of 0.60; slope gradient (based on Figure 6a), assigned a weight of 0.20; and landform (based on Figure 6b), assigned a weight of 0.20. These weights were adapted directly from a previously published regional frequency ratio (FR) susceptibility model for the study area [45] as shown in Equation (1):
LSI = 0.11(SA) + 0.09(E) + 0.09(A) + 0.05(PC) + 0.06(PLC) + 0.06(TWI) + 0.07(DR) + 0.11(LC) + 0.04(DF) + 0.19(L) + 0.14(S)
where SA is slope aspect, E is elevation, A is slope angle, PC is profile curvature, PLC is plan curvature, TWI is the topographic wetness index, DR is distance to roads, LC is land-cover type, DF is distance to faults, L is lithology, and S is soil type.
Several of these variables, including aspects, elevation, land cover, and the distance-based terms, were considered unsuitable for defining geotechnical property zones because they do not directly represent material characteristics required by TRIGRS. Of the remaining factors, only those representing intrinsic material or landform properties were retained. These are lithology and soil (geology), slope angle (slope gradient), and profile and plan curvature (landform). TWI was excluded on the same grounds as the other excluded variables, as it represents a hydrologically derived index rather than an intrinsic morphological or material property. Additionally, TWI is partly derived from slope; its inclusion could have introduced redundancy with the slope-gradient layer. Aspect was excluded because, although it influences insolation, evapotranspiration, and antecedent moisture conditions, it does not directly define the intrinsic geotechnical properties required for TRIGRS parameterisation.
The retained factor weights of lithology = 0.19, soil = 0.14, slope angle = 0.11, profile curvature = 0.05, and plan curvature = 0.06 (subtotal = 0.55) were renormalised to sum to unity according to the following:
Lithology and soil were consolidated into a single geology factor = (0.19 + 0.14)/0.55 = 0.60.
Slope gradient = 0.11/0.55 = 0.20.
Profile curvature and plan curvature were consolidated into a single landform factor = (0.05 + 0.06)/0.55 = 0.20.
This weighting scheme is therefore a direct, fully reproducible arithmetic transformation of the published FR model [45], rather than an independently elicited or expert-adjusted value. No additional expert weighting or post hoc adjustment was applied to the selected factors. The higher weighting assigned to geology reflects its fundamental influence on soil depth, permeability, weathering characteristics, hydraulic conductivity, shear strength, groundwater occurrence, and failure mechanisms. This is consistent with numerous physically based studies, which define property zones directly from geological unit boundaries [46] assigning a single set of geotechnical and hydrological parameters to each mapped lithology.
The present study instead jointly uses geology, slope gradient, and landform to delineate property zones. This does not duplicate TRIGRS’s own use of slope: the slope and landform layers used here are not passed to TRIGRS as the model’s slope angle input, which remains a continuous DEM-derived raster; instead, they are used as covariates for inferring where geotechnical material properties are likely to change within a single geological unit, for example, between convex, well-drained crests and concave, colluvium-accumulating footslopes within the same formation consistent with the terrain mapping unit (TMU) tradition of [43]. Geology-only zonation, as used by [46], offers greater simplicity and direct reproducibility; the multi-factor approach adopted here captures additional within-unit variability, at the cost of greater methodological complexity, which we consider justified given the pronounced weathering-profile variability documented in the study area.
To enable the integration of heterogeneous terrain attributes, all input layers were standardised through raster reclassification, assigning common numerical values to lithostratigraphic units, slope angles, and landform categories. The resulting composite weighted raster was partitioned into four distinct terrain zones using the Natural Breaks (Jenks) algorithm [47]. This method was selected for its ability to identify intrinsic groupings in terrain data by minimising within-group variance and maximising between-group variance [47,48].
The weighted sum served as an aid to terrain interpretation rather than as a fully automated classification procedure. The resulting composite raster was iteratively examined alongside the geology, slope gradient, and landform layers to identify spatially coherent terrain units with similar geotechnical and hydrogeological characteristics. The final delineation of the property zones was based on the recognition of physically meaningful terrain facets and their suitability for parameter assignment within the TRIGRS framework. The renormalised weights governed the relative contribution of each factor to the composite index, whereas the final number and configuration of the property zones were determined through engineering-geological interpretation. The mapped four property zones strike a balance between preserving geotechnical and hydrogeological heterogeneity and retaining sufficient field and laboratory observations within each class to enable robust parameter estimation. The weighted sum was not intended to replace engineering-geological interpretation, but to provide a reproducible and spatially consistent framework for delineating terrain units.
Finally, the spatial consistency and geomorphic interpretation of the delineated zones were qualitatively validated through a visual inspection of high-resolution Google Earth satellite imagery and supplemented by opportunistic field observations. These checks ensured that the statistical groupings aligned with observable terrain characteristics and known landslide occurrences before further parameterisation.

3.2. Determination and Derivation of Geotechnical and Hydrogeological Parameters

Geotechnical and hydrogeological parameters for the delineated property zones were obtained through a multi-source approach integrating direct laboratory testing, borehole data analysis, and empirical correlations.
Descriptive statistics (mean, standard deviation [SD], and coefficient of variation [CoV, %]) were calculated for each geotechnical index and shear strength parameter using standard sample statistics, computed across all available samples for which that parameter was measured. CoV was calculated as SD divided by the mean, expressed as a percentage, and is reported to indicate the relative variability of each parameter independent of its measurement units, following standard practice in geotechnical characterisation [49]. Where samples were classified as non-plastic (N.P.), they were excluded from the corresponding Atterberg-limit statistics but retained for particle-size-based parameters.

3.2.1. Determination of Shear Strength Parameters

Effective shear strength parameters (c′ and ϕ′) were determined through direct shear testing on both remoulded and undisturbed samples, conducted in accordance with BS1377-7 [37]. For units where direct testing was restricted, undrained shear strength (cu) values were derived through correlations with Standard Penetration Test (SPT) N-values sourced from eThekwini Metropolitan regional borehole records, supplemented by established regional values [33,34].

3.2.2. Derivation of Hydraulic Properties

Saturated hydraulic conductivity (Ksat) values were derived from particle size distribution (PSD) data obtained from representative soil samples across the study area. Effective grain diameters (d10) determined from sieve and hydrometer analyses were substituted into Hazen’s empirical relationship equation [50]:
Ksat = C⋅(d10)2
where Ksat is the saturated hydraulic conductivity (cm/s), d10 is the effective grain diameter (cm) corresponding to 10% finer by weight, and C is an empirical coefficient dependent on soil texture and gradation.
For the medium-to-coarse silty sands and sandy colluvial deposits predominantly encountered in the study area, C values of 85–110 were adopted, consistent with the range for medium sands reported by [51].
Figure 4. The conceptual framework illustrates the flow diagram of the methodology, from data acquisition and spatial integration (zonation) to deriving zone-specific and associated landslide inventories against the various geotechnical property zones [37,52].
Geohazards 07 00110 g004
Figure 5. A flowchart illustrating the weighted sum implementation in GIS used to delineate geotechnical land facets; the process integrates geology, slope gradient, and landform layers through reclassification, weighting, and summation to generate spatially consistent zones for intended physically based slope stability modelling.
Geohazards 07 00110 g005
Figure 6. Terrain-conditioning factors used in the geotechnical zonation: (a) slope angle classes (°) across the study area; (b) landform classes representing terrain shape and configuration.
Geohazards 07 00110 g006
It is acknowledged that Hazen’s formula is strictly applicable to uniformly graded, loose sands with Cu (Cu, defined as D60/D10) < 5; 0.1 < d10 < 3.0 mm [49]. Subsequent discussions by [52] emphasised that the relationship should be applied cautiously outside these grading limits. Hence, for the fine-grained samples in this study, including residual clays, silty clays, and weathered shale-derived soils in Zones 1 and 2, the d10 falls below the hydrometer detection limit. For these materials, Ksat was assigned from published hydraulic conductivity ranges for comparable Unified Soil Classification System (USCS) soil descriptions [53,54]. Where Hazen estimates were obtained for coarser materials, the results are treated as order-of-magnitude approximations given the heterogeneous gradation of the colluvial soils. All derived values were cross-checked against published ranges to confirm consistency with the geotechnical character of each zone.
Index properties, including Atterberg limits and particle size distribution (PSD), were determined in accordance with [38,39] to support soil classification and interpret drainage behaviour.

3.2.3. Derivation of Parameters for Physical-Based Infiltration Modelling

This section derives, rather than simulates, the parameters required to represent unsaturated infiltration in each geotechnical zone. Four parameters, residual volumetric water content (θr), saturated volumetric water content (θs), the fitting parameter (α), and saturated hydraulic conductivity (Ksat), were estimated from laboratory and literature data for later use in physically based infiltration models such as TRIGRS; no infiltration simulation is performed in the present study. These variables are employed to approximate the soil-water characteristic curve for the wetting of unsaturated soil [55]. Saturated volumetric water content (θs) was assigned from measured or literature-derived porosity values for each dominant USCS soil group. Residual water content (θr) and the van Genuchten shape parameter α were estimated using published pedotransfer functions (PTFs); specifically, the values of [56] mapped each dominant USCS soil group to its closest equivalent USDA textural class on the basis of grain-size distribution. This approach is consistent with the assignment of Ksat values and introduces additional parameter uncertainty compared with directly measured shear strength and index parameters. Furthermore, the approach approximates the infiltration process as one-dimensional, vertical flow [57,58], providing a computationally efficient basis for calculating the transient pore pressure response across the regional terrain units. This linkage is intended to allow the delineated geotechnical zones to function as inputs to a physically based landslide hazard assessment.

3.3. Landslide Data and Validation of Geotechnical Zones

An inventory of 824 landslides was compiled from the landslide and other geohazard database of the eThekwini Metropolitan Municipality [45], supplemented by historical records from the academic literature, including [12,30,33,34], technical reports [29,45] and government documents to enhance temporal and spatial coverage. Data harmonisation included standardising spatial references and attributes. Validation combined field verification at representative sites using handheld GPS (±5 m accuracy) with interpretation of Maxar VHR satellite imagery (0.3–0.5 m) through Google Earth Pro to confirm spatial accuracy and timing of certain events where possible.
The regional FR model [45]. The initial factor weights from which the initial factor weights were derived were calibrated and tested using a random 80/20 split of a 1484-event parent inventory. The 824-event subset used here was selected from the same parent inventory on different criteria (field-verification status and reporting significance, rather than random sampling).
A raster-based extraction procedure was performed in ArcGIS Pro to examine the spatial correspondence between the landslide inventory and the delineated geotechnical–hydrogeological zones. The Extract Values to Points tool was used to assign the geotechnical–hydrogeological zone value of the underlying raster cell to each inventoried landslide location, after which a frequency analysis was conducted to quantify the number and density of landslides within each geotechnical–hydrogeological zone. This approach avoided the need for raster-to-polygon conversion and ensured consistency with the raster-based framework used for TRIGRS parameterisation.
Of the 824 inventoried landslides, 819 were successfully assigned to one of the four zones; five occurrences fell within cells containing NoData values and were excluded from the frequency analysis.

4. Results

4.1. Geotechnical Property Zone Characterisation

Accurate parameterisation of physically based landslide modelling requires stratifying and delineating the study area into geotechnically and geomorphologically homogeneous zones. The delineated property zones, their geotechnical and hydrogeological characteristics, and their correlation with historical landslide patterns are described.
The weighted sum of lithology, slope gradient, and landform (profile and plan curvature) delineated four distinct geotechnical property zones across the eThekwini Metropolitan Region. These zones compartmentalise the study area into spatially distinct terrain–material assemblages suitable for slope stability analysis and modelling (Table 1).
The zones generally align with two established geomorphic provinces, i.e., the Eastern Coastal Plain and the Eastern Escarpment Foothills [27]. The coastal plain consists mainly of alluvium, dune sands, and beach deposits, making it vulnerable to shallow slope failures. The escarpment foothills, however, feature deeply dissected topography developed on weathered sandstones, shales, and dolerite intrusions, creating diverse material profiles. Zones 2 and 3 cut across both geomorphic provinces, which accounts for their mixed lithological and hydrological conditions. Zones 1 and 4 are more localised. Zone 4 typically represents stable, well-drained terrain, although all zones could experience deep-seated slope failures if saturation occurs during prolonged, intense rainfall.

4.2. Geotechnical Properties

Laboratory and field investigations confirmed geotechnical heterogeneity across the study area, supporting the need for zone-specific parameterisation. Property Zones 1 and 2 are primarily characterised by high-plasticity clays and silts exhibiting low permeability and high moisture sensitivity. In contrast, Zone 3 consists of weakly cohesive, erodible sandy soils, while Zone 4 comprises well-graded, free-draining sands.
Index properties across the 18 laboratory samples collected are summarised in Table 2.
Direct shear test results for the 10 representative samples tested are summarised in Table 3.
The undrained shear strength ( c u ) varies significantly by lithology and moisture state. In the sandy colluvium of Zone 3, cu values typically range from 15 to 30 kPa. In the surficial residual materials of Zone 1, these values are notably higher, ranging between 30 and 60 kPa (consistent with [35]). Notably, as shown in Table 3, the coefficient of variation for cohesion (65%) is substantially higher than that for the friction angle (10.5%), consistent with cohesion, rather than friction angle, being the primary parameter distinguishing zone-level slope stability behaviour.

4.3. Hydrogeological Properties

A summary of the saturated hydraulic conductivity (Ksat) for each property zone is presented in Table 1. The laboratory-derived and literature-based hydraulic conductivity values confirm systematic variation in permeability across the delineated geotechnical property zones.
Zone 1 is characterised by dense, high-plasticity clays and silts (MH, CH) derived from dolerite and granitic parent materials. These fine-grained residual matrices exhibit very low saturated hydraulic conductivity (Ksat = 10−9–10−8 m/s), which severely limits rapid infiltration and prevents the rapid build-up of destabilising pore water pressures, consistent with the low landslide frequency observed in this zone.
Zone 2 comprises silty and clayey sands together with low-plasticity clays (SP-SM, SM, SC, CL) associated with weathered shale and sandstone sequences. Most fine-grained Zone 2 samples yielded d10 values below Hazen’s applicable range; however, Ksat values of 10−6–10−5 m/s reflect the moderate drainage capacity of the mixed sandy and argillaceous matrix, consistent with published ranges for weathered shale residuals [53].
Zone 3 is characterised by heterogeneous colluvial and residual sandstone materials (ML, MH, CL, SM, SP-SM), spanning nearly three orders of magnitude in permeability (10−8–10−5 m/s). This wide permeability envelope is a critical characteristic, as coarser sandy layers facilitate rapid infiltration, while interbedded fine-grained horizons impede drainage and promote localised pore pressure accumulation, the primary driver of the shallow translational failures and debris flows documented in this zone.
Zone 4 comprises well-graded sands and coarse, loosely packed colluvial mantles (SP, SW) with high permeability (10−4–10−3 m/s). This high permeability prevents pore pressure accumulation under most rainfall intensities, resulting in low susceptibility to rainfall-induced slope instability.
These results indicate the progressive increase in permeability from the fine-grained residual soils of Zone 1 to the coarse-grained colluvial deposits of Zone 4. These hydraulic conductivity contrasts govern the pore pressure response and failure mechanisms under rainfall loading.

4.4. Landslide Correlation

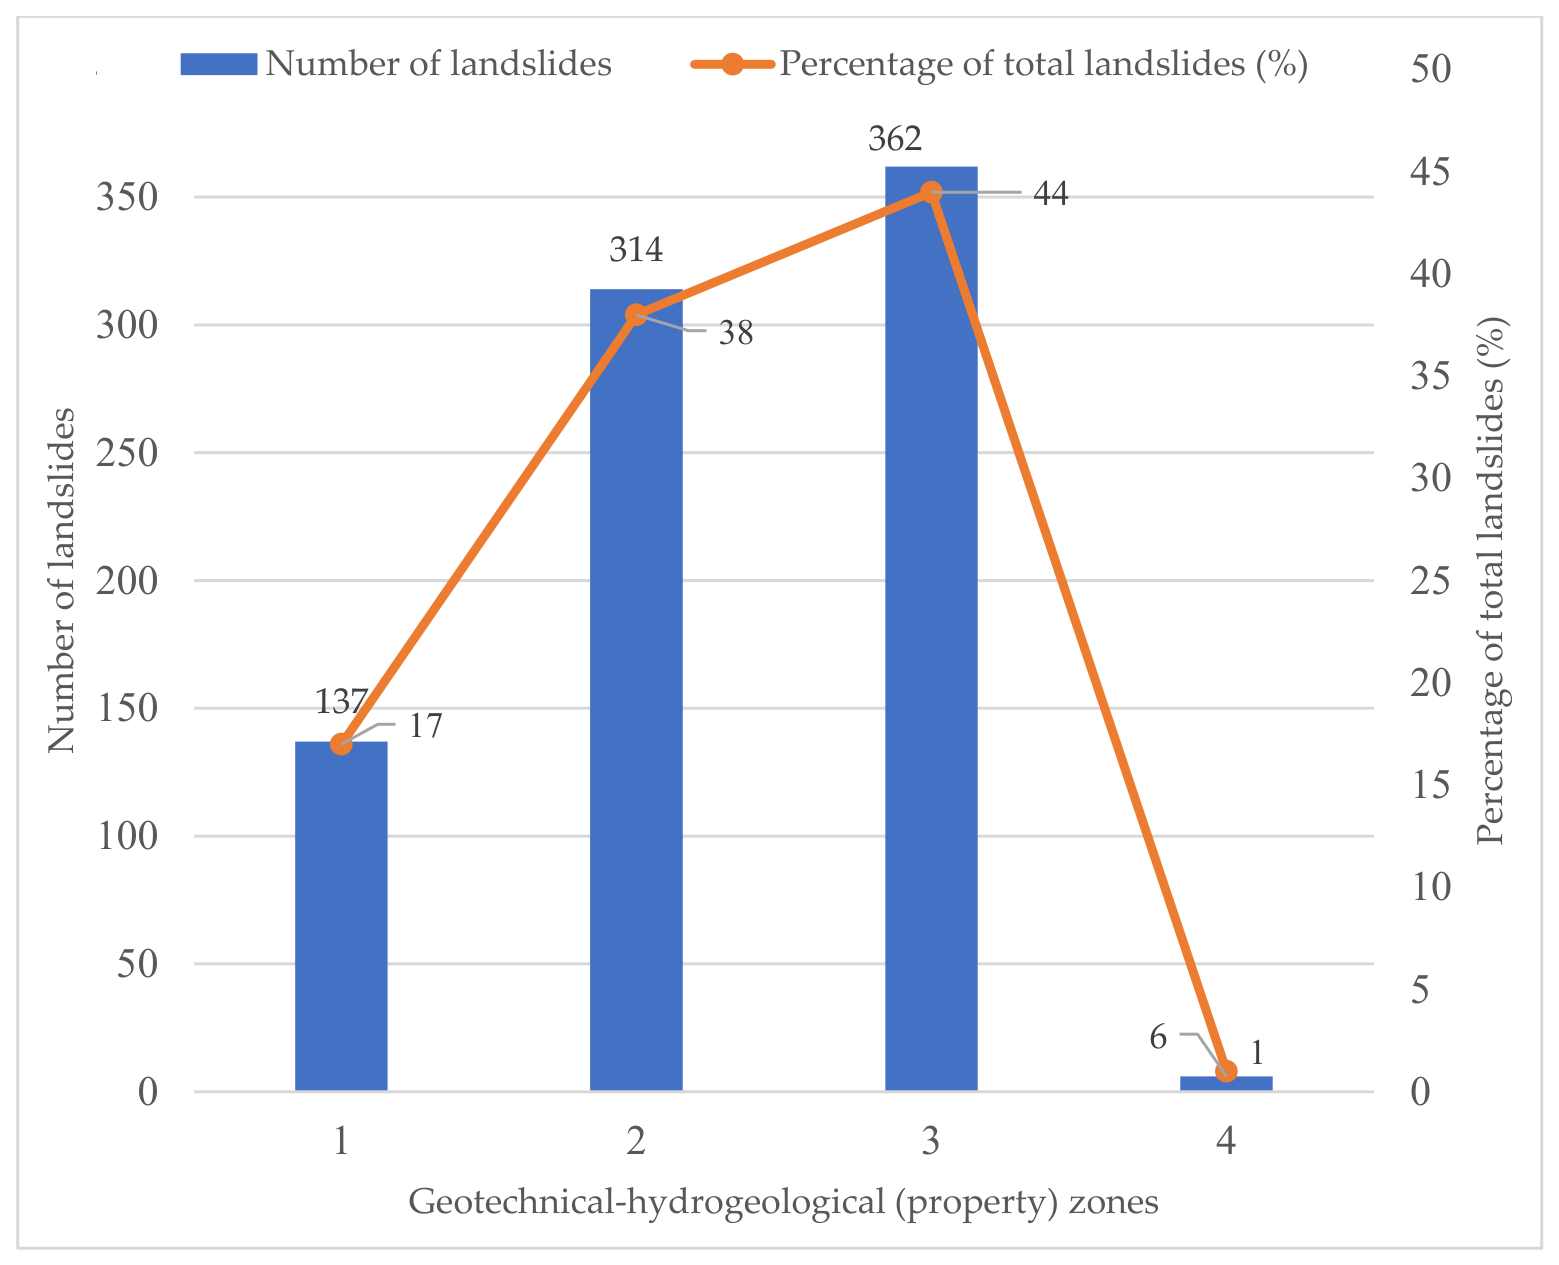
The distribution of landslides (Table 4, Figure 7) in the study area is strongly correlated with the geotechnical–hydrogeological zonation (Table 1 and Figure 8). Of the 819 landslides overlaid on the property zones, 82.5% occur in Zones 2 and 3. It is important to note that Zone 2 consists of residual shales with sandy colluvium, while Zone 3 contains sandstone-derived colluvium and residual sandstone. In stark contrast, the more competent materials of Zone 1 (residual dolerite and diamictite/tillite; cohesive, fine-grained soils) and Zone 4 (well-graded sandy soils from granite and saprolite) are far more stable, accounting for only 17% and 1% of observed landslide events, respectively. This distinct spatially observed landslide pattern is consistent with the zonation framework and supports the interpretation that the geomechanical properties of shale and colluvium are important drivers of rainfall-induced instability in the region. This spatial correlation between observed landslides and the geotechnical property zones is a descriptive plausibility check rather than an independent statistical validation.

4.5. Summary Geotechnical–Hydrogeological Zonation for Physically Based Landslide Modelling

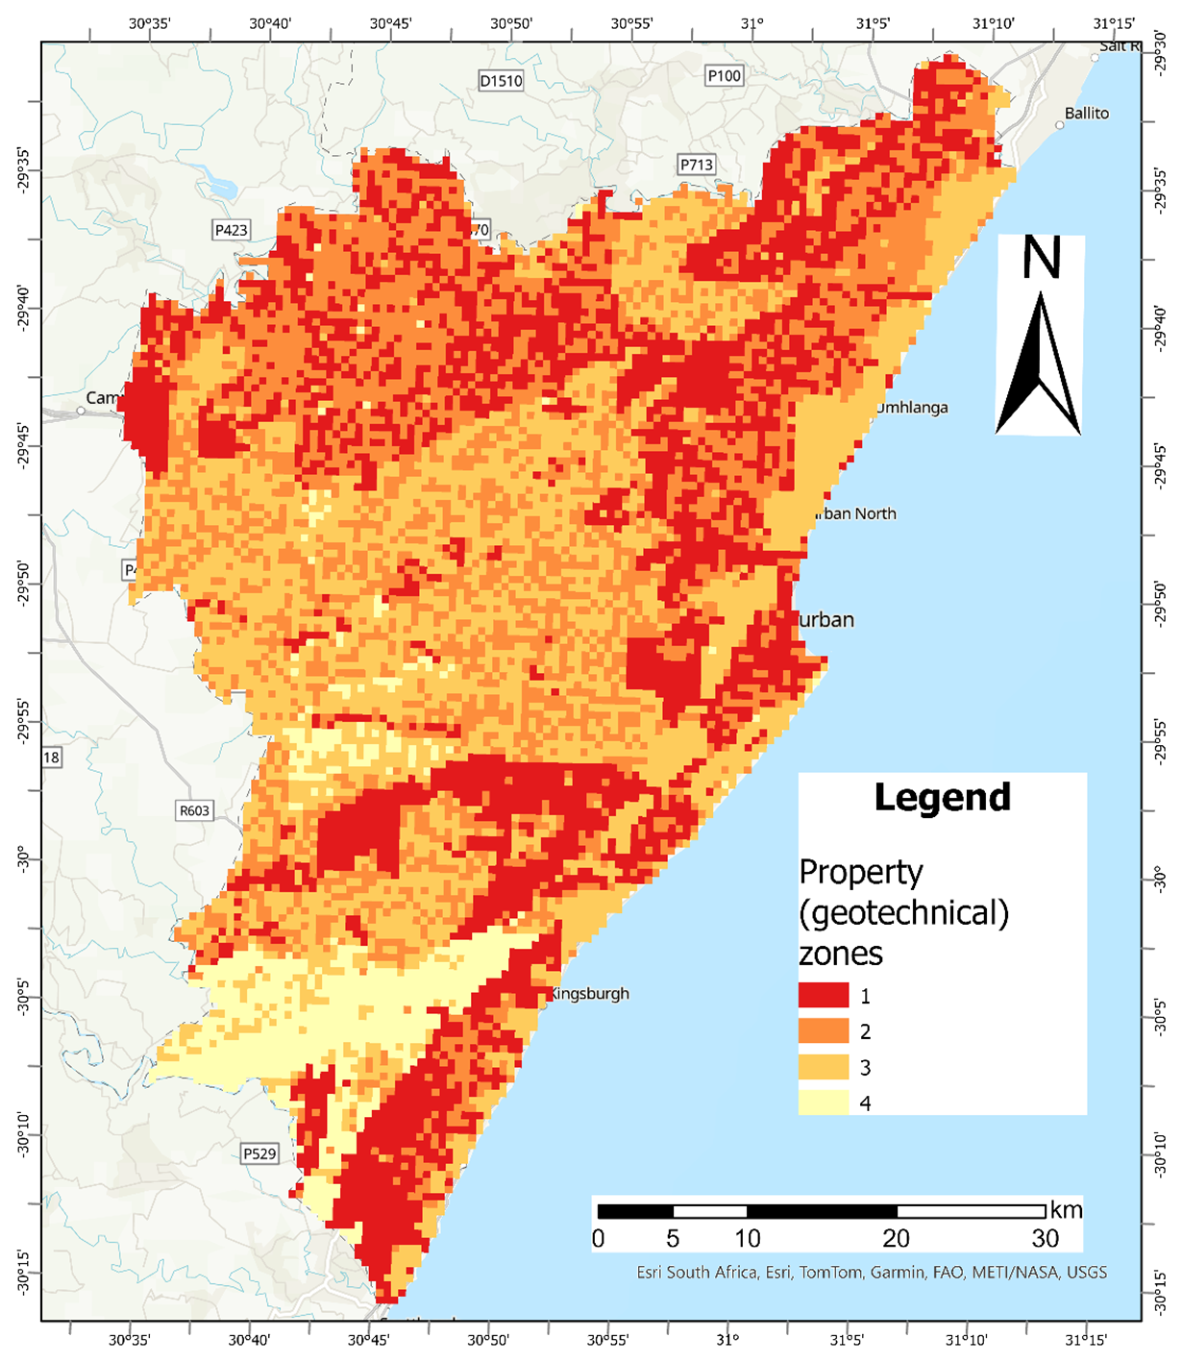
A geotechnical zonation framework was developed to support physically based landslide modelling across the eThekwini Metropolitan Region. This zonation systematically integrates geological, geomorphological, and geotechnical datasets. It delineates spatial zones with internally consistent properties, providing a quantitative basis for assessing slope stability and rainfall-induced landslide susceptibility. The spatial distribution of the four principal geotechnical zones across the eThekwini Metropolitan Region is illustrated in Figure 8.
The four main geotechnical–hydrogeological property zones are defined by distinct lithological, topographic, and hydromechanical characteristics that govern their responses to rainfall infiltration and their susceptibility to slope failure. The geotechnical characteristics of these property zones are summarised as follows and will be key to future TRIGRS applications:
Zone 1 (residual dolerite/diamictite–tillite) is characterised by steep, dissected ridges and upper slopes of the escarpment foothills. Representative average geotechnical parameters are: c′ = 10 kPa, ϕ′ = 30°, Ksat = 5.0 × 10⁻⁹ m/s, and θs = 0.50. These values indicate low-permeability, well-drained residual terrain.
Zone 2 (residual shales/alluvium) is located in mid-slopes and valley bottoms, spanning the transitional terrain between the coastal plain and escarpment foothills. Representative average geotechnical parameters values are: c′ = 5 kPa, ϕ′ = 27.5°, Ksat = 5.0 × 10⁻⁶ m/s, and θs = 0.45.
Zone 3 (colluvium/sandstone) occurs in lower slopes that are gentle inclines overlying the Natal Group sandstones. Representative average geotechnical parameters values are: c′ = 5 kPa, ϕ′ = 30.0°, Ksat = 1.0 × 10⁻⁶ m/s, and θs = 0.43.
Zone 4 (sandy granite residuals) is located on elevated plateaus and crests in the western highlands of the study area. Representative geotechnical parameter values for this zone are: c′ = 15 kPa, ϕ′ = 35.0°, Ksat = 5.0 × 10⁻⁴ m/s, and θs = 0.40.

5. Discussion

The delineation of the geotechnical–hydrogeological zones provided a physically meaningful parameterisation framework for assessing landslide susceptibility in the eThekwini Metropolitan Region. The delineation of these zones will support future physically based modelling, including the application of TRIGRS. Integrating geomorphological, geotechnical, and hydrogeological data into a unified zonation system is a novel contribution toward the eventual development of a physically based landslide early-warning system for the region. The integration is built on a weighted sum of lithology (which governs base material strength and soil type), slope angle (which controls shear stress), and landform (a proxy for topographic influence on subsurface flow and accumulation). This combined approach provides spatially explicit parameter sets suitable for physically based models. The correspondence between these geotechnical–hydrogeological zones and the historical inventory of 819 landslides supports the geomorphological plausibility of the approach.

5.1. Relation of the Delineated Geotechnical Zones with Landslide Occurrences

The correspondence between the historical landslide inventory and the delineated property zones (Table 4, Figure 7 and Figure 8) supports the efficacy of slope-unit-based modelling in this region. While geotechnical properties depend on the underlying geology, the property zones provide geotechnically and geohydrologically meaningful boundaries by integrating geological control (lithology) with topographic control (slope and landform), which together govern stress states and hydrological boundary conditions (e.g., drainage and saturation). This is significant because the geotechnical characteristics embedded within each zone, specifically lithology, permeability, and shear strength, represent the persistent site conditions under which past failures occurred. Consequently, zones that have experienced failure in the past are likely to remain susceptible under similar triggering conditions in the future, a principle of uniformitarianism well established in landslide susceptibility assessment [21,59,60].
Zones 2 and 3 collectively account for 82.5% of the documented landslide occurrences in the area, consistent with their higher susceptibility due to a combination of unfavourable soils, hydrogeology and topography.
Zone 3 is the most failure-prone (44% of landslides) and is dominated by sandy colluvium and residual sandstone. These soils exhibit heterogeneous textures (ML to SP-SM) and moderate shear strength (ϕ′ = 25–35°), placing their strength near the regional average but rendering them susceptible to failure when pore pressure increases. Although the overall permeability range is relatively high (Ksat = 10−8–10−5 m/s), the Zone 3 profile is internally heterogeneous, comprising permeable sandy horizons interbedded with low-permeability clay-rich layers inherited from the Natal Group stratigraphy. During intense rainfall, water readily infiltrates through the sandy matrix but is impeded by these less permeable, clay-rich interlayers, generating perched water tables and localised transient pore pressure build-up. This permeability contrast, rather than the bulk permeability alone, is the primary driver of instability, triggering shallow translational slides and debris flows consistent with documented “running sand” behaviour in this formation and in similar colluvial soils overlying Natal Group sandstones in the greater Durban region [33].
Zone 2 contributed nearly 38% of the observed landslides, comprising a mixture of cohesionless sands (SP-SM) and low-permeability shales (CL). Instability here is driven by the lowest effective cohesion (c′ = 5 kPa) and moderate friction angles (ϕ′ = 27.5°). The hydraulic conductivity is lower than in Zone 3 (Ks = 10−6–10−5 m/s), and poor drainage facilitates gradual pore pressure build-up during prolonged rainfall. Structural weaknesses along bedding planes and joint systems and relict clay-rich horizons exacerbate instability, leading to slower, progressive failures rather than rapid ones seen in Zone 3 [34,60]. This behaviour has been similarly documented in residual shales of the Pietermaritzburg Formation in the greater Durban area [34].
Zone 1 (17% of landslides) consists of fine-grained residual dolerite and granite soils (MH, CH). It possesses double the average cohesion (c′ = 10 kPa) of the vulnerable zones with very low permeability (Ks = 10−9–10−8 m/s), which limits rapid saturation. While limited infiltration reduces the potential for rapid failure, steep slopes combined with thick weathered profiles can still promote gradual pore pressure accumulation and delayed slope failures [58].
Zone 4, comprising well-drained granite-derived sands (SP, SW) on elevated plateaus and crests, recorded the fewest landslides (1%). Its high permeability (Ks = 10−4–10−3 m/s) promotes rapid pore pressure dissipation, and the combination of gentle-to-moderate plateau topography with the highest average shear strength parameters among the four zones (c′ = 15 kPa, ϕ′ = 35°). This zone corresponds to the lowest overall observed susceptibility.
The distribution of landslides strongly aligns with the geotechnical characteristics of each zone. Intermediate to high permeability combined with restricted drainage capacity (Zones 2 and 3) yields the greatest instability, while efficient drainage or inherently strong soils (Zones 1 and 4) correspond with lower observed failure frequency. These observations support the utility of geotechnical–hydrogeological zonation in differentiating slope-failure potential. Furthermore, the failure mechanisms in these zones align with established hydromechanical theory: rainfall infiltration and transient pore pressure rise reduce effective stress and shear strength, initiating slope failure [61,62,63].
These failure mechanisms find direct parallels in comparable subtropical and monsoon-affected settings worldwide, reinforcing the mechanistic validity of the geotechnical–hydrogeological zonation developed here. The shallow translational slides and debris flows documented in Zones 2 and 3, driven by transient pore pressure rise in low-cohesion sandy and colluvial soils, align with rainfall-induced failures reported in the steep granitic escarpments of Serra do Mar, Brazil, where previous modelling [64] demonstrated that the TRIGRS modelling approach accurately captures the hydromechanical trigger. Similarly, the role of intense monsoon rainfall in generating rapid increases in pore pressure and initiating shallow failures is well established in the Nepal Himalaya [65], where analogous permeability–drainage dynamics govern slope behaviour. While the structurally controlled rockslide mechanisms documented in the Philippines [66] differ in scale and lithology from the soil-dominated failures in eThekwini, both settings confirm that pore pressure exceedance is the ultimate trigger. Collectively, these comparisons indicate that the framework applied here captures hydrogeological processes of broad relevance across tropical and subtropical geoclimatic environments, though direct, physically based simulation will be required to quantitatively test these mechanistic hypotheses for the study area.

5.2. Implications for Hazard Assessment and Land-Use Management

The findings of this investigation have direct application for improving disaster risk reduction and enhancing municipal planning within the eThekwini Metropolitan Region and for similar regions elsewhere.
Land-use policy: The geotechnical–hydrogeological zonation provides a scientifically defensible, qualitative and quantitative tool for municipal planners. For instance, Zones 2 and 3 of the classification of this study, which accounted for over 82% of previously documented landslides, should be immediately subjected to stricter development controls. These controls include mandatory, detailed geotechnical investigations prior to construction, restrictions on slope modifications, and the implementation of enhanced surface- and subsurface-stormwater management systems to mitigate infiltration.
Physically based modelling: This proposed and applied geotechnical–hydrogeological zoning significantly enhances the reliability of advanced physically based models, such as TRIGRS and Scoops3D, by supplying zone-specific, field-validated parameters (e.g., Ksat, c′, ϕ′). This reduces reliance on uniform or assumed parameter values, thereby improving the accuracy of spatially explicit rainfall-triggered landslide forecasting and establishing the quantitative foundation for an operational early-warning system.
Resilient infrastructure: The geotechnical–hydrogeological zonation approach facilitates the design of more resilient infrastructure, ensuring that deep drainage systems, slope stabilisation measures, and retaining structures are appropriate for the specific geotechnical and hydrogeological conditions of the terrain.
Combining future physically based models, such as TRIGRS and Scoops3D, that will be developed using the geotechnical–hydrogeological zones reported in this study, along with real-time rainfall forecasts from meteorological services (including the South African Weather Service, SAWS), could enable dynamic hazard maps. These maps could be updated as weather conditions evolve, following approaches successfully implemented elsewhere [67]. Such systems would allow municipal authorities to issue timely evacuation alerts, plan efficient road closures, and safeguard critical infrastructure. The zonation and parameterisation framework presented in this study is intended as the foundation for future work on physically based simulation of landslide susceptibility, which is not undertaken here.

5.3. Future Research

Future research should focus on transitioning the proposed geotechnical zoning approach towards quantitative, physically based predictive modelling. These include:
Physically based model simulation: Apply the zone-specific parameter sets derived in this study within TRIGRS (or an equivalent physically based model) under representative and design-storm rainfall scenarios to generate quantitative, spatially explicit hazard maps.
Independent validation: Evaluate the resulting susceptibility or hazard outputs against a temporally or spatially independent landslide inventory, distinct from the FR training data and the 824-event inventory used in this study.
Hydraulic parameter refinement: Conduct in situ diffusivity and infiltration testing at representative locations throughout the study area to validate and refine the hydraulic and soil-water retention parameter sets (θs, θr, α) currently assigned via PTFs.
Sensitivity testing of zonation choices: Compare the current multi-factor (geology–slope–landform) zonation against a geology-only zonation of the kind used by Marin et al. (2020) [46], and test the sensitivity of zone boundaries and derived parameter contrasts to the chosen number of zones and to the categorical exclusion of aspect, elevation, land cover, TWI, and distance-based FR terms from the weighting.
Dynamic factor integration: Incorporate dynamic factors (such as land-use change, infrastructure modification, and vegetation cover) into the slope stability forecasting framework to account for evolving surface conditions and their impact on runoff and infiltration.
Such dedicated efforts will further improve the precision and predictive power of physically based hazard models in the eThekwini Metropolitan Region and similar subtropical environments globally.

5.4. Limitations of the Study

The geotechnical zoning approach assumes internal homogeneity within each zone, which, while a practical simplification at the regional scale, necessarily understates localised soil variability and material discontinuities that govern site-specific stability.
The soil-water characteristic curve parameters (θr, α) and, in part, θs, were assigned through published PTFs and literature-reported porosity values for comparable USCS soil classes, rather than from direct laboratory soil-water retention testing at the study sites. Similarly, Ksat for fine-grained materials was taken from published ranges rather than measured directly, and Hazen’s relationship was applied to coarser materials outside its strict grading range, yielding only approximate values. Collectively, these literature- and correlation-based parameters are a basic limitation of the study.
The landslide inventory used for the correspondence check (n = 824; n = 819 successfully zone-assigned) is drawn from the same parent inventory (n = 1484) used to calibrate the FR model from which the initial zone weights were derived. Full record-level independence between the two subsets could not be confirmed. Accordingly, the strong correspondence reported should be interpreted as supporting the geomorphological plausibility of the zonation, not as an independent statistical validation of it.
Finally, while the factor weights are now derived deterministically from the published FR model rather than through expert elicitation, three residual sources of subjectivity remain: (i) the categorical decision to exclude aspect, elevation, land cover, TWI, and the distance-based FR terms from the geotechnical weighting; (ii) the number of terrain zones (four), which reflects a balance between preserving heterogeneity and retaining sufficient laboratory observations per zone rather than an independently optimised value; and (iii) the iterative visual refinement of Jenks-derived zone boundaries against the geology, slope, and landform layers to align with recognisable terrain facets, which are disclosed and grounded in established heuristic terrain mapping practice [44] but not independently cross-checked. Thus, future work should test the sensitivity of the resulting zonation to all three of these choices.

6. Conclusions

This study successfully developed a geotechnical–hydrogeological zonation and parameterisation framework for the eThekwini Metropolitan Region, intended to support future physical-based landslide modelling. By systematically integrating geology, slope, and landform factors, four distinct geotechnical property zones were delineated. Geotechnical and hydrogeological parameters (c′, ϕ′, γsat, Ksat, θs, θr, α) were assigned to each zone from a combination of direct laboratory testing, borehole correlation, and published PTFs. The spatial correspondence analysis of historically observed landslide occurrences and the delineated zones revealed a strong association (82.5%, based on 819 zone-assigned landslides) in Zones 2 and 3, commensurate with observed geotechnical and hydrogeological characteristics of those zones. This is supported by their comparatively low effective cohesion (c′ = 5 kPa) relative to the more stable, higher-cohesion Zones 1 and 4. The strong correlation between landslide occurrences and some zones but not others supports the geomorphological plausibility of the zonation framework and is consistent with shear strength as an important predisposing control on slope failure in the region, alongside hydrogeological response.
This study undoubtedly contributes to regional hazard assessment in several respects, including (a) provision of a replicable, model-ready parameter dataset that can support a transition from qualitative susceptibility mapping toward quantitative, physically based hazard analysis; (b) the zone-specific, field-validated parameters (Ksat, c′, ϕ′, θs, θr, α) are directly compatible with transient rainfall-infiltration models such as TRIGRS [16], reducing reliance on uniform or assumed regional values in future modelling; (c) it establishes the hydrogeological and geotechnical input foundation required for future landslide-triggering rainfall threshold derivation; and (d) it offers a geotechnical zonation map that can inform land-use policy, resilient infrastructure design, and disaster risk reduction planning in the study area.
It is recommended that future work apply these zone-specific parameter sets within TRIGRS-based simulations under representative rainfall scenarios and evaluate the resulting hazard outputs against an independent landslide inventory. Doing so transforms the present zonation and parameterisation framework into a tested, physically based foundation for hazard forecasting and, eventually, early-warning applications. The geotechnical property zonation methodology and associated findings reported in this paper are largely reproducible and can be applied beyond the local context, including FR-derived factor weighting, which offers a transferable approach for parameterising complex terrain in data-scarce subtropical regions.

Author Contributions

Conceptualisation, S.G.C., M.D. and E.D.C.H.; methodology, S.G.C.; validation, M.D.; formal analysis, S.G.C.; investigation, S.G.C.; resources, S.G.C.; data curation, S.G.C.; writing—original draft preparation, S.G.C.; writing—review and editing, S.G.C., M.D. and E.D.C.H.; supervision, M.D. and E.D.C.H. All authors have read and agreed to the published version of the manuscript.

Funding

This research was internally funded by the Council for Geoscience (CGS) under the National Geohazards Mapping Pro-gramme. This research received no external funding. The APC was funded by the Council for Geoscience.

Institutional Review Board Statement

Not applicable.

Informed Consent Statement

Not applicable.

Data Availability Statement

The original contributions presented in this study are included in the article. Further inquiries can be directed to the corresponding authors.

Acknowledgments

The authors acknowledge the Council for Geoscience (CGS) for their financial and logistical support of this research study. The University of KwaZulu-Natal (UKZN) is also acknowledged for providing academic and research facilities. During the preparation of this manuscript, the authors used Grammarly (version 14.1321.0) for language refinement, grammatical corrections, and enhancing overall readability. The authors have reviewed and edited the output and take full responsibility for the content of this publication. Additionally, Zotero 7 was used for reference management and citation formatting.

Conflicts of Interest

The authors declare no conflicts of interest.

Abbreviations

The following abbreviations are used in this manuscript:
AASHTOAmerican Association of State Highway and Transportation Officials
AHPAnalytic Hierarchy Process
ASTMAmerican Society for Testing and Materials
BSBritish Standard
CBDCentral Business District
CGSCouncil for Geoscience
FSLAMFast Shallow Landslide Assessment Model
GISGeographic Information System
GPSGlobal Positioning System
IAEGInternational Association for Engineering Geology and the Environment
N2/N3National Route 2/National Route 3
NMPNatal Metamorphic Province
PSDParticle Size Distribution
SHALSTABShallow Landslide Stability Model
SPTStandard Penetration Test
TPITopographic Position Index
TRIGRSTransient Rainfall Infiltration and Grid-Based Regional Slope-Stability
UNDRRUnited Nations Office for Disaster Risk Reduction
USCSUnified Soil Classification System
USDUnited States Dollar
VHRVery High Resolution
WoEWeight of Evidence

References

  1. Petley, D. Global Patterns of Loss of Life from Landslides. Geology 2012, 40, 927–930. [Google Scholar] [CrossRef] [Scilit]
  2. United Nations Office for Disaster Risk Reduction [UNDRR]. Global Assessment Report on Disaster Risk Reduction 2022: Our World at Risk: Transforming Governance for a Resilient Future; UNDRR: Geneva, Switzerland, 2022. [Google Scholar]
  3. Wieczorek, G.F.; Turner, A.K.; Schuster, R.L. (Eds.) Landslide Triggering Mechanisms. In Landslides: Investigation and Mitigation; Transportation Research Board Special Report; National Research Council: Washington, DC, USA, 1996; pp. 76–90. [Google Scholar]
  4. Duncan, J.M. Soil Strength and Slope Stability, 1st ed.; New York Academy of Sciences Series; John Wiley & Sons, Incorporated: Newark, NY, USA, 2014; ISBN 978-1-118-65165-0. [Google Scholar]
  5. Gariano, S.L.; Guzzetti, F. Landslides in a Changing Climate. Earth-Sci. Rev. 2016, 162, 227–252. [Google Scholar] [CrossRef] [Scilit]
  6. Froude, M.J.; Petley, D.N. Global Fatal Landslide Occurrence from 2004 to 2016. Nat. Hazards Earth Syst. Sci. 2018, 18, 2161–2181. [Google Scholar] [CrossRef] [Scilit]
  7. Mboto, S. Costs Related to KZN Floods Stand at R17 Billion. 2022. Available online: https://iol.co.za/mercury/news/2022-04-26-costs-related-to-kzn-floods-stands-at-r17-billion/ (accessed on 28 May 2025).
  8. Dandridge, C.; Stanley, T.A.; Kirschbaum, D.B.; Lakshmi, V. Spatial and Temporal Analysis of Global Landslide Reporting Using a Decade of the Global Landslide Catalog. Sustainability 2023, 15, 3323. [Google Scholar] [CrossRef] [Scilit]
  9. Reichenbach, P.; Rossi, M.; Malamud, B.D.; Mihir, M.; Guzzetti, F. A Review of Statistically-Based Landslide Susceptibility Models. Earth-Sci. Rev. 2018, 180, 60–91. [Google Scholar] [CrossRef] [Scilit]
  10. Toločka, A. Towards Understanding the Global Distribution of Deep-Seated Gravitational Deformations: A Study of Geological Influences and Spatial Patterns. Nat. Hazards 2025, 121, 16149–16183. [Google Scholar] [CrossRef] [Scilit]
  11. Broeckx, J.; Vanmaercke, M.; Duchateau, R.; Poesen, J. A Data-Based Landslide Susceptibility Map of Africa. Earth-Sci. Rev. 2018, 185, 102–121. [Google Scholar] [CrossRef] [Scilit]
  12. Chiliza, S.G.; Demlie, M.; Hingston, E. Predicting Shallow Rainfall-Induced Landslides in eThekwini Metropol, South Africa: Utilising the TRIGRS Model. In Proceedings of the Engineering Geology and Geotechnics: Building for the Future, Proceedings of the Conference EUROENGEO 2024; University of Zagreb Faculty of Civil Engineering: Zagreb, Croatia, 2024; pp. 177–186. [Google Scholar] [CrossRef] [Scilit]
  13. Montgomery, D.R.; Dietrich, W.E. A Physically Based Model for the Topographic Control on Shallow Landsliding. Water Resour. Res. 1994, 30, 1153–1171. [Google Scholar] [CrossRef] [Scilit]
  14. Baum, R.L.; Savage, W.Z.; Godt, J.W. TRIGRS: A Fortran Program for Transient Rainfall Infiltration and Grid-Based Regional Slope-Stability Analysis, Version 2. 2008. Available online: https://pubs.usgs.gov/of/2008/1159/ (accessed on 8 July 2024).
  15. Baum, R.L.; Coe, J.A.; Godt, J.W.; Harp, E.L.; Reid, M.E.; Savage, W.Z.; Schulz, W.H.; Brien, D.L.; Chleborad, A.F.; McKenna, J.P.; et al. Regional Landslide-Hazard Assessment for Seattle, Washington, USA. Landslides 2005, 2, 266–279. [Google Scholar] [CrossRef] [Scilit]
  16. Medina, V.; Hürlimann, M.; Guo, Z.; Lloret, A.; Vaunat, J. Fast Physically-Based Model for Rainfall-Induced Landslide Susceptibility Assessment at Regional Scale. CATENA 2021, 201, 105213. [Google Scholar] [CrossRef] [Scilit]
  17. Sengani, F.; Mulenga, F. Application of Limit Equilibrium Analysis and Numerical Modeling in a Case of Slope Instability. Sustainability 2020, 12, 8870. [Google Scholar] [CrossRef] [Scilit]
  18. Carrara, A.; Cardinali, M.; Detti, R.; Guzzetti, F.; Pasqui, V.; Reichenbach, P. GIS Techniques and Statistical Models in Evaluating Landslide Hazard. Earth Surf. Processes Landf. 1991, 16, 427–445. [Google Scholar] [CrossRef] [Scilit]
  19. Chacón, J.; Irigaray, C.; Fernández, T.; El Hamdouni, R. Engineering Geology Maps: Landslides and Geographical Information Systems. Bull. Eng. Geol. Environ. 2006, 65, 341–411. [Google Scholar] [CrossRef] [Scilit]
  20. Van Den Eeckhaut, M.; Reichenbach, P.; Guzzetti, F.; Rossi, M.; Poesen, J. Combined Landslide Inventory and Susceptibility Assessment Based on Different Mapping Units: An Example from the Flemish Ardennes, Belgium. Nat. Hazards Earth Syst. Sci. 2009, 9, 507–521. [Google Scholar] [CrossRef] [Scilit]
  21. Saaty, R.W. The Analytic Hierarchy Process—What It Is and How It Is Used. Math. Model. 1987, 9, 161–176. [Google Scholar] [CrossRef] [Scilit]
  22. Bonham-Carter, G. Geographic Information Systems for Geoscientists: Modelling with GIS. Comput. Methods Geosci. 1994, 13, 398. [Google Scholar]
  23. Lee, S.; Pradhan, B. Landslide Hazard Mapping at Selangor, Malaysia Using Frequency Ratio and Logistic Regression Models. Landslides 2007, 4, 33–41. [Google Scholar] [CrossRef] [Scilit]
  24. Ayalew, L.; Yamagishi, H. The Application of GIS-Based Logistic Regression for Landslide Susceptibility Mapping in the Kakuda-Yahiko Mountains, Central Japan. Geomorphology 2005, 65, 15–31. [Google Scholar] [CrossRef] [Scilit]
  25. Budimir, M.E.A.; Atkinson, P.M.; Lewis, H.G. A Systematic Review of Landslide Probability Mapping Using Logistic Regression. Landslides 2015, 12, 419–436. [Google Scholar] [CrossRef] [Scilit]
  26. Tien Bui, D.; Tuan, T.A.; Klempe, H.; Pradhan, B.; Revhaug, I. Spatial Prediction Models for Shallow Landslide Hazards: A Comparative Assessment of the Efficacy of Support Vector Machines, Artificial Neural Networks, Kernel Logistic Regression, and Logistic Model Tree. Landslides 2016, 13, 361–378. [Google Scholar] [CrossRef] [Scilit]
  27. Partridge, T.C.; Dollar, E.S.J.; Moolman, J.; Dollar, L.H. The Geomorphic Provinces of South Africa, Lesotho and Swaziland: A Physiographic Subdivision for Earth and Environmental Scientists. Trans. R. Soc. S. Afr. 2010, 65, 1–47. [Google Scholar] [CrossRef] [Scilit]
  28. eThekwini Municipality. Final SDF 2022–2023; eThekwini Municipality: Durban, South Africa, 2022.
  29. Richards, N.P. Explanation of the Engineering, Geological, and Geotechnical Conditions for the 1:50,000 Scale Map Sheet 2930 DD & 2931 CC; Council for Geoscience: Pretoria, South Africa, 2016; ISBN 978-1-920226-77-0.
  30. Thomas, M.A.; Van Schalkwyk, A. Geological Hazards Associated with Intense Rain and Flooding in Natal. J. Afr. Earth Sci. (Middle East) 1993, 16, 193–204. [Google Scholar] [CrossRef] [Scilit]
  31. McCourt, S.; Armstrong, R.A.; Grantham, G.H.; Thomas, R.J. Geology and Evolution of the Natal Belt, South Africa. J. Afr. Earth Sci. 2006, 46, 71–92. [Google Scholar] [CrossRef] [Scilit]
  32. Clarke, B.M.; Botha, G.A.; Kota, M.W.; Singh, R.G.; Willard, C.A.; Ngcobo, F.N. The Geology of the Durban Area: Explanation Sheets 2930DD and 2931CC; Council for Geoscience: Pretoria, South Africa, 2016; ISBN 978-1-920226-74-9.
  33. Bell, F.G.; Maud, R.R. Landslides Associated with the Colluvial Soils Overlying the Natal Group in the Greater Durban Region of Natal, South Africa. Environ. Geol. 2000, 39, 1029–1038. [Google Scholar] [CrossRef] [Scilit]
  34. Bell, F.G.; Maud, R.R. Landslides Associated with the Pietermaritzburg Formation in the Greater Durban Area, South Africa: Some Case Histories. Environ. Eng. Geosci. 1996, II, 557–573. [Google Scholar] [CrossRef] [Scilit]
  35. King, G.M. An Explanation of the 1:500 000 General Hydrogeological Map, Durban 2928 2002; Department of Water Affairs and Forestry (DWAF): Pretoria, South Africa, 2002.
  36. Ndlovu, M.S.; Demlie, M.; Butler, M. Hydrogeological Setting and Hydrogeochemical Characteristics of the Durban Metropolitan District, Eastern South Africa. S. Afr. J. Geol. 2019, 122, 299–316. [Google Scholar] [CrossRef] [Scilit]
  37. British Standards Institution. Methods of Test for Soils for Civil Engineering Purposes Part 7: Shear Strength Tests (Total Stress); British Standards Institution: London, UK, 1990. [Google Scholar]
  38. ASTM D2487-11; Standard Practice for Classification of Soils for Engineering Purposes (Unified Soil Classification System). ASTM International: West Conshohocken, PA, USA, 2011.
  39. American Association of State Highway and Transportation Officials. Classification of Soils and Soil-Aggregate Mixtures for Highway Construction Purposes; American Association of State Highway and Transportation Officials: Washington, DC, USA, 2012. [Google Scholar]
  40. Stiff, J.S. Terrain Evaluation for Urban Development. In Proceedings of the 4th Terrain Evaluation and Data Storage Symposium, Midrand, South Africa, 3–5 August 1994. [Google Scholar]
  41. Baynes, F.; Parry, S.; Culshaw, M.; Griffiths, J. Guidelines for the Development and Application of Engineering Geological Models on Projects. Int. Assoc. Eng. Geol. Environ. (IAEG) Comm. 2022, 25, 129. [Google Scholar]
  42. International Association of Engineering Geology (IAEG), Commission on Engineering Geological Maps. Engineering Geological Maps: A Guide to Their Preparation; UNESCO Press: Paris, France, 1976; Volume 15. [Google Scholar]
  43. Meijerink, A.M.J. Data Acquisition and Data Capture through Terrain Mapping Units. In Data Acquisition and Data Capture through Terrain Mapping Units; Meijerink, A.M.J., Ed.; ITC Publication; International Institute for Aerospace Survey and Earth Sciences (ITC): Enschede, The Netherlands, 1988; Volume 27. [Google Scholar]
  44. Soeters, R.; van Westen, C.J. Slope Instability Recognition, Analysis, and Zonation. In Landslides: Investigation and Mitigation; Turner, A.K., Schuster, R.L., Eds.; Transportation Research Board Special Report; National Academy Press: Washington, DC, USA, 1996; Volume 247, pp. 129–177. ISBN 0-309-06151-2. [Google Scholar]
  45. Singh, R.; Chiliza, G. Re-Mapping Landslide Susceptibility in the eThekwini Metropolitan Municipality, KwaZulu-Natal: Progress Report (Q4–2022/23): National Geohazards Mapping Programme; Council for Geoscience: Pretoria, South Africa, 2023.
  46. Marin, R.J.; Mattos, A.J.; Marín-Londoño, J. Physically-Based Definition of Rainfall Thresholds for Shallow Landslides in a Tropical Mountain Watershed of the Colombian Andes. In Proceedings of the 13th International Symposium on Landslides (ISL 2020); International Society for Soil Mechanics and Geotechnical Engineering (ISSMGE): Cartagena, Colombia, 2020. [Google Scholar]
  47. Jenks, G.F. The Data Model Concept in Statistical Mapping. In International Yearbook of Cartography; International Cartographic Association (ICA): Basel, Switzerland, 1976; Volume 7. [Google Scholar]
  48. North, M.A. A Method for Implementing a Statistically Significant Number of Data Classes in the Jenks Algorithm. In Proceedings of the 2009 Sixth International Conference on Fuzzy Systems and Knowledge Discovery; IEEE: Tianjin, China, 2009; pp. 35–38. [Google Scholar]
  49. Phoon, K.-K.; Kulhawy, F.H. Characterization of Geotechnical Variability. Can. Geotech. J. 1999, 36, 612–624. [Google Scholar] [CrossRef]
  50. Hazen, A. Some Physical Properties of Sands and Gravels, with Special Reference to Their Use in Filtration; Public Document No. 34; Massachusetts State Board of Health: Boston, MA, 1892; pp. 539–556.
  51. Odong, J. Evaluation of Empirical Formulae for Determination of Hydraulic Conductivity Based on Grain-Size Analysis. J. Am. Sci. 2007, 3, 54. [Google Scholar] [CrossRef]
  52. Hazen, A. Discussion of “Dams on Sand Foundations” by A.C. Koenig. Trans. Am. Soc. Civ. Eng. 1911, 73, 199–203. [Google Scholar]
  53. Das, B.M. Principles of Geotechnical Engineering, 10th ed.; Cengage: Boston, MA, USA, 2022; ISBN 978-0-357-42047-8. [Google Scholar]
  54. Coduto, D.P.; Yeung, M.R.; Kitch, W.A. Geotechnical Engineering: Principles and Practices, 2nd ed.; Pearson: Boston, MA, USA, 2011; ISBN 978-0-13-135425-8. [Google Scholar]
  55. Gardner, W.R. Some Steady-State Solutions of the Unsaturated Moisture Flow Equation with Application to Evaporation from a Water Table. Soil. Sci. 1958, 85, 228–232. [Google Scholar] [CrossRef] [Scilit]
  56. Carsel, R.F.; Parrish, R.S. Developing Joint Probability Distributions of Soil Water Retention Characteristics. Water Resour. Res. 1988, 24, 755–769. [Google Scholar] [CrossRef] [Scilit]
  57. Srivastava, R.; Yeh, T.-C.J. Analytical Solutions for One-dimensional, Transient Infiltration toward the Water Table in Homogeneous and Layered Soils. Water Resour. Res. 1991, 27, 753–762. [Google Scholar] [CrossRef] [Scilit]
  58. Savage, W.Z.; Godt, J.W.; Baum, R.L.; Erlich, M.; Fontoura, S.A.B.; Sayao, A.S.F. (Eds.) Modeling Time-Dependent Areal Slope Stability. In Proceedings of the 9th International Symposium on Landslides—Landslides: Evaluation and Stabilization; AA Balkema Publishers: London, UK, 2004; pp. 23–36. [Google Scholar]
  59. Guzzetti, F.; Carrara, A.; Cardinali, M.; Reichenbach, P. Landslide Hazard Evaluation: A Review of Current Techniques and Their Application in a Multi-Scale Study, Central Italy. Geomorphology 1999, 31, 181–216. [Google Scholar] [CrossRef] [Scilit]
  60. Varnes, D.J. Landslide Hazard Zonation: A Review of Principles and Practice; Natural Hazards; UNESCO: Paris, France, 1984. [Google Scholar]
  61. Leroueil, S.; Picarelli, L. Assessment of Slope Stability. In Proceedings of the Geotechnical Engineering State of the Art and Practice; American Society of Civil Engineers: Oakland, CA, USA, 2012; pp. 122–156. [Google Scholar]
  62. Iverson, R.M. Landslide Triggering by Rain Infiltration. Water Resour. Res. 2000, 36, 1897–1910. [Google Scholar] [CrossRef] [Scilit]
  63. Godt, J.W.; Schulz, W.H.; Baum, R.L.; Savage, W.Z. Modeling Rainfall Conditions for Shallow Landsliding in Seattle, Washington. In Landslides and Engineering Geology of the Seattle, Washington, Area; Baum, R.L., Godt, J.W., Highland, L.M., Eds.; Geological Society of America: Boulder, CO, USA, 2008; pp. 137–152. ISBN 978-0-8137-4120-8. [Google Scholar]
  64. Vieira, B.C.; Fernandes, N.F.; Filho, O.A. Shallow Landslide Prediction in the Serra Do Mar, São Paulo, Brazil. Nat. Hazards Earth Syst. Sci. 2010, 10, 1829–1837. [Google Scholar] [CrossRef] [Scilit]
  65. Dahal, R.K.; Hasegawa, S. Representative Rainfall Thresholds for Landslides in the Nepal Himalaya. Geomorphology 2008, 100, 429–443. [Google Scholar] [CrossRef] [Scilit]
  66. Catane, S.G.; Cabria, H.B.; Zarco, M.A.H.; Saturay, R.M.; Mirasol-Robert, A.A. The 17 February 2006 Guinsaugon Rock Slide-Debris Avalanche, Southern Leyte, Philippines: Deposit Characteristics and Failure Mechanism. Bull. Eng. Geol. Environ. 2008, 67, 305. [Google Scholar] [CrossRef] [Scilit]
  67. Segoni, S.; Tofani, V.; Rosi, A.; Catani, F.; Casagli, N. Combination of Rainfall Thresholds and Susceptibility Maps for Dynamic Landslide Hazard Assessment at Regional Scale. Front. Earth Sci. 2018, 6, 85. [Google Scholar] [CrossRef] [Scilit]
Figure 1. Locality map of the eThekwini Metropolitan Region on the eastern coast of South Africa: (a) regional setting within southern Africa (scale bar applies to panel (a)); (b) provincial context within South Africa, shown schematically without a fixed scale; (c) topographic map of the eThekwini Metropolitan Region showing the digital elevation model (DEM, m), major towns, rivers, and municipal boundary.
Geohazards 07 00110 g001
Figure 2. Average monthly rainfall (1970–2022) illustrating the typical regional seasonal distribution.
Geohazards 07 00110 g002
Figure 3. Geological map of the study area (modified from [31]).
Geohazards 07 00110 g003
Figure 7. Relationship of mapped landslides across the four geotechnical (property) zones in the study area.
Geohazards 07 00110 g007
Figure 8. Spatial distribution of the four geotechnical–hydrogeological (property) zones (Zones 1 to 4) delineated for the eThekwini Metropolitan Region.
Geohazards 07 00110 g008
Table 1. Geomorphological, geotechnical, and hydrogeological characteristics of the four delineated property zones.
ZoneDominant Lithology/SoilGeomorphological Settingc′ (kPa) Mean (Range)ϕ′ (°) Mean (Range)γsat (kN/m3)cu (kPa) Mean (Range)Ksat (m/s)θsθrα (m−1)n (Lab Tests)
1Residual dolerite and diamictite/tillite (CH/MH)Steep, dissected ridges and upper slopes of the escarpment foothills10 (5–15)30 (25–35)1945 (30–60)10−9–10−80.500.070.38
2Residual shales (CL) and alluvium/dune sands (SP/SM)Transitional terrain spanning both the coastal plain and escarpment foothills5 (0–10)27.5 (20–35)1925 (0–40)10−6–10−50.450.062.012
3Sandy colluvium and residual sandstone (SM)Mid to upper slopes overlying Natal Group sandstones5 (0–10)30 (25–35)18.520 (15–30)10−8–10−50.430.051.56
4Residual granite gneisses and well-drained sands (SP)Elevated plateaus and crests in the western highlands15 (10–20)35 (30–40)2055 (40–70)10−4–10−30.400.044.03
Notes: c′ is effective cohesion; ϕ′ is effective friction angle; γsat is saturated unit weight; cu is undrained shear strength; Ksat is saturated hydraulic conductivity; θs is saturated volumetric water content; θr is residual volumetric water content; α is the inverse capillary height (soil-water characteristic curve fitting parameter). θs and θr provenance is described in Section 3.2.3; Ksat method of derivation is described in Section 3.2.2.
Table 2. Summary statistics of index properties (n = 18 unless otherwise noted).
ParameternMeanSDCoV (%)Range
Plasticity Index (PI)12 *15.95.9379.5–24.5
Liquid Limit (LL)12 *39.38.32125.8–55.5
Linear Shrinkage (LS)184.7 0.0–10.6
* Six samples classified as no-plastic (N.P.) are excluded from PI/LL statistics.
Table 3. Summary statistics of direct shear test results (n = 10).
ParameternMeanSDCoV (%)
Friction Angle, ϕ (°)1030.23.210.5
Cohesion, c (kPa)106.54.265
Table 4. Spatial distribution of landslides by property zones (n = 819).
Property ZoneNumber of LandslidesPercentage of Total Landslides (%)
113717
231438
336244
461
Disclaimer/Publisher’s Note: The statements, opinions and data contained in all publications are solely those of the individual author(s) and contributor(s) and not of MDPI and/or the editor(s). MDPI and/or the editor(s) disclaim responsibility for any injury to people or property resulting from any ideas, methods, instructions or products referred to in the content.