Article

Quantifying the Role of Vertical Seismic Forces in Pseudo-Static Slope Stability: A Parametric Study with Practical Analytical Indicators


by
A. S. M. Fahad Hossain
1,
Saif Ahmed Santo
2,* and
Miroslav Nastev
3
1
Department of Civil Engineering, Ahsanullah University of Science and Technology, Dhaka 1208, Bangladesh
2
Department of Civil Engineering, IUBAT—International University of Business Agriculture and Technology, Dhaka 1230, Bangladesh
3
Geological Survey of Canada, Québec, QC G1K 9A9, Canada
*
Author to whom correspondence should be addressed.
GeoHazards 2026, 7(3), 84; https://doi.org/10.3390/geohazards7030084
Submission received: 2 June 2026 / Revised: 5 July 2026 / Accepted: 7 July 2026 / Published: 9 July 2026

Abstract

Vertical seismic forces may exceed horizontal components under certain conditions; however, they are often neglected in engineering practice. The primary justification in pseudo-static slope stability analysis is that the simultaneous increase/decrease in resisting and driving forces due to vertical loading results in a negligible net change in the factor of safety (FS); peak horizontal and vertical accelerations rarely occur simultaneously; and standard horizontal coefficients are generally sufficiently conservative. The present study systematically quantifies the combined influence of horizontal and vertical seismic forces on slope stability. Three representative slope geometries with inclinations of 1:1.5, 1:2, and 1:3 were analyzed using the pseudo-static limit equilibrium method (PS-LEM); the framework was additionally validated using the pseudo-static finite element method (PS-FEM) against a documented landslide case history. Horizontal seismic coefficients (Kh) of 0.025, 0.05, 0.10, and 0.20 were evaluated in combination with PVA/PHA ratios of 0, 0.25, 0.50, and 1.0 under both upward and downward vertical loading. Three analytical parameters are introduced: (i) Factor of Safety Reduction Index (FSRI), (ii) Vertical Force Sensitivity Ratio (VSR), and (iii) Asymmetry Index (AI). The results show FS reductions up to 10.6% under critical downward loading and a consistently asymmetric response. A preliminary validation against the 2008 Sichuan Daguangbao landslide supports the predictive capability of the framework, although broader validation across additional case histories is required to establish general applicability. The findings support the explicit inclusion of vertical seismic forces in slope stability assessments, particularly in near-field regions with PVA/PHA ratios exceeding 0.5.

1. Introduction

Landslides represent a significant threat to urban environments’ infrastructures worldwide, as they can result in significant physical damage and economic losses, making their accurate prediction and mitigation a challenging task [1]. Landslides caused by seismic activity further increase the negative impacts on earthquake-affected regions, which may account for 5% [2] to as much as 11% [3] of all earthquake-induced casualties [4]. Therefore, seismic-prone areas must assess the potential for earthquake-induced landslide hazards [5,6]. Most geotechnical guidelines recommend using the pseudo-static (PS) method for slope stability analysis, including the USACE seismic coefficient guidelines [7], Eurocode 8 [8] and the National Building Code of Canada [9]. Introduced first by Terzaghi [10], the PS method uses horizontal (Kh) and vertical (Kv) seismic coefficients to calculate equivalent inertia forces and to evaluate slope stability [11,12,13]. Due to its simplicity and minimal computational requirements, it is one of the most widely used techniques for analyzing seismic earth pressures and slope stability [14,15,16].
The PS analysis is based on the traditional limit equilibrium analysis (LEA), where a constant horizontal force is applied at the center of gravity of the sliding mass that represents the horizontal component of a seismic force [17]. Previously, the horizontal seismic component and its effect on structures have been studied extensively [18,19,20,21,22], while the vertical component was often neglected. However, following some destructive earthquakes, the vertical component has recently gained proper importance [23,24,25,26]. Studies show that the vertical seismic component can indeed affect the results significantly, mainly due to the failure of weaker materials under negligible shear stress when the reduction in normal stress under the effect of vertical seismic acceleration occurs [27,28]. Although researchers generally agree that vertical seismic acceleration is important for the design of various structures, their opinions regarding slope failures vary. Ling et al. [29] reported that vertical acceleration affects slope stability only when horizontal acceleration is high. Yan et al. [30] and Gazetas et al. [31] argued that vertical motion has minimal impact and can be neglected. In contrast, Sun et al. [32] contended that vertical forces play a critical or even leading role in slope failures. Santo et al. [33] demonstrated FS reduction in three cases: both Kh and Kv variables, one variable with the other fixed, and both variables fixed, showing that FS decreased with increasing K for slope geometry.
Besides the amplitude and duration of the strong motion [34], the peak vertical-to-horizontal acceleration ratio (PVA/PHA) has become a key parameter in understanding these effects. Among the documented earthquakes with PVA/PHA ratio higher than unity are: M6.5 1979 Imperial Valley (ratio of ~1.6, rupture type: strike-slip), M6.9 1989 Loma Prieta (1.0~1.3, oblique slip), M6.7 1994 Northridge (~1.1, blind thrust), M6.2 2011 Chi-Chi (~1.1, thrust), perhaps the most extreme modern example, the M6.2 2011 Christchurch (~2.2, blind oblique-thrust). Records from the nearest Qingping station (51MZQ), located 4.2 km from the landslide, show horizontal PGA of 0.824 g and vertical PGA of 0.623 g, yielding a PVA/PHA ratio of approximately 0.76 [35]. In these mainly thrust-fault earthquakes, post-event investigations have often identified vertical acceleration as a contributing trigger in numerous large-scale failures. The strength framework adopted is a further source of divergence: the three-dimensional limit-analysis results indicate that seismic sensitivity to vertical loading depends on whether a linear Mohr–Coulomb or a nonlinear strength envelope is used, with the two diverging most for steeper slopes and higher seismic coefficients [36], a pattern consistent with the geometry-dependent seismic sensitivity identified in Section 4 of the present study. A recent comprehensive review of seismic slope stability [37] similarly concludes that the relative importance of vertical acceleration is case-dependent, governed by near-fault distance, failure-surface geometry, and material brittleness, rather than being a fixed, universal effect. The research gap addressed here is therefore not whether vertical acceleration matters in general—the literature already disagrees on that point for good, case-specific reasons—but rather when, and by how much, it matters for a controlled, systematically varied set of slope geometries and loading levels, expressed through indicators that translate that sensitivity into a form usable in routine design screening.
Despite increasing recognition of vertical seismic acceleration, its coupled interaction with horizontal loading in pseudo-static slope stability remains insufficiently quantified. The objective of the present study is therefore to systematically quantify the combined influence of horizontal and vertical seismic loading on slope stability. Three representative slope geometries are considered by applying the pseudo-static limit equilibrium method (PS-LEM) and the framework is additionally validated using the pseudo-static finite element method (PS-FEM) against a documented case history. The impacts of various combinations of PVA/PHA are evaluated in both upward and downward vertical directions. Also, three practical, purpose-built analytical parameters are introduced to assess the slope stability: Factor of Safety Reduction Index (FSRI), Vertical Force Sensitivity Ratio (VSR) and Asymmetry Index (AI).

2. Pseudo-Static Analysis

The procedure for seismic stability analysis of natural or stabilized slopes under static conditions is well-documented in the literature [13,38]. The PS method is one of the oldest, most straightforward, and most widely used approaches for analyzing seismic slope stability. The method is referred to as “pseudo-static” because a horizontal or vertical seismic force is applied at the centroid of the soil mass in the failure zone to simulate inertia forces generated by earthquake shaking. The subsequent analysis is performed using the traditional limit equilibrium method (LEM), where a circular or non-circular failure plane is assumed, considering a rigid, perfectly plastic sliding body represented as a single free-body diagram or divided into several slices [39,40]. Earthquake loads are applied as seismic coefficients in horizontal and/or vertical directions. The horizontal and vertical seismic inertia forces (F) are calculated as the product of the soil weight (W) and the respective dimensionless seismic acceleration coefficient (K), as shown in Equations (1) and (2).
F h = a h W g = K h W
F v = a v W g = K v W
where a represents the pseudo-static acceleration indicating the severity of the anticipated ground motion; g is the gravitational constant; and W is the weight of the soil mass.
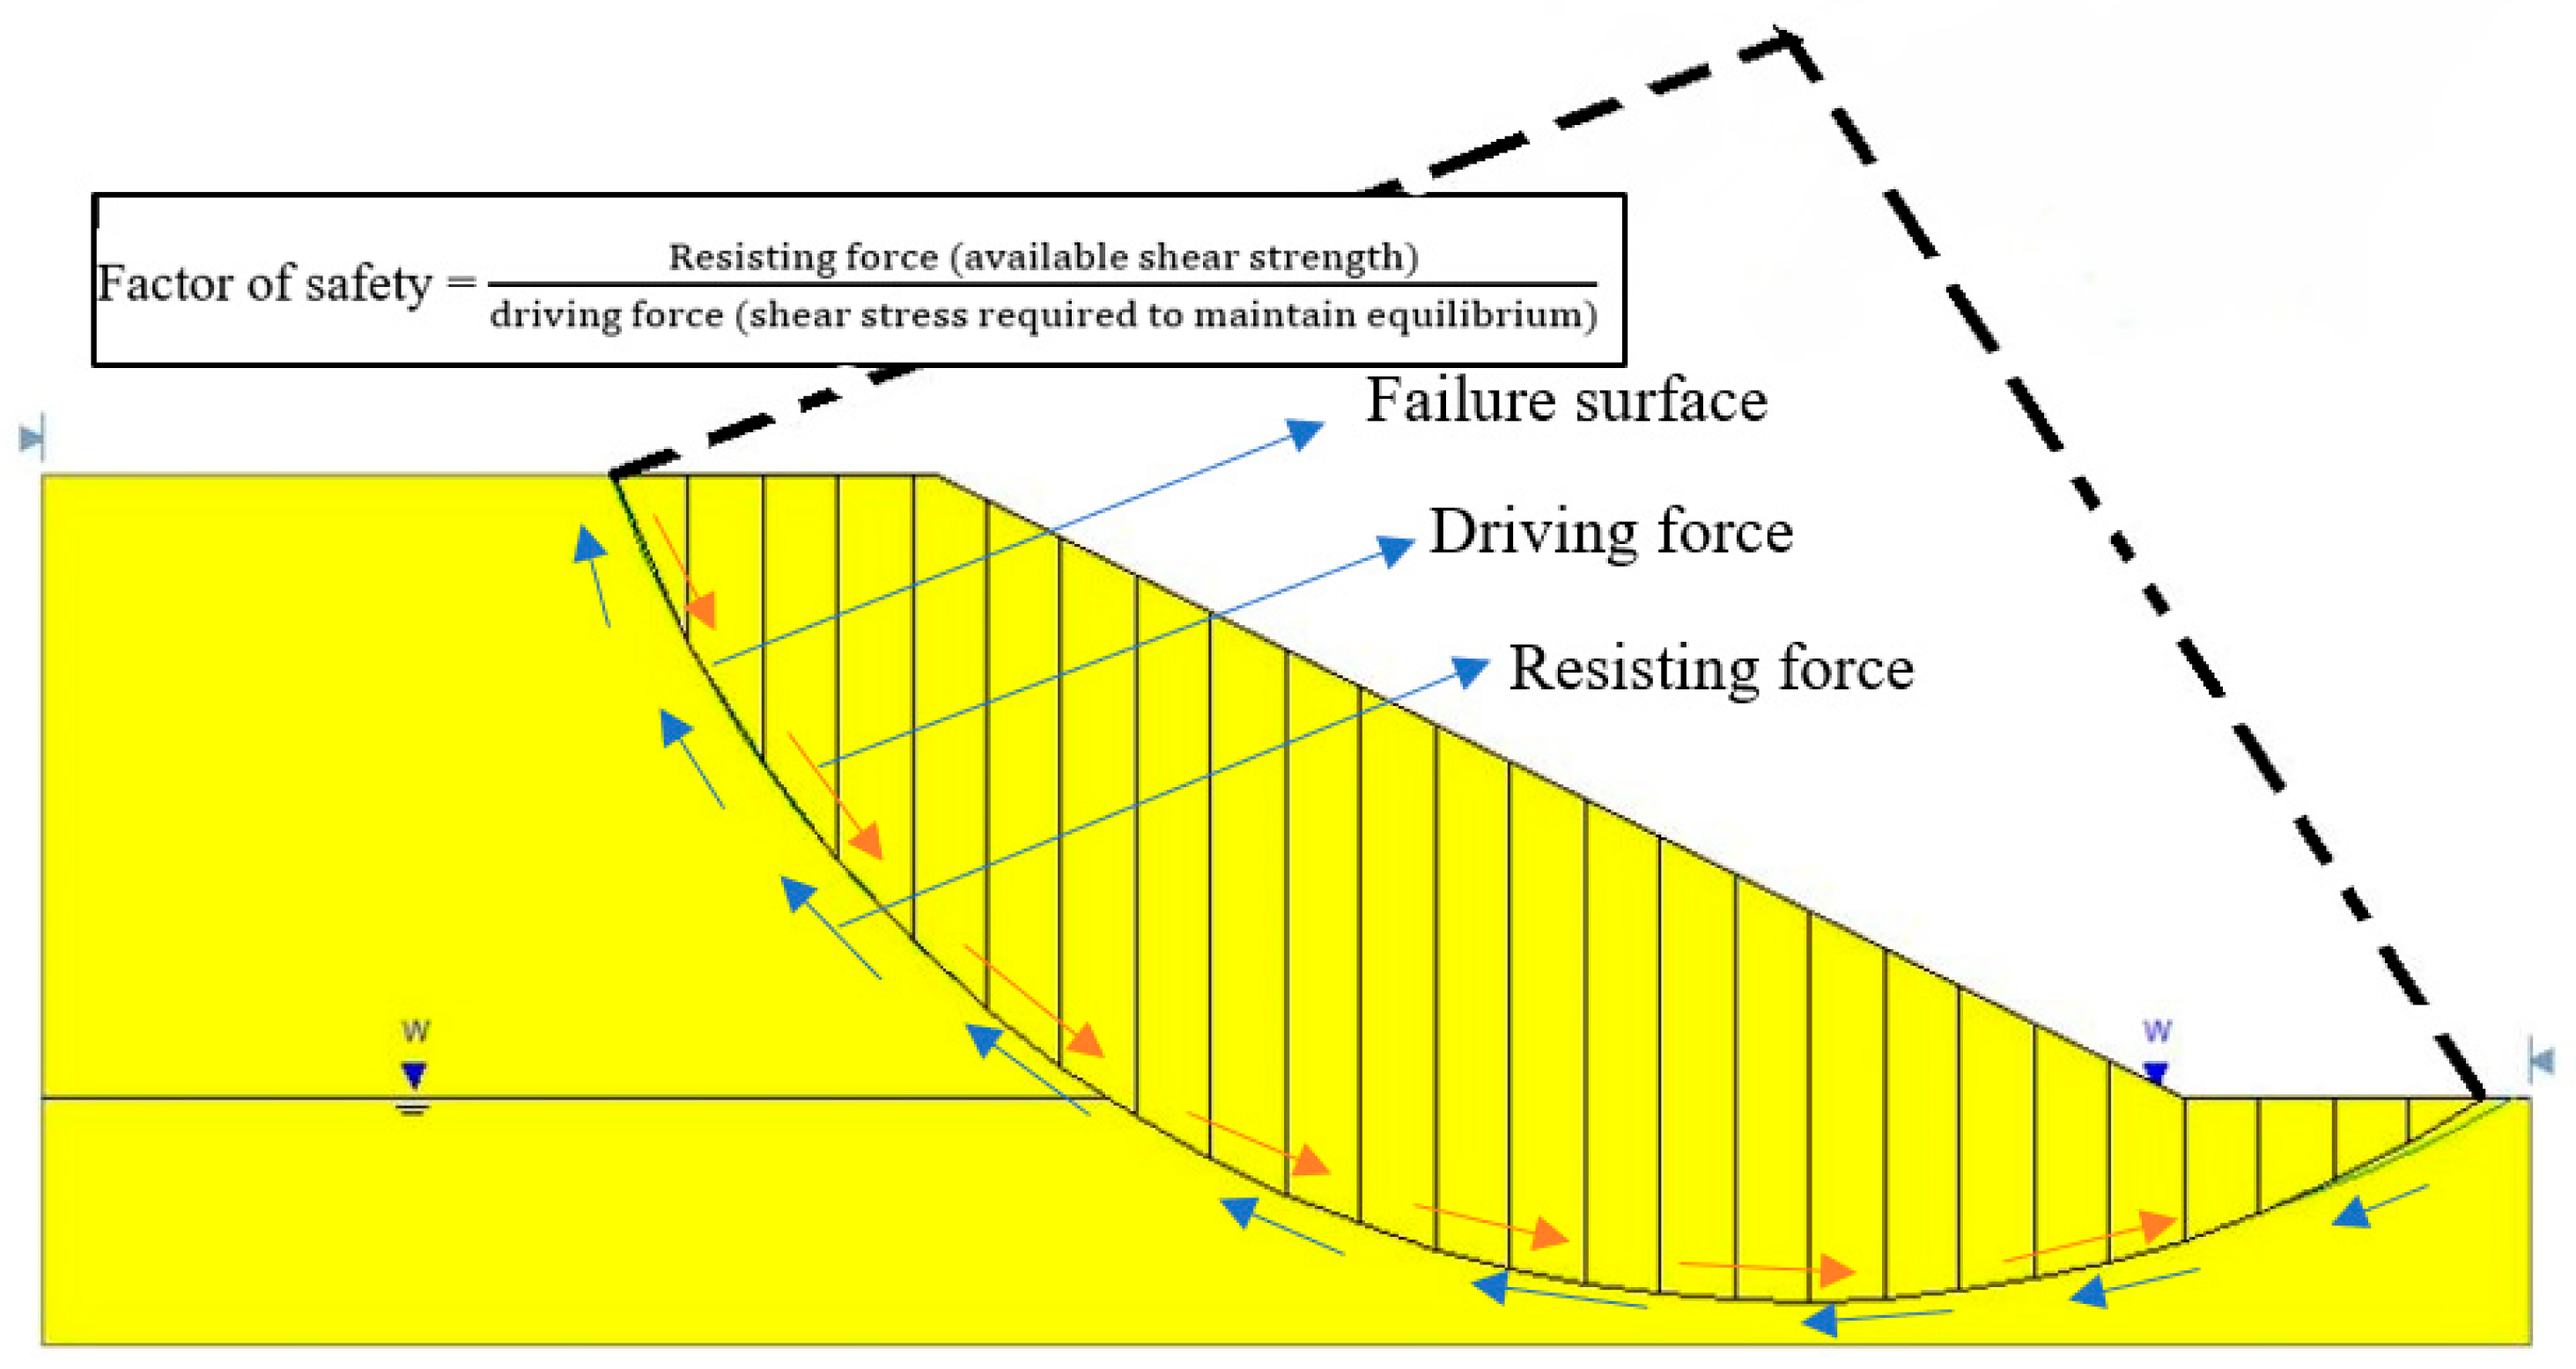
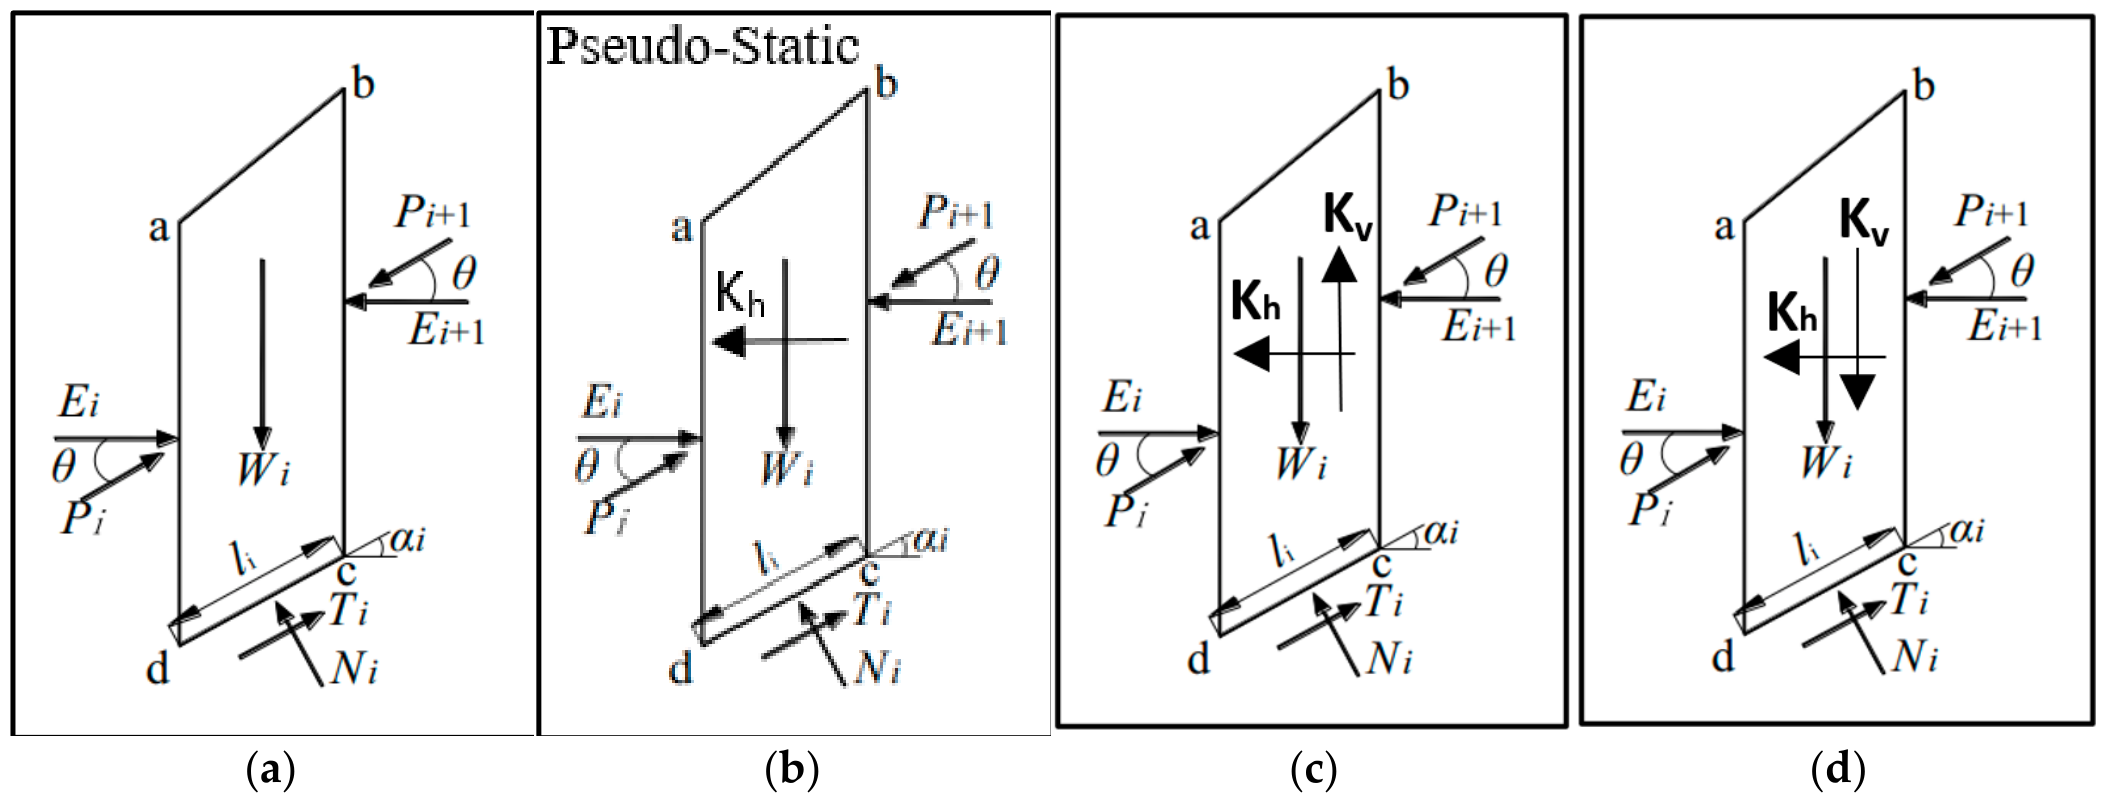
The shear strength is assumed to be mobilized along the potential failure surface. The minimum FS for a slope is calculated through a trial-and-error method based on the equilibrium of the shear stresses and the constant shear strength along the slip surface, as shown in Equations (3)–(5) [13]. When the slice method is applied, interslice pseudo-static forces are considered for each slice to calculate moment and force equilibrium. The FS calculation technique based on the failure surface and driving forces is shown in Figure 1, whereas Figure 2 illustrates the pseudo-static forces acting on each slice in the slice method.
F S = Force resisting Force driving
F S = C I a b + W F v cos β F h sin β tan φ W F v sin β + F h cos β   ( Upward   vertical   force )
F S = C I a b + W + F v cos β + F h sin β tan φ W + F v sin β + F h cos β   ( Downward   vertical   force )
where c-φ are the Mohr–Coulomb strength parameters that describe the shear strength along the failure plane with length lab, where lab is the length of the slice base ab.
Equations (4) and (5) treat the vertical seismic coefficient as acting persistently in a single direction (fully upward or fully downward) rather than as the rapidly alternating quantity recorded in real strong-motion records. This is a deliberate simplification consistent with the conservative, envelope-based philosophy of the pseudo-static method [7]: rather than tracking the true time-varying direction of the vertical component, the method instead evaluates the two limiting, physically admissible states—peak upward and peak downward—separately, so that the resulting pair of FS values brackets the range of instantaneous stability conditions a slope may experience during shaking. Applying the horizontal and vertical peak coefficients simultaneously, as in Equations (4) and (5), is likewise a standard conservative convention rather than an assertion that the two peaks are physically coincident in time; because true peak horizontal and peak vertical accelerations rarely occur at the same instant, this simultaneous-peak treatment yields an upper-bound estimate of the destabilizing effect for the downward case and an upper-bound estimate of the stabilizing benefit for the upward case, consistent with the treatment adopted in Eurocode 8 [8] and the National Building Code of Canada [9]. This convention, and its limitations relative to fully dynamic time-history analysis capable of capturing cyclic load reversal, are revisited in Section 7.

3. Methodology

3.1. Slope Geometries and Material Properties

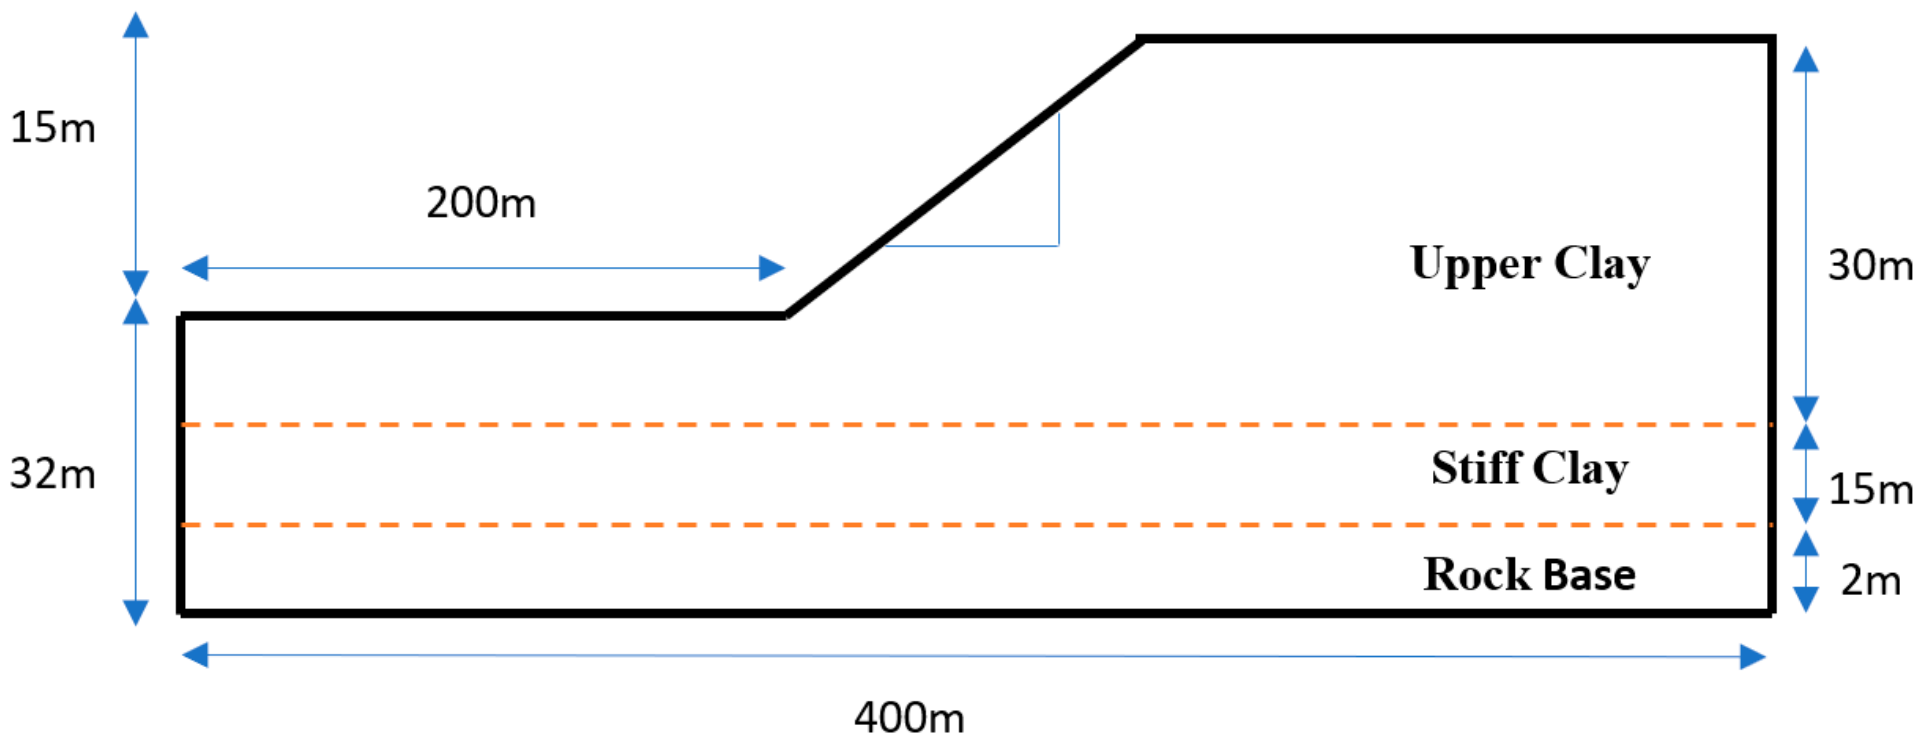
The PS method was applied to analyze the stability of typical generic slope geometries. Three slope geometries were considered, each with a height of 15 m and slope inclinations of 1:1.5, 1:2, and 1:3. The geometrical and geotechnical properties of the slopes were selected based on recommendations from Wang et al. [42] and detailed in Figure 3 and Table 1. The slopes were modeled with three successive layers (from top): upper clay layer, stiff clay layer, and basal rock. The analysis was conducted using Slide2 software (Rocscience), employing the Sarma [43] method under both static and pseudo-static conditions.
Several modeling choices in Table 1 warrant explicit justification. The 15 m slope height was selected as broadly representative of the cut and embankment slopes common in regional infrastructure and hill-tract terrain, and is consistent with the generic-geometry approach adopted from Wang et al. [42]; it is not intended to represent any single site. The basal rock layer was assigned an undrained shear strength of 5000 kPa—roughly two orders of magnitude above the stiff clay layer—so that it behaves as an effectively non-yielding boundary, forcing the critical failure surface to remain within the overlying soil layers rather than propagating into bedrock; this is a standard modeling convention and not a claim about the strength of any specific rock mass. A uniform saturated unit weight of 20 kN/m3 was applied to all three layers by design, so that the parametric comparisons across layers isolate the effect of the strength contrast (75 kPa, 150 kPa, and 5000 kPa) rather than confounding it with a simultaneous change in unit weight; this simplification is common in controlled parametric studies but would need to be relaxed for site-specific design. Groundwater was omitted so that the analysis isolates the seismic force effects under a single, controlled drainage condition; this is stated explicitly as a limitation in Section 7, since pore-pressure response is itself sensitive to the vertical seismic component and is a priority direction for follow-on work.

3.2. Seismic Loading Parameters

In the pseudo-static analysis, the effects of the horizontal forces alone and horizontal and vertical forces combined were examined. Vertical forces were analyzed in both upward and downward directions. Horizontal seismic coefficients (Kh) of 0.025, 0.05, 0.1, and 0.2 were considered, representing varying shaking intensities from mild to severe. For the PVA/PHA ratio, values of 0, 0.25, 0.50 and 1.0 were assumed, according to Sarma & Scorer [44]. The selected seismic force values are given in Table 2. For each PHA, the corresponding PVA/PHA ratio was applied to evaluate the impact of vertical seismic forces on slope stability.
The horizontal coefficients (Kh = 0.025–0.20) span the range typically associated with low-to-severe shaking intensity in regional seismic hazard practice. Kh is conventionally taken as a damped fraction of PGA/g rather than a 1:1 mapping—commonly of order 0.3–0.5 × PGA/g in design practice, as also adopted for the Daguangbao validation in Section 3.3—because the pseudo-static coefficient represents a time-averaged demand rather than the instantaneous peak acceleration. The PVA/PHA ratios (0, 0.25, 0.50, 1.0) follow the range recommended by Sarma & Scorer [44] and encompass the majority of far-field to moderate near-field conditions; however, as illustrated in the Introduction, some near-fault and blind-thrust events (e.g., the 2011 Christchurch earthquake, PVA/PHA ≈ 2.2) exceed this range. Extending the parametric matrix beyond PVA/PHA = 1.0 was outside the scope of the present study and is identified as a priority extension in Section 7.

3.3. Model Validation Using Daguangbao Landslide

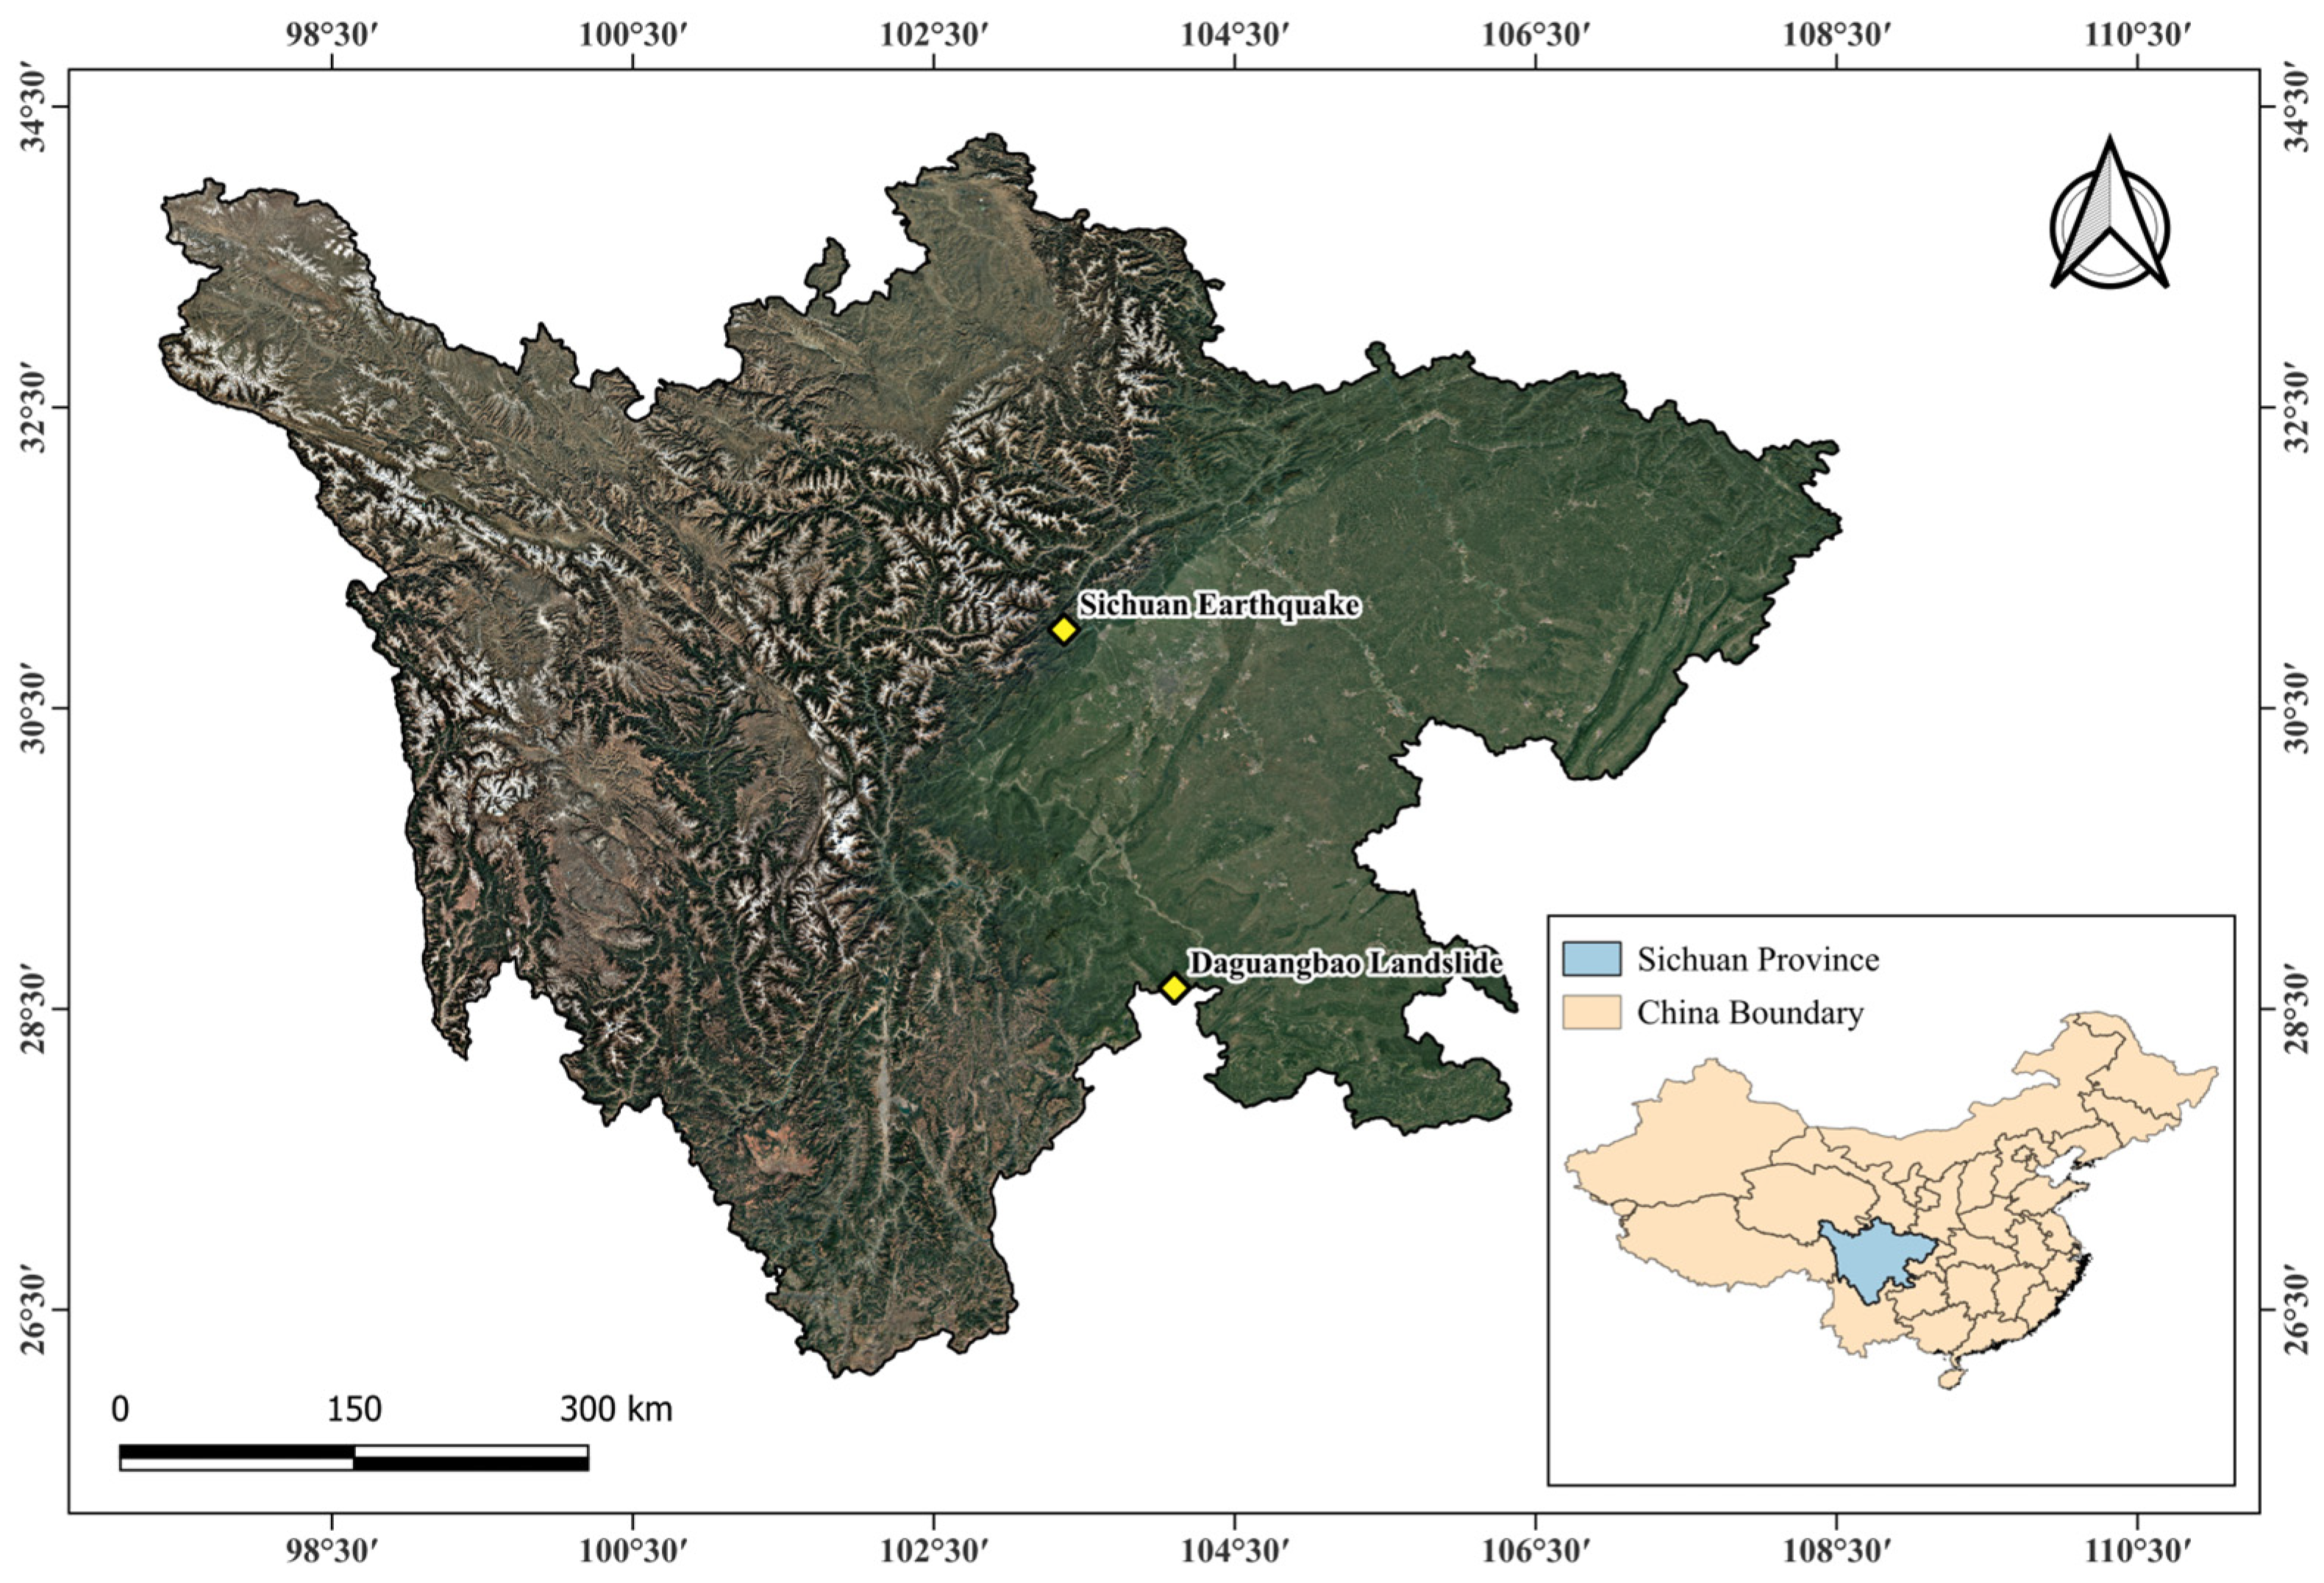
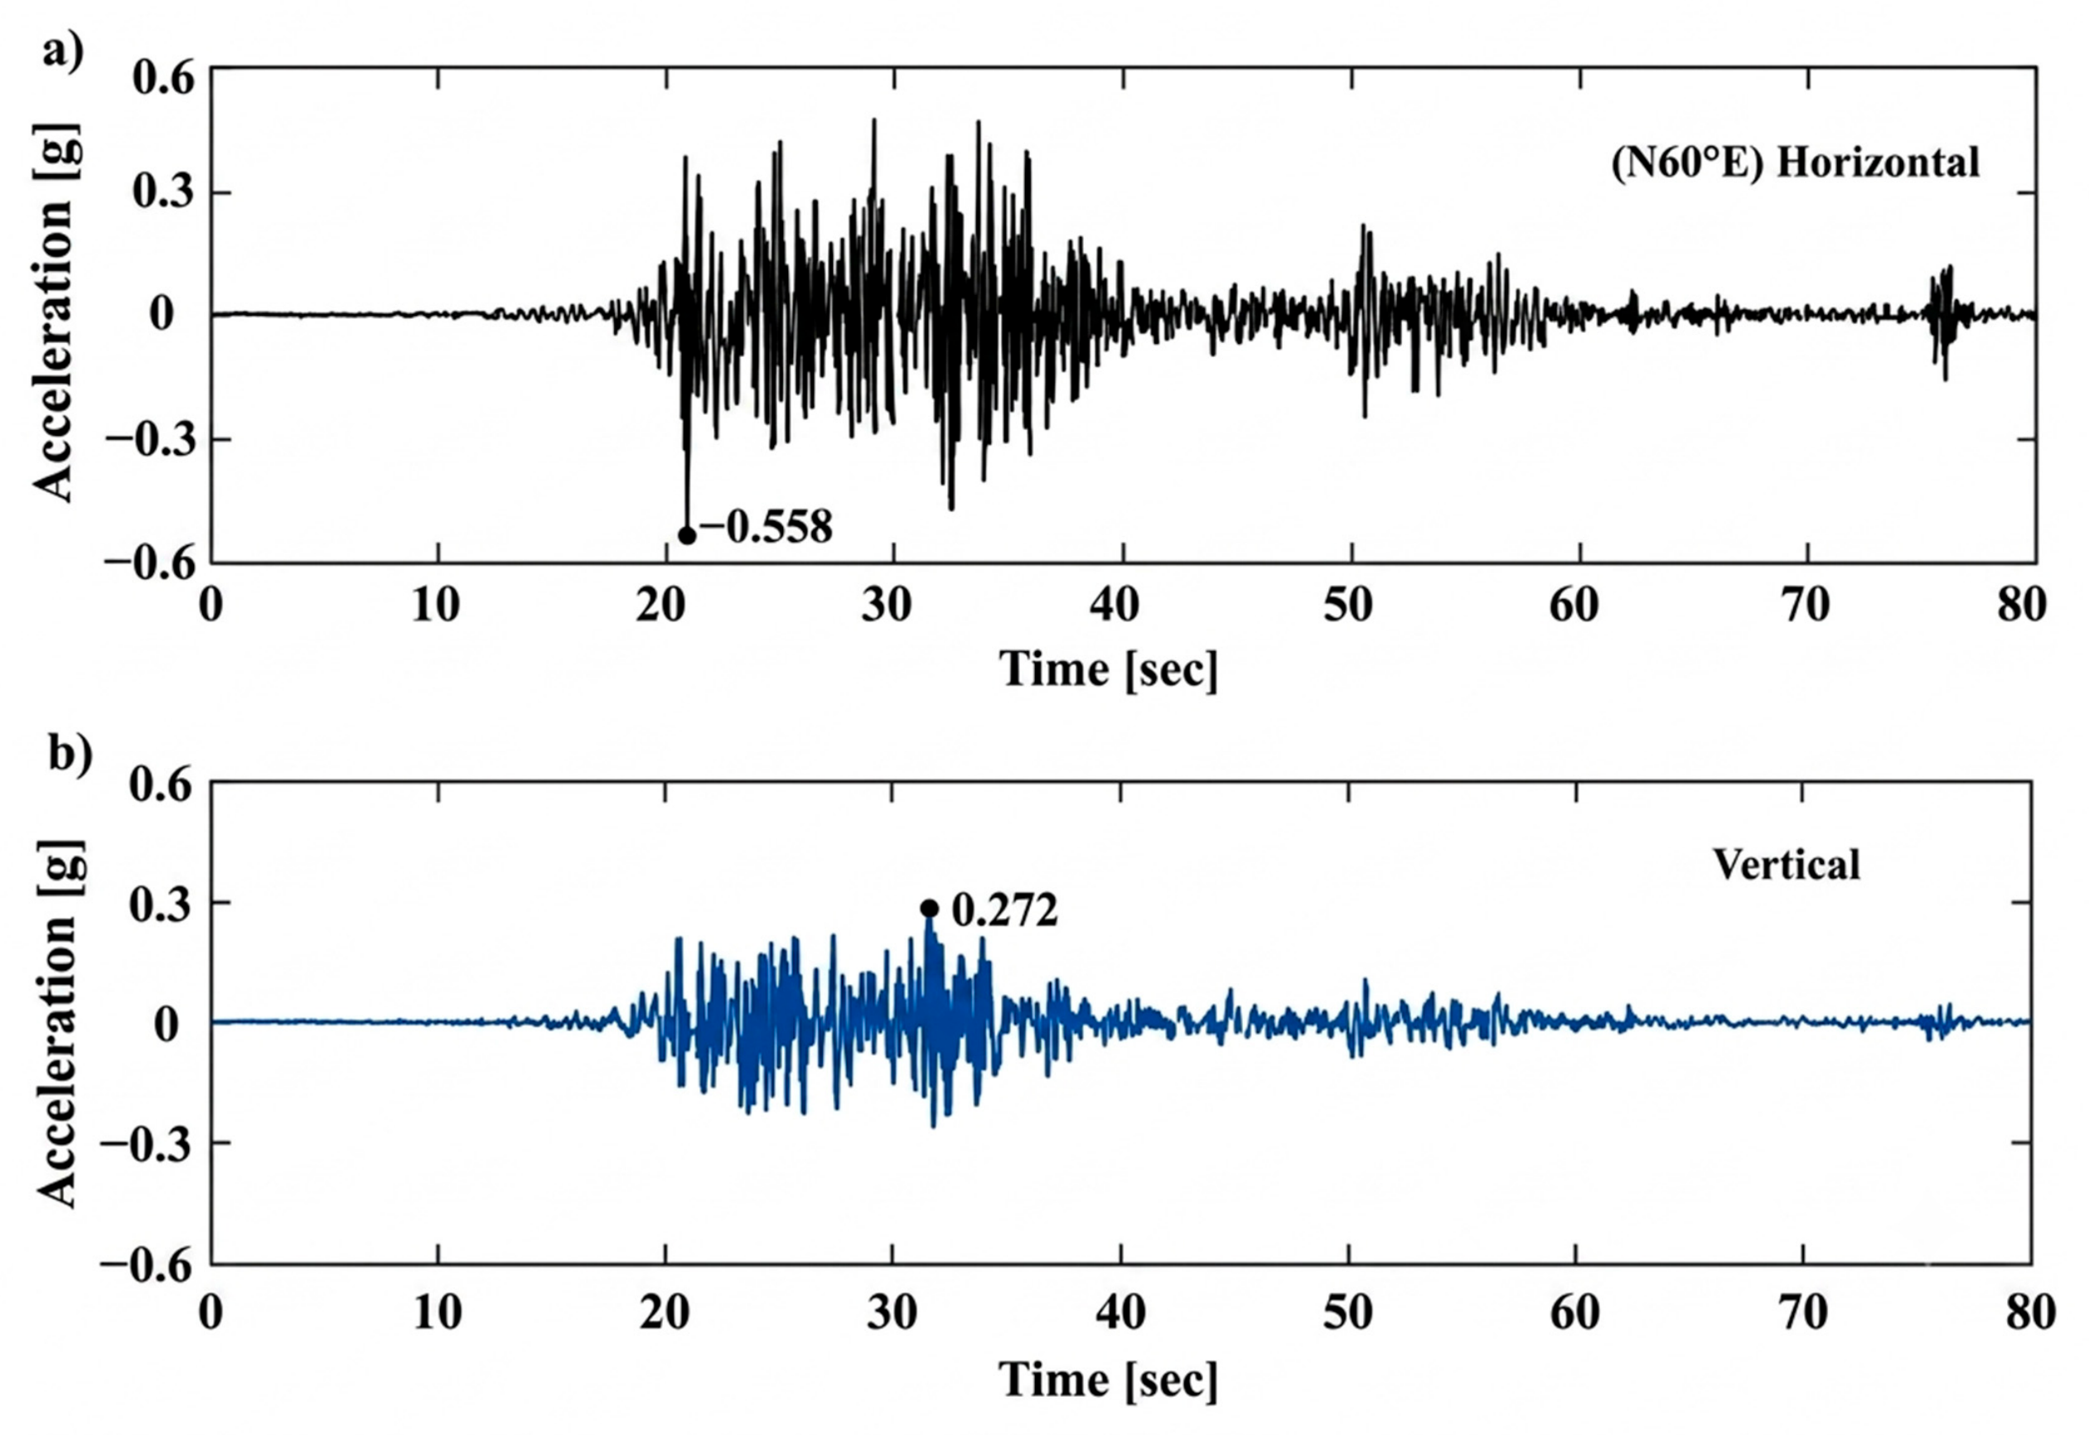
To validate the proposed research approach, the pseudo-static limit equilibrium model (PS-LEM) and pseudo-static finite element model (PS-FEM) were applied to the well-documented Daguangbao landslide, which occurred during the 2008 Mw 7.9 Sichuan earthquake [25]. Figure 4 shows the location of the Sichuan earthquake epicenter and the Daguangbao landslide. The earthquake struck approximately 80 km west-northwest of Chengdu along a 240 km long fault rupture, causing widespread destruction. The earthquake caused more than 60,000 landslides, making it one of the largest recorded earthquake-induced landslide events. Field observations revealed that tension failure played a significant role in the failure process of the Daguangbao landslide, as well as in many other large-scale landslides in the affected area. The closest maximum recorded horizontal and vertical accelerations were 0.558 g and 0.272 g, respectively, resulting in a PVA/PHA ratio close to 0.5. The time histories in the N60E horizontal and vertical directions are shown in Figure 5.
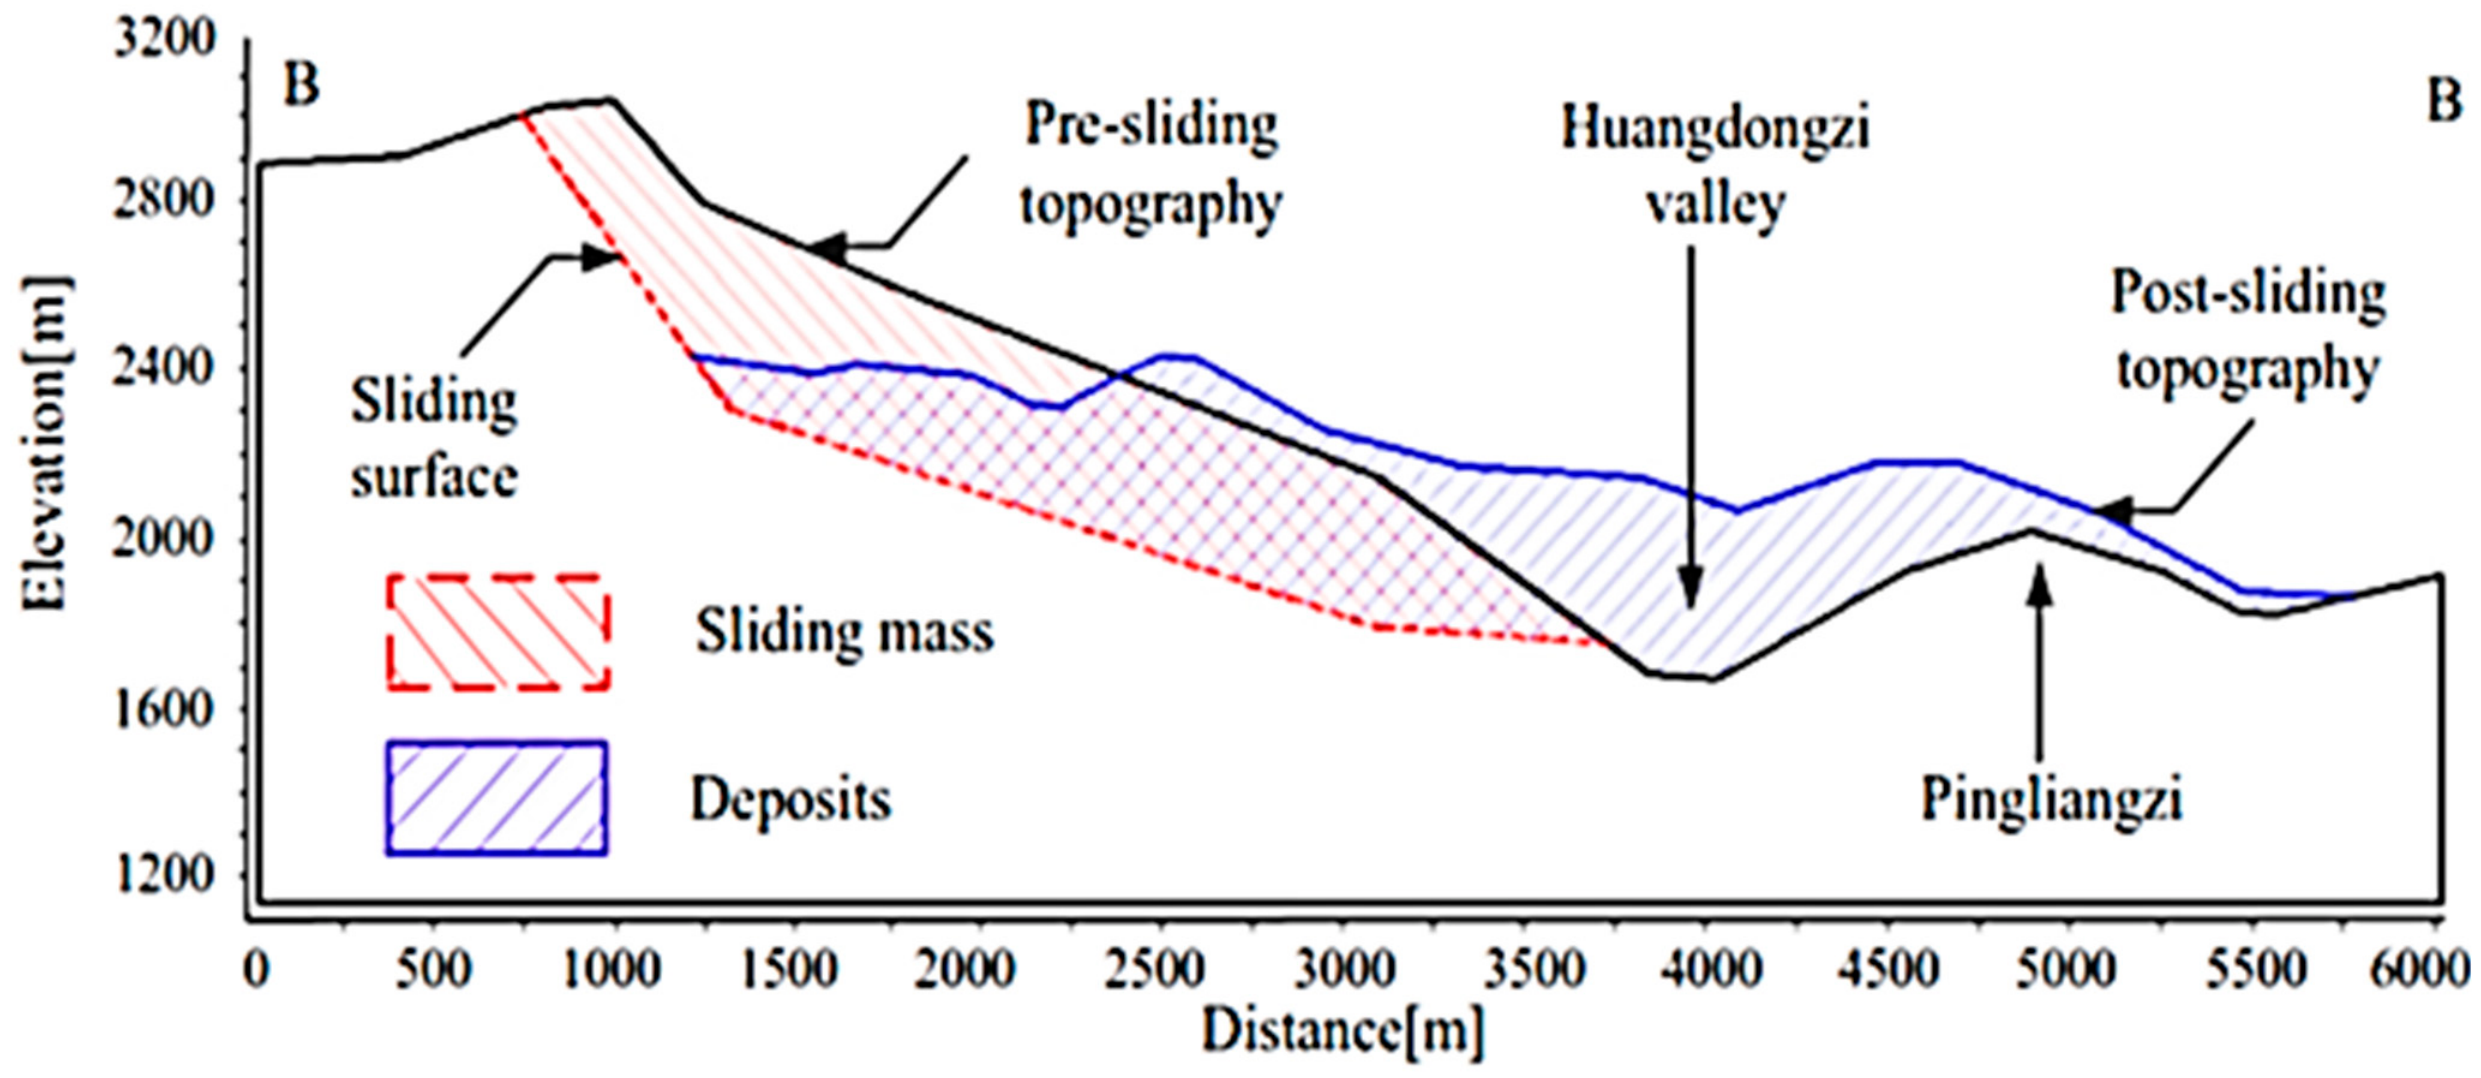
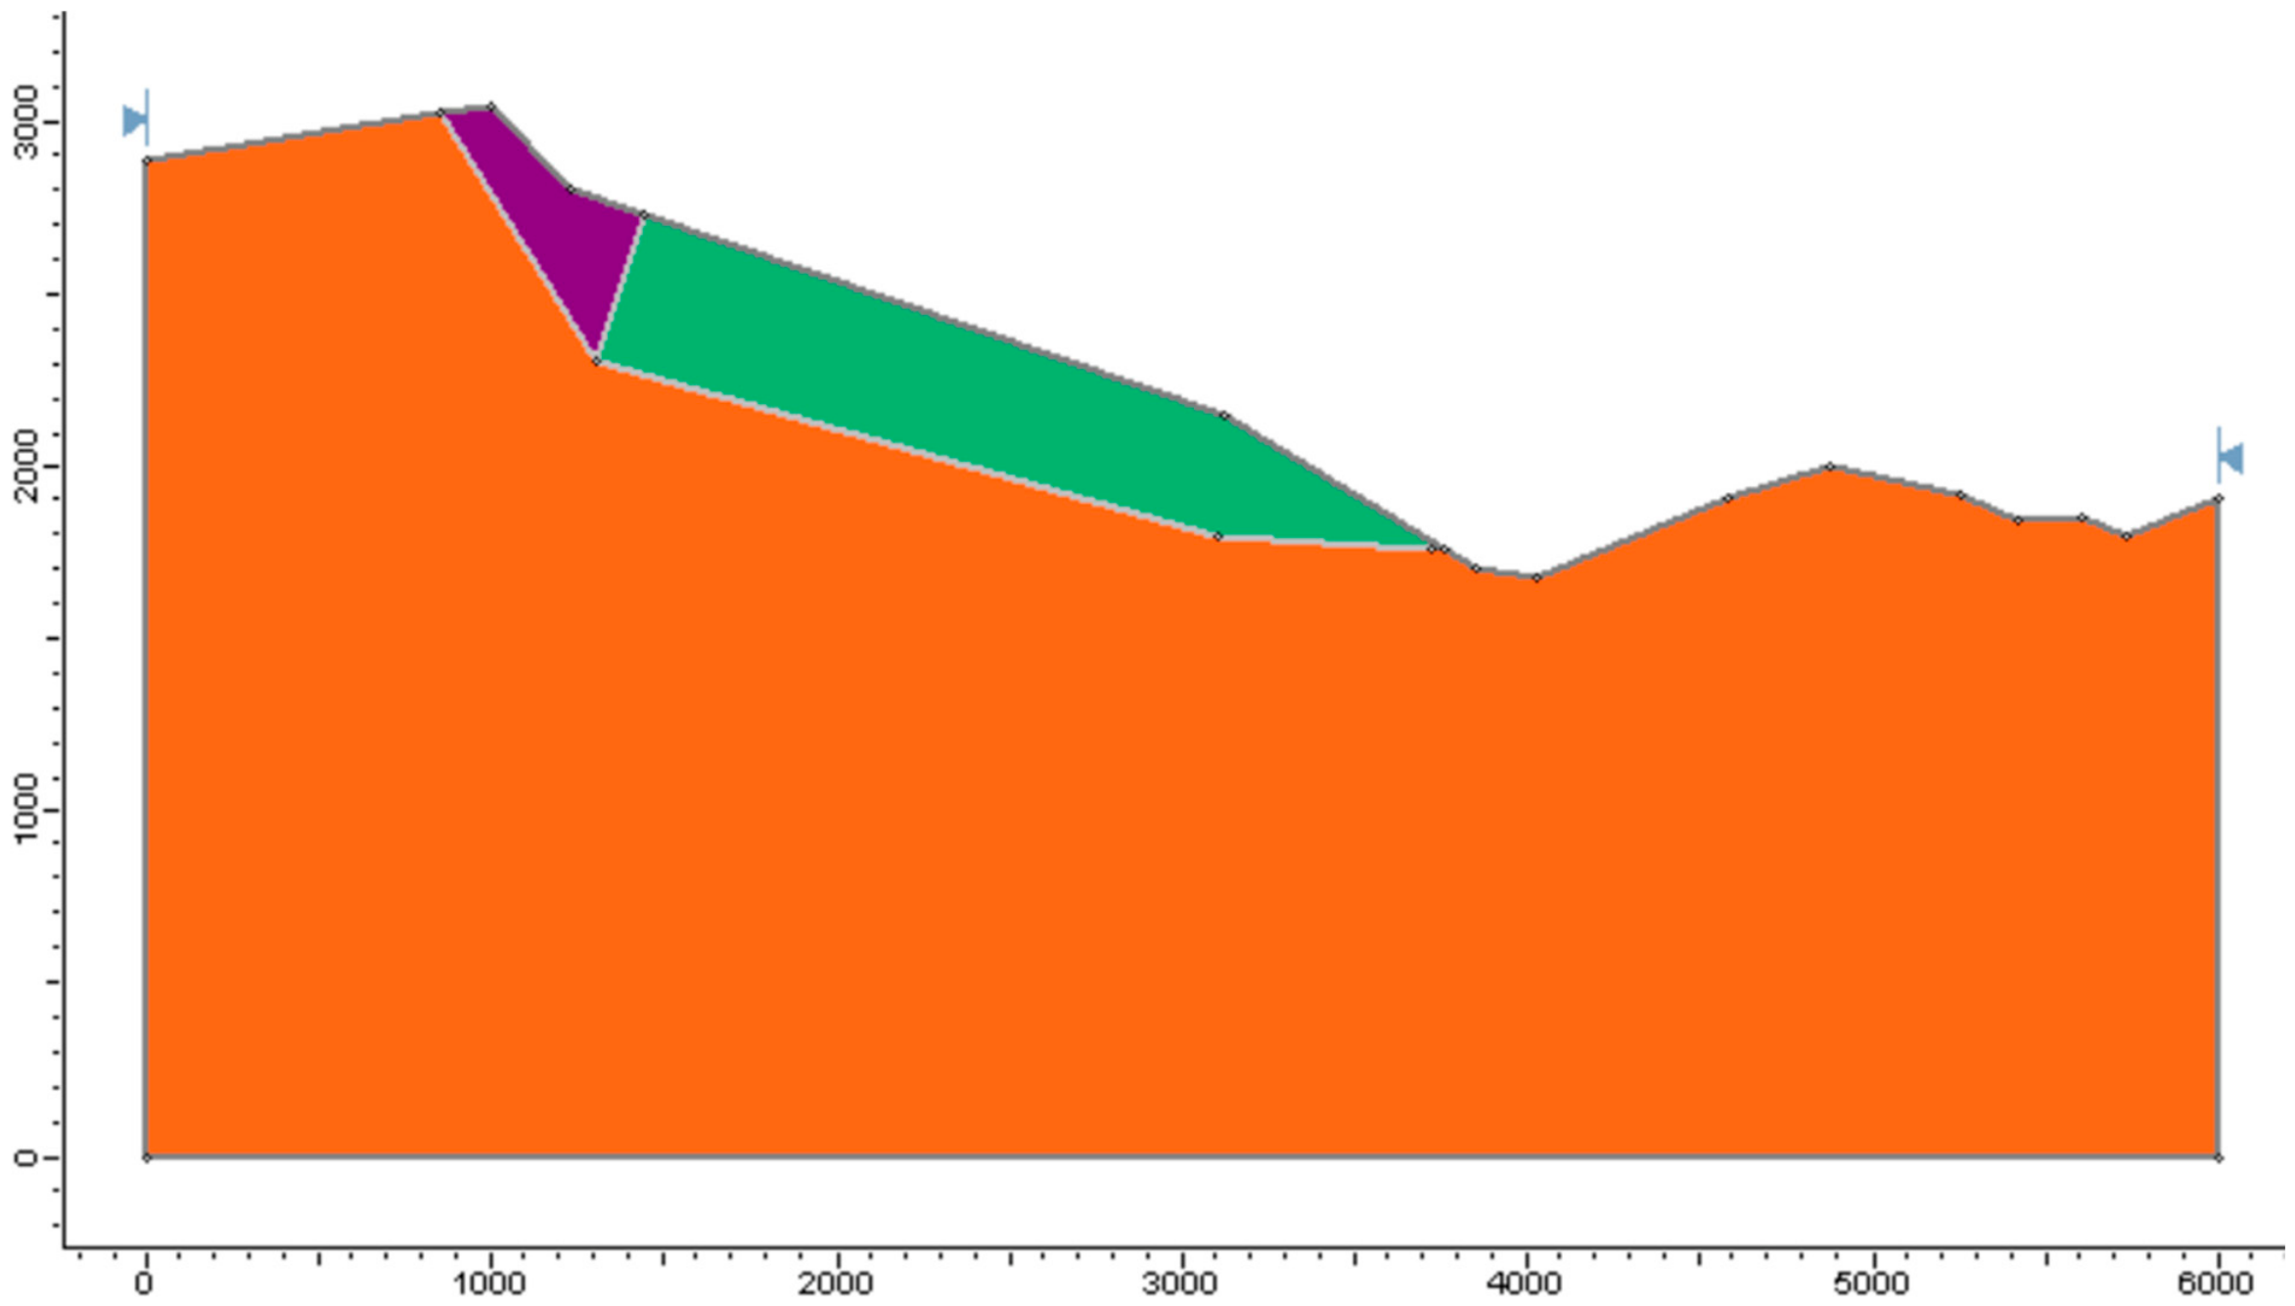
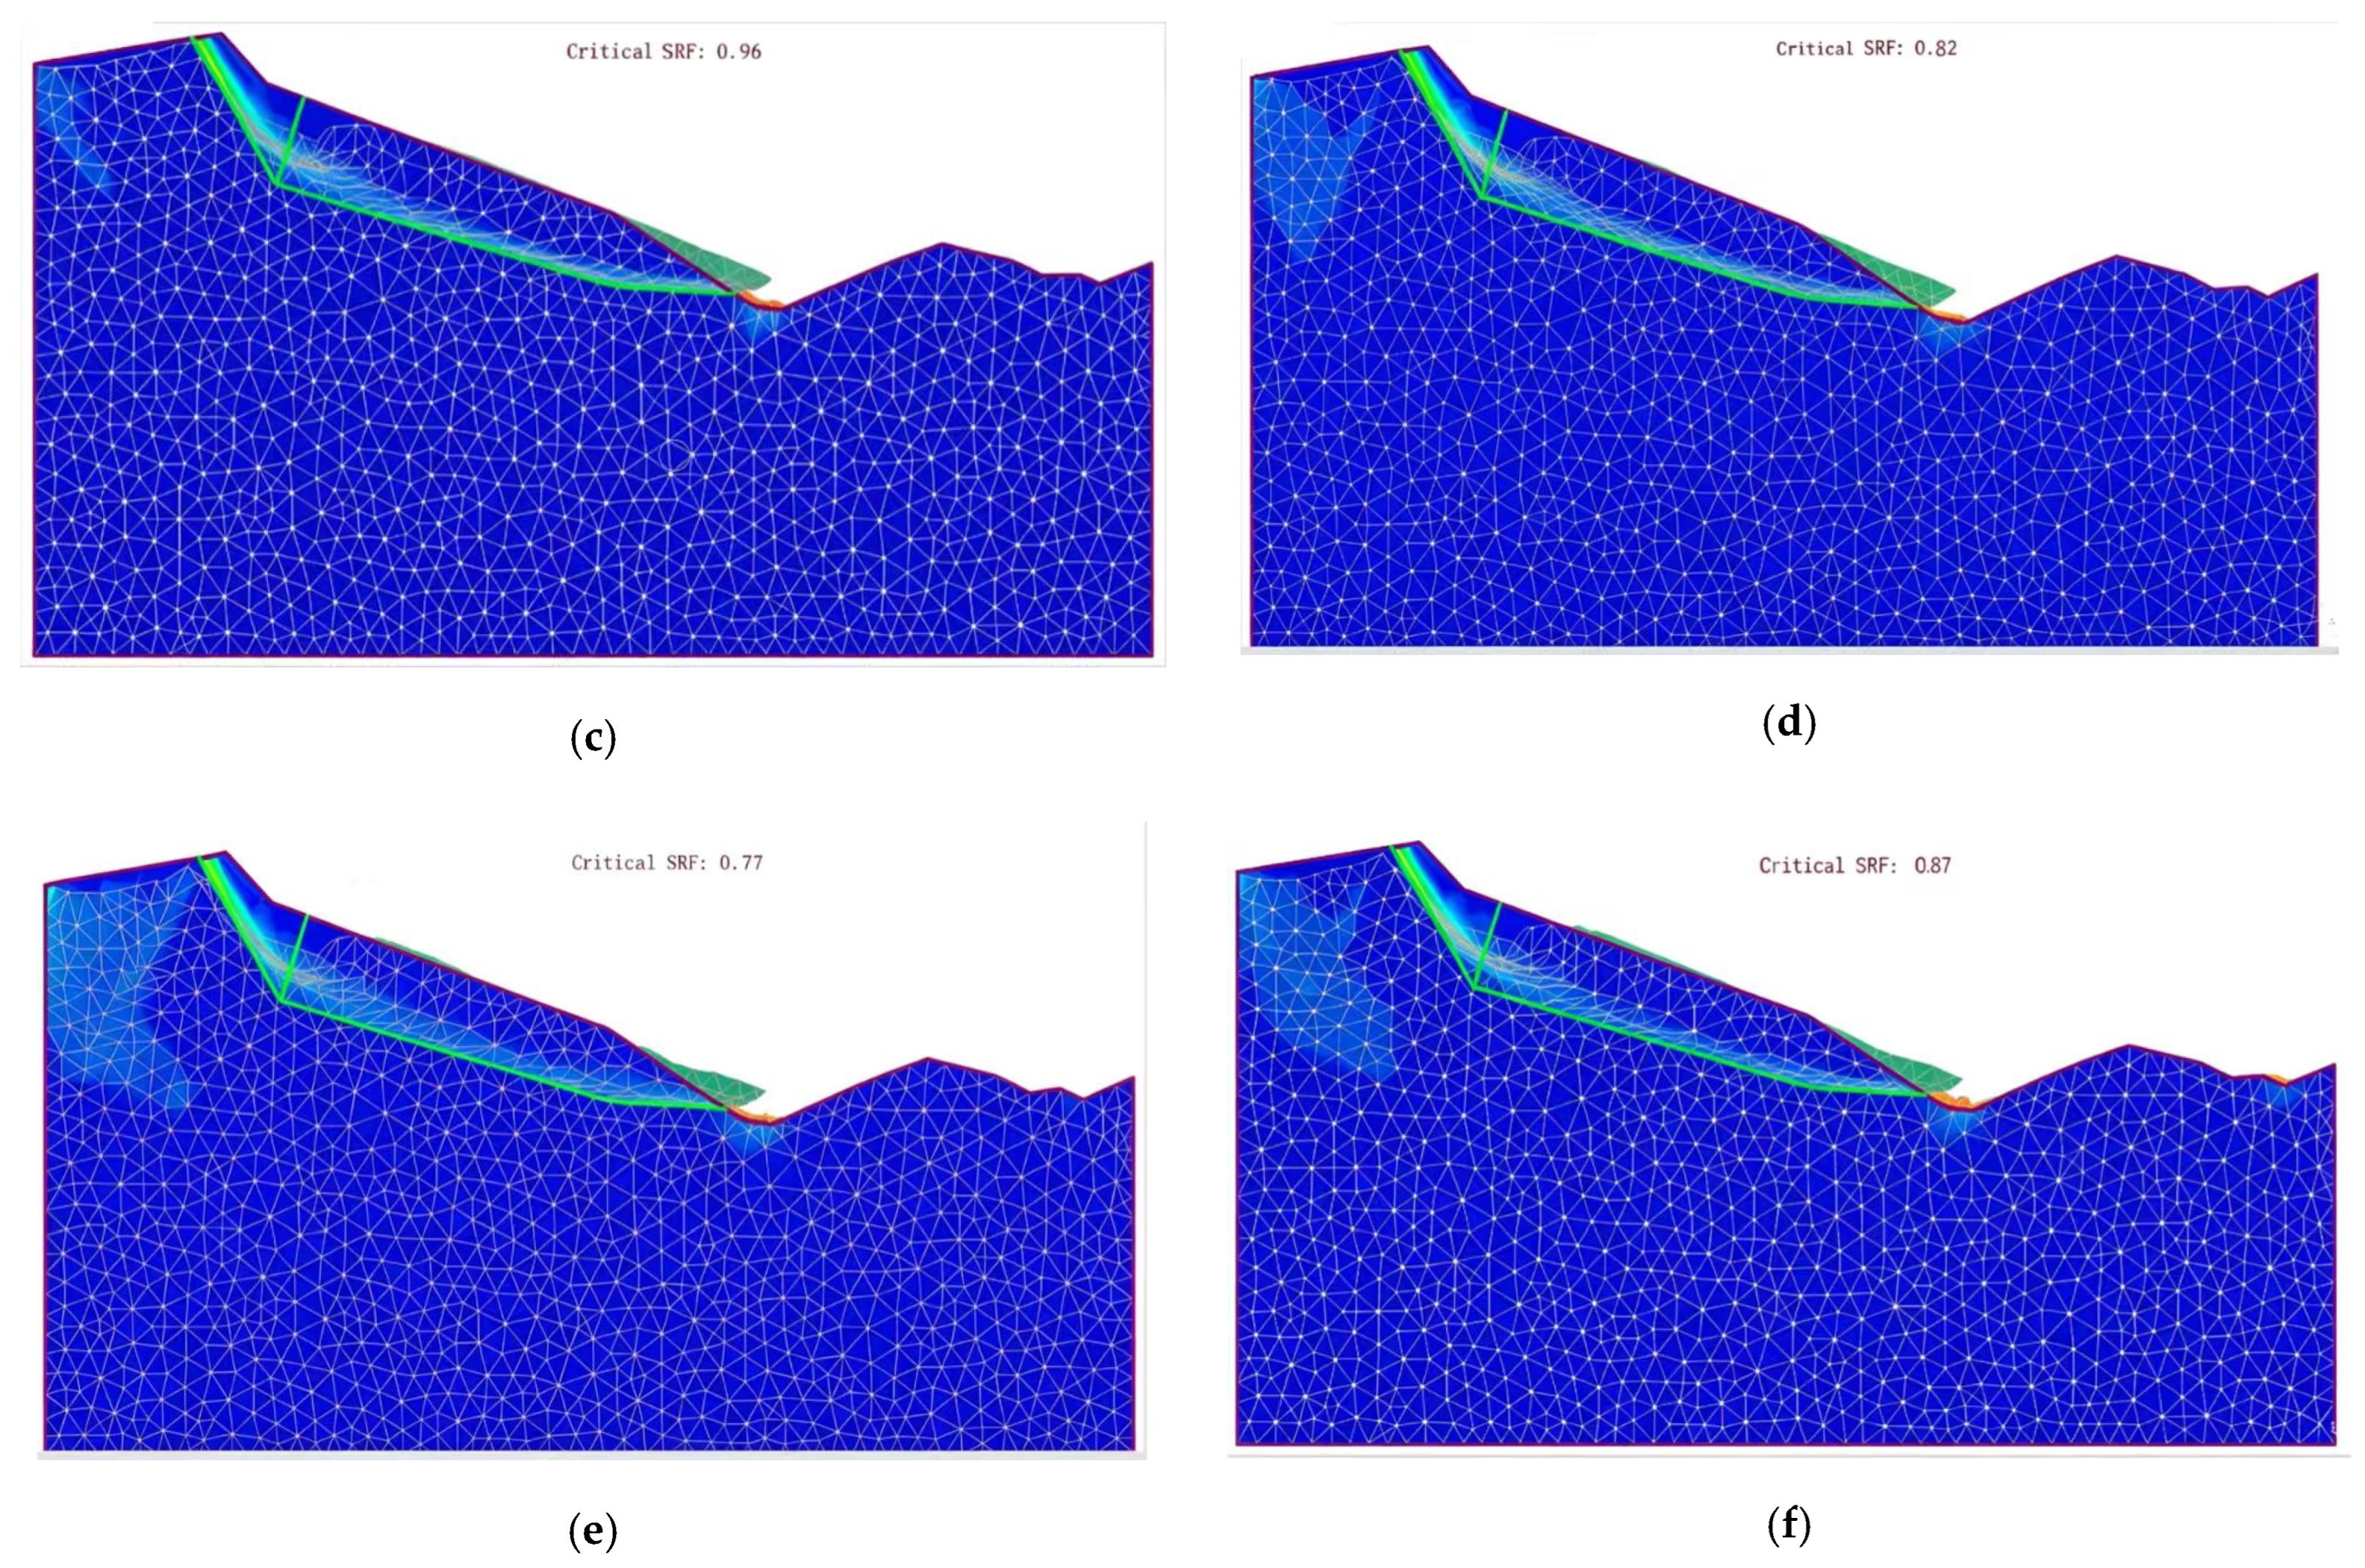
The pre- and post-failure surfaces of the Daguangbao landslide are shown in Figure 6. The model was analyzed using the PS-LEM (pseudo-static limit equilibrium method) and PS-FEM (pseudo-static finite element method), implemented through Slide2 (version 9.034) and RS2 (version 11.024) (Rocscience) software, respectively. Slide2 is widely used for limit equilibrium analysis of slopes, while RS2 is a robust tool for finite element analysis in geotechnical engineering. The finite element analysis employed the strength reduction method with elastic perfectly plastic material behavior. The model domain extended a minimum of one slope height beyond the toe and crest and to a depth of one slope height below the toe, following standard practice to minimize boundary effects on the computed failure surface. Horizontal displacements were restrained on the lateral boundaries (roller supports), and both horizontal and vertical displacements were restrained at the base (fixed support); the top and slope faces were left free. Consistent with the pseudo-static idealization—which represents the seismic force as a constant, time-invariant body force rather than a propagating wave—no damping was applied and no dynamic time-stepping was performed; the analysis is a series of static equilibrium solutions under incrementally applied gravity, horizontal, and vertical pseudo-static loads. The shear strength reduction (SSR) analysis reduced the shear strength parameters incrementally until numerical non-convergence was taken to indicate failure, using a convergence tolerance of 0.01 on the global unbalanced-force norm with a maximum of 500 iterations per strength-reduction increment; the reported FS corresponds to the critical strength reduction factor immediately preceding non-convergence. For a detailed analysis, the model was divided into 3000 finite elements, and the pseudo-static forces were applied to each element. A preliminary mesh sensitivity study confirmed that FS values varied by less than 1% between the 3000- and 5000-element meshes, confirming the adequacy of the adopted discretization. The seismic acceleration coefficient was selected as 0.3 PHA and 0.5 PHA of the earthquake motion, while the vertical-to-horizontal acceleration ratios were set to 0 and 0.5. The geometrical and geotechnical properties are detailed in Figure 7 and Table 3.

4. Factor of Safety Results

First, a static baseline analysis was conducted in the absence of seismic loading to verify the stability of the slopes. The FS under static conditions for the three slopes is given in Table 4. The results indicate that all the slopes are stable.
The pseudo-static slope stability analysis demonstrated that both horizontal (PHA) and vertical (PVA) seismic forces exert a significant impact on slope stability, as presented in Table 5. As the PHA increased from 0.025 to 0.200, FS consistently decreased across all the slope geometries, reflecting the destabilizing effect of intensified horizontal seismic forces. Downward PVA resulted in lower FS values compared to upward PVA for equivalent PVA/PHA ratios, indicating that downward vertical forces exacerbate instability by increasing the effective weight on the slope. Conversely, upward PVA provided a relative stabilizing effect by partially counteracting gravitational forces.
Among the three slope geometries (1:1.5, 1:2, and 1:3), the steepest slope (1:1.5) consistently exhibited the lowest FS values, indicating higher vulnerability to seismic forces. In contrast, the gentlest slope (1:3) maintained the highest FS, demonstrating superior resilience. Higher PVA/PHA ratios further reduced FS, with ratios approaching 1.0 inducing the most significant instability. These findings emphasize the importance of considering both horizontal and vertical seismic forces in slope stability analyses, particularly the destabilizing effects of downward PVA, to ensure robust slope designs in earthquake-prone areas.
The FS values in Table 5 form the quantitative basis for the three indicators introduced in Section 5. In particular, the consistent FS reduction under downward PVA directly motivates the FSRI; the differential sensitivity between slope geometries motivates the VSR; and the directional asymmetry motivates the AI.
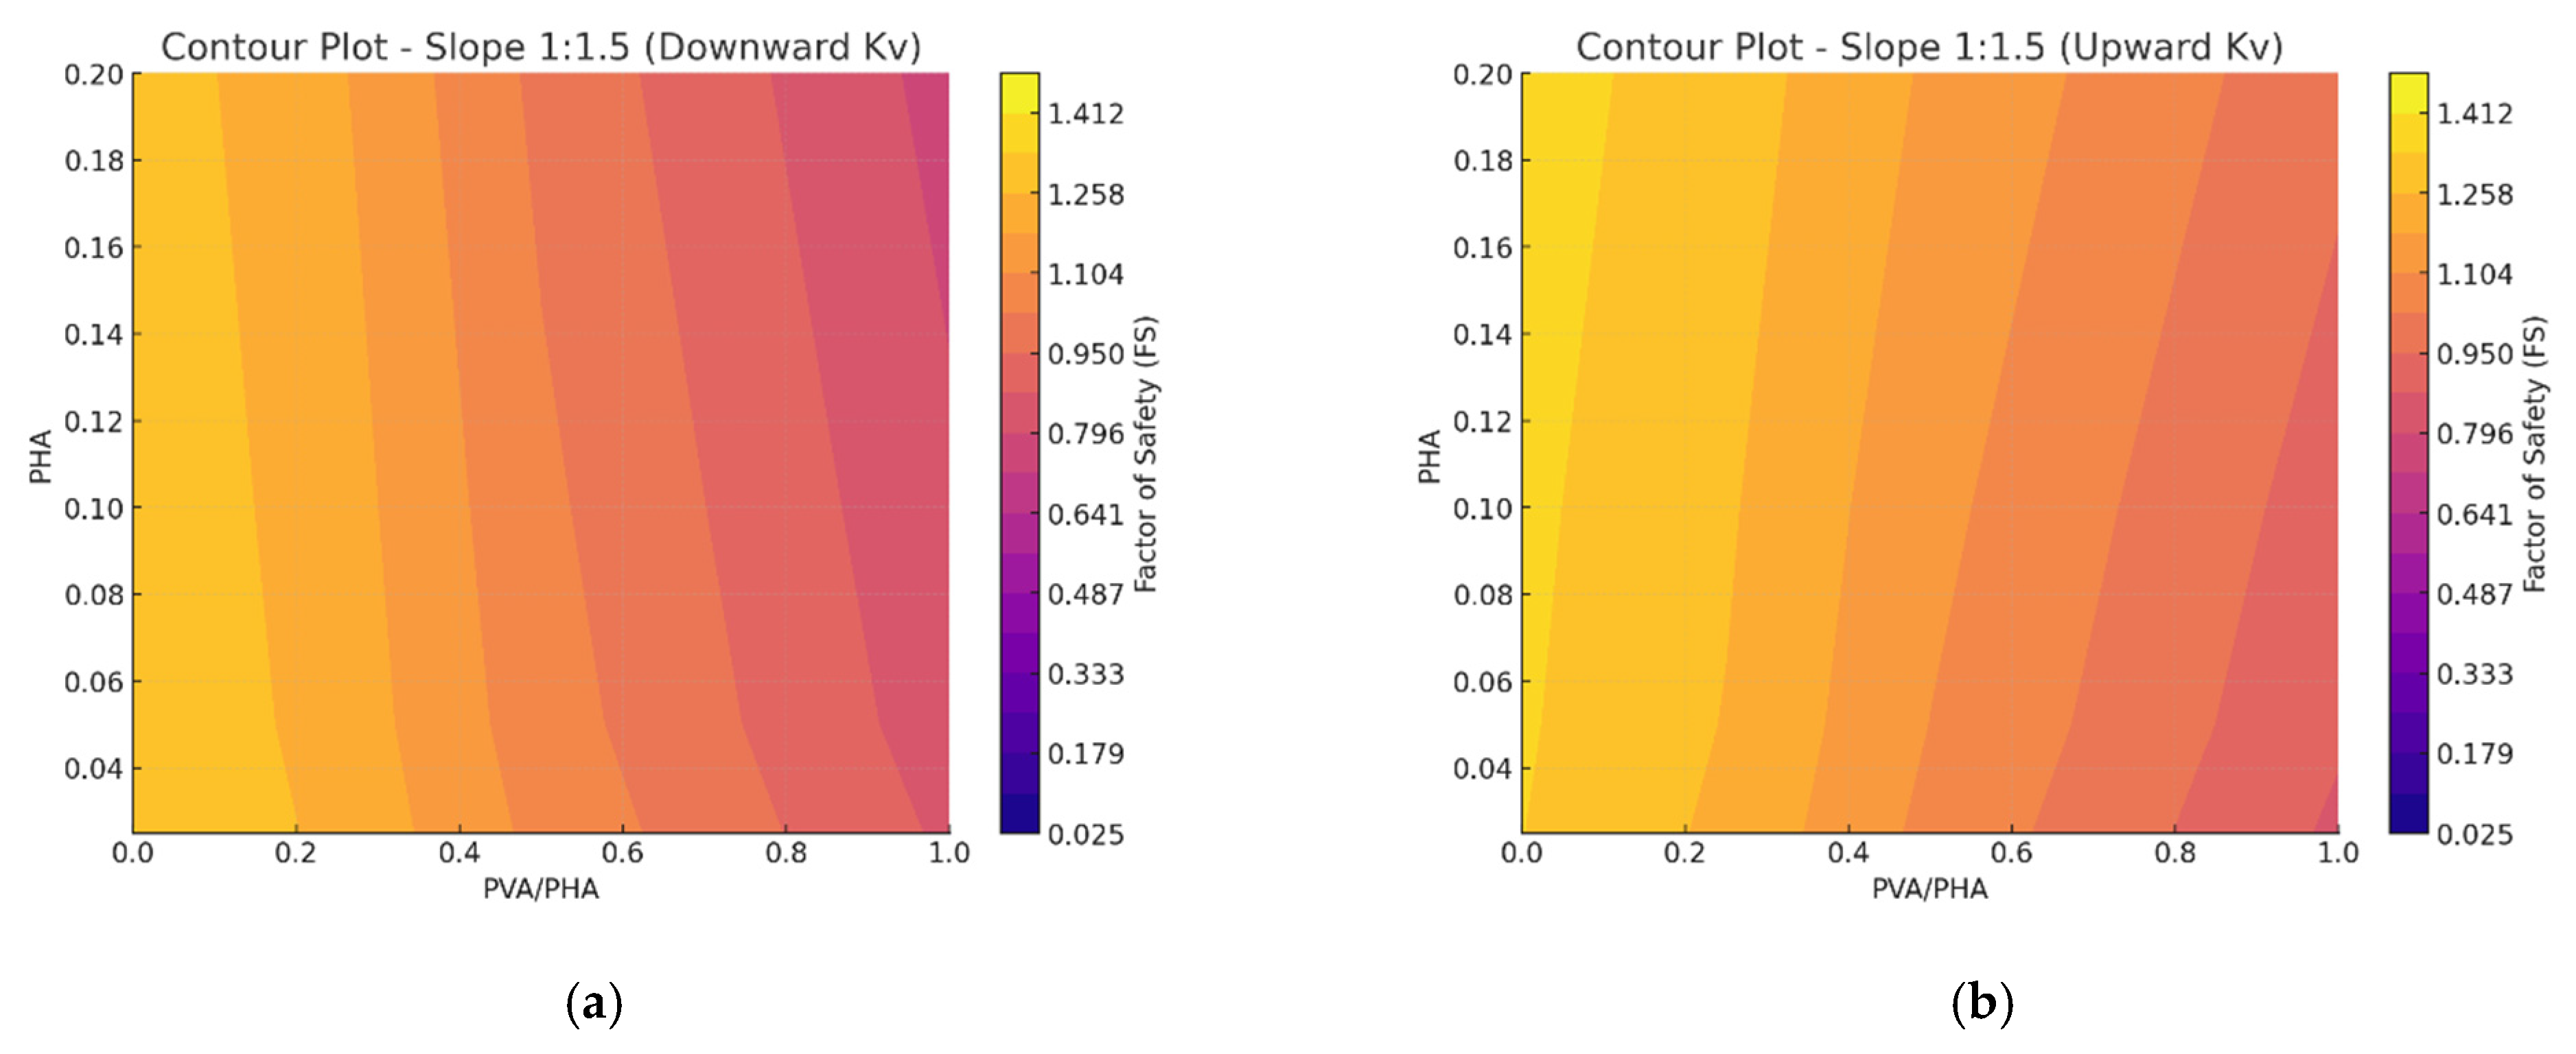
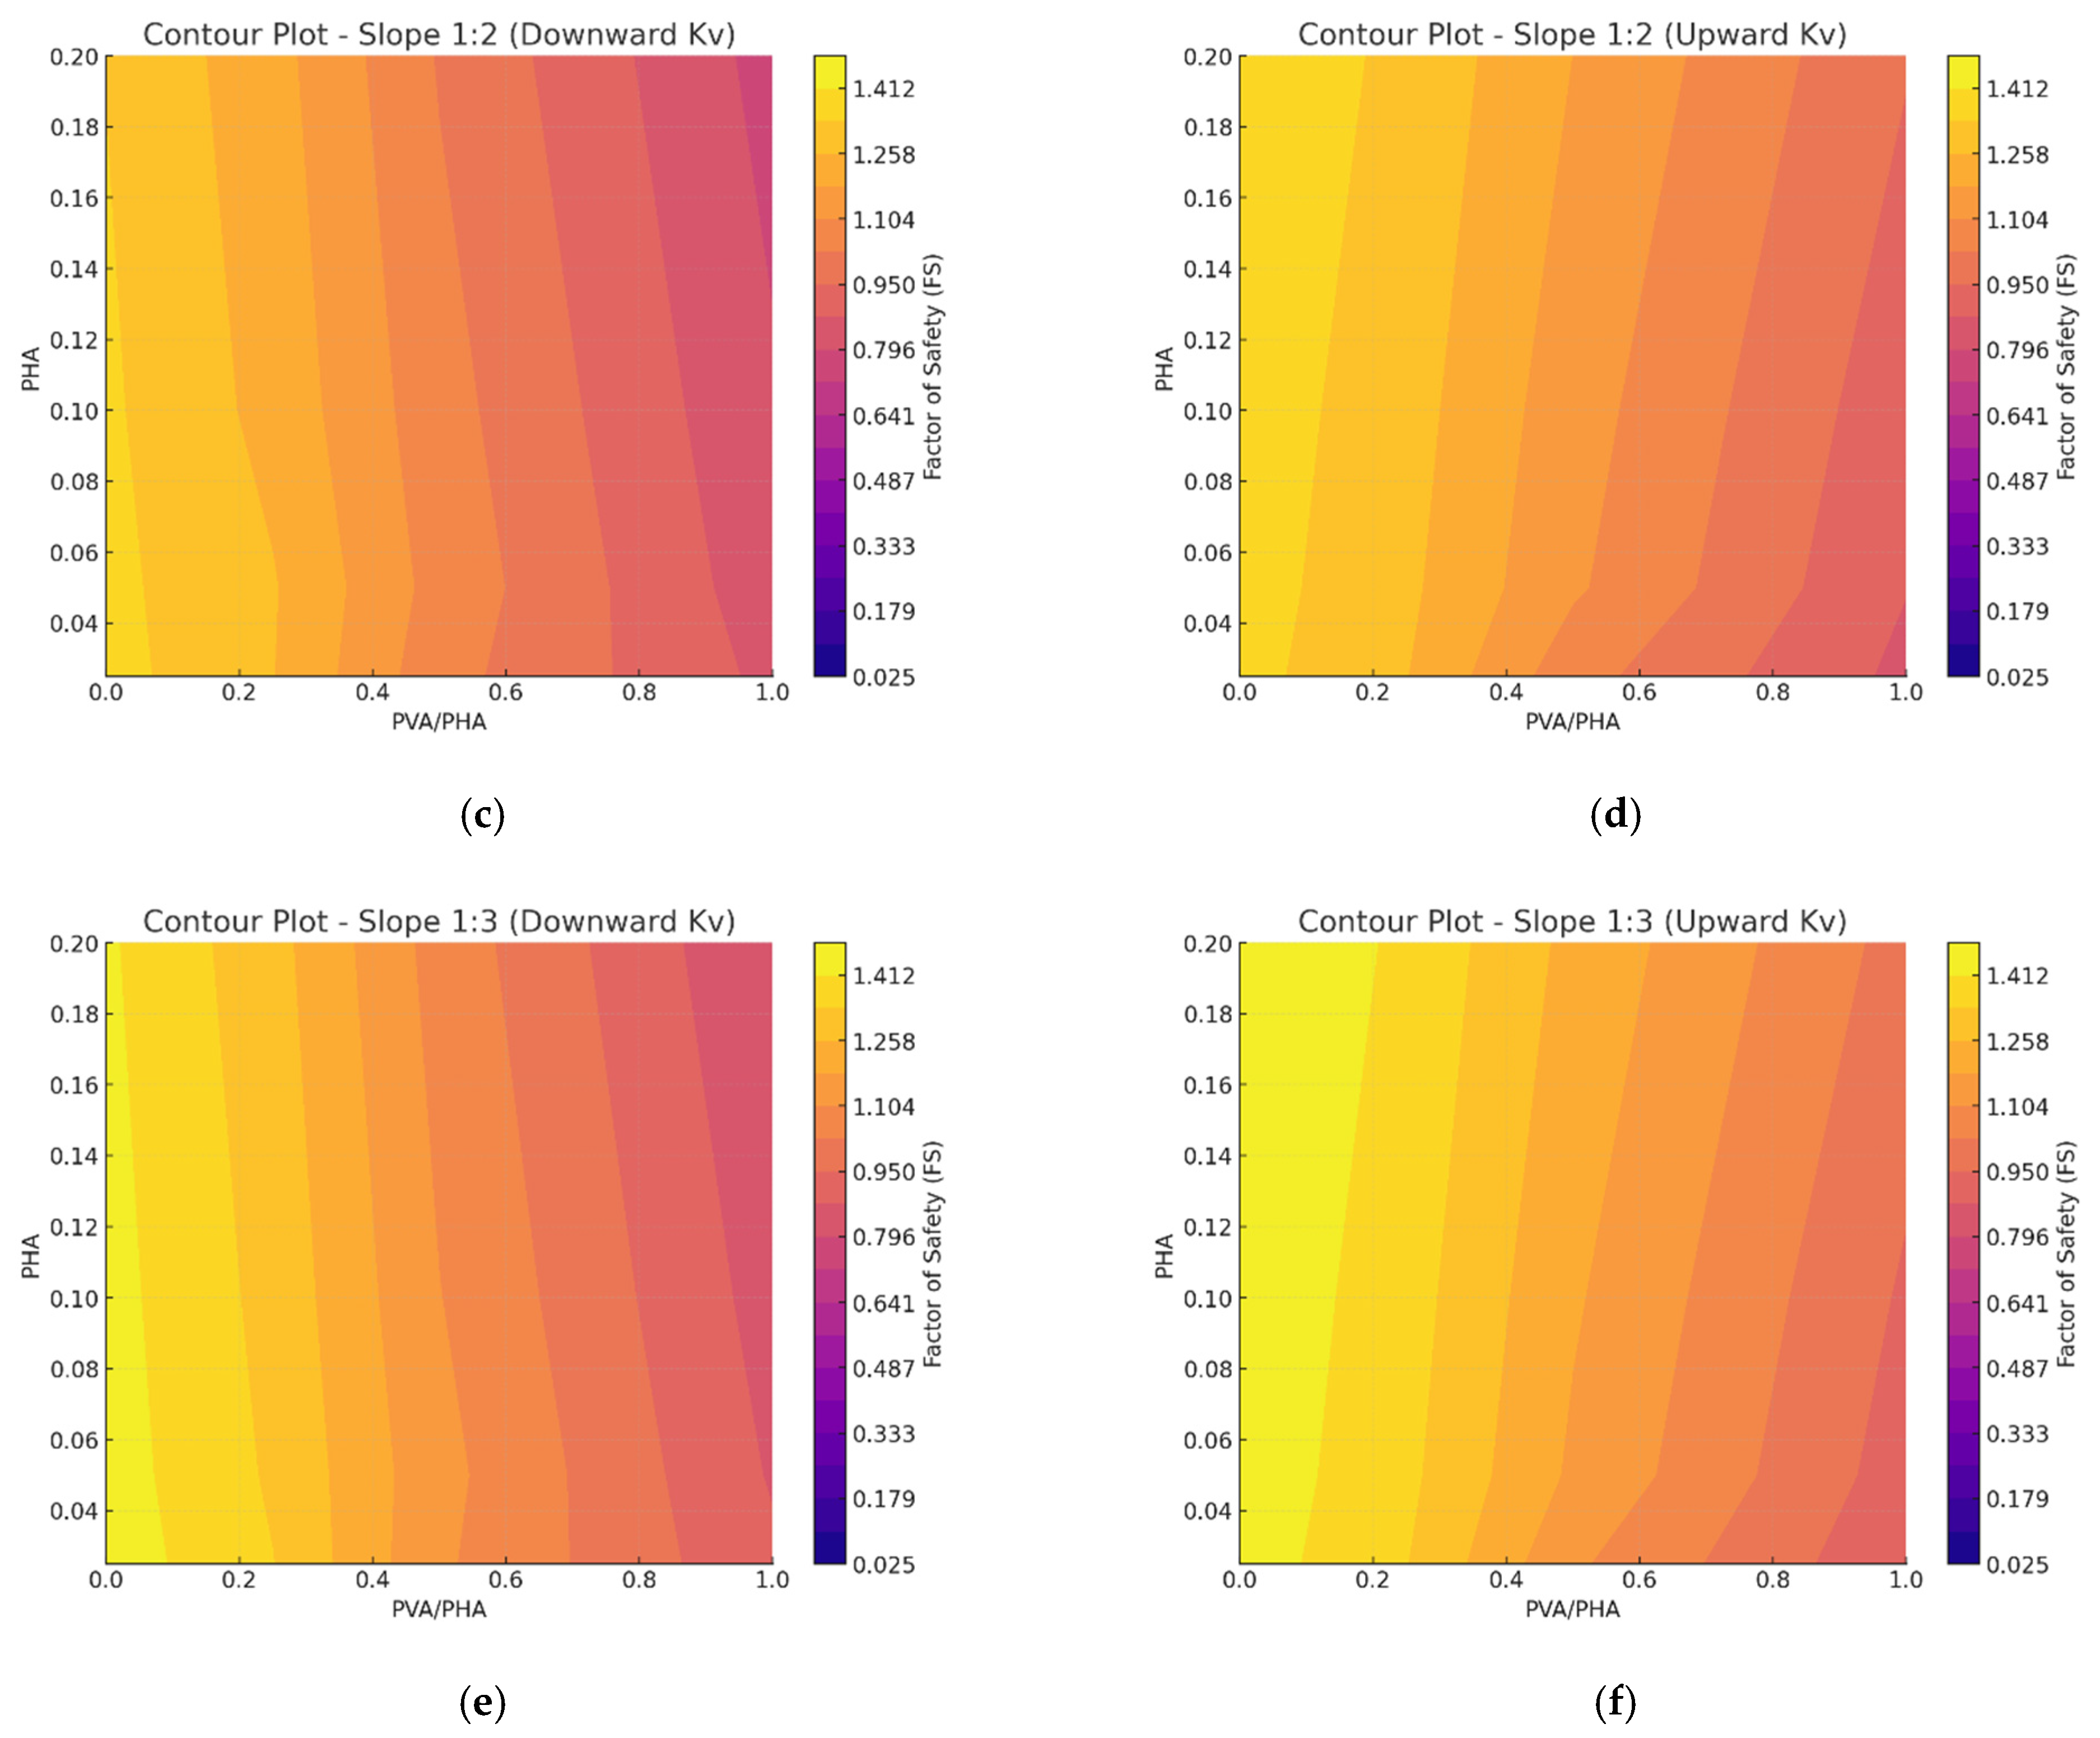
The contour plots in Figure 8 illustrate the variation in the factor of safety (FS) for three slope inclinations (1:1.5, 1:2, and 1:3) as a function of PVA/PHA ratios (ranging from 0 to 1.0) and peak horizontal acceleration (PHA) values (0.025 to 0.200). The analyses incorporate FS values computed for both upward and downward vertical seismic coefficients (Kv). The contours were generated by interpolating FS values over a discrete grid of PVA/PHA and PHA combinations, and a consistent color scale was applied across all the subplots to facilitate direct comparison. Smooth color gradients represent variations in FS, where darker shades indicate lower FS values and thus higher instability. The distinction between upward and downward Kv conditions is explicitly indicated in the subplot titles. Overall, the results demonstrate the coupled influence of horizontal and vertical seismic components on slope stability. A systematic reduction in FS is observed with increasing PHA and PVA/PHA ratio, indicating that stronger seismic loading and higher vertical-to-horizontal acceleration ratios adversely affect stability. This effect is more pronounced for steeper slopes (e.g., 1:1.5), which exhibit greater sensitivity to seismic loading compared to gentler slopes (e.g., 1:3).

5. Introduction of Analytic Parameters

Three quantitative indicators are introduced to convert the parametric FS dataset into practical design tools. Each is a normalized transformation of FS values already computed for the parametric matrix—a percentage change (FSRI), a sensitivity ratio (VSR), and a ratio of ratios (AI)—rather than a new physical mechanism or predictive model in its own right. Their contribution is therefore in the framework: combining three complementary lenses on the same underlying FS dataset into a single, purpose-built set of screening criteria for the horizontal/vertical seismic interaction problem, which is not, to the authors’ knowledge, available elsewhere in the pseudo-static slope-stability literature in this specific combination.

5.1. Factor of Safety Reduction Index (FSRI %)

The Factor of Safety Reduction Index quantifies the percentage change in FS attributable to the vertical seismic component relative to the horizontal-only loading case for the same Kh, as defined in Equation (6).
FSRI % = F S 0 F S v F S 0 × 100
A positive FSRI indicates destabilization, while a negative value denotes stabilization of the slope. The computed FSRI values are given in Table 6. A maximum destabilizing FSRI of +10.6% was observed for the 1:1.5 slope, under PHA = 0.20 and a downward PVA/PHA ratio of 1.0. Based on these results, the proposed FSRI screening criterion could be established. Namely, when Kh > 0.10 and PVA/PHA > 0.50, the FSRI consistently exceeds 3%, thereby warranting explicit inclusion of vertical seismic forces in the analysis. The 3% value is proposed as a practical signal-detection threshold rather than a statistically derived limit: it is set to exceed the FS variability typically introduced by routine parameter uncertainty in Su and unit weight for reclaimed or compacted fills (commonly reported coefficients of variation on the order of 10–30% for Su in fill materials), which can individually shift FS by a few percent even with no change in seismic loading. A change smaller than this noise floor cannot be confidently attributed to the vertical seismic component rather than to ordinary input uncertainty; 3% is therefore intended as a conservative, defensible lower bound for that distinction rather than a claim that FSRI values below 3% are engineering-insignificant in all the cases. It is also practically relevant because, near the code-mandated minimum FS for pseudo-static design (commonly FS = 1.1–1.2), a 3% reduction can be the difference between a passing and failing check. This threshold has not yet been validated against independent datasets or a formal statistical analysis, and is presented here as a preliminary, study-specific proposal; broader validation across additional soil types and site conditions is identified as a priority direction in Section 7.

5.2. Vertical Force Sensitivity Ratio (VSR)

The Vertical Force Sensitivity Ratio compares the rate of change in FS per unit increase in the vertical coefficient relative to the corresponding rate per unit increase in the horizontal coefficient, as defined in Equation (7).
VSR = Δ F S Δ K v Δ F S Δ K h
By definition, VSR > 1.0 would indicate that FS is more sensitive, per unit increase in seismic coefficient, to vertical than to horizontal loading; the values obtained in this study, presented in Table 7, remain well below this threshold (0.14–0.21), confirming that horizontal loading dominates FS sensitivity throughout the parameter range tested. For the 1:1.5 slope at Kh = 0.20, the VSR reaches its maximum observed value of ≈0.21 under downward loading. The VSR increases with both slope steepness and acceleration level, indicating that the relative—not just absolute—importance of vertical loading grows for steep slopes under high seismicity. Unlike FSRI, which reports the percentage FS change between two specific, discrete load cases, VSR is a marginal (derivative-type) sensitivity measure—the local rate of FS change with respect to Kv normalized by the corresponding rate with respect to Kh—providing a single, geometry-comparable index of how FS sensitivity is apportioned between the two loading directions, independent of the specific Kh or PVA/PHA pair used to compute it. This is complementary to, rather than redundant with, FS and FSRI: FS gives the absolute stability state for one load case, FSRI gives the percentage change between two specific cases, and VSR gives the underlying local sensitivity that generates both, making it the more natural quantity for comparing relative sensitivity across the three slope geometries on a common basis. Practitioners can use VSR to prioritize where accurate site-specific determination of PVA/PHA matters most: for a given increase in seismic demand, geometries with higher VSR see a proportionally larger share of that demand’s effect on FS coming from the vertical component, even where the horizontal component remains dominant in absolute terms.

5.3. Asymmetry Index (AI)

The Asymmetry Index formalizes the observed imbalance between destabilizing downward and stabilizing upward vertical forces, as defined in Equation (8).
AI = FSRI down FSRI up
By definition, AI > 1.0 indicates that the downward penalty exceeds the upward benefit in percentage-FS terms, whereas AI < 1.0 indicates the converse. The computed values in Table 8 show the opposite of what might be expected by default: AI remains below 1.0 for nearly every parameter combination, meaning the upward stabilizing benefit is generally slightly larger, in percentage-FS terms, than the downward destabilizing penalty produced by a vertical acceleration of equal magnitude. At low PVA/PHA ratio (0.25) and low Kh, the AI approaches 1.0, indicating near-symmetric behavior; as loading intensifies, AI for the 1:1.5 and 1:2 slopes fall toward 0.8–0.9, indicating a modestly widening gap between the two directions, still in favor of the upward case. This asymmetry follows directly from the mechanics of Equations (4) and (5) under the undrained (φ = 0) strength characterization used throughout this study (Table 1): because FS varies as C/D, where D = (WFv)sinβ + Fhcosβ is the driving term, a symmetric physical perturbation ±ΔD produces an inherently asymmetric percentage change in FS: reducing D (upward case) increases 1/D proportionally more than an equal increase in D (downward case) decreases it. This is a general property of reciprocal (C/D-type) formulations and does not require a geometry-specific curvature explanation. It also means the present AI values are specific to the purely undrained (φ = 0) case; extending the framework to effective-stress soils, where the (WFv)cosβtanφ term in the numerator would also respond to Fv, could shift or even reverse this balance, and is identified as a priority extension in Section 7. The value originally reported for the 1:2 slope (PVA/PHA = 1.0, Kh = 0.20) has been corrected from AI = 0.27 to AI = 0.86; the corrected value falls in line with the rest of the dataset and no longer requires a separate geometry-specific explanation. The persistent, if modest, directional asymmetry nonetheless underscores the necessity of explicitly evaluating both loading directions rather than assuming symmetry, since FS itself—as opposed to its percentage change—is always lower under downward loading than under upward loading of the same magnitude at every parameter combination tested.

6. Finite Element Analysis for Validation

The FSs derived from the limit equilibrium method (LEM) and finite element method (FEM) are presented in Table 9. In the static case, the slope remained stable with factors of safety of 1.13 and 1.33 from LEM and FEM, respectively. However, once seismic forces were introduced in the Pseudo-static (PS) analysis, both methods indicated slope instability, with factors of safety dropping below 1, signifying potential failure.
Under static conditions, the Daguangbao slope exhibited factors of safety of 1.13 (PS-LEM) and 1.33 (PS-FEM), confirming marginal stability before the earthquake. Once seismic forces were introduced, both methods indicated potential failure (FS < 1.0) at PHA values representative of the recorded ground motion. The higher static FS from PS-FEM reflects the strength-reduction framework’s capacity to capture progressive yielding. The agreement between both methods under seismic loading, and the correspondence of the predicted failure surface with the observed post-earthquake scar (Figure 9), validates the proposed pseudo-static approach for combined horizontal and vertical seismic loading.
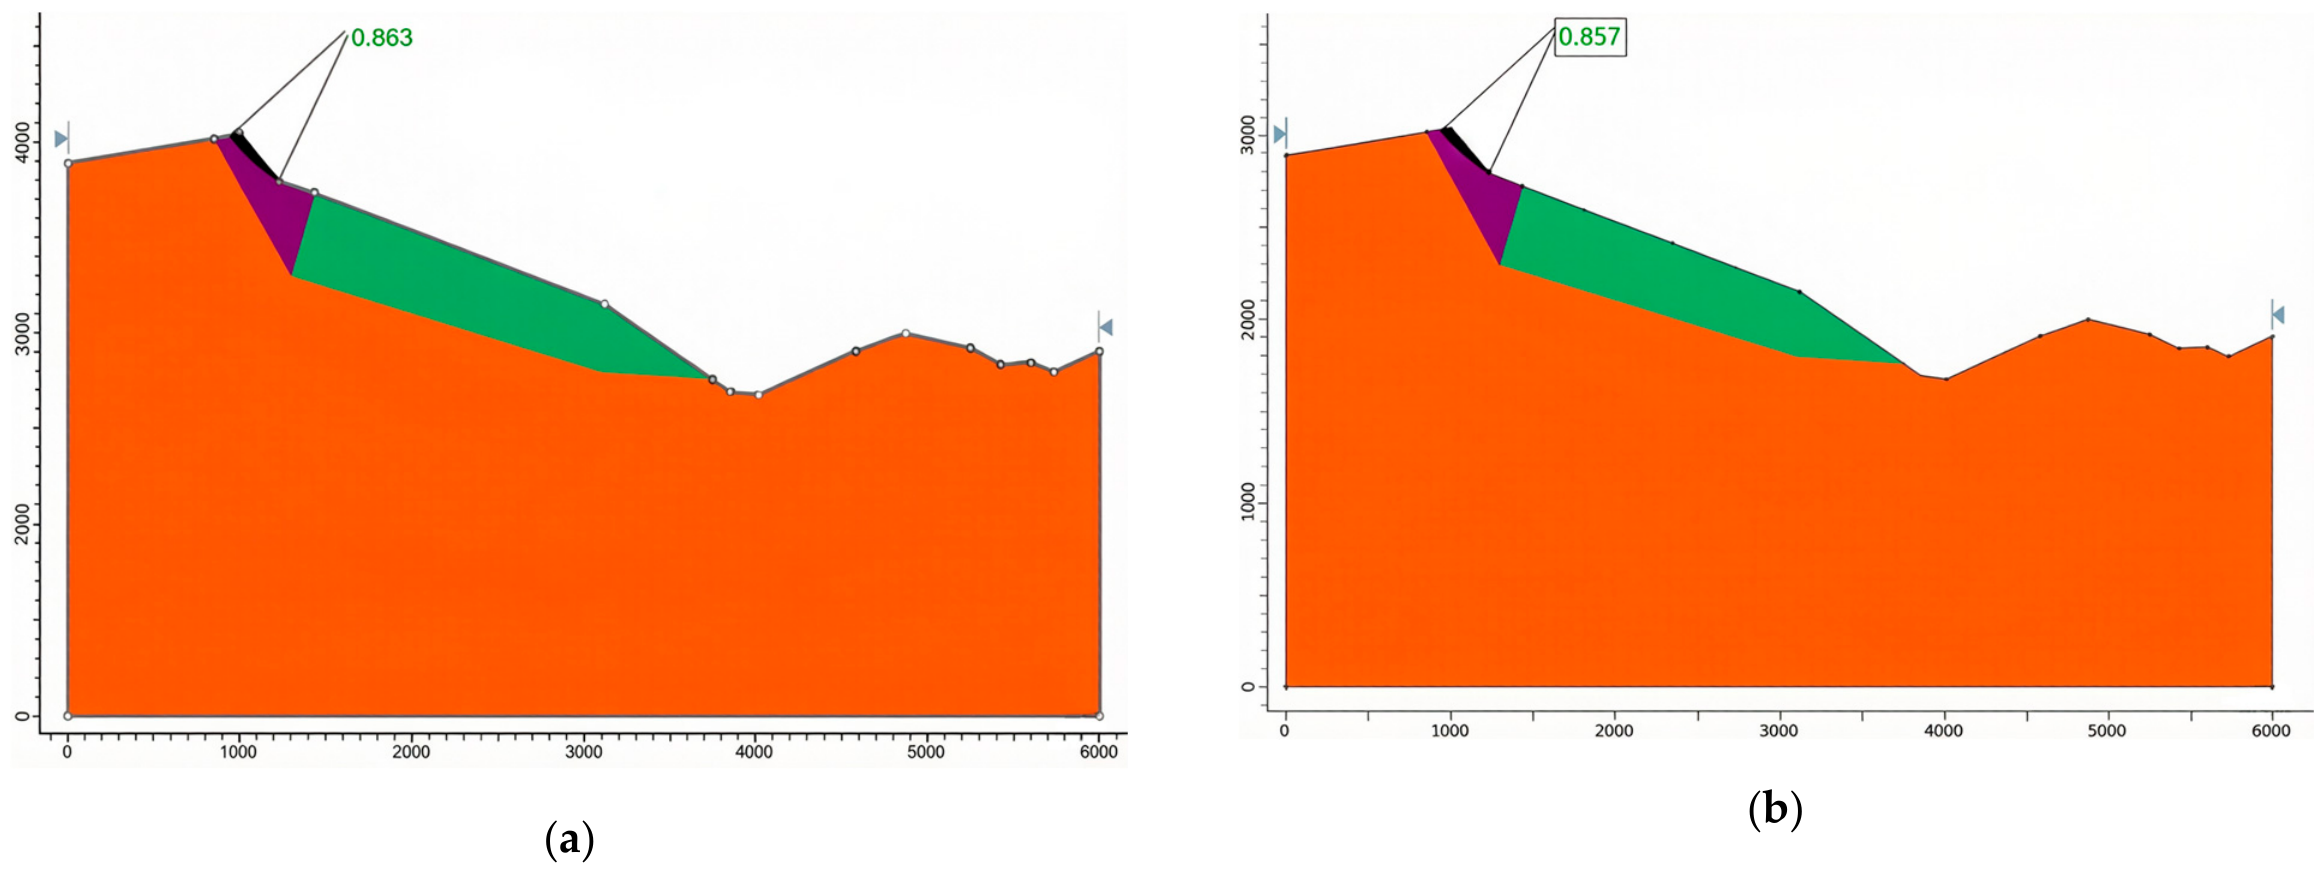
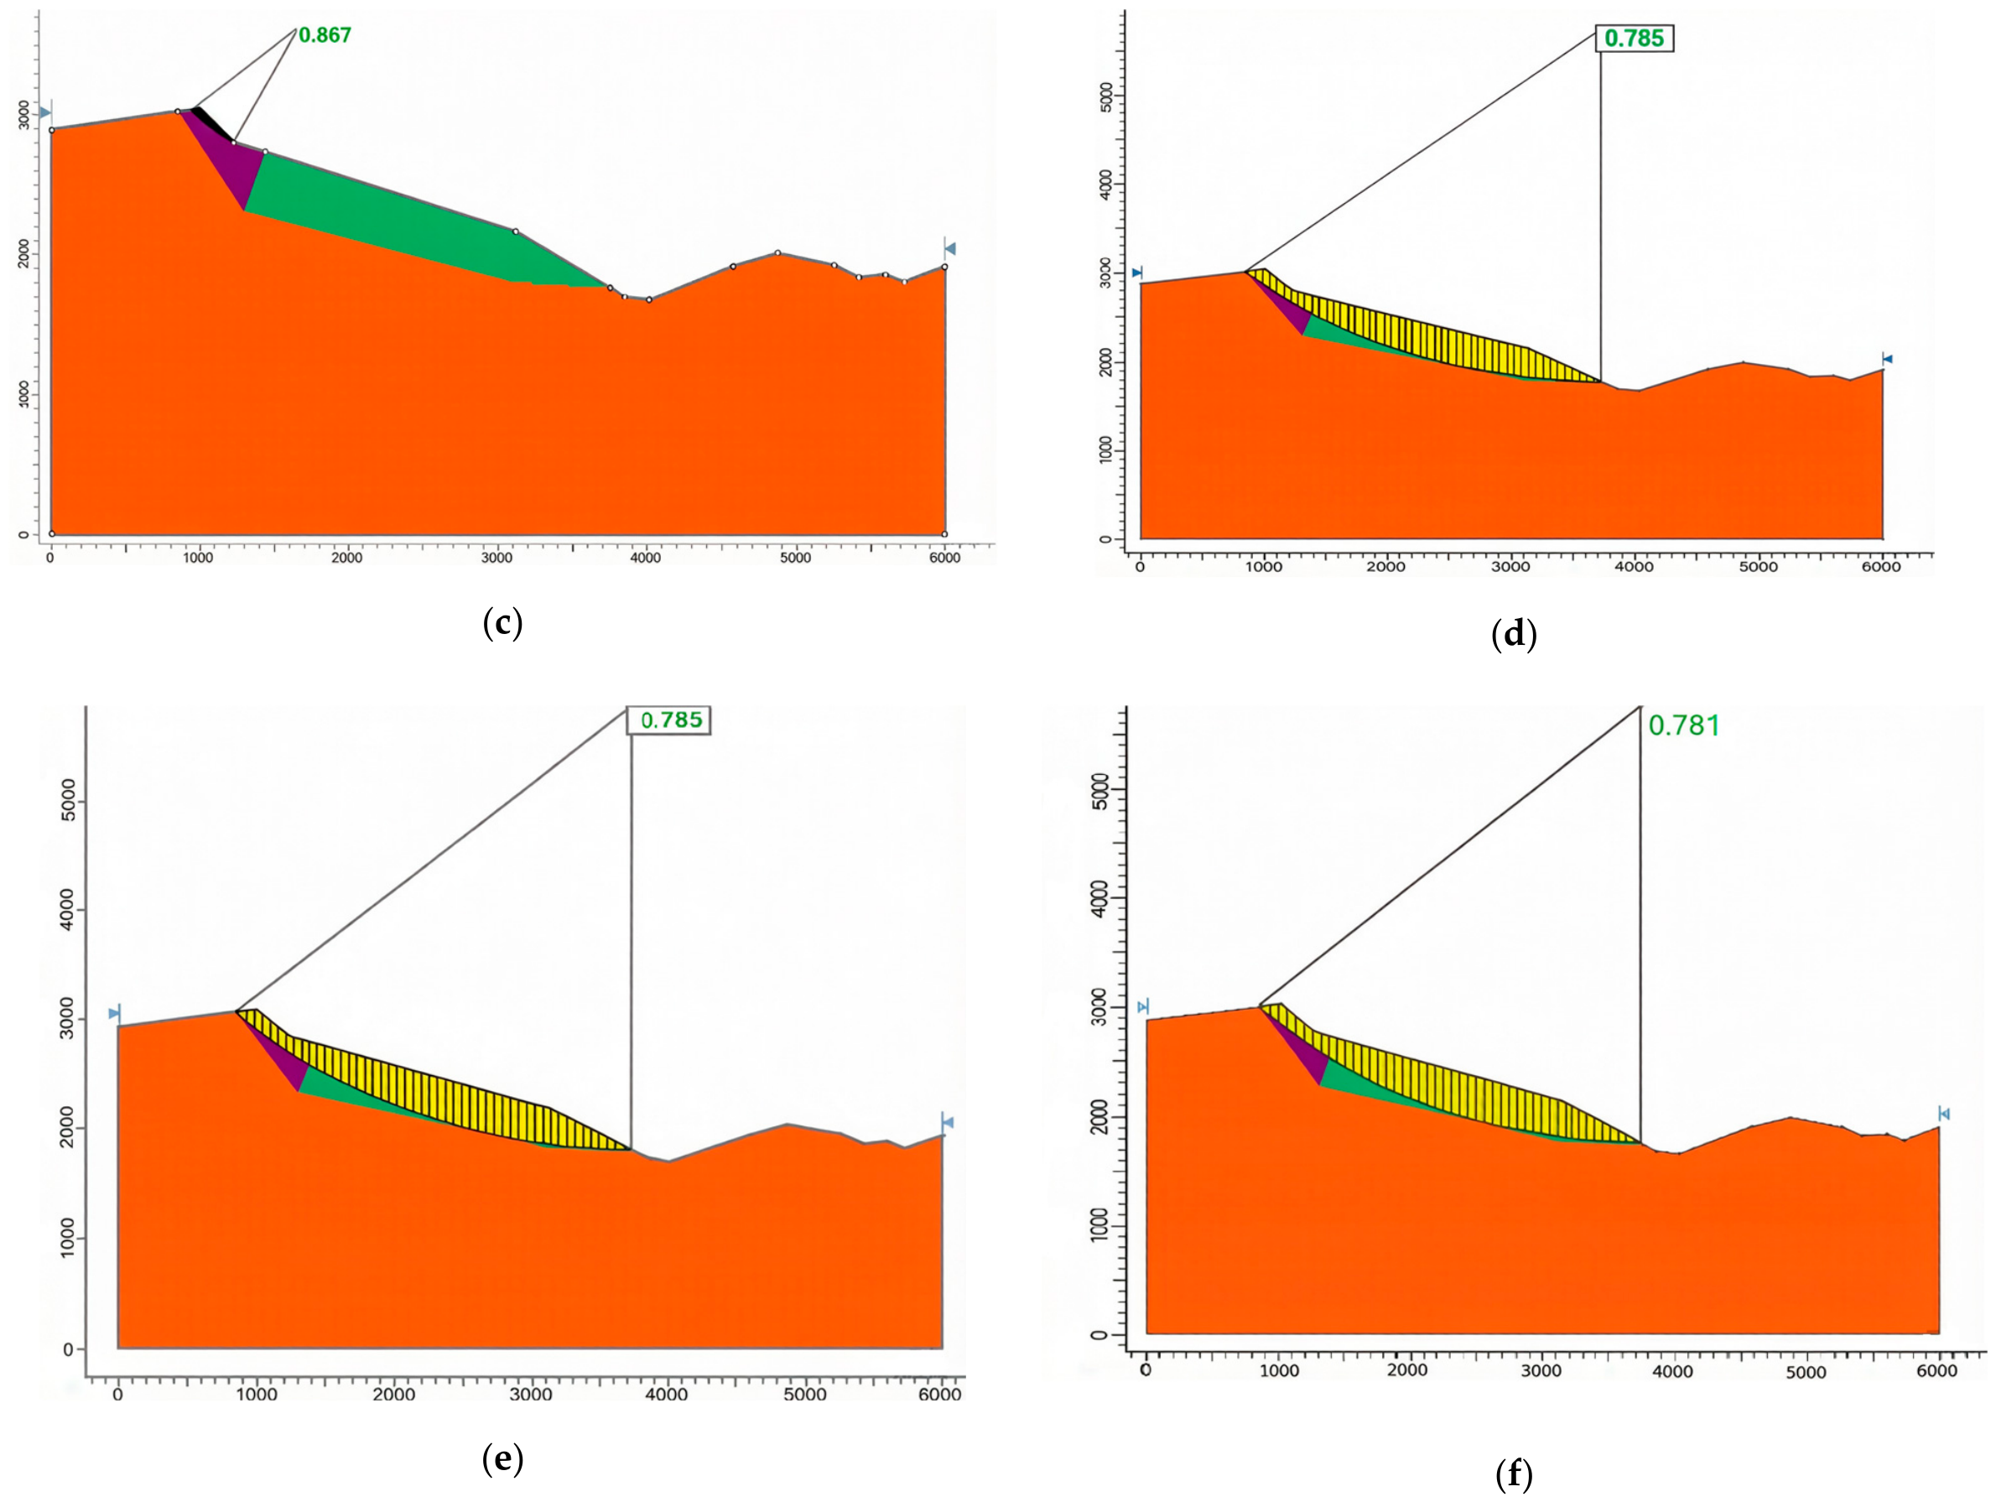
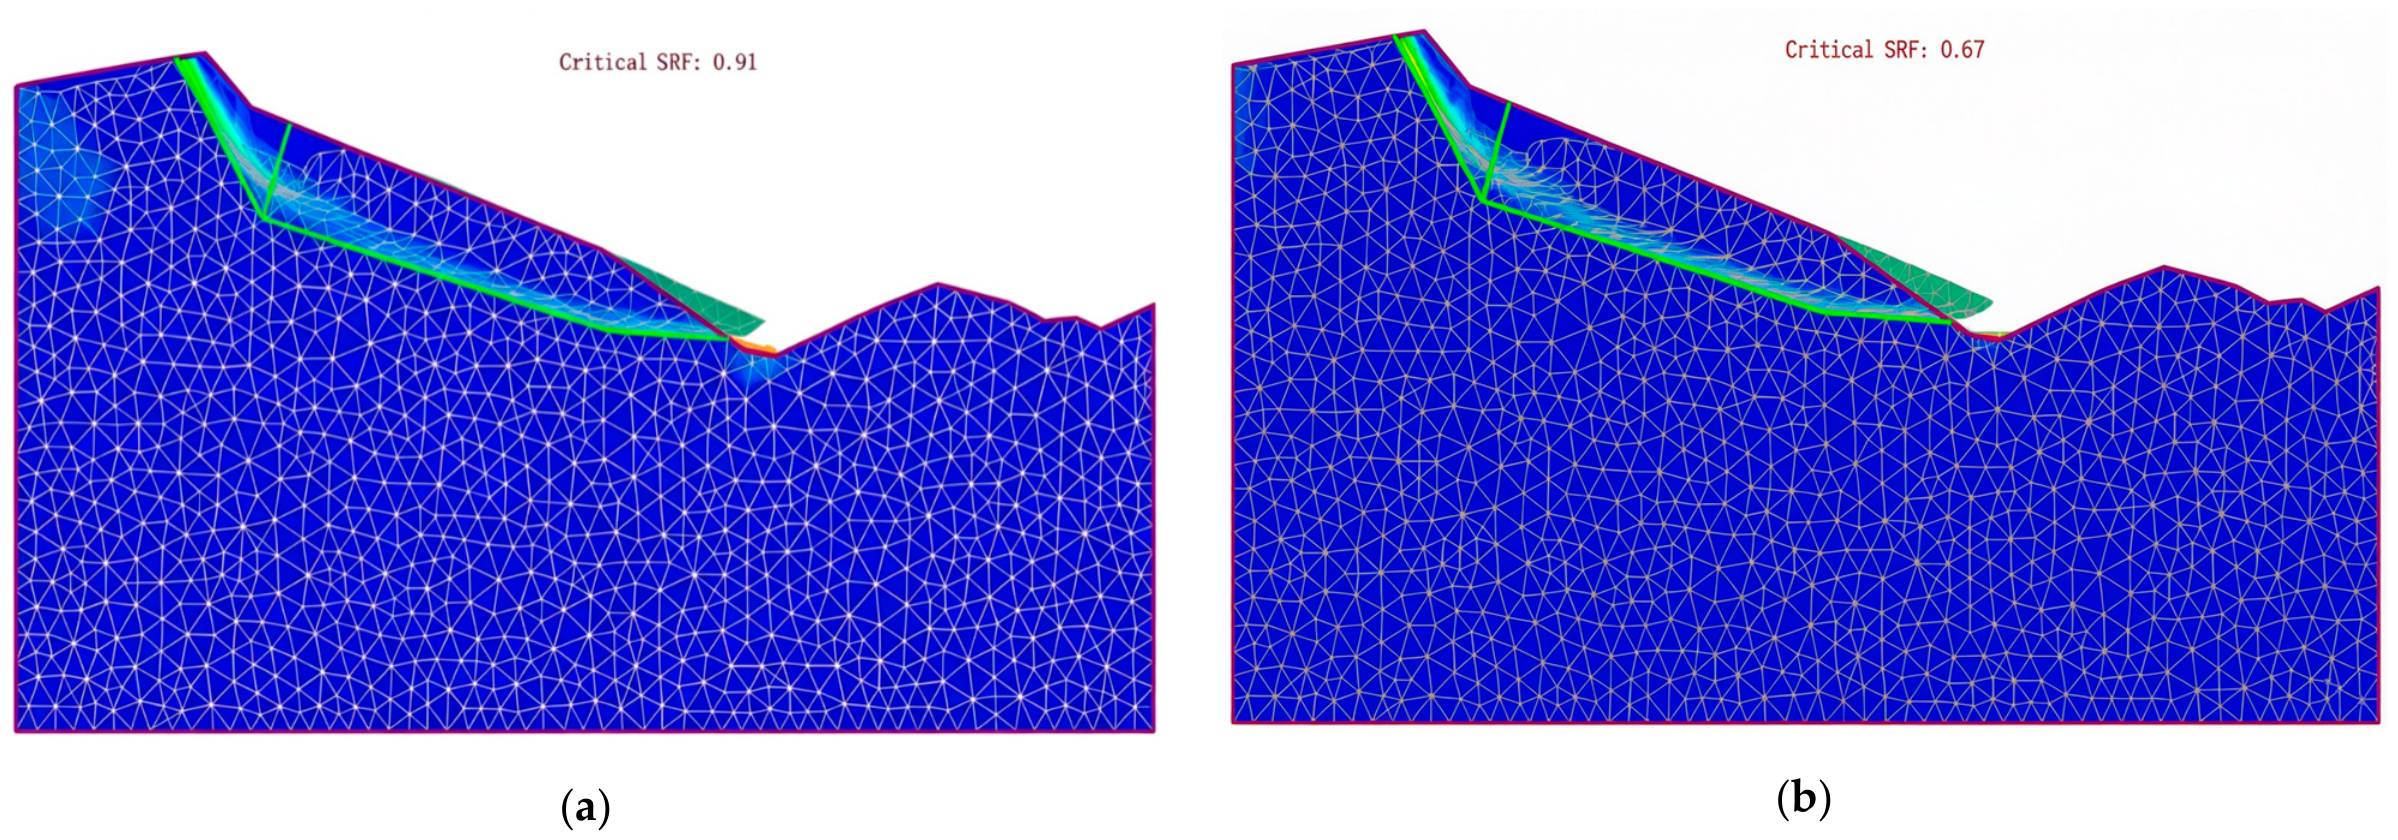
In the PS-LEM analysis with a peak horizontal acceleration (PHA) value of 0.1674, the addition of the downward peak vertical acceleration (PVA) further reduced the FS compared to the horizontal component alone. Conversely, incorporating the upward PVA component increased the FS, consistent with prior findings. Interestingly, at a PHA value of 0.219, adding downward PVA did not significantly alter the FS compared to the horizontal force only, whereas the inclusion of upward PVA further reduced it. Notably, the PS-LEM failure surface corresponding to PHA = 0.5 closely resembled the actual observed slope slide, as illustrated in Figure 9. For the PS-FEM analysis, both PHA values (0.1674 and 0.219) showed that adding downward PVA decreased the FS relative to the horizontal force only. On the other hand, the upward PVA component led to an increase in FS, mirroring trends observed in previous analyses. The failure surfaces obtained from the PS-FEM simulations are depicted in Figure 10.
To further contextualize the Daguangbao results within the proposed indicator framework, the FSRI and AI were computed directly from the PS-LEM values in Table 9, as presented in Table 10. VSR could not be computed as only a single Kv level (PVA/PHA = 0.5) was analyzed; future validation studies should incorporate at least two vertical loading levels to enable VSR quantification.
The low FSRI values (below 1%) are consistent with the parametric results, where FSRI remains modest at PVA/PHA = 0.5 and is amplified only when PVA/PHA approaches 1.0. The two validation loading cases give AI values of 1.40 (PHA = 0.1674) and 0.0 (PHA = 0.219)—that is, they do not themselves agree on the direction of asymmetry—illustrating precisely why this single case (Section 7, point vii) can neither confirm nor refute a general AI pattern, though it is consistent with the parametric finding that the magnitude of the asymmetry, in either direction, is modest when FSRI itself is small.
Figure 9 and Figure 10 illustrate the predicted failure surfaces from PS-LEM and PS-FEM for PHA values of 0.3 × PHAearthquake and 0.5 × PHAearthquake, and PVA/PHA ratios of 0 and 0.5 (upward and downward). Several key observations emerge. First, the failure surface depth and extent increase consistently as PHA rises from 0.3 × PHAearthquake to 0.5 × PHAearthquake across both methods, confirming the primacy of horizontal acceleration. Second, a downward PVA/PHA = 0.5 produces a marginally deeper and more extensive failure surface compared to the horizontal-only case (PVA/PHA = 0), consistent with the FSRI values computed for the parametric slopes. Third, upward vertical forces produce a shallower surface and higher FS, mirroring the stabilizing trend identified in Table 9. Fourth, the PS-LEM failure surface for PHA = 0.5 × PHAearthquake closely resembles the observed post-event slide morphology (compare Figure 9f with Figure 6), supporting the predictive plausibility of the combined loading framework for this case. PS-FEM surfaces (Figure 10) display broader shear band zones consistent with progressive yielding, while retaining the same directional asymmetry. Together, these figures indicate that both methods reproduce the essential mechanics of combined seismic loading for the Daguangbao case; as discussed in Section 7, this single case supports but cannot by itself establish the general validity of the parametric findings.

7. Limitations of This Study

The following limitations should be recognized: (i) The pseudo-static method represents earthquake loading as a constant force, thereby neglecting cyclic and transient effects such as pore-pressure build-up and progressive strength degradation, factors that may be critical for saturated or liquefiable materials; it also cannot capture load reversal within a single shaking episode, a simplification discussed further in Section 2. (ii) An elastic–perfectly plastic material behavior is assumed in the FEM analysis; strain softening, progressive failure, and rate-dependent strength degradation—all common in seismically triggered slope failures, particularly in sensitive or brittle materials—are not modeled, which may bias the computed FS toward the non-conservative side relative to a strain-softening formulation for slopes prone to progressive failure. (iii) The vertical seismic coefficient is applied as a fixed PVA/PHA ratio up to 1.0, whereas in practice this ratio varies with frequency content, source distance, and site response [45], and can exceed 1.0 in some near-fault and vertically amplified conditions; extending the parametric matrix beyond PVA/PHA = 1.0 is a priority direction for follow-on work. (iv) The parametric study characterizes strength using undrained shear strength and unit weight alone (φ = 0 throughout); friction angle, pore-water pressure and groundwater effects, anisotropy, and spatial heterogeneity are not considered, and—as shown in Section 5.3—the sign and magnitude of the Asymmetry Index specifically depend on this undrained idealization, so the AI findings should not yet be generalized to effective-stress soils. (v) The results are presented deterministically, with no formal assessment of uncertainty in seismic coefficients, material properties, or the resulting FSRI/VSR/AI values; a probabilistic or sensitivity-based treatment (e.g., Monte Carlo propagation of Su and unit-weight uncertainty) is identified as a priority extension, and would also allow the FSRI screening threshold proposed in Section 5.1 to be validated statistically rather than heuristically. (vi) The validation is limited to a single case history (the 2008 Daguangbao landslide); a single case, however well-documented, cannot establish general applicability across different geological and seismological settings, and the validation itself compares only FS trends, not predicted versus observed displacement, since the pseudo-static framework does not produce a displacement output. (vii) The FSRI, VSR, and AI values are presented for three idealized geometries under undrained conditions; their application to the Daguangbao case (Section 6) is internally consistent with the parametric FSRI trends, but the two validation loading cases available (PHA = 0.1674 and 0.219) give AI values of 1.40 and 0.0 respectively—i.e., they do not themselves agree on the direction or degree of asymmetry—so this single case neither confirms nor refutes a general AI pattern, and broader validation across diverse geological settings and failure mechanisms is needed before adopting FSRI, VSR, or AI as formal design criteria. (viii) All the analyses reported here use pseudo-static loading; validation against fully dynamic time-history analysis, capable of capturing cyclic load reversal, frequency content, and duration effects that a constant pseudo-static coefficient cannot represent, was outside the scope of this study and is recommended as the most direct next step for establishing how closely FSRI, VSR, and AI computed under the pseudo-static idealization track the actual seismic performance of a slope. (ix) Because the present validation uses only the 2008 Wenchuan earthquake, the general applicability of FSRI, VSR, and AI to earthquakes of different magnitude, mechanism, and source distance remains to be established; application to additional, independently documented case histories is a natural extension once suitable strong-motion and pre-/post-failure geometry records are identified.

8. Conclusions and Recommendations

This study presents a systematic investigation of the combined effects of horizontal and vertical pseudo-static seismic forces on slope stability, introducing three practical quantitative indicators—the Factor of Safety Reduction Index (FSRI), Vertical Force Sensitivity Ratio (VSR), and Asymmetry Index (AI). Each was computed from 96 parametric FS values across three slope geometries and applied to the Daguangbao landslide case as a preliminary consistency check (Section 6), pending the broader validation discussed in Section 7. The principal findings are:
  • Dominance of Horizontal Loading: Increasing Kh consistently reduces FS across all slope geometries. At Kh = 0.20, all the slopes approach or breach the FS = 1.0 threshold under horizontal force alone, confirming the primacy of horizontal acceleration.
  • Impact of Vertical Forces: Downward vertical forces systematically reduce FS below the horizontal-only baseline. The FSRI reaches +10.6% at PVA/PHA = 1.0 and Kh = 0.20 for the steepest slope. FSRI values consistently exceed 3% when Kh > 0.10 and PVA/PHA > 0.50, the recommended threshold for requiring explicit vertical force treatment in design.
  • The Asymmetry Index (AI) shows that upward and downward vertical loading do not produce mirror-image effects on FS: for the undrained (φ = 0) conditions studied, the percentage stabilizing benefit of upward loading is generally slightly larger than the percentage destabilizing penalty of downward loading of equal magnitude (AI < 1.0 in most cases), a pattern traced in Section 5.3 to the reciprocal (FS = C/D) form of the governing equations rather than to any geometry-specific effect. This does not mean downward loading is benign in absolute terms—FS is lower under downward loading than upward loading at every parameter combination tested—but it does mean design provisions should not assume the percentage effect of vertical loading is symmetric, nor default to assuming the downward case dominates the percentage-change comparison; both directions should be evaluated explicitly.
  • The Vertical Force Sensitivity Ratio (VSR), though below 1.0 throughout the tested range (horizontal loading remains the dominant driver of FS sensitivity), increases systematically with slope steepness and seismicity, showing that steep slopes under high seismicity are relatively more sensitive to vertical force increments than gentler slopes or lower seismicity cases. This indicator guides site investigation efforts toward more accurate PVA characterization where relative vertical sensitivity is highest.
  • Application to the Daguangbao landslide shows that PS-LEM and PS-FEM reproduce failure conditions and generate realistic failure surface geometries consistent with the observed slide under combined seismic loading, supporting the framework’s plausibility; broader validation across additional case histories, discussed in Section 7, would be needed to establish this reliability more generally.
  • Preliminary design implications, pending broader validation (Section 7): (i) in near-fault environments or where PVA/PHA > 0.50 is expected, consider explicitly including a downward vertical seismic coefficient rather than relying on horizontal loading alone; (ii) the FSRI can be used as a preliminary screening criterion to assess whether vertical forces are likely consequential to the stability analysis, noting that the specific 3% threshold proposed here is heuristic and has not yet been statistically validated (Section 5.1); (iii) apply PS-LEM and PS-FEM in com-bination to obtain complementary insights into failure mechanisms and deformation behavior. These points are offered as preliminary, study-specific observations rather than generalized design rules, given the limitations discussed in Section 7.
Future work should extend the FSRI and AI frameworks to dynamic time-history analyses, partially saturated slopes, and reinforced slope systems.

Author Contributions

Conceptualization, A.S.M.F.H.; methodology, A.S.M.F.H. and S.A.S.; software, A.S.M.F.H.; validation, A.S.M.F.H., S.A.S. and M.N.; formal analysis, A.S.M.F.H. and S.A.S.; investigation, A.S.M.F.H. and S.A.S.; resources, A.S.M.F.H.; data curation, A.S.M.F.H., S.A.S. and M.N.; writing—original draft preparation, A.S.M.F.H. and S.A.S.; writing—review and editing, A.S.M.F.H., S.A.S. and M.N.; visualization, A.S.M.F.H. and S.A.S. All authors have read and agreed to the published version of the manuscript.

Funding

This research received no external funding.

Data Availability Statement

The original contributions presented in this study are included in the article. Further inquiries can be directed to the corresponding author.

Acknowledgments

During the preparation of this manuscript, the authors used ChatGPT (GPT 5.5) for the purposes of language correction and improvement of readability. The authors have reviewed and edited the output and take full responsibility for the content of this publication.

Conflicts of Interest

The authors declare no conflicts of interest.

Abbreviations

The following abbreviations are used in this manuscript:
FSRIFactor of Safety Reduction Index
VSRVertical Force Sensitivity Ratio
AIAsymmetry Index
PSPseudo-Static
LEMLimit Equilibrium Method
FEMFinite Element Method
FSFactor of Safety
PHAPeak Horizontal Acceleration
PVAPeak Vertical Acceleration
PVA/PHAPeak Vertical-to-Horizontal Acceleration Ratio
PGAPeak Ground Acceleration

References

  1. Bojadjieva, J.; Sheshov, V.; Bonnard, C. Hazard and risk assessment of earthquake-induced landslides—Case study. Landslides 2018, 15, 161–171. [Google Scholar] [CrossRef]
  2. Marano, K.D.; Wald, D.J.; Allen, T.I. Global earthquake casualties due to secondary effects: A quantitative analysis for improving rapid loss analyses. Nat. Hazards 2010, 52, 319–328. [Google Scholar] [CrossRef]
  3. Daniell, J.E.; Schaefer, A.M.; Wenzel, F. Losses Associated with Secondary Effects in Earthquakes. Front. Built Environ. 2017, 3. [Google Scholar] [CrossRef]
  4. Jessee, M.A.N.; Hamburger, M.W.; Ferrara, M.R.; McLean, A.; FitzGerald, C. A global dataset and model of earthquake-induced landslide fatalities. Landslides 2020, 17, 1363–1376. [Google Scholar] [CrossRef]
  5. Tanyas, H.; Rossi, M.; Alvioli, M.; van Westen, C.J.; Marchesini, I. A global slope unit-based method for the near real-time prediction of earthquake-induced landslides. Geomorphology 2019, 327, 126–146. [Google Scholar] [CrossRef]
  6. Wasowski, J.; Keefer, D.K.; Lee, C.-T. Toward the next generation of research on earthquake-induced landslides: Current issues and future challenges. Eng. Geol. 2011, 122, 1–8. [Google Scholar] [CrossRef]
  7. Hynes-Griffin, M.E.; Franklin, A.G. Rationalizing the Seismic Coefficient Method; U.S. Army Engineer Waterways Experiment Station: Vicksburg, MS, USA, 1984.
  8. EN 1998-5; Eurocode 8: Design of Structures for Earthquake Resistance—Part 5: Foundations, Retaining Structures and Geotechnical Aspects. European Committee for Standardization: Brussels, Belgium, 2004.
  9. NBCC. National Building Code of Canada 2015, 14th ed.; National Research Council of Canada: Ottawa, ON, Canada, 2015.
  10. Von Terzaghi, K. Mechanisms of Landslides; Geotechnical Society of America: Berkeley, CA, USA, 1950; pp. 83–125. [Google Scholar]
  11. Fatehi, M.; Hosseinpour, I.; Chenari, R.J.; Payan, M.; Javankhoshdel, S. Deterministic Seismic Stability Analysis of Reinforced Slopes using Pseudo-Static Approach. Iran. J. Sci. Technol. Trans. Civ. Eng. 2023, 47, 1025–1040. [Google Scholar] [CrossRef]
  12. Bansal, V.; Sarkar, R. Comparative Analysis of Slope Stability for Kalimpong Region under Dynamic Loading Using Limit Equilibrium Method and Machine Benchmark Learning Classifiers. Iran. J. Sci. Technol. Trans. Civ. Eng. 2024, 48, 2785–2807. [Google Scholar] [CrossRef]
  13. Kramer, S.L. Geotechnical Earthquake Engineering; Prentice-Hall Inc.: Englewood Cliffs, NJ, USA, 1996. [Google Scholar]
  14. Kontoe, S.; Pelecanos, L.; Potts, D. An important pitfall of pseudo-static finite element analysis. Comput. Geotech. 2013, 48, 41–50. [Google Scholar] [CrossRef]
  15. Klar, A.; Lloyd, N.; Aharonov, E.; Katz, O. Beyond Critical Acceleration Pseudo-Static Analysis. In Proceedings of the 6th International Conference on Earthquake Geotechnical Engineering, Christchurch, New Zealand, 1–4 November 2015. [Google Scholar]
  16. Yang, X.; Zhai, E.; Wang, Y.; Hu, Z. A comparative study of pseudo-static slope stability analysis using different design codes. Water Sci. Eng. 2018, 11, 310–317. [Google Scholar] [CrossRef]
  17. Macedo, J.; Candia, G. Performance-based assessment of the seismic pseudo-static coefficient used in slope stability analysis. Soil Dyn. Earthq. Eng. 2020, 133, 106109. [Google Scholar] [CrossRef]
  18. Dobry, R.; Borcherdt, R.D.; Crouse, C.B.; Idriss, I.M.; Joyner, W.B.; Martin, G.R.; Power, M.S.; Rinne, E.E.; Seed, R.B. New Site Coefficients and Site Classification System Used in Recent Building Seismic Code Provisions. Earthq. Spectra 2000, 16, 41–67. [Google Scholar] [CrossRef]
  19. Frankel, A. Three-Dimensional Simulations of Ground Motions in the Seattle Region for Earthquakes in the Seattle Fault Zone. Bull. Seismol. Soc. Am. 2000, 90, 1251–1267. [Google Scholar] [CrossRef]
  20. Borcherdt, R.D. Estimates of Site-Dependent Response Spectra for Design (Methodology and Justification). Earthq. Spectra 1994, 10, 617–653. [Google Scholar] [CrossRef]
  21. Idriss, I.M. Earthquake Ground Motions at Soft Soil Sites. In Proceedings of the Second International Conference on Recent Advances in Geotechnical Earthquake Engineering & Soil Dynamics, St. Louis, MO, USA, 11–15 March 1991. [Google Scholar]
  22. Seed, H.B.; Ugas, C.; Lysmer, J. Site-dependent spectra for earthquake-resistant design. Bull. Seismol. Soc. Am. 1976, 66, 221–243. [Google Scholar] [CrossRef]
  23. Huang, C.-C. Influence of Surface-Normal Ground Acceleration on the Initiation of the Jih-Feng-Erh-Shan Landslide during the 1999 Chi-Chi, Taiwan, Earthquake. Bull. Seismol. Soc. Am. 2004, 91, 953–958. [Google Scholar] [CrossRef]
  24. Yuan, R.; Tang, C.-L.; Deng, Q. Effect of the acceleration component normal to the sliding surface on earthquake-induced landslide triggering. Landslides 2015, 12, 335–344. [Google Scholar] [CrossRef]
  25. Zhang, Y.; Zhang, J.; Chen, G.; Zheng, L.; Li, Y. Effects of vertical seismic force on initiation of the Daguangbao landslide induced by the 2008 Wenchuan earthquake. Soil Dyn. Earthq. Eng. 2015, 73, 91–102. [Google Scholar] [CrossRef]
  26. Haji-Soltani, A.; Pezeshk, S.; Malekmohammadi, M.; Zandieh, A. A Study of Vertical-to-Horizontal Ratio of Earthquake Components in the Gulf Coast Region. Bull. Seismol. Soc. Am. 2017, 107, 2055–2066. [Google Scholar] [CrossRef]
  27. Podolskiy, E.A.; Nishimura, K.; Abe, O.; Chernous, P.A. Earthquake-induced snow avalanches: II. Experimental study. J. Glaciol. 2010, 56, 447–458. [Google Scholar] [CrossRef]
  28. Fan, X.; Scaringi, G.; Korup, O.; West, A.J.; van Westen, C.J.; Tanyas, H.; Hovius, N.; Hales, T.C.; Jibson, R.W.; Allstadt, K.E.; et al. Earthquake-Induced Chains of Geologic Hazards: Patterns, Mechanisms, and Impacts. Rev. Geophys. 2019, 57, 421–503. [Google Scholar] [CrossRef]
  29. Ling, H.I.; Leshchinsky, D.; Mohri, Y. Soil slopes under combined horizontal and vertical seismic accelerations. Earthq. Eng. Struct. Dyn. 1997, 26, 1231–1241. [Google Scholar] [CrossRef]
  30. Yan, L.; Matasovic, N.; Kavazanjian, E., Jr. Seismic response of a block on an inclined plane to vertical and horizontal excitation acting simultaneously. In Proceedings of the 11th Conference on Engineering Mechanics, Albufeira, Portugal, 19–22 May 1996. [Google Scholar]
  31. Gazetas, G.; Garini, E.; Anastasopoulos, I.; Georgarakos, T. Effects of Near-Fault Ground Shaking on Sliding Systems. J. Geotech. Geoenviron. Eng. 2009, 135, 1906–1921. [Google Scholar] [CrossRef]
  32. Sun, P.; Yin, Y.; Wu, S.; Chen, L. Does vertical seismic force play an important role for the failure mechanism of rock avalanches? A case study of rock avalanches triggered by the Wenchuan earthquake of May 12, 2008, Sichuan, China. Environ. Earth Sci. 2012, 66, 1285–1293. [Google Scholar] [CrossRef]
  33. Santo, S.A.; Hossain, A.S.M.F.; Fariha, A.S.; Haque, M.E.; Ansary, M.A. Assessment of seismic slope stability of Rangamati Hill Tracts, Bangladesh. Discov. Geosci. 2024, 2, 1. [Google Scholar] [CrossRef]
  34. Elgamal, A.; He, L. Vertical earthquake ground motion records: An overview. J. Earthq. Eng. 2004, 8, 663–697. [Google Scholar] [CrossRef]
  35. Xiang, G.; Jiang, T.; Yang, Q.; Cui, S.; Zhu, L.; He, Y.; Li, H. The Influence of Vertical Seismic Acceleration on the Triggering of Landslides Constrained by Bedding Faults under an Inertial Frame Reference: The Case of the Daguangbao (DGB) Landslide. Appl. Sci. 2023, 13, 12911. [Google Scholar] [CrossRef]
  36. Wu, D.; Wang, Y.; Chen, X. Limit analysis of earthquake-induced landslides considering two strength envelopes. Nat. Hazards Earth Syst. Sci. 2024, 24, 4617–4630. [Google Scholar] [CrossRef]
  37. Doddamani, V.C.; Ray, A. Seismic slope stability: A detailed review of recent advances in fundamental science, modelling and mitigation strategies. Geomat. Nat. Hazards Risk 2026, 17, 2649638. [Google Scholar] [CrossRef]
  38. Copana, J.; Yerro, A.; Rodriguez-Marek, A. Comparison Study of Methods to Assess a Rigid Slope Seismic Stability. In Geo-Congress 2022; American Society of Civil Engineers: Reston, VA, USA, 2022; pp. 380–390. [Google Scholar] [CrossRef]
  39. Cheng, H.; Zhou, X. A novel displacement-based rigorous limit equilibrium method for three-dimensional landslide stability analysis. Can. Geotech. J. 2015, 52, 2055–2066. [Google Scholar] [CrossRef]
  40. Johari, A.; Mousavi, S. An analytical probabilistic analysis of slopes based on limit equilibrium methods. Bull. Eng. Geol. Environ. 2019, 78, 4333–4347. [Google Scholar] [CrossRef]
  41. Hong, Y.; Yu, G.; He, K. Probabilistic landslide risk assessment of a historic and cultural site on the north slope of Lishan Mountain, Xian, China. Environ. Earth Sci. 2016, 75, 646. [Google Scholar] [CrossRef]
  42. Wang, F.; Cheng, Q.; Highland, L.; Miyajima, M.; Wang, H.; Yan, C. Preliminary investigation of some large landslides triggered by the 2008 Wenchuan earthquake, Sichuan Province, China. Landslides 2009, 6, 47–54. [Google Scholar] [CrossRef]
  43. Sarma, S.K. Stability analysis of embankments and slopes. Géotechnique 1973, 23, 423–433. [Google Scholar] [CrossRef]
  44. Sarma, S.K.; Scorer, M. The effect of vertical acceleration on seismic slope stability. In Proceedings of the International Conference on Performance Based Design in Earthquake Geotechnical Engineering, Tsukuba, Japan, 15–18 June 2009. [Google Scholar] [CrossRef]
  45. Hossain, A.S.M.F.; Saeidi, A.; Salsabili, M.; Nastev, M.; Suescun, J.R.; Bayati, Z. A Review of Parameters and Methods for Seismic Site Response. Geosciences 2025, 15, 128. [Google Scholar] [CrossRef]
Figure 1. FS of a slope in LEM.
Geohazards 07 00084 g001
Figure 2. Interslice forces in PS-LEM (a) static; (b) pseudo-static, horizontal only; (c) pseudo-static, horizontal and upward vertical; and (d) pseudo-static, horizontal and downward vertical (modified after Hong et al. [41]).
Geohazards 07 00084 g002
Figure 3. Geometry of the slope model.
Geohazards 07 00084 g003
Figure 4. Epicentral location of the 2008 Sichuan Earthquake and the location of Daguangbao landslide.
Geohazards 07 00084 g004
Figure 5. Processed acceleration records of the Wenchuan earthquake (a) horizontal, and (b) vertical time histories.
Geohazards 07 00084 g005
Figure 6. Slope of Daguangbao before and after the landslide due to earthquake (after Zhang et al. 2015 [25]).
Geohazards 07 00084 g006
Figure 7. Geometry of the Daguangbao slope model in Slide2 and RS2 (horizontal and vertical axes both in meters, matching the software’s native coordinate grid).
Geohazards 07 00084 g007
Figure 8. Contour plots illustrating FS variation relative to PVA/PHA ratios and PHA for different slope geometries: (a) 1:1.5 downward Kv, (b) 1:1.5 upward Kv, (c) 1:2 downward Kv, (d) 1:2 upward Kv, (e) 1:3 downward Kv, (f) 1:3 upward Kv.
Geohazards 07 00084 g008aGeohazards 07 00084 g008b
Figure 9. Failure surfaces obtained from PS-LEM analysis for various PHA and PVA/PHA ratios. (ac) represent results for PHA = 0.3 PHAearthquake: (a) PVA/PHA = 0, (b) PVA/PHA = 0.5 (downward), and (c) PVA/PHA = 0.5 (upward). (df) show results for PHA = 0.5 PHAearthquake: (d) PVA/PHA = 0, (e) PVA/PHA = 0.5 (downward), and (f) PVA/PHA = 0.5 (upward).
Geohazards 07 00084 g009aGeohazards 07 00084 g009b
Figure 10. Failure surfaces obtained from PS-FEM analysis for different PHA and PVA/PHA ratios. (ac) represent results for PHA= 0.3 PHAearthquake: (a) PVA/PHA = 0, (b) PVA/PHA = 0.5 (downward), (c) PVA/PHA = 0.5 (upward). (df) show results for PHA = 0.5 PHAearthquake: (d) PVA/PHA = 0, (e) PVA/PHA = 0.5 (Down), (f) PVA/PHA = 0.5 (Up).
Geohazards 07 00084 g010aGeohazards 07 00084 g010b
Table 1. Geotechnical properties of the slope.
ParametersUnitLayer 1: Upper ClayLayer 2: Stiff ClayLayer 3: Rock Base
Saturated unit weight, γsatkN/m3202020
Undrained shear strength, SukPa751505000
Table 2. Seismic loading parameters and PVA/PHA ratios adopted in the parametric study.
Horizontal seismic coefficient, Kh0.0250.050.100.20
Vertical-to-horizontal coefficient ratio, (PVA/PHA)00.250.51.0
Table 3. Geotechnical properties of the Daguangbao slope.
PropertiesUnit-1Unit-2Unit-3
Unconfined Compressive Strength, MPa (Intact)43.887.287.2
Unit weight (γ), kN/m3272726
Elastic Modulus, GPa1.862.6314.76
Poisson’s ratio0.20.20.2
Material constant, mi1297
Rock mass constant, si111
Rock mass constant, ai0.50.50.5
Degree of disturbance factor, D111
GSI404070
m0.1650.1240.821
s4.5 × 10−54.5 × 10−50.0068
Table 4. Static factors of safety for the three slope geometries under no seismic loading.
Slope 1Slope 2Slope 3
Slope angle1:1.51:21:3
Factor of Safety1.4421.4791.592
Table 5. Factor of safety (FS) results from the pseudo-static limit equilibrium method (PS-LEM) for all the slope geometries, loading directions, and seismic coefficient combinations.
PVA/
PHA
PVA1:1.5 Slope1:2 Slope1:3 Slope
PHAPHAPHA
0.0250.050.10.20.0250.050.10.20.0250.050.10.2
0down1.3361.241.0820.8581.3631.261.0540.8531.4551.3371.1160.887
0.25down1.3281.2271.0620.8331.3551.2641.0750.8291.4471.3241.1270.865
0.5down1.321.2151.0430.8111.3481.2331.0560.8071.4391.311.1060.841
1down1.3051.191.0070.7671.3321.2081.020.7671.4231.2841.0720.799
0up1.3361.241.0820.8581.3631.261.0540.8531.4551.3371.1160.887
0.25up1.3431.2541.1020.8831.3711.2731.1150.8751.4641.3521.1670.912
0.5up1.3511.2671.1250.9111.3791.2881.1360.9011.4721.3671.190.938
1up1.3671.2951.170.9711.3951.3151.180.9551.4891.3961.2360.997
Table 6. Factor of Safety Reduction Index (FSRI %) across three slope geometries. Positive values denote destabilizing effects, while negative values represent stabilizing effects. The peak values for each slope are highlighted in bold.
PVA/PHADirectionFSRI (%)
1:1.5 PHA = 0.0251:1.5 PHA = 0.101:1.5 PHA = 0.201:2 PHA = 0.0251:2 PHA = 0.101:2 PHA = 0.201:3 PHA = 0.20
0.25Down+0.6+1.8+2.9+0.6−2.0+2.9+2.5
0.25Up−0.5−1.8−2.9−0.6−5.8−2.6−2.8
0.50Down+1.2+3.6+5.5+1.1+0.2+5.4+5.1
0.50Up−1.1−3.9−6.2−1.2−7.8−5.5−5.8
1.0Down+2.3+6.9+10.6+2.3+3.2+10.1+9.9
1.0Up−2.3−8.1−13.2−2.3−11.9−11.7−12.5
Table 7. VSR values at Kh = 0.20 (design-critical level).
PVA/PHADirectionVSR
Slope 1:1.5Slope 1:2Slope 1:3
0.25Down0.180.160.14
0.50Down0.170.160.14
1.0Down0.170.150.14
0.25Up0.180.150.15
0.50Up0.190.160.16
1.0Up0.210.170.17
Table 8. Asymmetry Index (AI) values (AI > 1.0: downward penalty exceeds upward benefit; AI < 1.0: converse).
PVA/PHAAI
Slope 1:1.5 PHA = 0.025Slope 1:1.5 PHA = 0.10Slope 1:1.5 PHA = 0.20Slope 1:2 PHA = 0.025Slope 1:2 PHA = 0.20Slope 1:3 PHA = 0.20
0.251.201.001.001.001.120.89
0.501.090.920.890.920.980.88
1.01.000.850.801.000.860.79
Table 9. Daguangbao landslide validation: Factors of safety from PS-LEM and PS-FEM analyses.
PVA/PHADirection of
vertical Component
PS-LEMPS-FEM
PHA 0.1674PHA 0.219PHA 0.1674PHA 0.219
0N/A0.8630.7850.910.82
0.5Downward0.8570.7850.870.77
Upward0.8670.7810.960.87
Table 10. FSRI and AI computed from PS-LEM Daguangbao validation results.
PHAPVA/PHADirectionFShFSvFSRI (%)AI
0.16740.5Down0.8630.857+0.71.40
0.16740.5Up0.8630.867−0.5
0.2190.5Down0.7850.7850.00.0
0.2190.5Up0.7850.781−0.5
where FSh = factor of safety under horizontal loading only (PVA/PHA = 0); FSv = factor of safety with vertical component included.
Disclaimer/Publisher’s Note: The statements, opinions and data contained in all publications are solely those of the individual author(s) and contributor(s) and not of MDPI and/or the editor(s). MDPI and/or the editor(s) disclaim responsibility for any injury to people or property resulting from any ideas, methods, instructions or products referred to in the content.