1. Introduction
The impact of changes in Land Use Land Cover (LULC) has become a cause for concern, significantly affecting surface hydrological processes. LULC and landscape structure are critical components for local economic activities and biodiversity preservation, while playing a vital role in sustaining ecosystem service functions and fostering harmonious human–land interactions [
1]. Land cover pertains to the physical characteristics of the land’s surface, encompassing natural and man-made features such as vegetation, water bodies, and urban infrastructure. Conversely, land use refers to how humans utilize a specific area of land, encompassing various activities such as agriculture, urban development, and conservation efforts [
2]. Due to their intricate interconnections, land cover and land use are frequently studied together to better understand their combined effects on the environment [
3,
4]. The progressive alteration of LULC has emerged as a pivotal global concern, garnering significant attention due to its crucial implications for sustainability and environmental conservation [
5,
6].
Anthropogenic activities exert significant influence as the principal catalysts of LULC transformations across terrestrial ecosystems and constructed environments [
7,
8]. The World Urbanization Prospects: The 2018 Revision, released by the United Nations Population Division, indicates that global urban population accounted for 55% of the total population in 2018, while projections indicate that this proportion is anticipated to rise to 68% by 2050 [
9,
10]. Anthropogenic activities underscore the intricate interplay between social and economic structures within communities, shaping patterns of LULC change [
11]. The anthropogenic driving forces encompass population growth, urbanization, political framework, land tenure patterns, and the behaviors of landowners [
12], altering more than 40% of the LULC worldwide [
13]. These factors are influenced by the broader economic context, policy changes, and shifts in social beliefs [
14]. Since the early 21st century, many metropolitan areas in Greece and other European countries have experienced significant notable population growth and concurrent development. This trend has manifested as an extensive urbanization towards the suburbs and exurbs, transforming undeveloped land into built environments primarily for residential and industrial purposes. In recent years, over 40% of the world’s productive land has been transformed into human settlements to accommodate the increasing global population [
15]. Consequently, research into land use and land cover (LULC) changes and their implications for various environmental issues has garnered significant attention [
16,
17].
Additionally, watershed degradation, characterized by deforestation, destruction of natural vegetation cover, encroachment of croplands into forested areas due to agriculture intensification, and overgrazing has also been observed prominently in rural regions [
18]. During the timeframe spanning 1980 to 2000, a significant proportion, exceeding 55%, of newly acquired agricultural land in tropical regions was sourced from intact forest areas, with an additional 28% originating from disturbed forests [
19]. In the subsequent period from 2010 to 2015, tropical forest coverage experienced an annual decline of 5.5 million hectares, juxtaposed by a corresponding annual increase of 2.2 million hectares within temperate regions [
20]. Globally, an estimated 13 million hectares of agricultural expansion encroaches upon forested areas worldwide. While this expansion has substantially increased the production of food, fiber, wood, housing, and other essential commodities, the shifting dynamics of LULC have been linked to a declining provision of ecosystem services. Approximately 60% of these ecosystem services are estimated to have degraded over the past five decades [
21,
22].
A plethora of studies have underscored the influence of LULC changes on diverse environmental facets, including hydrological dynamics [
23,
24,
25,
26], climate patterns [
27,
28], ecosystem services [
29,
30,
31], and food security [
32,
33,
34]. Within the realm of LULC impacts, hydrological responses have garnered considerable research focus [
35]. Urbanization in conjunction with intensive agricultural practices disrupts soil integrity and nutrient fluxes, potentially exerting substantial impacts on hydrological cycle dynamics [
36,
37,
38]. These disruptions influence a range of factors, including canopy interception, surface roughness, soil properties, albedo, and evapotranspiration, all of which play critical roles in the complex interactions affecting surface runoff [
39]. The proliferation of impervious surfaces associated with urbanization significantly reduces the land’s infiltration capacity, leading to increased surface runoff and a heightened risk of flooding [
40,
41]. Additionally, the transformation of forests into agricultural lands can lead to land degradation, soil erosion, diminished productivity, and heightened susceptibility to natural hazards, such as floods and droughts [
42,
43]. Deforestation has been documented to significantly increase annual stream flow in the majority of examined basins [
44]. Conversely, afforestation’s influence on stream flow has exhibited diverse effects [
45,
46], generally resulting in reduced flow rates. However, the hydrological response to changes in LULC can diverge notably from these general trends, especially in larger basins exceeding 1000 km
2, necessitating meticulous investigation [
47,
48]. These cumulative effects underscore the intricate linkages between land use changes and the hydrological processes that sustain ecosystem functionality and resilience.
To enhance effective water resource management within river basins, it is crucial to quantify the effects of LULC changes at the basin level. Investigating the impact of LULC changes on the hydrology of river basins facilitates the identification of critical shifts in hydrological processes and supports the formulation of appropriate land use planning policies. This study aims to evaluate the influence of LULC changes on the hydrological response of a Mediterranean watershed in Crete, Greece, focusing on their influence on the hydrological components of the basin. This investigation utilized GIS-based tools, the HEC-HMS hydrological model, and the HEC-RAS hydraulic model. By assessing these factors, the study aims to provide a comprehensive understanding of the effects of human activities on surface runoff and its implications for potential flood-prone areas. Ultimately, these findings are intended to guide water resource managers and other stakeholders in making informed decisions.
The proposed approach, while fundamentally straightforward, can be effectively adapted to various geographic regions by taking into account the unique characteristics inherent to each locale. This adaptability ensures that the methodology remains robust and applicable across diverse settings, provided that the specific geographic features, such as climatic conditions, topographical nuances, and socio-economic factors, are meticulously considered and integrated into the implementation process. Consequently, this approach offers a versatile framework that can be tailored to meet the distinct requirements of different geographic contexts, thereby enhancing its utility and relevance in a broad range of environmental and socio-economic landscapes.
2. Materials and Methods
2.1. Methodological Framework
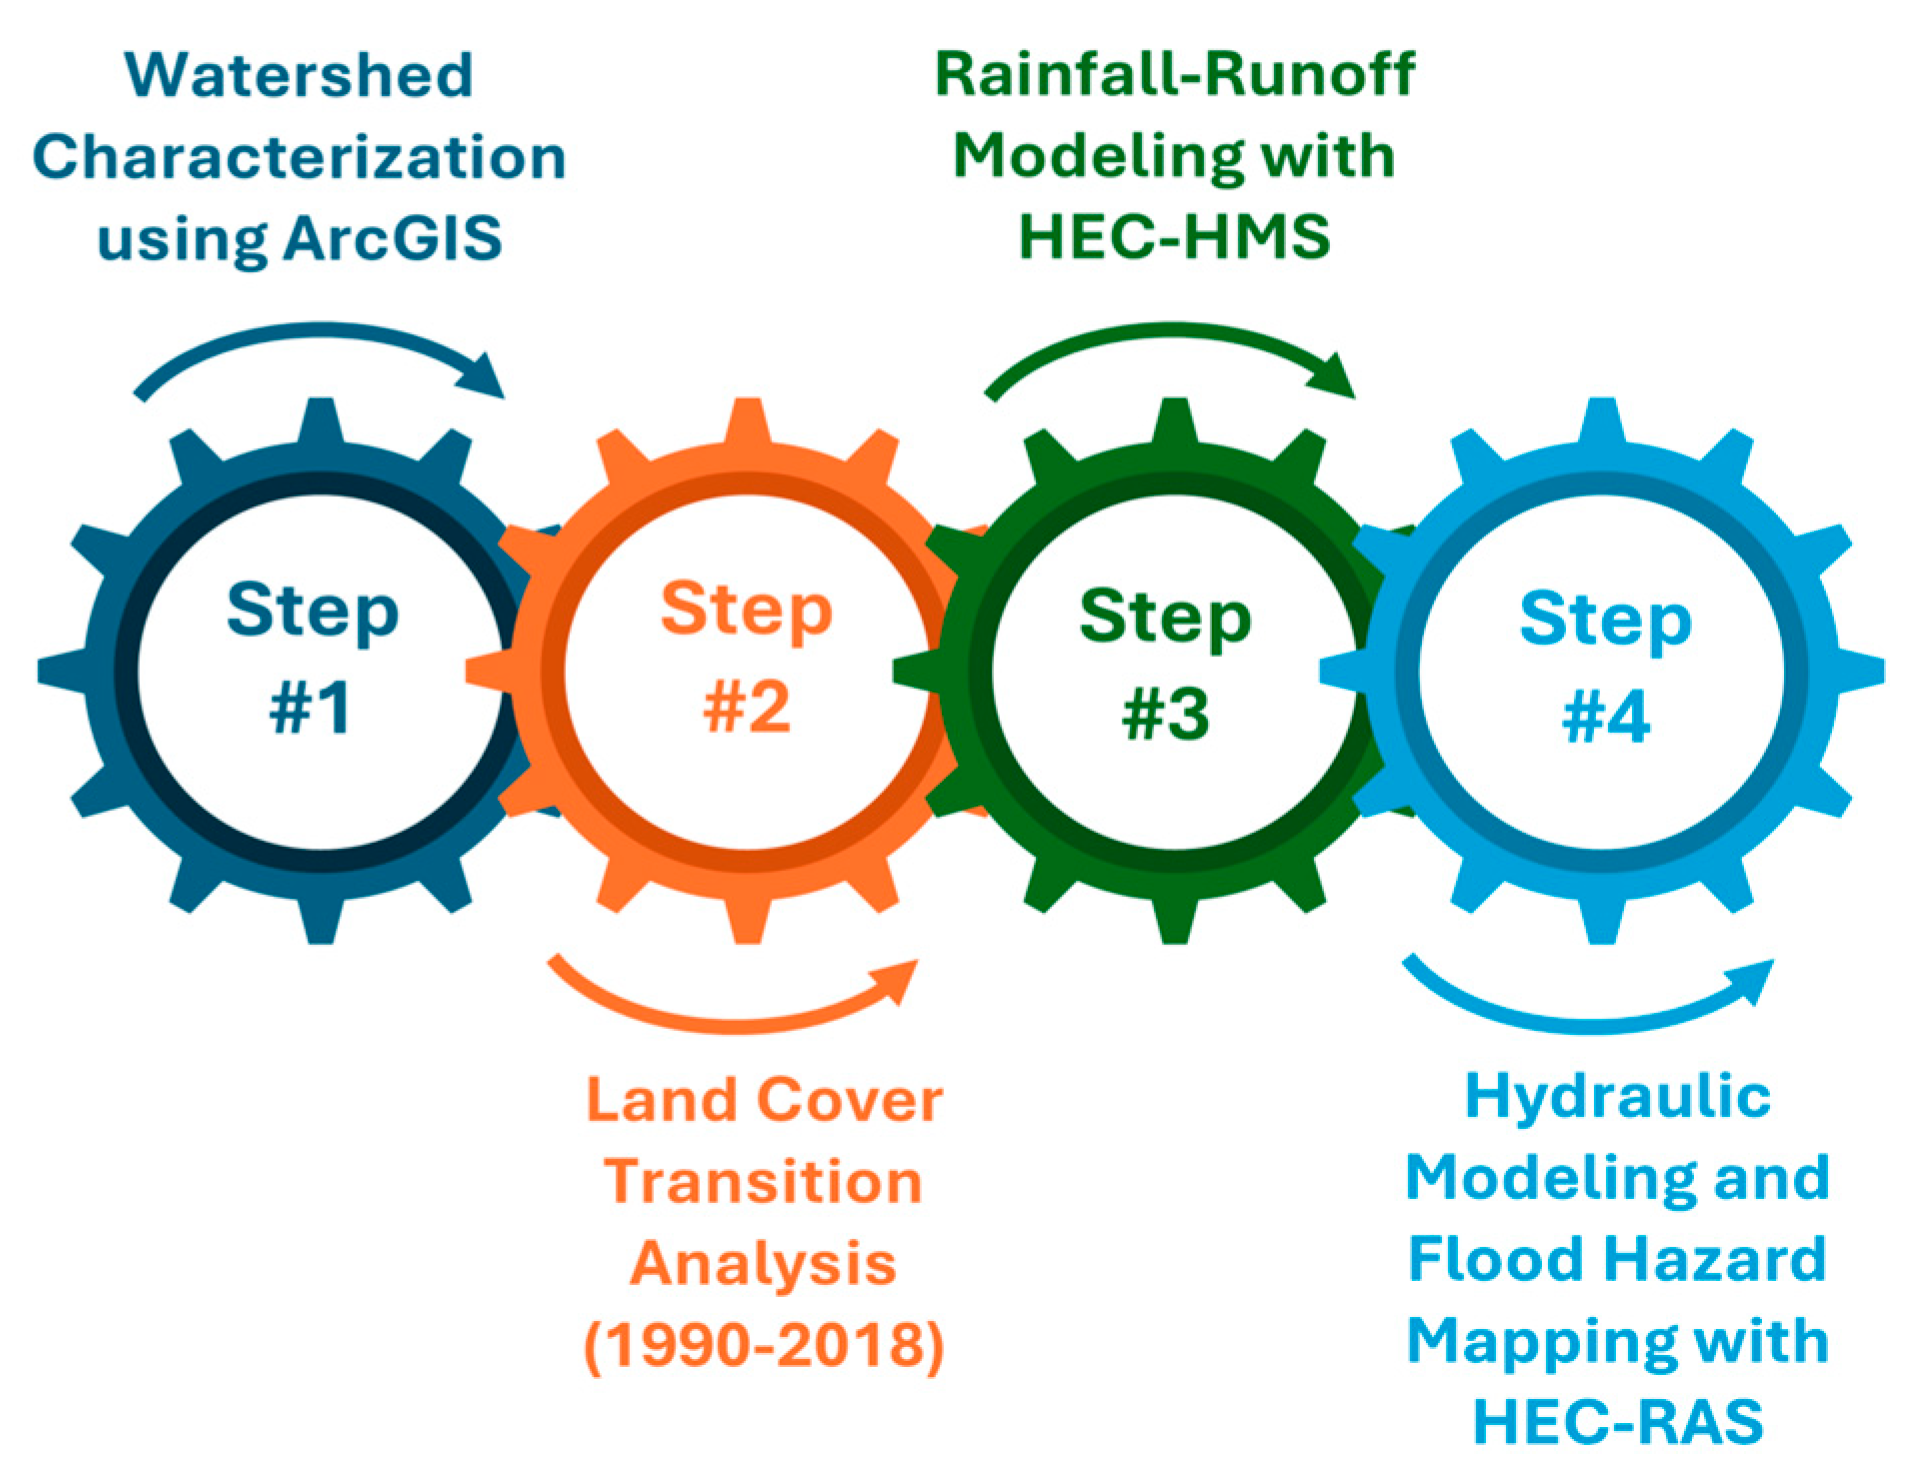
The methodological framework applied in this study is structured into four key steps. These stages leverage a combination of geospatial, hydrological, and hydraulic modeling tools towards flood hazard mapping, and are described as follows (
Figure 1):
Step 1: Watershed Characterization using ArcGIS: The first step involves the delineation and characterization of the watershed, a process facilitated by ArcGIS Pro 3.7 software. This stage is fundamental for establishing the physical boundaries and hydrological features of the watershed. Key parameters such as watershed area, slope, stream network, and other morphometric properties are derived through Digital Elevation Model (DEM) analysis. The extracted watershed characteristics serve as foundational inputs for subsequent hydrological modeling. These attributes are essential for accurately simulating rainfall–runoff processes, as they determine the catchment’s capacity to convey water during storm events.
Step 2: Land Cover Transition Analysis (1990–2018): In the second step, the study employs geospatial techniques to analyze patterns of land cover change over a nearly three-decade period (1990–2018). This temporal analysis is performed using the Copernicus programme datasets, processed within ArcGIS to quantify transitions between different land cover types, such as urbanization, deforestation, or agricultural intensification. The land cover change analysis is crucial because shifts in vegetation cover, urbanization, or agricultural practices significantly influence runoff generation and hydrological responses within the watershed. Understanding these changes informs model inputs and aids in evaluating the impact of human activities on hydrological processes.
Step 3: Rainfall–Runoff Modeling with HEC-HMS: In the third step, the hydrological model HEC-HMS (Hydrologic Engineering Center-Hydrologic Modeling System) is employed to simulate rainfall–runoff processes within the delineated watershed. The inputs for this model include the watershed geometric characteristics derived from ArcGIS and the land cover data from the second step. HEC-HMS is selected for its robustness in simulating complex hydrological processes, such as surface runoff, across diverse landscapes. The output of this step is the hydrograph, which represents the temporal distribution of runoff generated by different rainfall events.
Step 4: Hydraulic Modeling and Flood Hazard Mapping with HEC-RAS: The final step integrates the hydrological outputs from HEC-HMS into the hydraulic model HEC-RAS (Hydrologic Engineering Center-River Analysis System). The hydrographs, along with the geometric data from the watershed, are used to simulate the flow of water through the main river channel. HEC-RAS allows for a detailed analysis of water surface profiles and flow velocities, providing critical insights into the spatial extent of potential flood inundation. The results from HEC-RAS are then used to generate flood hazard maps, which visually represent areas at risk of flooding under different return period events. These maps serve as a valuable tool for risk assessment and decision making in floodplain management and landscape planning.
2.2. Study Area
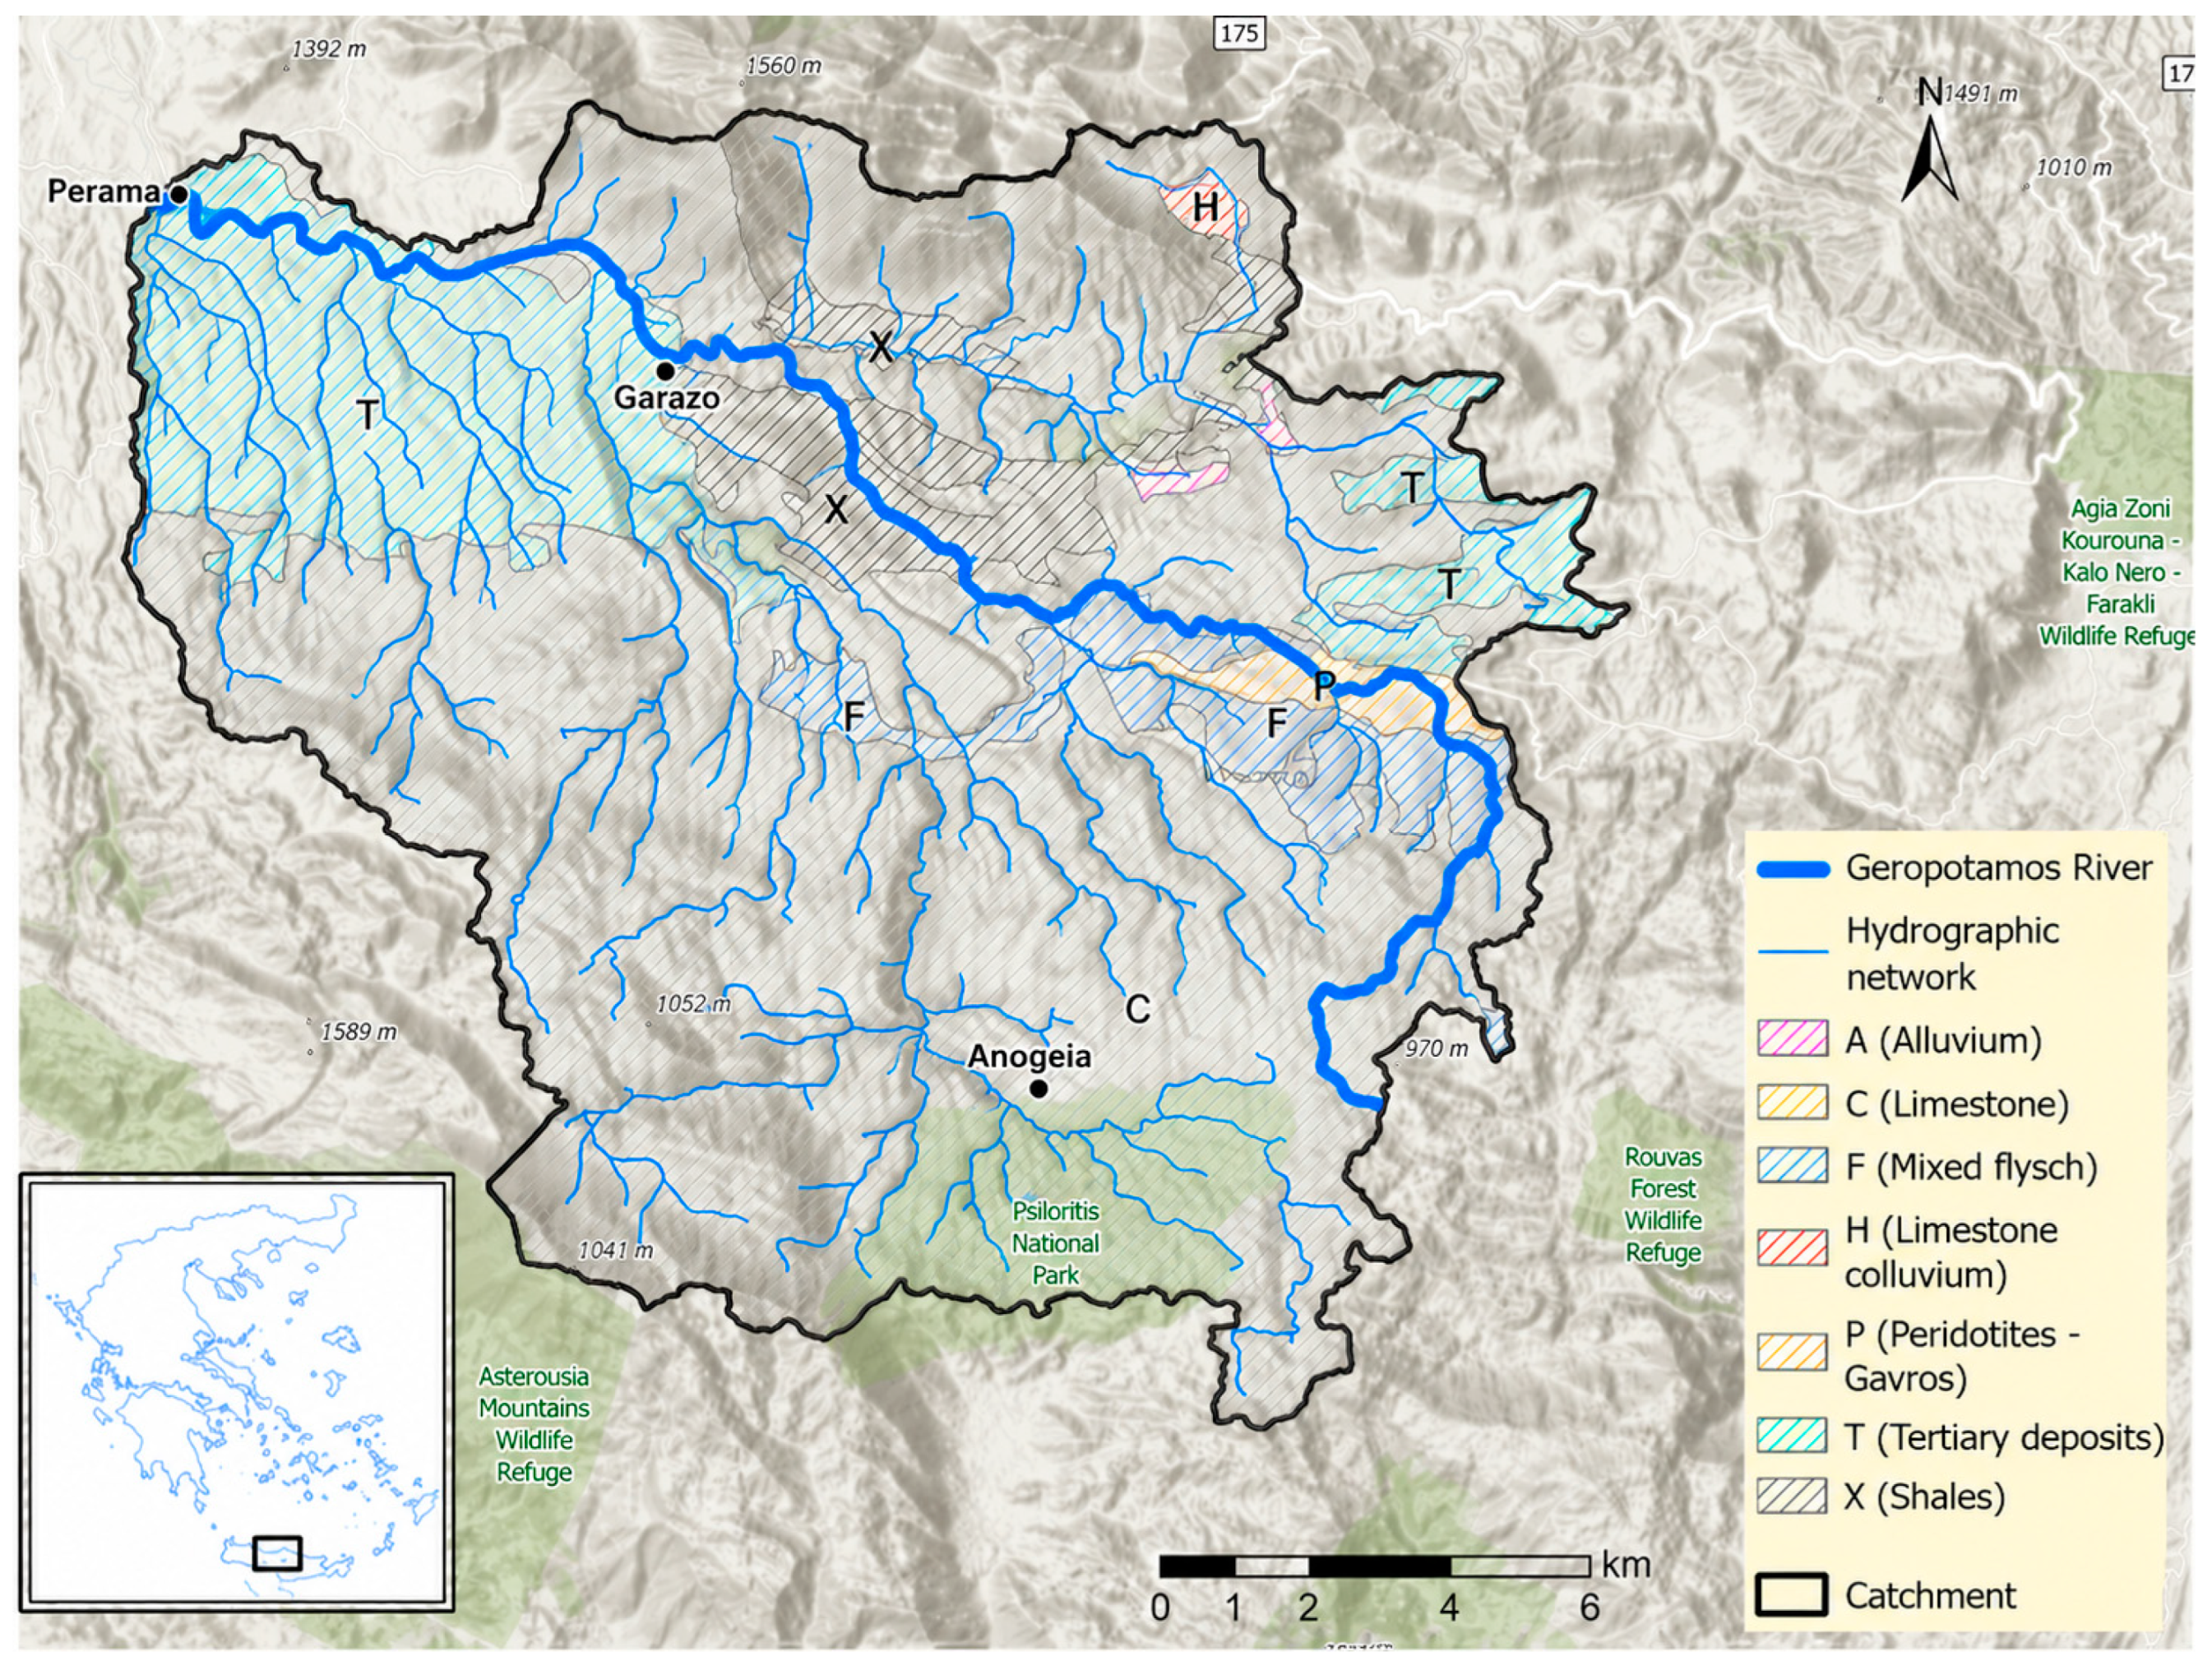
The Geropotamos watershed, covering an area of 400.80 km
2, is located on the island of Crete in southern Greece, between latitudes 35.30° N and 35.43° N, and longitudes 24.64° E and 24.94° E (
Figure 2). This study focuses on a 276.80 km
2 portion of the basin, which was used as the modeling domain for both the hydrological and hydraulic analyses. The elevation within the watershed under study reaches nearly 2455 m, with an average altitude of approximately 765 m above sea level. The study area exhibits a typical Mediterranean climate, also known as a hot-summer Mediterranean climate (classified as Csa by Köppen), characterized by an average annual precipitation of about 600 mm. The area dictates a strong seasonal variation in rainfall distribution. Maximum precipitation is recorded during the wet winter months, predominantly in December and January. Conversely, minimum precipitation occurs during the extended dry summer period, with July and August typically experiencing little to no rainfall. To adequately capture spatial and altitudinal variability, data from three meteorological stations were utilized: Anogeia (724 m a.s.l.), Garazo (260 m a.s.l.), and Perama (54 m a.s.l.). The daily precipitation records for Anogeia (63 years), Garazo (14 years), and Perama (50 years) indicate historical maximum daily rainfall events of 294.1 mm, 194 mm, and 185 mm, respectively. This broader region represents a vital hydrological system, providing a variety of provisioning ecosystem services, such as essential water resources for agriculture, industry, and municipal use. Additionally, the watershed sustains a rich biodiversity of plant and animal species, including several that are designated as endangered or threatened. More than half of the watershed (68.5%) is covered by forests and seminatural areas, while 31% consists of agricultural land, and 0.5% is classified as artificial surfaces.
2.3. Land Use Land Cover
This section concentrates on analyzing land cover changes in the study area, utilizing data from the CORINE (Co-ordination of Information on the Environment) Land Cover (CLC) programme, managed by the European Environment Agency (EEA) [
49]. The EEA oversees the national teams responsible for producing the national CLC datasets, which collectively form the pan-European CLC. The CLC provides a series of European landscape maps derived from satellite imagery, freely accessible via the Copernicus project website. The CLC dataset has limitations in detecting micro-scale land use changes due to its resolution; however, it remains a highly robust, standardized, and widely adopted tool for small-scale hydrologic and hydraulic analyses across Europe [
50,
51,
52,
53,
54,
55]. This is particularly relevant in the Greek context [
56,
57,
58,
59], where the absence of a comprehensive national land use inventory makes the CLC the most reliable and consistent data source for long-term LULC analysis. Furthermore, the CLC datasets demonstrate a thematic accuracy exceeding 85% while the CLC2018 dataset provides improved geometric accuracy (<10 m), enhancing the detection of land cover changes. The objective of this study is to assess the hydrological response to LULC changes at the watershed scale (~277 km
2), where aggregated land cover patterns, rather than fine-scale ones, govern runoff generation processes. Therefore, the adopted spatial resolution is considered appropriate for capturing the dominant hydrological dynamics influencing the simulated hydrographs.
LULC changes were identified using a post-classification comparison approach, based on the spatial overlay of CLC datasets for the years 1990, 2006, and 2018 within a GIS environment. Changes were quantified by detecting transitions between land cover classes over time. To ensure a continuous spatial distribution for subsequent Curve Number (CN) estimation, this study utilized CLC datasets rather than the pre-processed Copernicus CLC Change (CHA) products. While the CHA datasets are limited to areas of detected land cover modification, the full CLC layers provide complete spatial coverage of the catchment, which is essential for deriving spatially distributed CN values and for hydrological modeling. This approach is essential for capturing the complete land cover state across the entire catchment, allowing for a more robust and consistent estimation of hydrological parameters across the entire watershed.
The classification of land cover types is based on an evaluation of landscape features such as shape, size, color, texture and pattern [
60]. The CORINE classification system identifies 44 third-level and 15 second-level distinct land cover classes across 5 hierarchical levels. The principal aim of the CORINE programme is to classify land by its physical characteristics, i.e., land cover, as opposed to its function for human activities, i.e., land use.
The original third-level land cover classes were reclassified into a simplified system with 12 categories, followed a framework proposed by Fernández-Nogueira & Corbelle-Rico [
61] (
Table 1). This framework is designed to emphasize agricultural and forest areas, which are predominant in the study area, while enabling an initial assessment of net changes and transitions among categories based on the total area occupied.
To gain insights into land development patterns, land cover changes, termed land cover flows, were classified into seven distinct categories as follows: “Urbanisation” (URB), which involves converting agricultural land and forests into artificial surfaces; “Intensification of agriculture” (INAGRI), which refers to transitioning from low- to high-intensity agricultural uses; “Extensification of agriculture” (EXAGRI), which is the reverse of intensification, shifting from high- to low-intensity agricultural practices; “Afforestation” (AFFO), which involves establishing or re-establishing forest land; “Deforestation” (DEFO), which refers to converting forests into non-forest areas; “Water bodies construction” (WAT), which pertains to creating and managing water bodies; “De-urbanisation” (DEURB), which refers to conversion of artificial surfaces into agricultural, natural or semi-natural areas; and “Other” (OTH), which encompasses any land cover changes not classified within the aforementioned categories [
60,
62].
The first pan-European land cover dataset, CLC1990, was followed by CLC2000, with subsequent updates occurring every six years, in 2006, 2012, and 2018 based on photographic interpretation of Landsat-5 MSS/TM, Landsat-7 ETM, SPOT-4/5 and IRS P6 LISS III, IRS P6 LIS III and RapidEye, Sentinel-2 and Landsat-8 satellite images, respectively. The number of countries participating in the CORINE programme has grown steadily over time, with 32 EEA member countries, the UK, and six cooperating countries, covering an area of approximately six million km
2. The geometric accuracy of all images is less than 25 m, with the exception of Landsat-5 and Sentinel-2 images, which exhibit accuracies of less than 50 m and 10 m, respectively. With a minimum mapping unit of 25 ha and a 100 m mapping width, the CLC’s quality assessments ensure an accuracy exceeding 85% for CLC2000 and subsequent datasets [
63]. The CLC2018 dataset spans the period 2017–2018 and marks a significant enhancement in the programme’s capacity to monitor land cover changes with greater precision. A key improvement in CLC2018 is its exceptionally high geometric accuracy, featuring a spatial resolution of less than 10 m. This updated dataset delineates the predominant land cover among 11 fundamental land cover classes. This increased accuracy enables more detailed and reliable analyses of land cover patterns, making it particularly valuable for detecting fine-scale environmental changes, such as urban expansion and agricultural modifications. The enhanced resolution of CLC2018 broadens its applicability across various domains, from localized environmental management to broader policy development, reinforcing its role as a crucial resource for spatial and environmental planning across Europe.
2.4. Design Storm Estimation
Design rainfall events for return periods of 50, 100, and 500 years were estimated using Intensity Duration Frequency (IDF) relationships derived from the official Greek Flood Risk Management Plans and the associated national rainfall-curve framework developed for flood hazard assessment. To ensure regional representativeness, the estimation was based on the nearest available meteorological stations relevant to the study area. Following the adopted methodology, rainfall intensity,
i(
d,
T), was expressed as a function of storm duration,
d (h), and return period,
T (years), through the general form:
where
i represents the rainfall intensity (mm/h), and
κ,
λ′,
ψ′,
θ, η are empirical parameters of the rainfall curve obtained from the corresponding regionalized IDF relationships. To account for the spatial variability of precipitation across the study area, three representative meteorological stations were selected: Anogeia (724 m), Garazo (260 m), and Perama (54 m). These stations were chosen based on their proximity to the study basin and their ability to capture the altitudinal gradient of the region. For each sub-basin, the rainfall intensity was assigned based on: (i) the spatial proximity to the nearest meteorological station, and (ii) the consistency between the mean elevation of the sub-basin and the elevation of the station. In particular, sub-basins located at higher elevations were associated with the Anogeia station (724 m), while lower-elevation areas were linked to the Garazo (260 m) and Perama (54 m) stations. This approach ensures that the orographic effects on rainfall distribution are adequately represented in the hydrological simulations. It should be noted that the return period of a flood event does not necessarily coincide with the return period of the rainfall event that generates it. This is due to the influence of multiple hydrological factors, including infiltration processes, soil saturation conditions, catchment characteristics, and runoff transformation mechanisms. This distinction was taken into account in the present study when selecting the design rainfall inputs, ensuring that the simulated flood responses are consistent with realistic hydrological conditions.
Since IDF relationships refer to point rainfall, an areal reduction factor,
φ, was applied to estimate areal precipitation over the watershed:
where
A is the surface area of the basin (km
2) and
d the rainfall duration (h). The areal rainfall depth was then derived accordingly.
Finally, synthetic design hyetographs were constructed from the derived rainfall depths and used as input in the rainfall–runoff model for the simulation of flood events corresponding to the selected return periods. The design hyetograph represents the temporal distribution of the total design rainfall into discrete time steps. For this purpose, the alternating block method is used, which provides the cumulative rainfall distribution as a percentage of the total rainfall depth as a function of a dimensionless time variable.
The return periods considered in this study (50, 100, and 500 years) are not derived from the temporal length of the LULC datasets (1990–2018), but are based on design rainfall events obtained from IDF relationships provided by official flood risk management frameworks. The LULC datasets are used exclusively to represent different land surface conditions at distinct time periods, forming a set of scenarios. Therefore, the duration of the LULC records does not constrain the estimation of extreme rainfall events. In this context, the 500-year return period event is used as a design scenario to assess the sensitivity of the watershed to extreme hydrological forcing under different land use conditions. This approach is commonly adopted in flood hazard assessments and is used here to examine how a hypothetical extreme event would behave under different historical catchment conditions to isolate the impact of landscape change.
2.5. Rainfall–Runoff Simulation
The hydrological HEC-HMS model was developed by the U.S. Army Corps of Engineers in 1998 as a comprehensive tool for simulating the hydrological processes associated with watershed systems and flood events, in both small urban and rural catchments as well as large river systems [
64]. This model is designed to handle both continuous and event-based hydrological simulations, making it particularly effective for capturing the complexities of rainfall–runoff interactions, streamflow generation, and other key hydrological dynamics. The semi-distributed nature of HEC-HMS allows for the representation of spatial variability within a watershed, enabling it to account for variations in land use, soil properties, antecedent moisture conditions and management practices, providing an effective means of transforming rainfall into runoff [
65,
66].
Globally, the HEC-HMS model has been widely adopted by hydrologists and engineers to simulate a range of hydrological processes, including flood modelling and watershed management. Its flexibility and adaptability across diverse climatic and geographic conditions have led to successful applications in regions ranging from temperate to arid environments. Its widespread use and continuous development underscore its importance as a robust tool for hydrological research and practical water management applications [
67,
68,
69].
The HEC-HMS model partitions the whole catchment into sub-areas characterized by homogeneous land use and soil properties. The model generates hydrographs for these sub-catchments and routes water and sediment flows through the channel network to the catchment outlet [
70]. To simulate surface runoff, HEC-HMS employs several components: (i) defining the catchment area, sub-catchments, and stream network; (ii) calculating precipitation for each sub-catchment; (iii) estimating losses (e.g., Green and Ampt, Natural Resource Conservation Service-Curve Number (NRCS-CN); (iv) transforming rainfall excess into direct surface runoff (e.g., SCS unit hydrograph, Clark unit hydrograph, and Snyder unit hydrograph); (v) estimating base flow (e.g., recession and constant monthly); and (vi) performing channel routing (e.g., kinematic wave, Muskingum, and Muskingum–Cunge) [
64,
71].
In this study, the NRCS-CN method was employed in the HEC-HMS model as the production function for the simulation of the infiltration and surface drainage processes [
72]:
where
represents the excess precipitation (mm),
denotes the cumulative rainfall depth from the beginning of the studied storm (mm),
is the initial losses (mm), and
refers to the maximum water retention potential (mm). In the NRCS-CN method, the initial losses are given by the relationship
, which suggests that 20% of the maximum retention capacity is accounted for as initial losses before runoff occurs. The retention potential
is intrinsically linked to the Curve Number
, which can be determined based on a combination of factors, including the hydrologic soil group, land cover classification, and initial soil moisture conditions. The NRCS CN method defines three initial soil moisture conditions: dry (wilting point), moderately moist, and fully moist (field capacity). The
value provides an empirical estimate of runoff potential, with lower values indicating greater retention and infiltration capacity, while higher values signify increased runoff likelihood. The maximum water retention potential
is estimated as:
The hydrological classification of a specific soil type is determined by its final constant infiltration rate (
), which represents the soil’s hydrological characteristics. The composite CN value for each sub-basin can be derived based on the land use and soil conditions within that sub-basin. The empirical formula used to estimate the final constant infiltration rate is as follows:
where
represents the mean particle diameter of soil.
The SCS Unit Hydrograph method was employed in this study to generate a representative hydrograph by incorporating the specific characteristics of the watershed, thereby effectively modeling the runoff response. The method’s primary parameter is the lag time (
), defined as the time interval between the center of mass of the rainfall excess and the peak of the unit hydrograph [
73]. The lag time can be determined using the following equation:
where
represents the conversion coefficient,
is the basin coefficient,
is the distance from the riverhead to the outlet section of the main channel, and
is the distance from the outlet section of the main channel to the basin’s center.
The Recession model was utilized to estimate base flow and describe drainage from natural storage in a watershed, incorporating three parameters: the base flow threshold ratio to peak, the recession constant, and the initial value [
74]. It establishes the relationship between the base flow
at any time
and the initial value
as follows:
where
represents an exponential decay constant. When using the recession model, a threshold flow needs to be defined after the peak of the direct runoff, either as a specific flow rate or as a ratio relative to the computed peak flow.
The Muskingum method was employed for channel flow routing, utilizing two parameters: travel time through the reach (
) and the Muskingum weighting factor (
). The method is represented by the following equation:
where
and
represent the inflows to the routing reach at the beginning and end of the computation step, respectively;
and
denote the outflows from the routing reach at the beginning and end of the computation step, respectively; and
is the duration of the calculation step.
A detailed overview of the fundamental principles underlying the HEC-HMC model is provided in [
75].
2.6. Channel Flow Simulation
Numerical flood simulation models play a pivotal role in quantitative flood risk assessment, serving as essential tools for analyzing and predicting the spatial dynamics of flood events [
76].
In this study, the hydraulic HEC-RAS model is employed due to its widespread recognition and capability in conducting one-dimensional (1D) hydraulic simulations. HEC-RAS was developed in 1994 by USACE (United States Army Corps of Engineers) and is extensively used for simulating water flow through both natural river systems and engineered canals within different conditions [
77]. Its application in this research enables a detailed simulation of flood dynamics, contributing to the broader understanding of the hydrological behavior of the study area. In 1D modelling, the longitudinal flow in the main channel and floodplains is considered, making it a suitable method for evaluating the flow path direction. HEC-RAS calculates the water surface profiles of successive channel cross-sections by solving the energy equation using the standard step-backwater method as described in the following equation [
78]:
where
represents the water depth in the two cross-sections (m);
denotes the heights of the main channel above the datum (m),
indicates the average velocity (m/s);
is the velocity weighting coefficient;
is the acceleration due to gravity (m/s
2); and
is the head loss of energy level (m).
The energy head loss between cross-sections 1 and 2 is calculated as shown in the next equation [
78]:
where
represents the distance between cross-sections 1 and 2 along the water flow direction (m);
is the representative friction slope between two adjacent sections (m/m); and
is the contraction or expansion loss coefficient.
The Manning’s equation utilized in the HEC-RAS model for steady flow conditions calculates the flow discharge as shown in the following equation:
where
is the flow discharge (m
3/s),
refers to Manning roughness coefficient,
denotes the flow area (m
2), and
is the hydraulic radius (area/wetted perimeter) (m).
HEC-RAS 1D requires geometric data, which involves creating a schematic of a river system to establish its connectivity. This is done by inputting cross-section data, which includes defining junction information, adding hydraulic structures, and interpolating cross-sections. The cross-section data is entered after completing the river schematic, providing geometric boundaries for the stream. Next, Manning’s roughness coefficient is selected, typically based on field observations, and requires judgment, skill, and subjectivity. The expansion and contraction coefficients are also input into the HEC-RAS cross-section data editor, using standard values provided by [
79]. Subsequently, discharge data are imported into the model based on estimated return periods, usually sourced from HEC-HMS model outputs. Upstream and downstream boundary conditions are considered before performing a flow analysis. The results generated by HEC-RAS are then exported to GIS software, forming a polygon that connects the ends of the river’s cross-sections. By using the water surface generation tool, all partitions created by HEC-RAS are identified, and the flood zone extends to both riverbanks, allowing the user to create a flood map.
3. Results
This section presents the outcomes of the land-cover change analysis and of the hydrological and hydraulic simulations performed for the three LULC scenarios (Scenario 1: 1990, Scenario 2: 2006, and Scenario 3: 2018) under design-storm events with return periods of 50, 100, and 500 years. The land-cover transitions detected over the study period are first reported, followed by the simulated peak flows and the corresponding flood extents, depths, and velocities at the watershed outlet. The interpretation of these findings and their comparison with previous studies are addressed in
Section 4.
3.1. Land Cover Variations
The present study focuses on two distinct time periods, 1990–2006 and 2006–2018, to investigate land cover changes and their associated impacts on flood hazard dynamics. By examining these intervals, the study aims to highlight the temporal evolution of land use transformations and assess their implications for hydrological processes, particularly in relation to flood susceptibility.
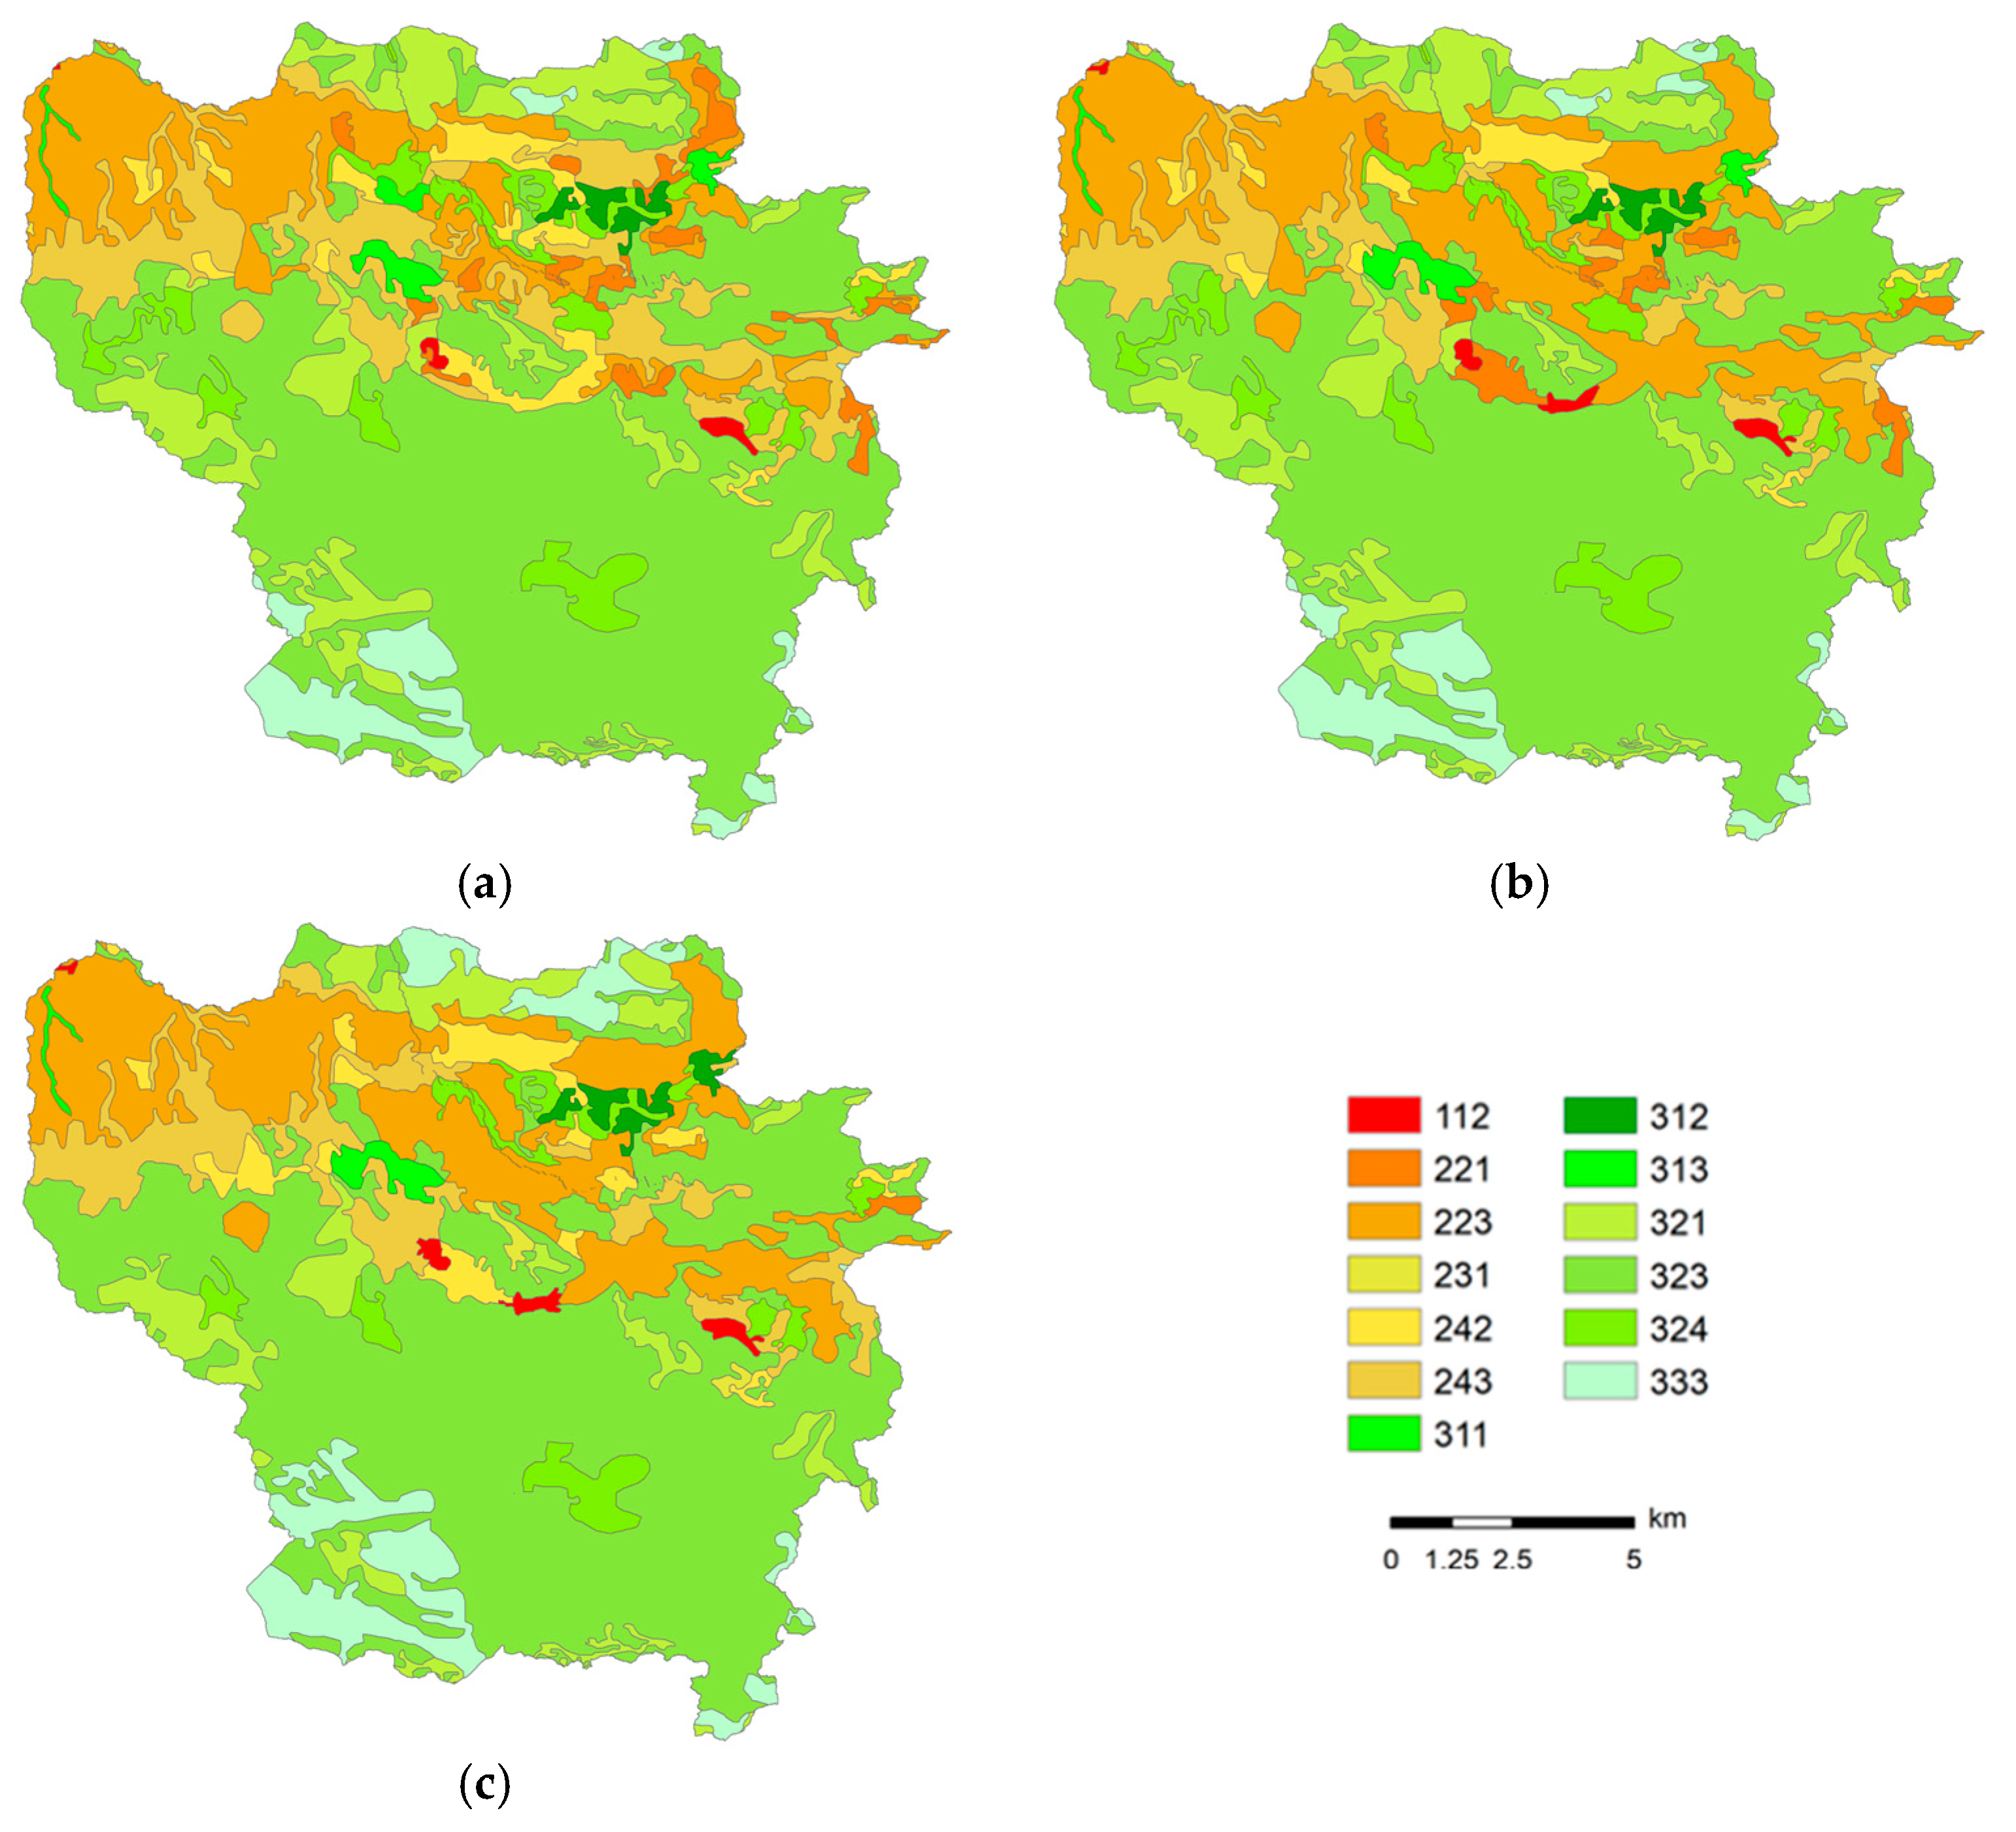
Figure 3 illustrates the spatial distribution of land cover across the study area for the years 1990, 2006, and 2018, as derived from the CLC datasets.
The land cover flows towards “Urbanisation”, “Intensification of agriculture”, “Extensification of agriculture”, “Afforestation”, “Deforestation”, “Water bodies construction”, “De-urbanisation” and “Other” classification are presented in
Table 2 for the two sample periods: 1990–2006 and 2006–2018.
During the period 1990–2006, land cover dynamics were primarily driven by agricultural intensification, which accounted for 68.19% of the total land cover changes. This trend reflects a shift towards more intensive agricultural practices, likely influenced by socio-economic and policy-driven factors such as agricultural subsidies, market demands, and technological advancements. Other notable land cover transformations during this period included other land cover changes (17.68%) and afforestation (6.16%), while all remaining land cover modifications occurred at even lower rates. The relatively low afforestation rate suggests limited large-scale reforestation efforts or natural forest expansion within the study area during this timeframe.
In contrast, during the period 2006–2018, land cover transitions exhibited a different pattern, with deforestation emerging as the dominant land cover change, accounting for 28.21% of the total land cover modifications. This shift may be attributed to increased land demand for agriculture, or other anthropogenic activities leading to forest loss. Following deforestation, agricultural extensification—characterized by a reduction in agricultural inputs and a shift towards more extensive land use systems—was the second most significant land cover change (26.75%). Other notable transformations included other land cover modifications (24.66%) and agricultural intensification (18.33%), with the latter experiencing a relative decline compared to the previous period. The remaining land cover changes occurred at lower rates and are thus considered less significant in shaping the overall land cover dynamics of the study area.
3.2. Hydrograph Production
A hydrologic and hydraulic analysis was carried out for three scenarios—Scenario 1: 1990 land cover, Scenario 2: 2006 land cover, and Scenario 3: 2018 land cover—to assess flood susceptibility and evaluate how changes in land use influence the overall watershed response. Each scenario was assessed under storm events with return periods of 50, 100, and 500 years. For the purpose of the hydrologic analysis, HEC-HMS software has been utilized. The procedure for setting up the models and accurately estimating peak flows involved the following steps:
- (a)
Collection of relevant data, including LiDAR data, soil survey information, watercourses, percentages of impervious surfaces, land use, and parcel data;
- (b)
Delineation of subwatershed boundaries and corresponding flow paths based on the DTM;
- (c)
Estimation of time of concentration and curve numbers;
- (d)
Assignment of meteorological data for the selected return periods to the model;
- (e)
Simulation of each scenario to compute peak flows at each node and at the watershed outlet.
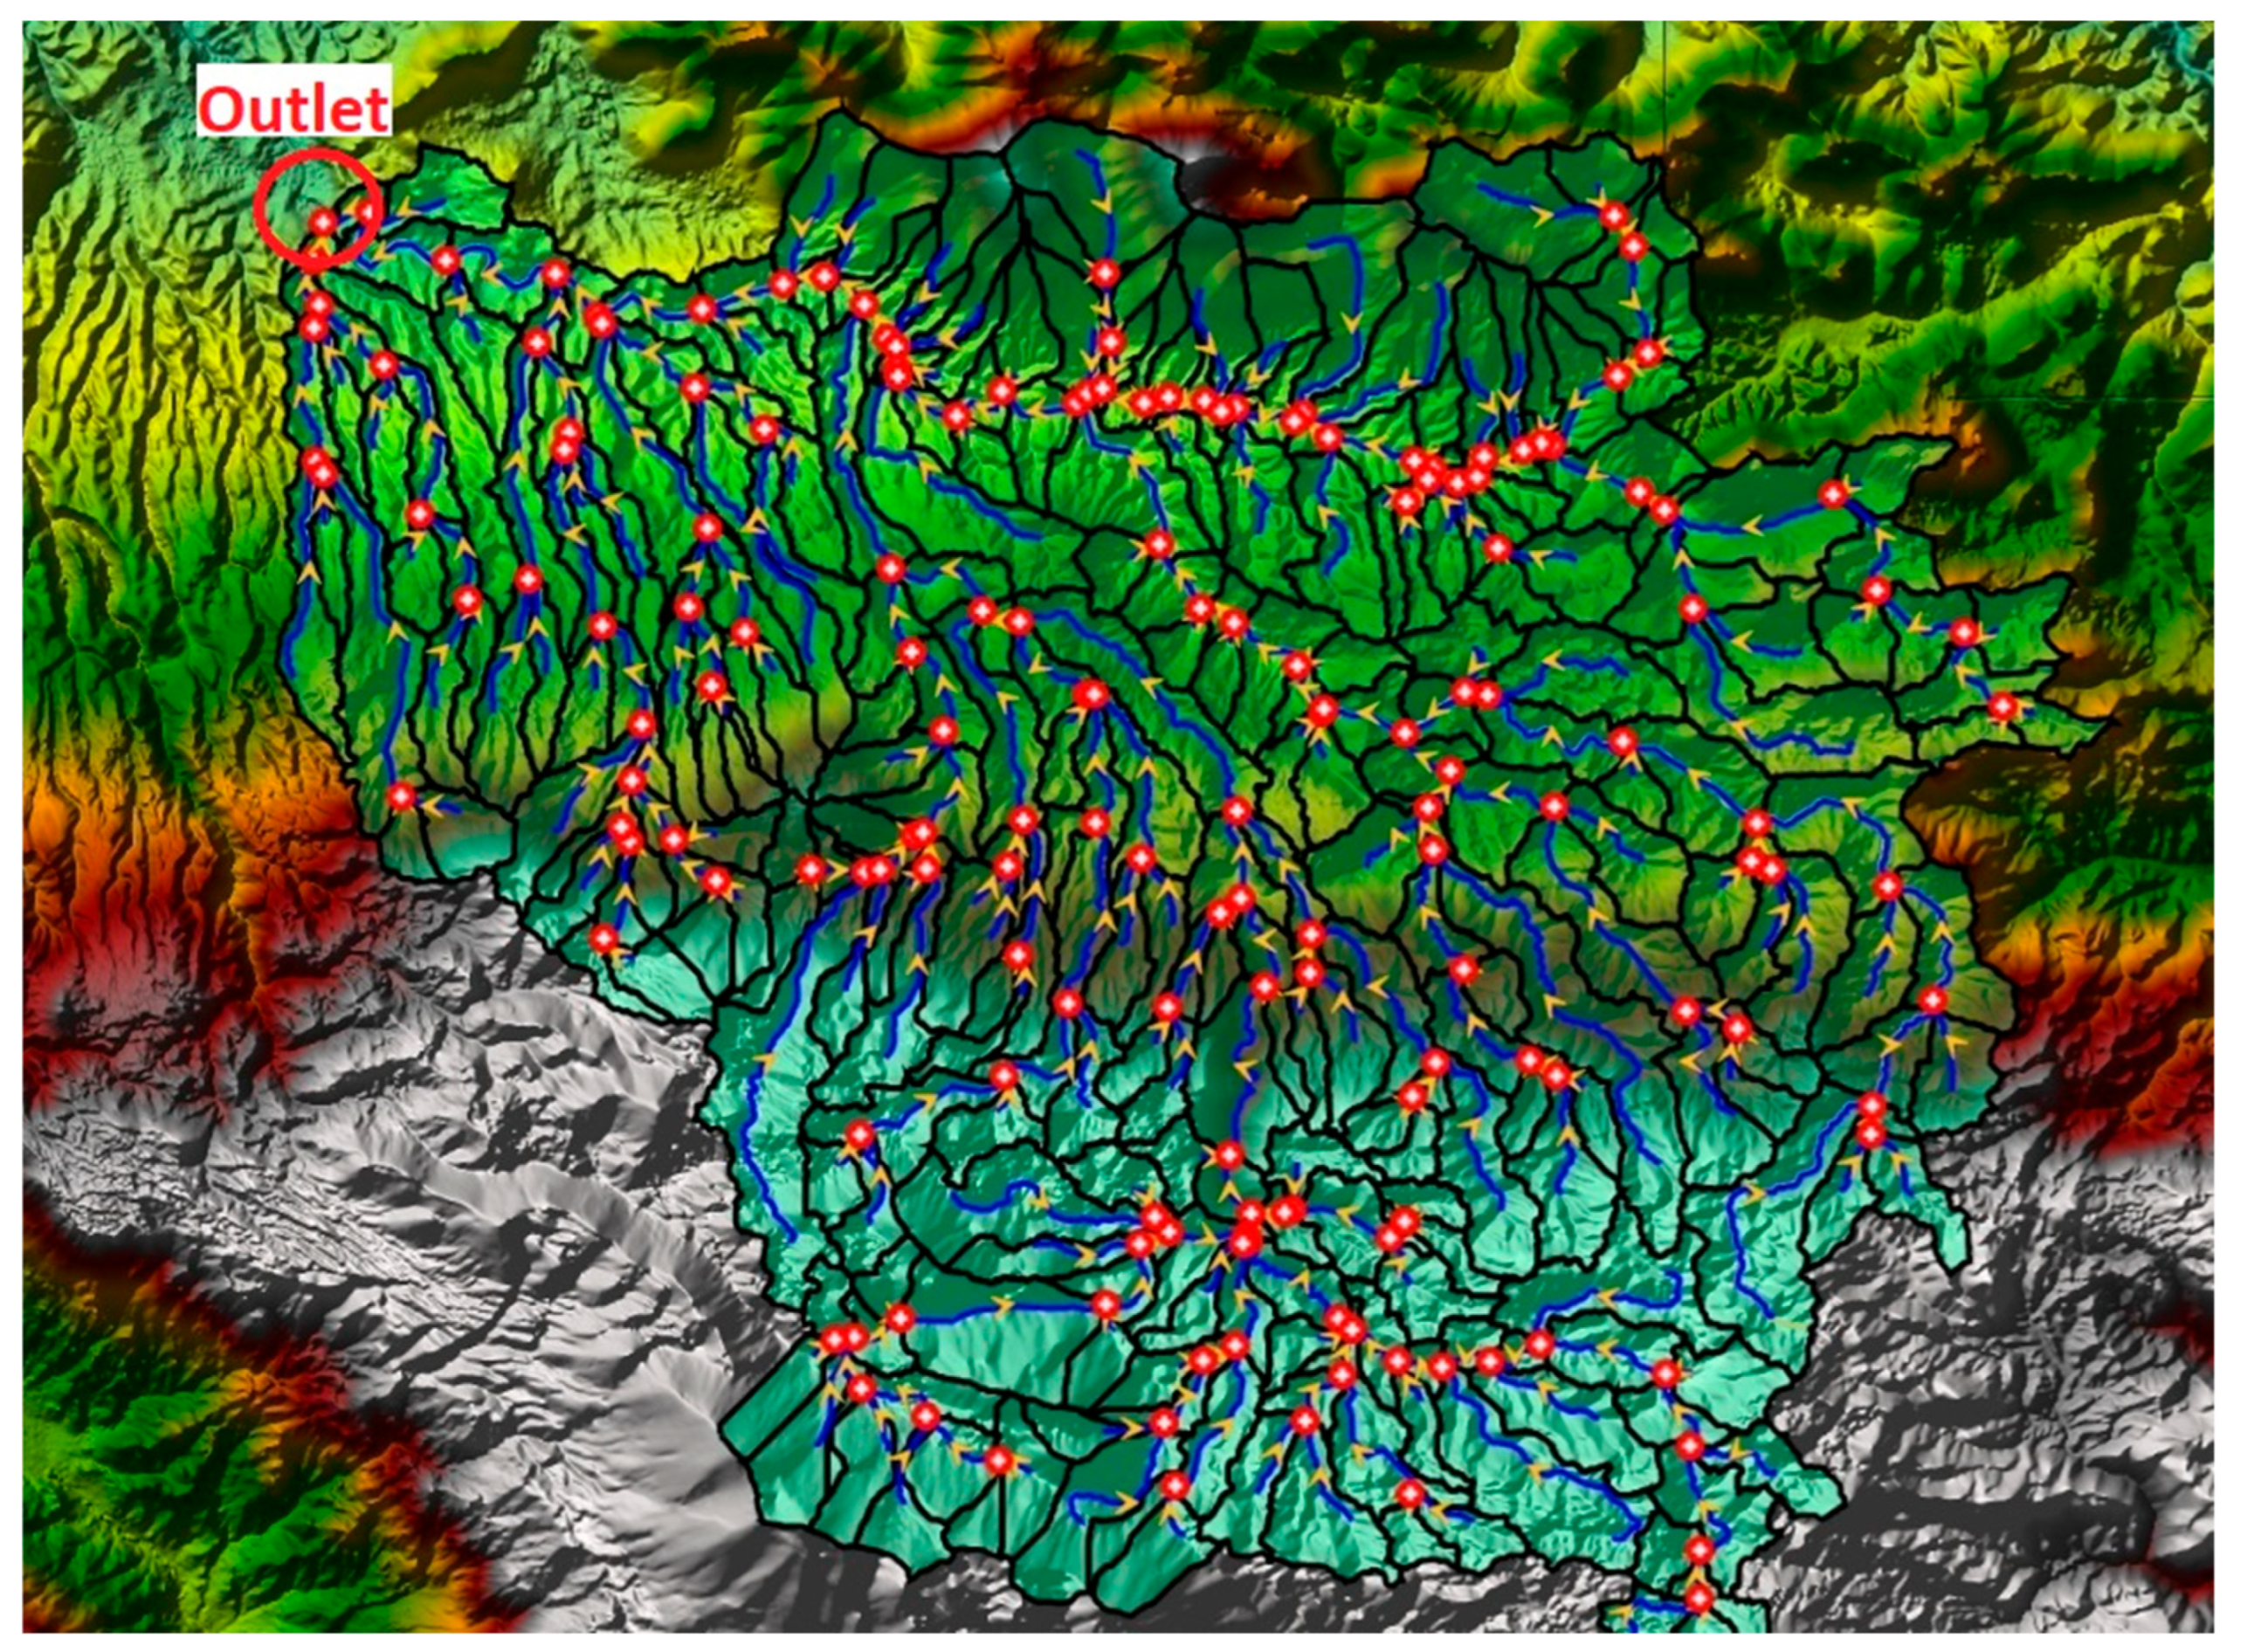
The subwatersheds, flow path directions, and the location of the outlet are illustrated in
Figure 4.
Soil information was derived from available geological and soil datasets of the study area, which were classified into Hydrologic Soil Groups (HSGs A–D) based on their physical properties and inferred infiltration capacities, following the USDA-NRCS classification framework. In particular, the catchment is dominated by limestone formations (72.13% limestone and 0.28% limestone colluvium), which are characterized by significant secondary porosity and potential karstic features (Group A). The Tertiary deposits (16.05%) composed of marly and clayey matrices were categorized as Group C. The siliciclastic sequences of shales (5.76%) and mixed flysch (4.20%) were designated as Group D due to their fine-grained, fissile nature and low primary permeability, which act as primary runoff generators. The igneous peridotite-gabbro complex (1.24%) was assigned to Group D, consistent with the low hydraulic conductivity typical of crystalline bedrock in Mediterranean catchments, while the alluvial deposits (0.34%) are categorized as Group A, presenting high hydraulic conductivity and very low runoff potential. These HSGs were then spatially intersected with the customized LULC classes to derive composite CN values using a weighted approach, consistent with standard SCS methodology. Furthermore, the derived CN values are consistent with those reported in an independent hydrological study of the same basin, where a representative CN value of approximately 72 was estimated, supporting the reliability of the adopted parameterization.
For a representative rainfall duration of 12 h, the estimated rainfall intensities exhibit a clear increase with return period and reflect the spatial variability of precipitation across the study area. Specifically, for a 50-year return period event, the rainfall intensities were 19.4 mm/h at Anogeia, 19.7 mm/h at Garazo, and 14.0 mm/h at Perama. For the 100-year return period, the corresponding values increased to 21.3 mm/h, 21.6 mm/h, and 15.6 mm/h, respectively. For the extreme 500-year event, intensities reached 26.2 mm/h at Anogeia, 26.8 mm/h at Garazo, and 20.0 mm/h at Perama. These results highlight both the sensitivity of rainfall intensity to increasing return periods and the influence of elevation and geographic location, with higher intensities generally observed at stations representing elevated or inland areas compared to lower-altitude coastal zones.
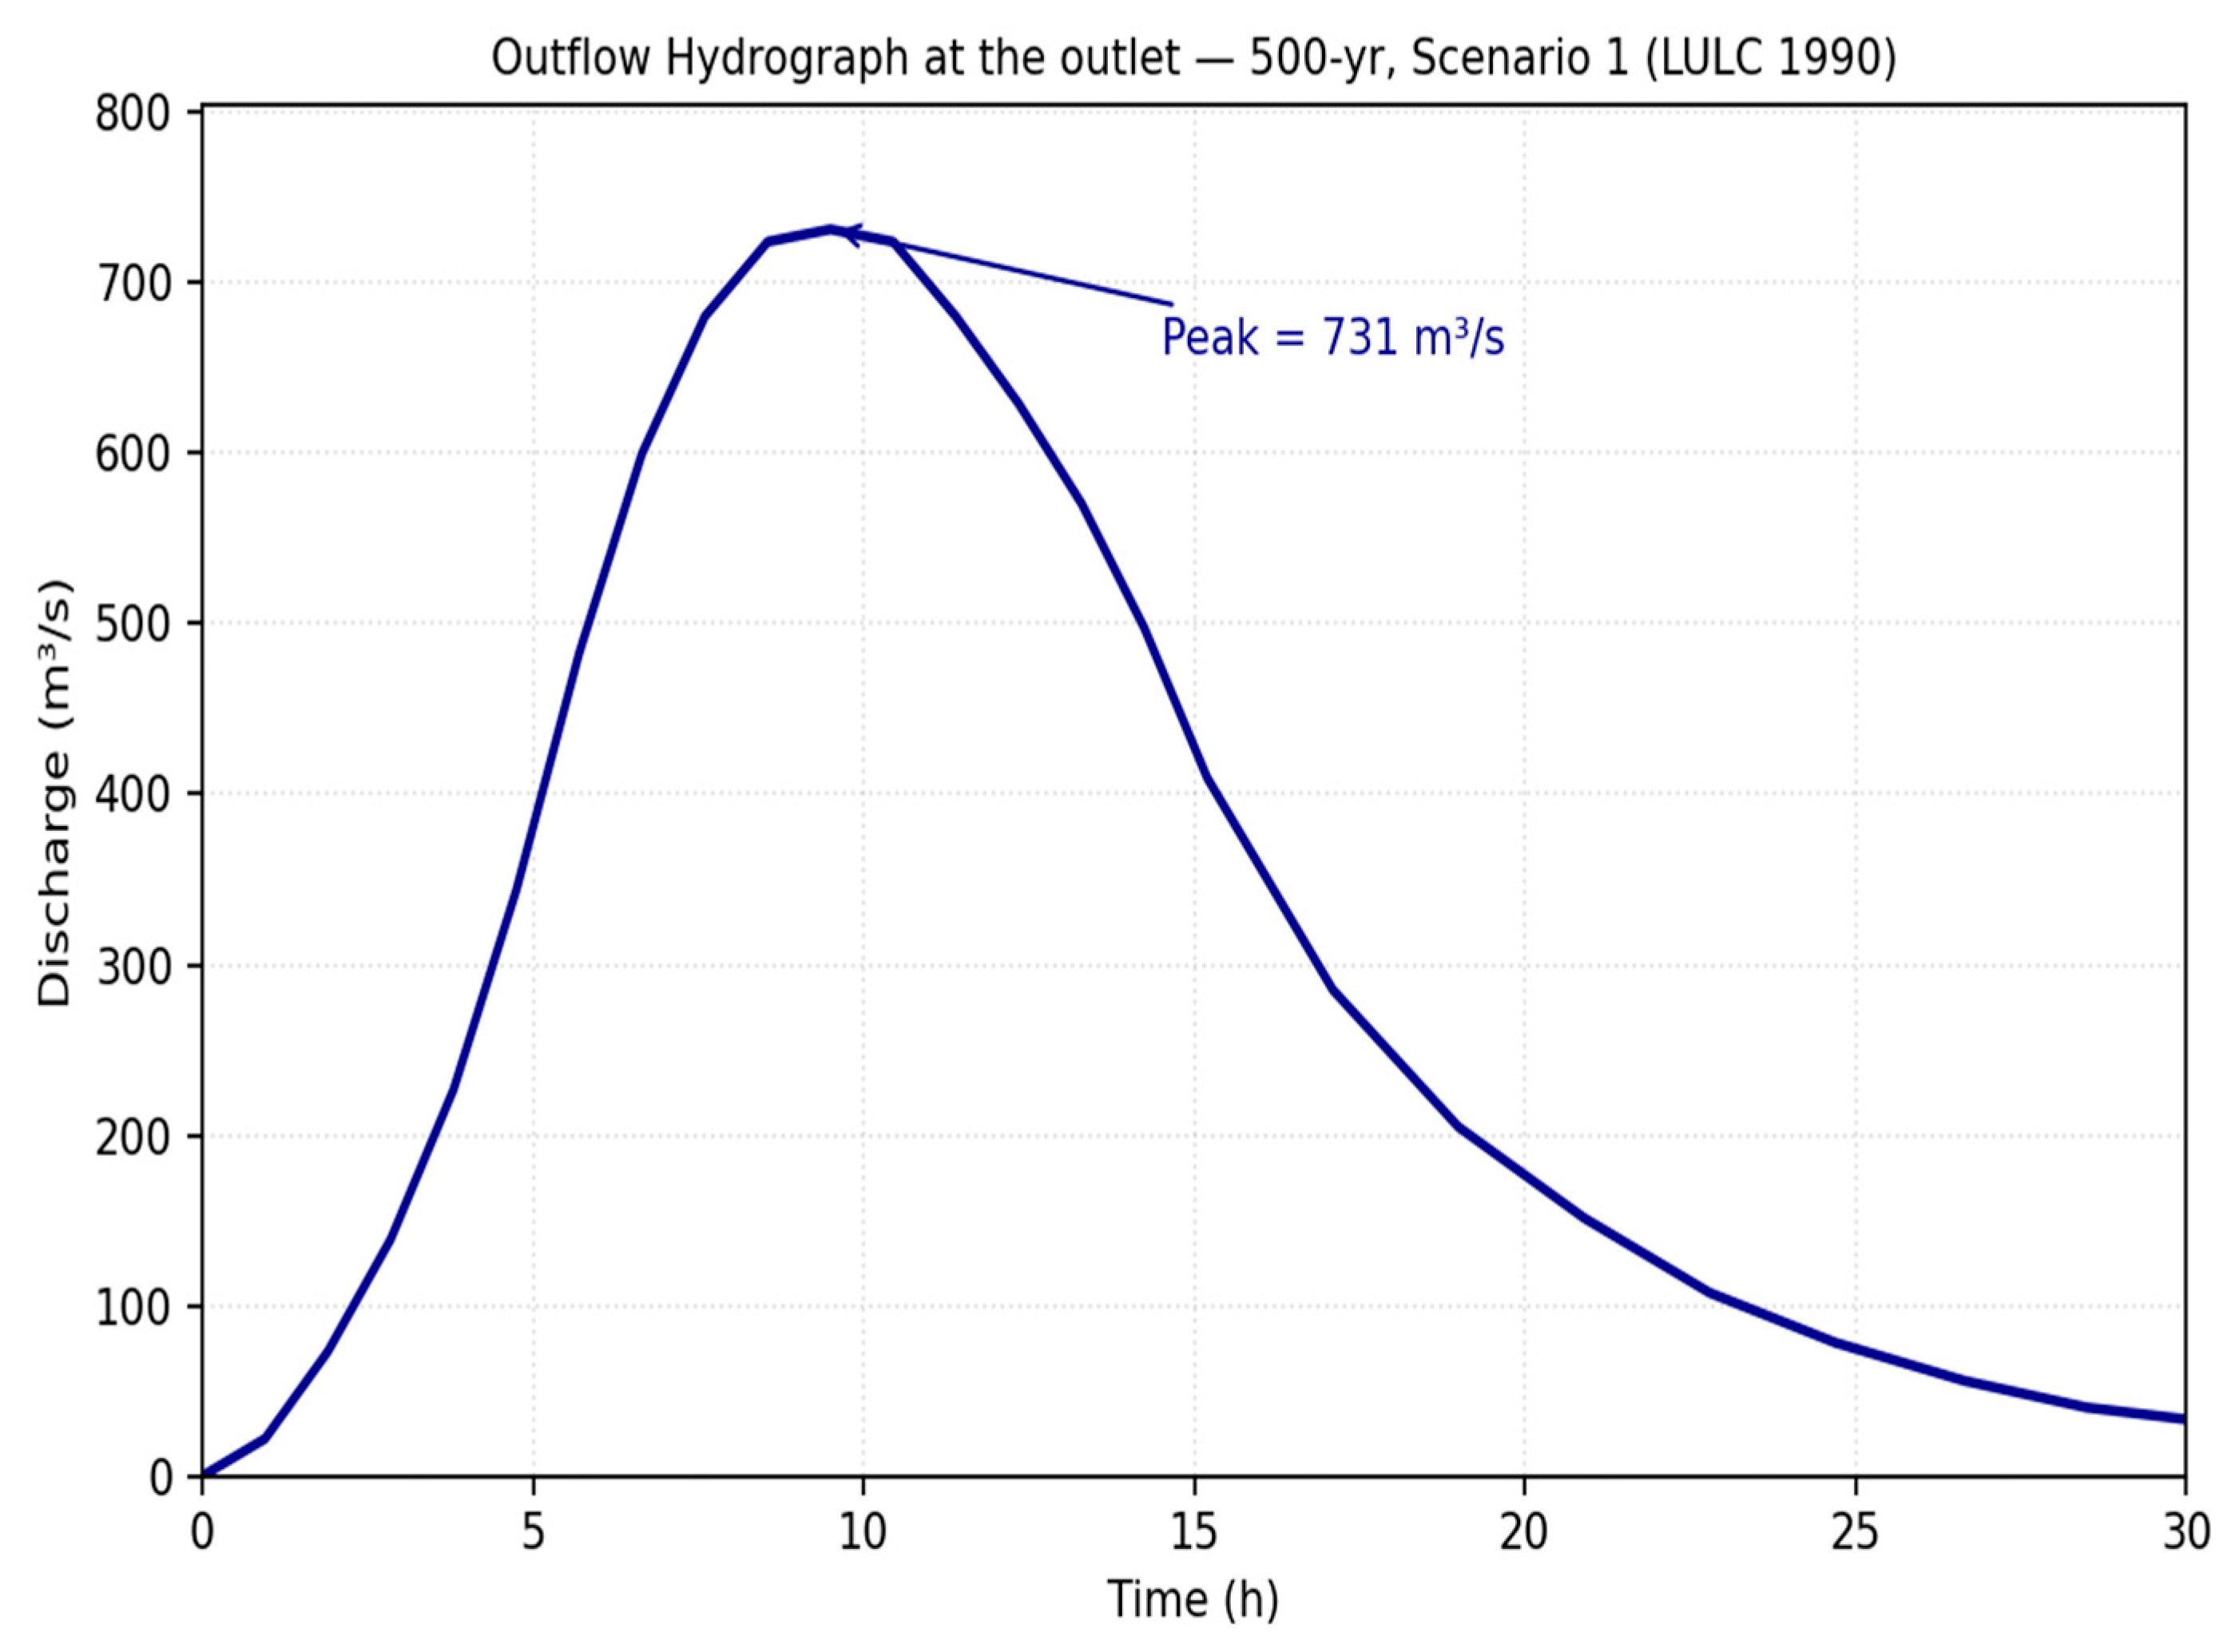
Figure 5 presents the hydrograph for the 500-year storm event under Scenario 1, with a peak discharge of approximately 731 m
3/s and a time-to-peak of about 9.5 h. The hydrograph corresponds to the HEC-HMS outflow at the basin outlet and serves as the upstream inflow boundary condition in HEC-RAS.
Detailed results for all scenarios and storm events are summarized in
Table 3.
As shown in
Table 3, progressive land-use change over time reduces infiltration capacity across the watershed and increases composite CN values, resulting in higher peak flows. Peak discharge at the outlet rises from 352.9 m
3/s (Scenario 1, 50-year) to 602.3 m
3/s (Scenario 3, 50-year), and reaches 1241.2 m
3/s for the 500-year event under Scenario 3, which represents the worst-case condition.
3.3. Flood Extents and Flow Depths
For the hydraulic analysis, the HEC-RAS software was employed. The model setup and estimation of water depths and floodplain extents involved the following steps: (a) collection of input data, including LiDAR data, soil survey groups, watercourse information, percentages of impervious areas, land use, and parcel data; (b) incorporation of derived hydrographs and peak flows from the hydrologic analysis presented in
Section 3.2, along with relevant shapefiles, to determine Manning’s roughness coefficients and other required hydraulic parameters; and (c) simulation of each scenario to estimate water depths at multiple locations and delineate floodplain boundaries. The Manning roughness coefficient (n) used in the HEC-RAS hydraulic model was assigned based on standard values reported in the literature, taking into account the specific channel characteristics and floodplain land cover conditions. Specifically, Manning’s
n values were selected according to established references [
80,
81], considering factors such as channel material, vegetation density, and surface irregularities. Different roughness coefficients were applied for the main channel (
n = 0.045) and the overbank areas (
n = 0.08) to better represent the hydraulic behavior of the river system. While channel and immediate overbank roughness values were kept constant (
n = 0.045 and
n = 0.08, respectively), floodplain roughness coefficients were updated for each scenario based on the corresponding LULC conditions, allowing the hydraulic effects of land-cover change to be represented in the simulations.
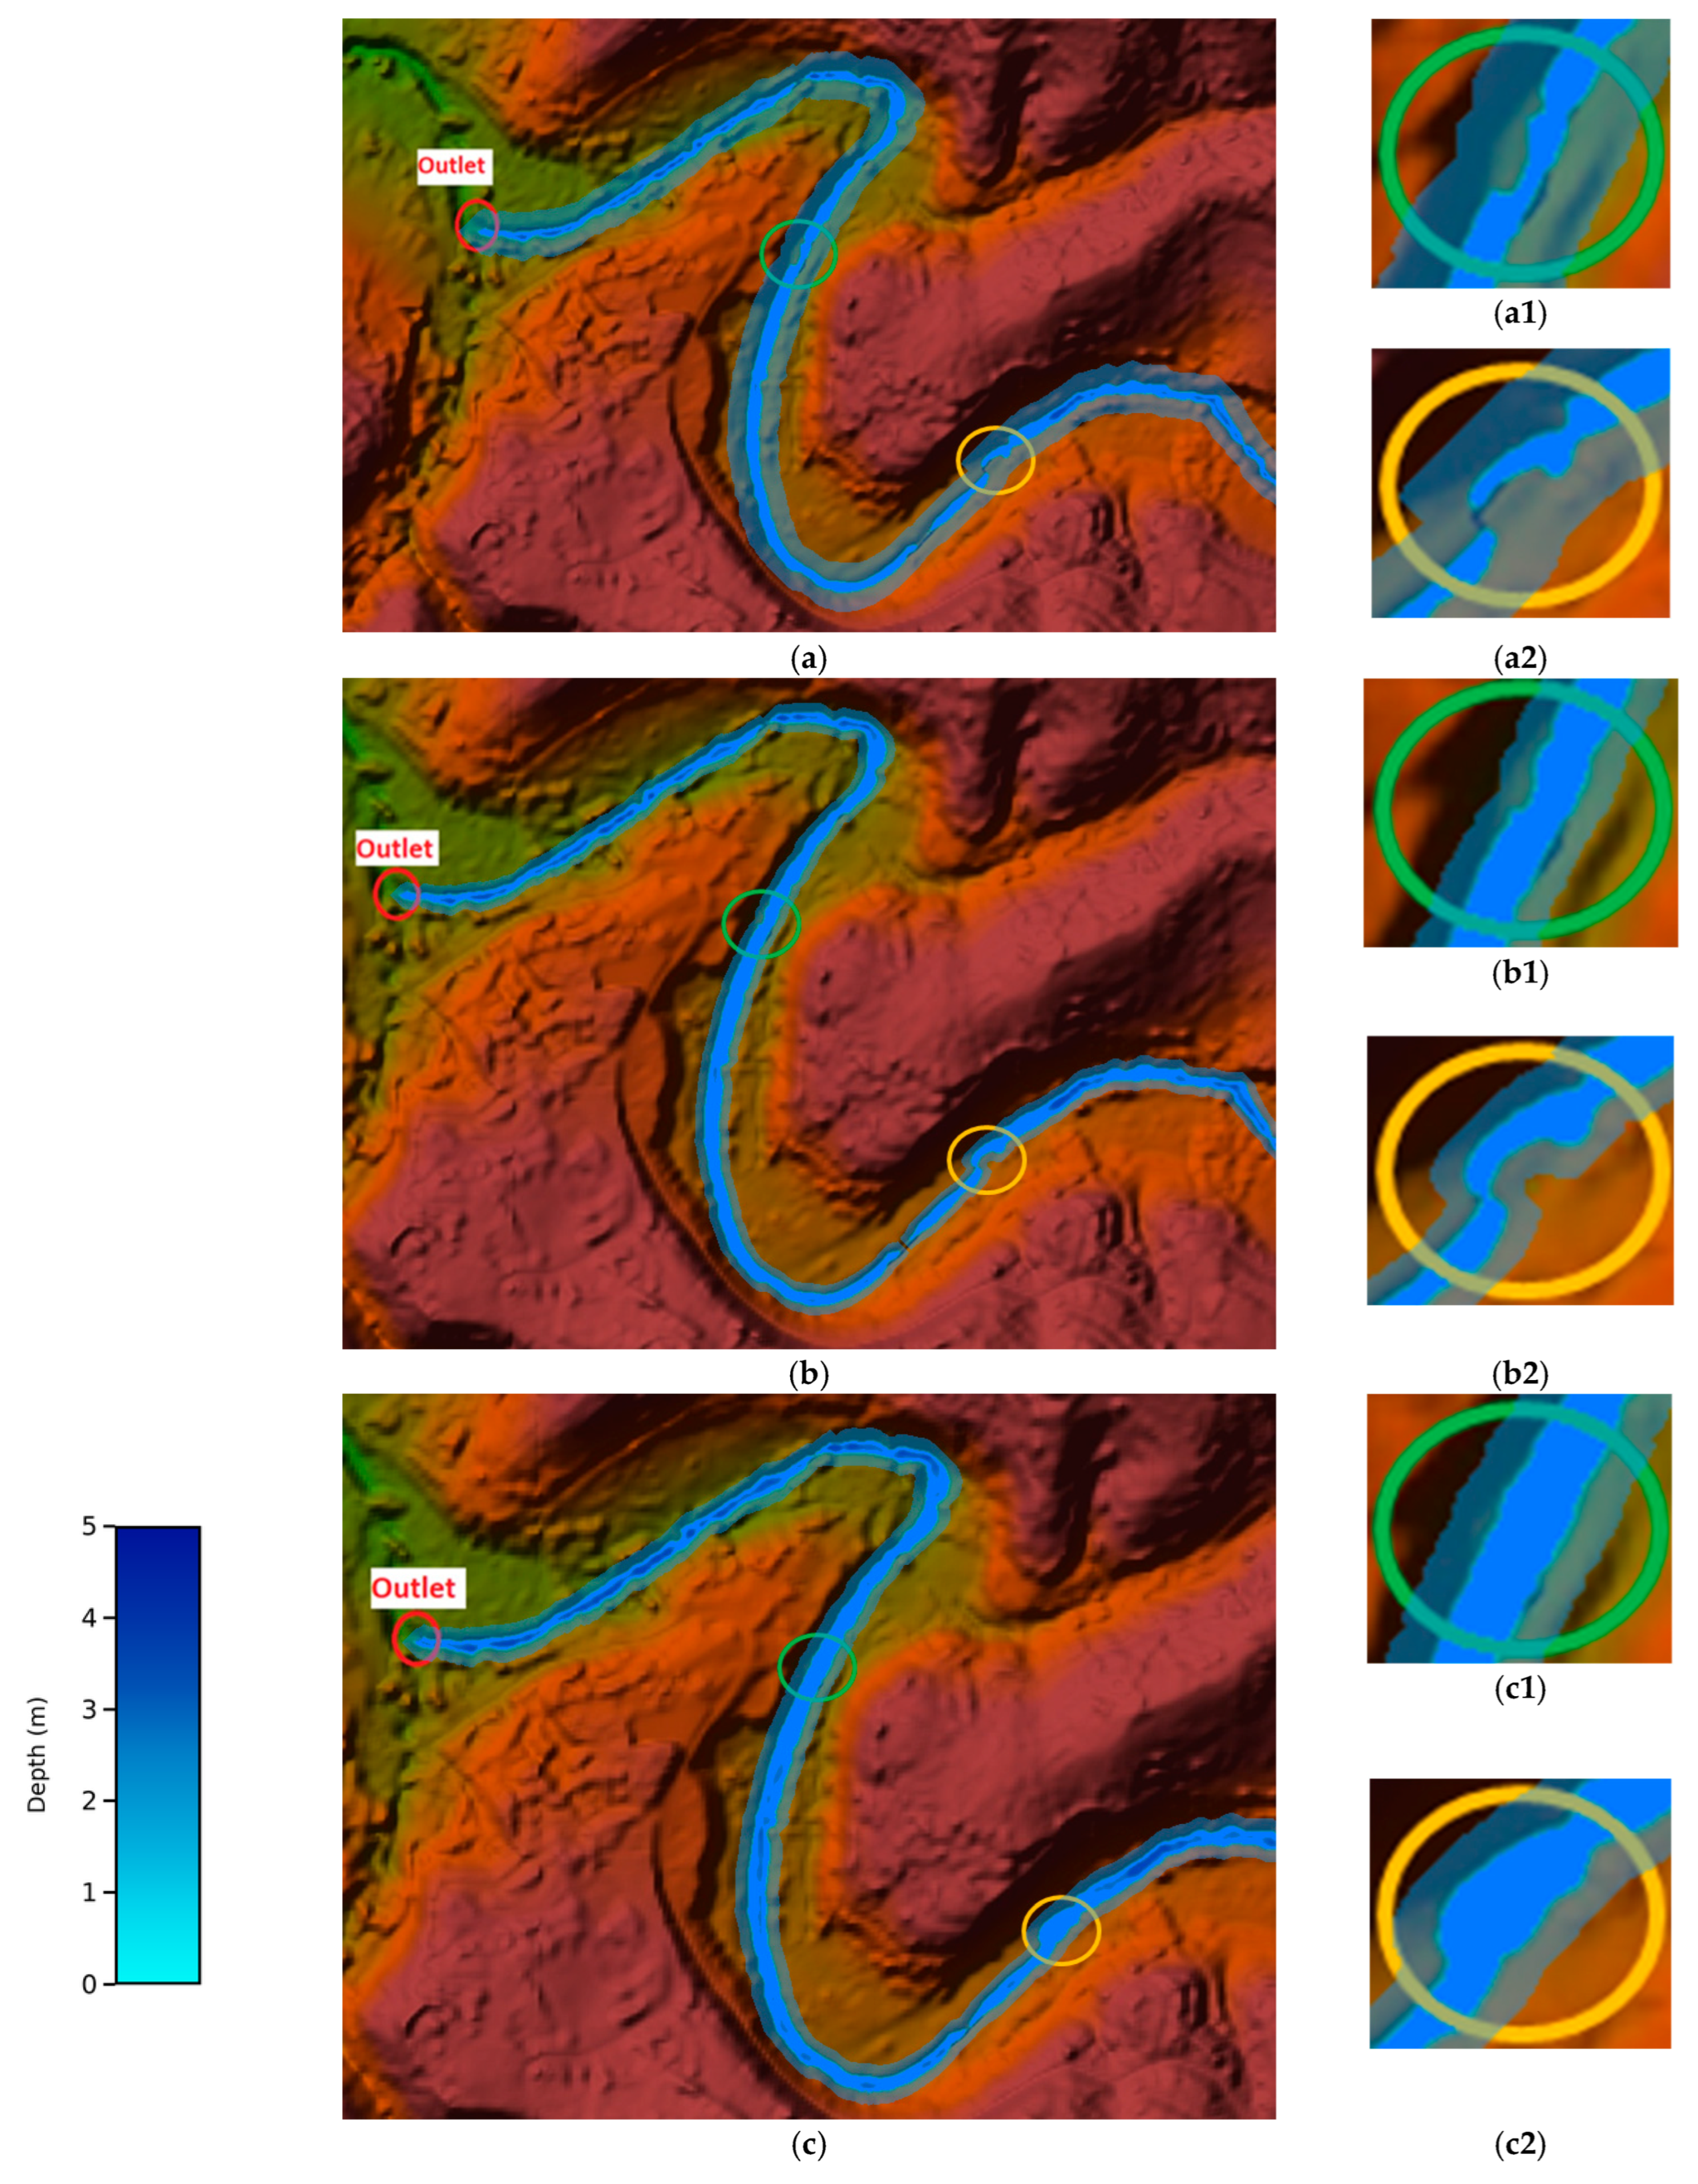
Figure 6 illustrates the floodplain extents associated with the 500-year storm event for all three scenarios.
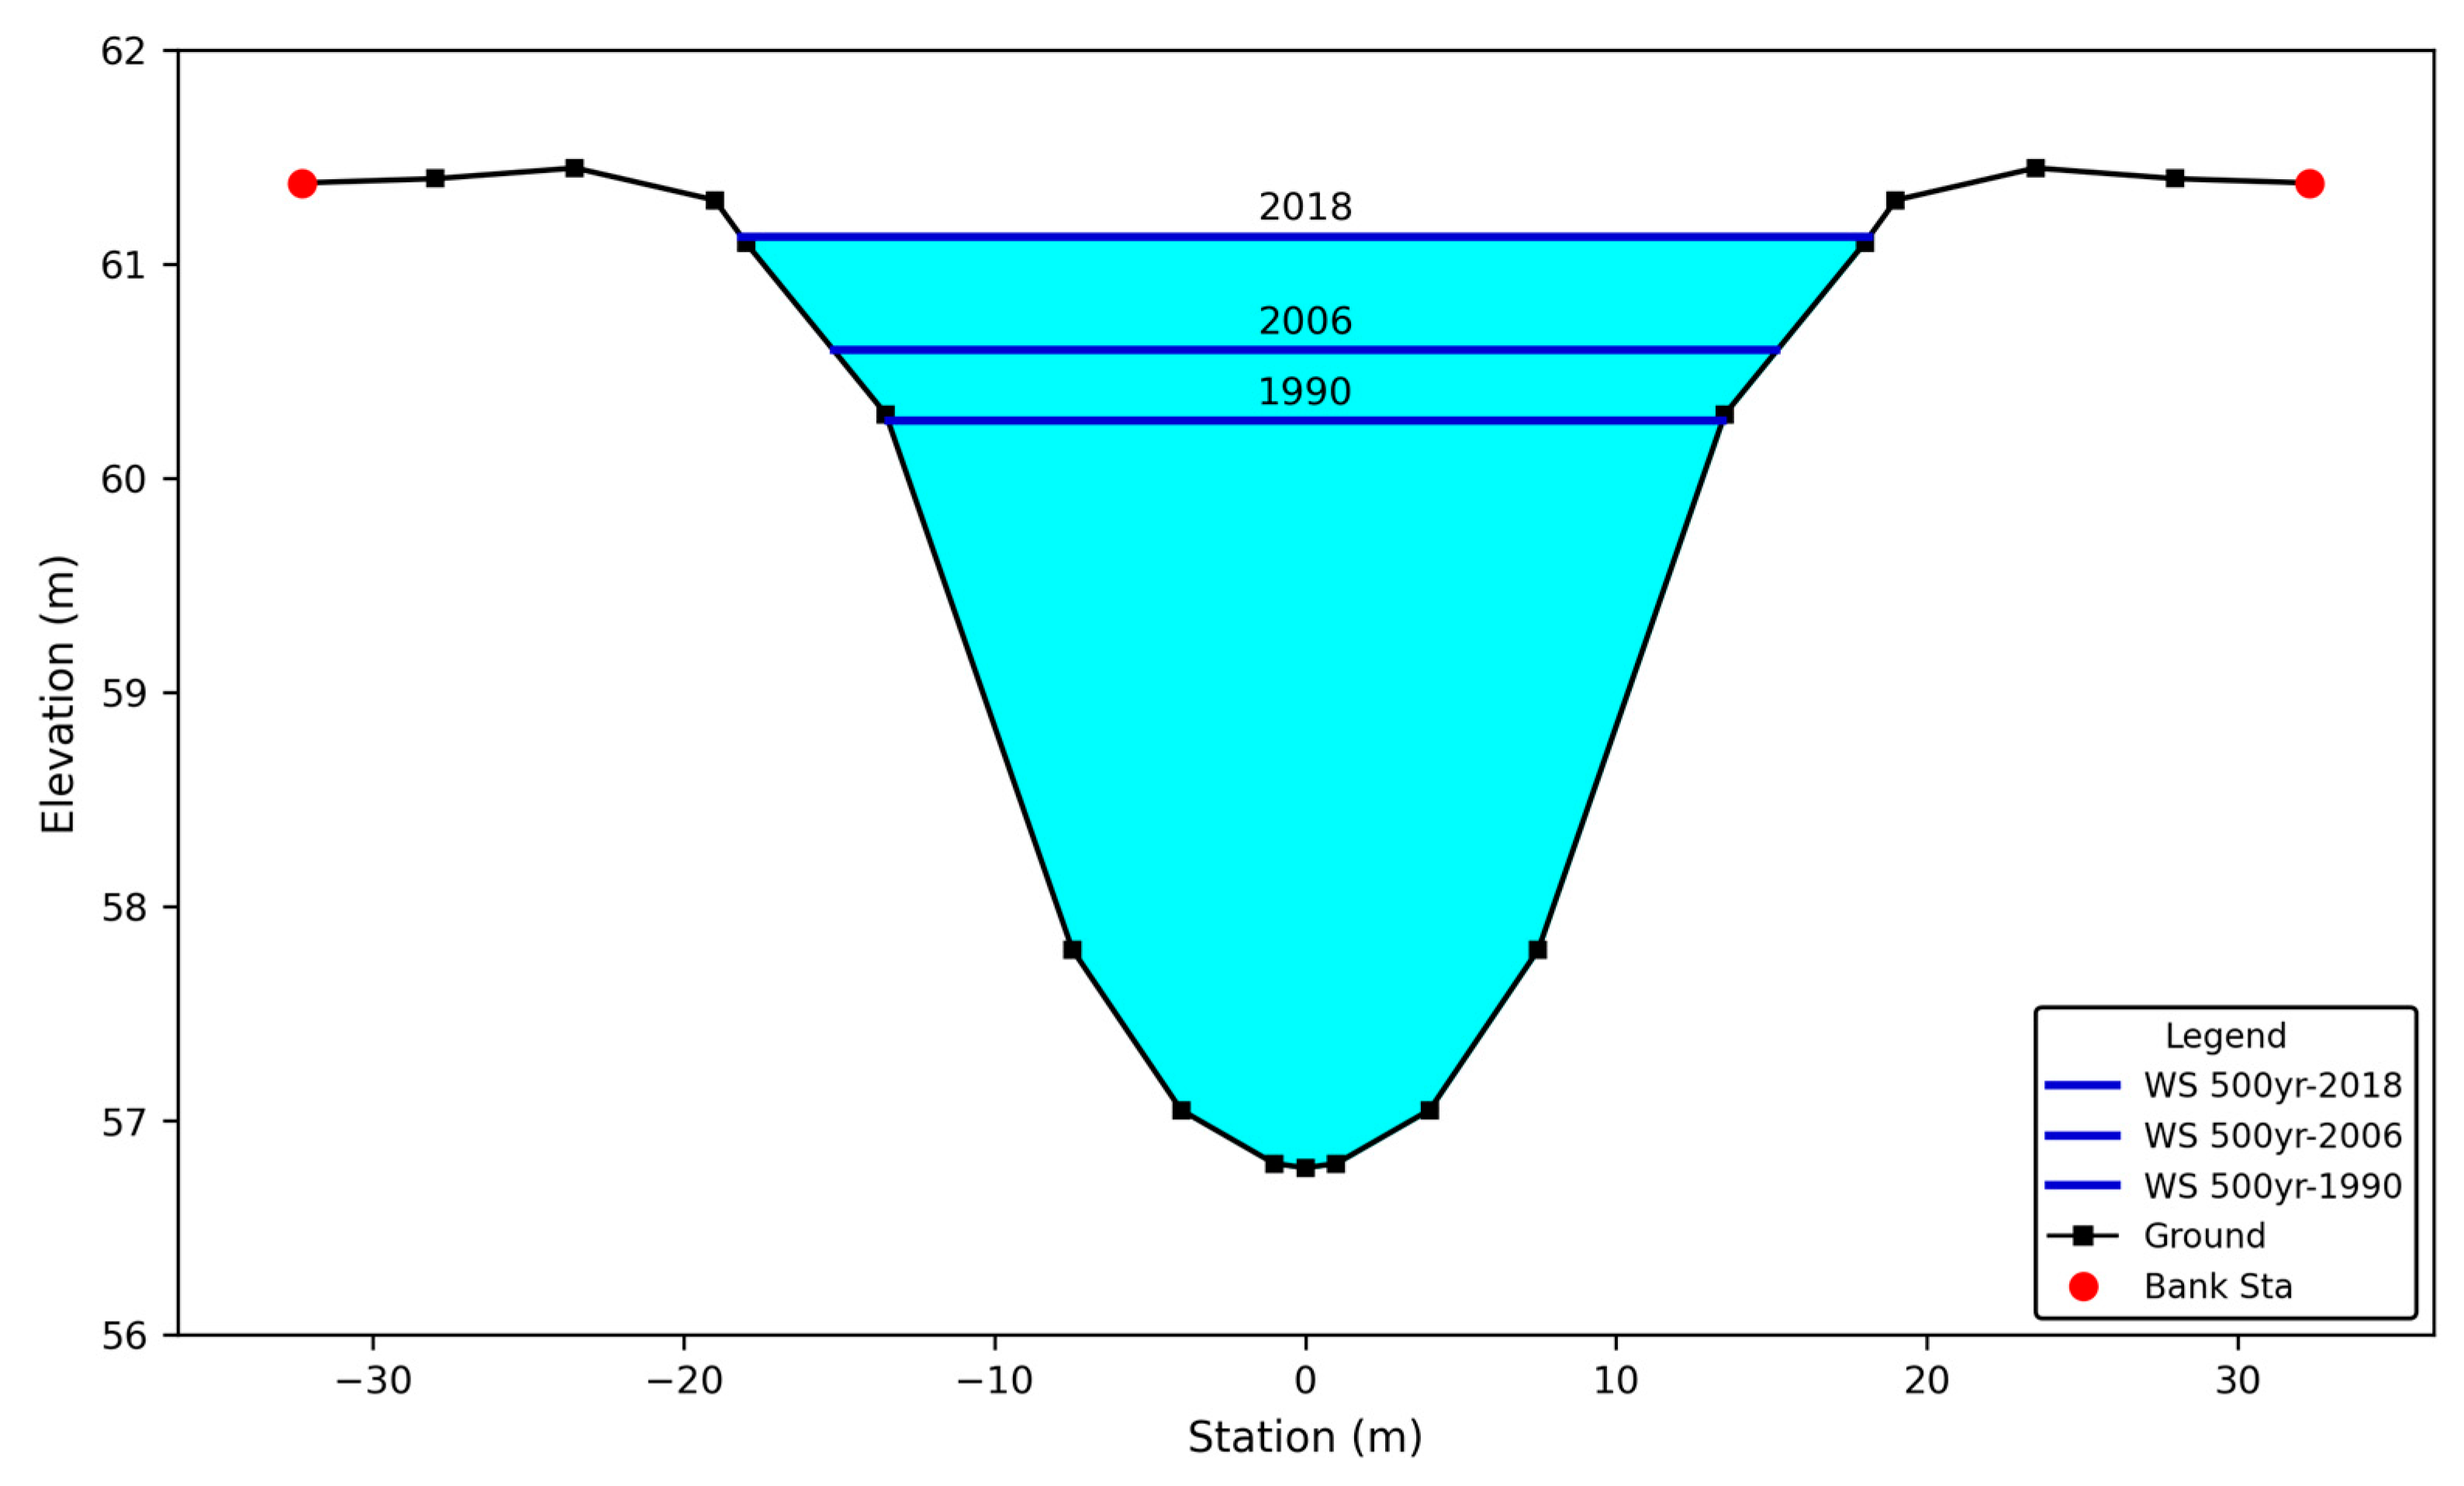
Figure 7 depicts cross-sections of the hydraulic model showing the water depths at the outlet location for all three scenarios during the 500-year return period.
The hydraulic results at the outlet location for all storm events are summarized in
Table 4. Results for upstream locations and cross-sections are not included for brevity; however, six locations prone to flooding were identified under Scenario 3.
Because the study utilizes a deterministic event-based simulation (design storms) rather than continuous long-term historical simulations, traditional statistical significance testing is not applicable. However, the hydraulic impact of LULC change is evident across all examined return periods. From the 1990 to the 2018 scenario, peak flow increased by approximately 70.0% for the 50-year event, 70.0% for the 100-year event, and 69.7% for the 500-year event. These increases were accompanied by higher water depths, by 20.5%, 21.2%, and 23.4%, respectively, and higher flow velocities, by 13.2%, 13.9%, and 15.5%, respectively, indicating a systematic intensification of flood hazard under more recent land-use conditions.
A progressive increase in flood magnitude is also observed across the examined periods. From 1990 to 2006, peak discharge increased by approximately 20% for all return periods, accompanied by increases in water depth (≈7%) and flow velocity (≈3–5%). During the subsequent period (2006–2018), peak discharge further increased by approximately 42%, while water depth and velocity increased by about 13–15% and 8–11%, respectively. These results indicate that the most pronounced hydrological intensification occurred during the later period (2006–2018), associated with the dominant deforestation and agricultural-extensification transitions identified for that interval, while comparatively milder changes characterized the earlier period. Overall, the consistent increase across all return periods highlights a systematic intensification of flood hazard over time due to cumulative LULC changes.
4. Discussion
4.1. Land-Cover Change Dynamics and Driving Forces
The land-cover analysis revealed two contrasting phases of landscape transformation in the Geropotamos watershed. During 1990–2006, change was dominated by agricultural intensification (68.19% of the total transitions), whereas the 2006–2018 period was characterized primarily by deforestation (28.21%) and agricultural extensification (26.75%). This temporal shift is consistent with the broader trajectory of land-system change reported for Mediterranean rural landscapes, where anthropogenic drivers such as population dynamics, evolving agricultural policy, land-tenure patterns, and landowner behavior jointly shape land-cover trajectories [
12]. The early intensification phase likely reflects the consolidation and modernization of agricultural practices encouraged by subsidy schemes and market demand, a process that has reconfigured more than 40% of land cover worldwide [
13]. The subsequent dominance of deforestation and extensification suggests a partial reversal of this trend, plausibly linked to rural land abandonment, shifting economic incentives, and the conversion of forest and semi-natural areas into pastures and shrublands.
These transitions are particularly relevant from a hydrological perspective because they affect the dominant land-cover classes of the catchment. As forests and semi-natural areas cover more than two-thirds of the basin (68.5%), even moderate proportional changes in these classes translate into substantial absolute areas, with direct consequences for interception, infiltration, and runoff generation. The finding that historical land-cover change in the basin has been governed by agro-forestry transitions rather than by urban expansion mirrors observations from other European and Mediterranean catchments, where the absence of large-scale urbanization does not preclude significant hydrological change [
16,
17]. This underlines the importance of monitoring not only urban growth but also the more diffuse, large-area transitions that typically dominate rural Mediterranean watersheds.
4.2. Hydrological and Hydraulic Response to LULC Change
The simulations demonstrate a systematic intensification of flood hazard across all return periods as land cover evolved from the 1990 to the 2018 configuration. Peak discharge at the outlet increased by approximately 70% between the 1990 and 2018 scenarios, accompanied by higher water depths (≈20–23%) and flow velocities (≈13–16%). The temporal partitioning of this change is informative: only about 20% of the increase in peak discharge occurred during 1990–2006, whereas a further increase of approximately 42% was simulated for 2006–2018. The most pronounced hydrological intensification therefore coincides with the period dominated by deforestation and agricultural extensification, reinforcing the causal link between these specific land-cover transitions and the amplified flood response.
A controlled, scenario-based design underpins this interpretation. All external forcing—the design storms for the 50-, 100-, and 500-year return periods, the watershed geometry, and the soil characteristics—was held constant across the three scenarios, and only the LULC distribution and the parameters physically derived from it (the composite CN and Manning’s roughness coefficients) were allowed to vary. Because these parameters are explicitly governed by land use and surface characteristics, the differences among the simulated hydrographs can be attributed to land-cover change rather than to arbitrary parameter adjustment. This experimental control isolates the hydrological signal of landscape change and constitutes the principal strength of the adopted framework.
The limited extent of artificial surfaces in the catchment (~0.5%) indicates that urbanization alone cannot account for the simulated increase in runoff. Instead, the dominant mechanism is the widespread conversion of forest and semi-natural cover into pastures, shrublands, and lower-retention agricultural classes. Such transitions reduce canopy interception and infiltration capacity and raise composite CN values, thereby increasing both the volume and the rate of surface runoff [
39]. This interpretation is fully consistent with the wider literature: deforestation has been shown to increase annual streamflow in the majority of studied basins [
44]; the proliferation of low-infiltration surfaces enhances runoff and flood risk [
40,
41]; and the conversion of forests to agricultural or degraded land heightens susceptibility to floods [
42,
43]. Conversely, afforestation generally attenuates flow [
45,
46], which is congruent with the comparatively muted response simulated for the earlier, less deforestation-dominated period. Because these effects accumulate over large portions of the watershed rather than remaining spatially localized, even moderate shifts in land-cover distribution produce a marked hydrological response, particularly under extreme rainfall.
The hydraulic consequences extend beyond peak discharge. The progressive increase in water depth implies an expansion of inundated areas and a corresponding rise in the exposure of downstream infrastructure and settlements, while the higher flow velocities imply greater erosive power and increased hydrodynamic loading on hydraulic structures such as bridges and culverts. These compounding effects indicate that the intensification of flood hazard documented here is not limited to larger flow magnitudes but also entails qualitatively more damaging flood dynamics under the more recent land-cover conditions.
4.3. Model Reliability, Validation, and Uncertainty
Like many Mediterranean catchments, the Geropotamos basin is ungauged, and no continuous or high-resolution streamflow records are available. Conventional calibration and validation against observed discharge, using performance metrics such as the Nash–Sutcliffe efficiency or RMSE, were therefore not feasible. To address this constraint, a physically based modelling strategy was adopted: the NRCS-CN method, which is specifically designed for ungauged basins and relies on measurable catchment attributes (land use, soil type, and antecedent moisture conditions), was combined with rainfall inputs derived from officially validated IDF relationships and from three meteorological stations spanning the altitudinal gradient of the region. This ensures that the hydrological forcing is consistent with national flood-hazard assessment practice.
In the absence of direct calibration, the realism of the model was assessed through indirect, multi-line corroboration. First, the derived parameters—composite CN values (CN ≈ 72), time of concentration, and overall basin response—were found to be consistent with those reported in an independent hydrological study of the same watershed that included HEC-HMS simulations and flood-hydrograph estimation under various rainfall scenarios. Second, the simulated outlet peak discharges (≈353 m3/s for the 50-year 1990 scenario, rising to ≈602 m3/s for the 2018 scenario) are of the same order of magnitude as the design discharges reported in that study; although a one-to-one comparison is not possible, because the reference study reports values for individual sub-basins rather than for the watershed outlet, the agreement in magnitude supports the physical plausibility of the model outputs for this 276.8 km2 catchment. Third, documented extreme flood events in the wider region (e.g., the 2019 and 2020 events in Crete) confirm the flood-prone character of the basin and the occurrence of high-intensity runoff responses that are consistent with the simulated behavior.
The principal source of parametric uncertainty is the NRCS-CN approach itself, particularly the selection of CN values and the assumption of an initial abstraction ratio of Ia = 0.2S. These quantities are known to vary with soil-moisture state, land-cover heterogeneity, and antecedent rainfall, and alternative initial-abstraction ratios have been proposed in the literature. To gauge the influence of this uncertainty, a qualitative sensitivity assessment focusing on the CN—its dominant control on runoff generation—was performed. While the absolute magnitude of the simulated discharge varied with the CN, the relative differences and trends among the LULC scenarios, which constitute the primary focus of this study, remained consistent. Because the analysis is built on a deterministic, event-based design-storm framework rather than on continuous long-term simulation, classical statistical significance testing is not applicable; nevertheless, the robustness of the inter-scenario differences indicates that the central conclusions regarding the hydrological impact of LULC change are not sensitive to plausible parameter variation. The framework should therefore be understood as a comparative tool for isolating the relative effect of land-cover change, rather than as a predictor of absolute design discharges.
4.4. Implications for Flood-Risk Management and Study Limitations
The findings carry direct implications for land-use planning and flood-risk management in Mediterranean catchments. The demonstration that diffuse, rural land-cover transitions—rather than urbanization—can drive a substantial intensification of flood hazard implies that mitigation strategies should extend beyond the regulation of urban expansion to encompass the conservation of forest and semi-natural cover, the management of agricultural extensification, and the maintenance of catchment-scale infiltration capacity. Integrating land-cover dynamics into long-term flood-risk planning is therefore essential, particularly given the projected continuation of land-system change and the increasing frequency of high-intensity rainfall under a changing climate. The coupling of freely available remote-sensing datasets such as CORINE with hydrological and hydraulic models offers a transferable and low-cost framework for such assessments in data-scarce regions.
Several limitations should nonetheless be acknowledged. The CORINE Land Cover datasets, while standardized and widely validated across Europe, have a minimum mapping unit that limits the detection of micro-scale land-cover changes; the analysis therefore captures dominant, aggregated land-cover patterns rather than fine-grained transitions. The hydraulic analysis relies on one-dimensional steady-flow modelling which, although appropriate for evaluating water-surface profiles and the relative effect of land-cover change along the main channel, does not resolve the full two-dimensional dynamics of floodplain inundation. Finally, the absence of gauged discharge data precludes formal calibration, so the absolute discharge values should be interpreted as physically plausible estimates rather than as calibrated predictions. Future work could address these limitations through two-dimensional hydraulic modelling, the incorporation of higher-resolution land-cover and soil data, and, where monitoring becomes available, formal calibration against observed flows. Despite these constraints, the consistency of the simulated trends across all return periods and their agreement with independent evidence support the robustness of the central finding: that cumulative LULC change between 1990 and 2018 has systematically intensified the flood hazard of the Geropotamos watershed.
5. Conclusions
This study assessed the impacts of Land Use and Land Cover (LULC) changes on flood behavior in a representative Mediterranean watershed in Crete, Greece, through the integration of CORINE Land Cover data with HEC-HMS and HEC-RAS modeling. The analysis revealed substantial modifications in the hydrological and hydraulic response of the basin between 1990 and 2018, driven primarily by deforestation and agricultural land-cover transitions. These changes resulted in a systematic increase in runoff generation and flood magnitude under all examined return periods.
At the watershed outlet, peak discharge increased by approximately 70% between 1990 and 2018 for the 50-, 100-, and 500-year return period events. This increase was accompanied by higher flood depths (20–23%) and flow velocities (13–16%), indicating a significant intensification of flood hazard conditions. The temporal analysis further showed that flood response increased progressively through time, with peak discharges rising by approximately 20% during the 1990–2006 period and by a further 42% between 2006 and 2018.
Hydrodynamic simulations demonstrated a corresponding expansion of inundated areas and greater flood depths in downstream regions under the more recent LULC scenarios. The most pronounced effects were observed during extreme events, particularly for the 500-year return period, highlighting the increasing vulnerability of the watershed to high-magnitude storms. These findings indicate that even in the absence of extensive urbanization, large-scale land-cover transitions can substantially alter watershed hydrological behavior by reducing interception and infiltration capacity and enhancing surface runoff generation.
Overall, the study highlights the critical role of spatiotemporal LULC dynamics in shaping flood risk and demonstrates the value of integrating remote sensing datasets with hydrological and hydraulic modeling for flood hazard assessment in ungauged Mediterranean catchments. The results further emphasize the need to incorporate land-use planning, ecosystem conservation, and watershed management measures into long-term flood risk mitigation strategies under changing environmental conditions.




 ,
,