1. Introduction
Landslides are among the most destructive geological hazards worldwide, causing significant loss of life, damage to infrastructure, and economic disruption. It is therefore important to develop reliable methods for assessing landslide stability and understanding the factors that control failure behavior [
1,
2,
3,
4,
5,
6]. Considerable efforts have been made in this field, and a wide range of experimental tests, analytical methods, and numerical simulations have been developed to investigate failure mechanisms and evaluate landslide stability under complex conditions [
7,
8,
9]. However, these approaches usually rely on a single deterministic geological model, and their accuracy depends strongly on how well the subsurface conditions are characterized.
In engineering practice, the interpretation of subsurface geological cross-sections often relies heavily on engineers’ experience and professional judgment [
10]. As a result, different practitioners may propose different stratigraphic configurations even when they use the same borehole or geophysical data, which may lead to markedly different results in landslide stability assessment. The stratigraphic model defines the geometry and continuity of weak layers, potential slip surfaces, and drainage paths, and therefore directly affects the predicted failure mechanism and factor of safety [
11,
12]. A reliable geological model should reflect depositional history, tectonic deformation, weathering processes, and possible human activities such as excavation, filling, and drainage works [
13,
14,
15]. In practice, however, subsurface information is usually obtained from only a limited number of boreholes and in situ tests. Geological bodies are heterogeneous in three dimensions, whereas the available data are sparse and often restricted to a few profiles. In addition, observation errors, incomplete logs, and subjective interpretation further increase the uncertainty in the stratigraphic model. As a result, the geological model used in landslide analysis is often only one plausible realization, and the influence of stratigraphic uncertainty on stability is rarely quantified explicitly.
Over the past several decades, extensive research has sought to characterize subsurface stratigraphic conditions. Early studies relied primarily on geostatistical techniques, such as Kriging [
16], to construct subsurface profiles via weighted spatial interpolation. However, these methods typically require relatively dense borehole data to adequately represent stratigraphic heterogeneity [
17], limiting their practical application in many engineering projects. In addition, traditional geostatistical frameworks are often deterministic, and uncertainty in the interpreted stratigraphy is frequently not explicitly addressed [
13,
14]. To overcome these limitations, various probabilistic stratigraphic modeling approaches based on borehole data have been developed in recent years. Representative examples include the coupled Markov chain method [
18,
19], stochastic Markov random field models [
20,
21], stochastic conditional simulation techniques [
22], and random field-based approaches [
13,
23]. These probabilistic frameworks enable the generation of multiple plausible stratigraphic realizations from available site investigation data and the consistent quantification of stratigraphic uncertainty. More recent studies have further extended these ideas to three-dimensional geological modeling, multisource data fusion, and efficient simulation of conditional random fields, thereby improving the ability to characterize and reduce geological uncertainty under complex subsurface conditions [
24,
25,
26].
Most existing approaches to subsurface stratigraphic interpretation rely primarily on borehole data. Borehole investigations provide direct and reliable observations of subsurface stratigraphy, but their high cost and time requirements often lead to sparse site coverage. As a result, stratigraphic models derived solely from borehole data inevitably involve a certain degree of uncertainty. With the rapid development of geophysical instruments and data-processing methods in recent years, geophysical techniques have increasingly been used to complement traditional drilling. Methods such as electrical resistivity tomography (ERT) [
27], seismic reflection (SR) [
28], and ground-penetrating radar (GPR) [
29] can provide abundant and continuous subsurface information. Based on geophysical measurements, including electrical resistivity, seismic wave velocity, and electromagnetic response, stratigraphic interfaces within a given cross-section can be inferred [
30]. Compared with borehole investigations, geophysical surveys offer much better spatial coverage. However, the reliability of geophysically interpreted stratigraphy is often affected by measurement noise and the inherent non-uniqueness of geophysical inversion, which may introduce additional uncertainty into the interpretation [
31,
32]. Against this background, the integration of geotechnical and geophysical data has become an important trend in stratigraphic modeling. By combining sparse but reliable borehole observations with continuous geophysical information, data-fusion approaches aim to improve the representation of subsurface layering [
14,
33]. In landslide investigations, integrated geological–geophysical surveys have proven effective in identifying internal structures, basal slip surfaces, and saturated zones that are difficult to detect using boreholes alone [
14,
34,
35]. These studies suggest that data fusion, together with probabilistic stratigraphic modeling, can significantly improve the reliability of subsurface interpretation. This is particularly important for landslide analysis because the geometry and continuity of geological layers often control the location of potential slip surfaces and the overall stability of the landslide.
At the same time, probabilistic analysis of slope and landslide stability has received increasing attention. Many studies have used random field theory to describe the spatial variability of geomaterials and to examine its influence on slope and landslide stability [
36,
37,
38,
39]. Recent work has also applied numerical methods, such as finite-element, finite-difference, and limit-equilibrium approaches, to evaluate the stability of slopes and geotechnical structures under complex conditions [
40,
41,
42,
43]. In parallel, probabilistic and reliability-based methods, including random finite-element and random limit-equilibrium analyses, as well as efficient approaches based on advanced sampling strategies, have been developed to account for uncertainty in geotechnical problems [
39,
44,
45,
46]. Comprehensive reviews have summarized these developments and highlighted the importance of spatial variability and model uncertainty in slope and landslide analysis [
47,
48]. However, in most of these studies, subsurface stratigraphy is treated as fixed and deterministic. Only the material properties within each layer, or some selected geometric parameters, are considered as random variables or random fields. A few recent studies have started to examine the effect of stratigraphic uncertainty on engineering performance [
4,
49]. For example, stratigraphic uncertainty has been related to liquefaction potential and to the behavior of underground infrastructure at specific sites. Probabilistic stratigraphic modeling frameworks have also been introduced in landslide studies, such as approaches that combine surface-wave inversion results with borehole lithology to construct probabilistic stratigraphic models. Nevertheless, most of these studies still focus mainly on stratigraphic interpretation and parameterization. Only limited attention has been given to how the full range of possible stratigraphic models propagates into landslide stability measures, such as the factor of safety and probability of failure.
In summary, three key gaps remain in the literature. First, most stratigraphic modeling and data-fusion methods produce a single best-estimate model and rarely propagate stratigraphic uncertainty into landslide stability analysis. Second, probabilistic stability studies typically account for soil-property variability while assuming a fixed stratigraphic framework, thereby overlooking uncertainty in layer boundaries and internal structures. Third, although random field approaches can represent stratigraphic uncertainty, their direct use in landslide stability analysis remains limited, especially in real cases that combine borehole and geophysical data. To address these gaps, this study developed an efficient framework for probabilistic evaluation of landslide stability that explicitly accounts for stratigraphic uncertainty. The framework was based on a random field model of stratigraphic uncertainty conditioned on sparse borehole data and complementary geophysical information. Multiple realizations of the subsurface stratigraphy were generated, each consistent with the observed data and the prescribed spatial correlation. A deterministic landslide stability analysis was then performed for each realization. By repeating the analysis across many stratigraphic realizations, the distribution of stability indicators can be obtained, and the influence of stratigraphic uncertainty on landslide safety can be quantified. The proposed framework was demonstrated through a case study of the Panzhuangzu Landslide. The results show that probabilistic stratigraphic modeling can alter the predicted failure mechanism and provide a more realistic basis for landslide hazard assessment.
The main contribution of this study was the development of an integrated uncertainty-propagation framework spanning stratigraphic interpretation and landslide stability assessment. Unlike conventional borehole–geophysical fusion methods that primarily aim to produce a best-estimate geological section, the proposed method generated probabilistic stratigraphic realizations constrained by both borehole observations and ERT-derived resistivity data. Spatial prior information derived from borehole stratigraphy was incorporated into a nonlinear classifier based on support vector machine (SVM), and bootstrapping was used to quantify stratigraphic prediction uncertainty. These stratigraphic realizations were then mapped into FLAC3D models, and their corresponding factors of safety were evaluated using the strength reduction method. Therefore, the proposed framework enables the influence of stratigraphic uncertainty on landslide stability to be explicitly quantified, providing a more informative basis for landslide hazard assessment.
2. Materials and Methods
2.1. A Brief Introduction to the Panzhuangzu Landslide
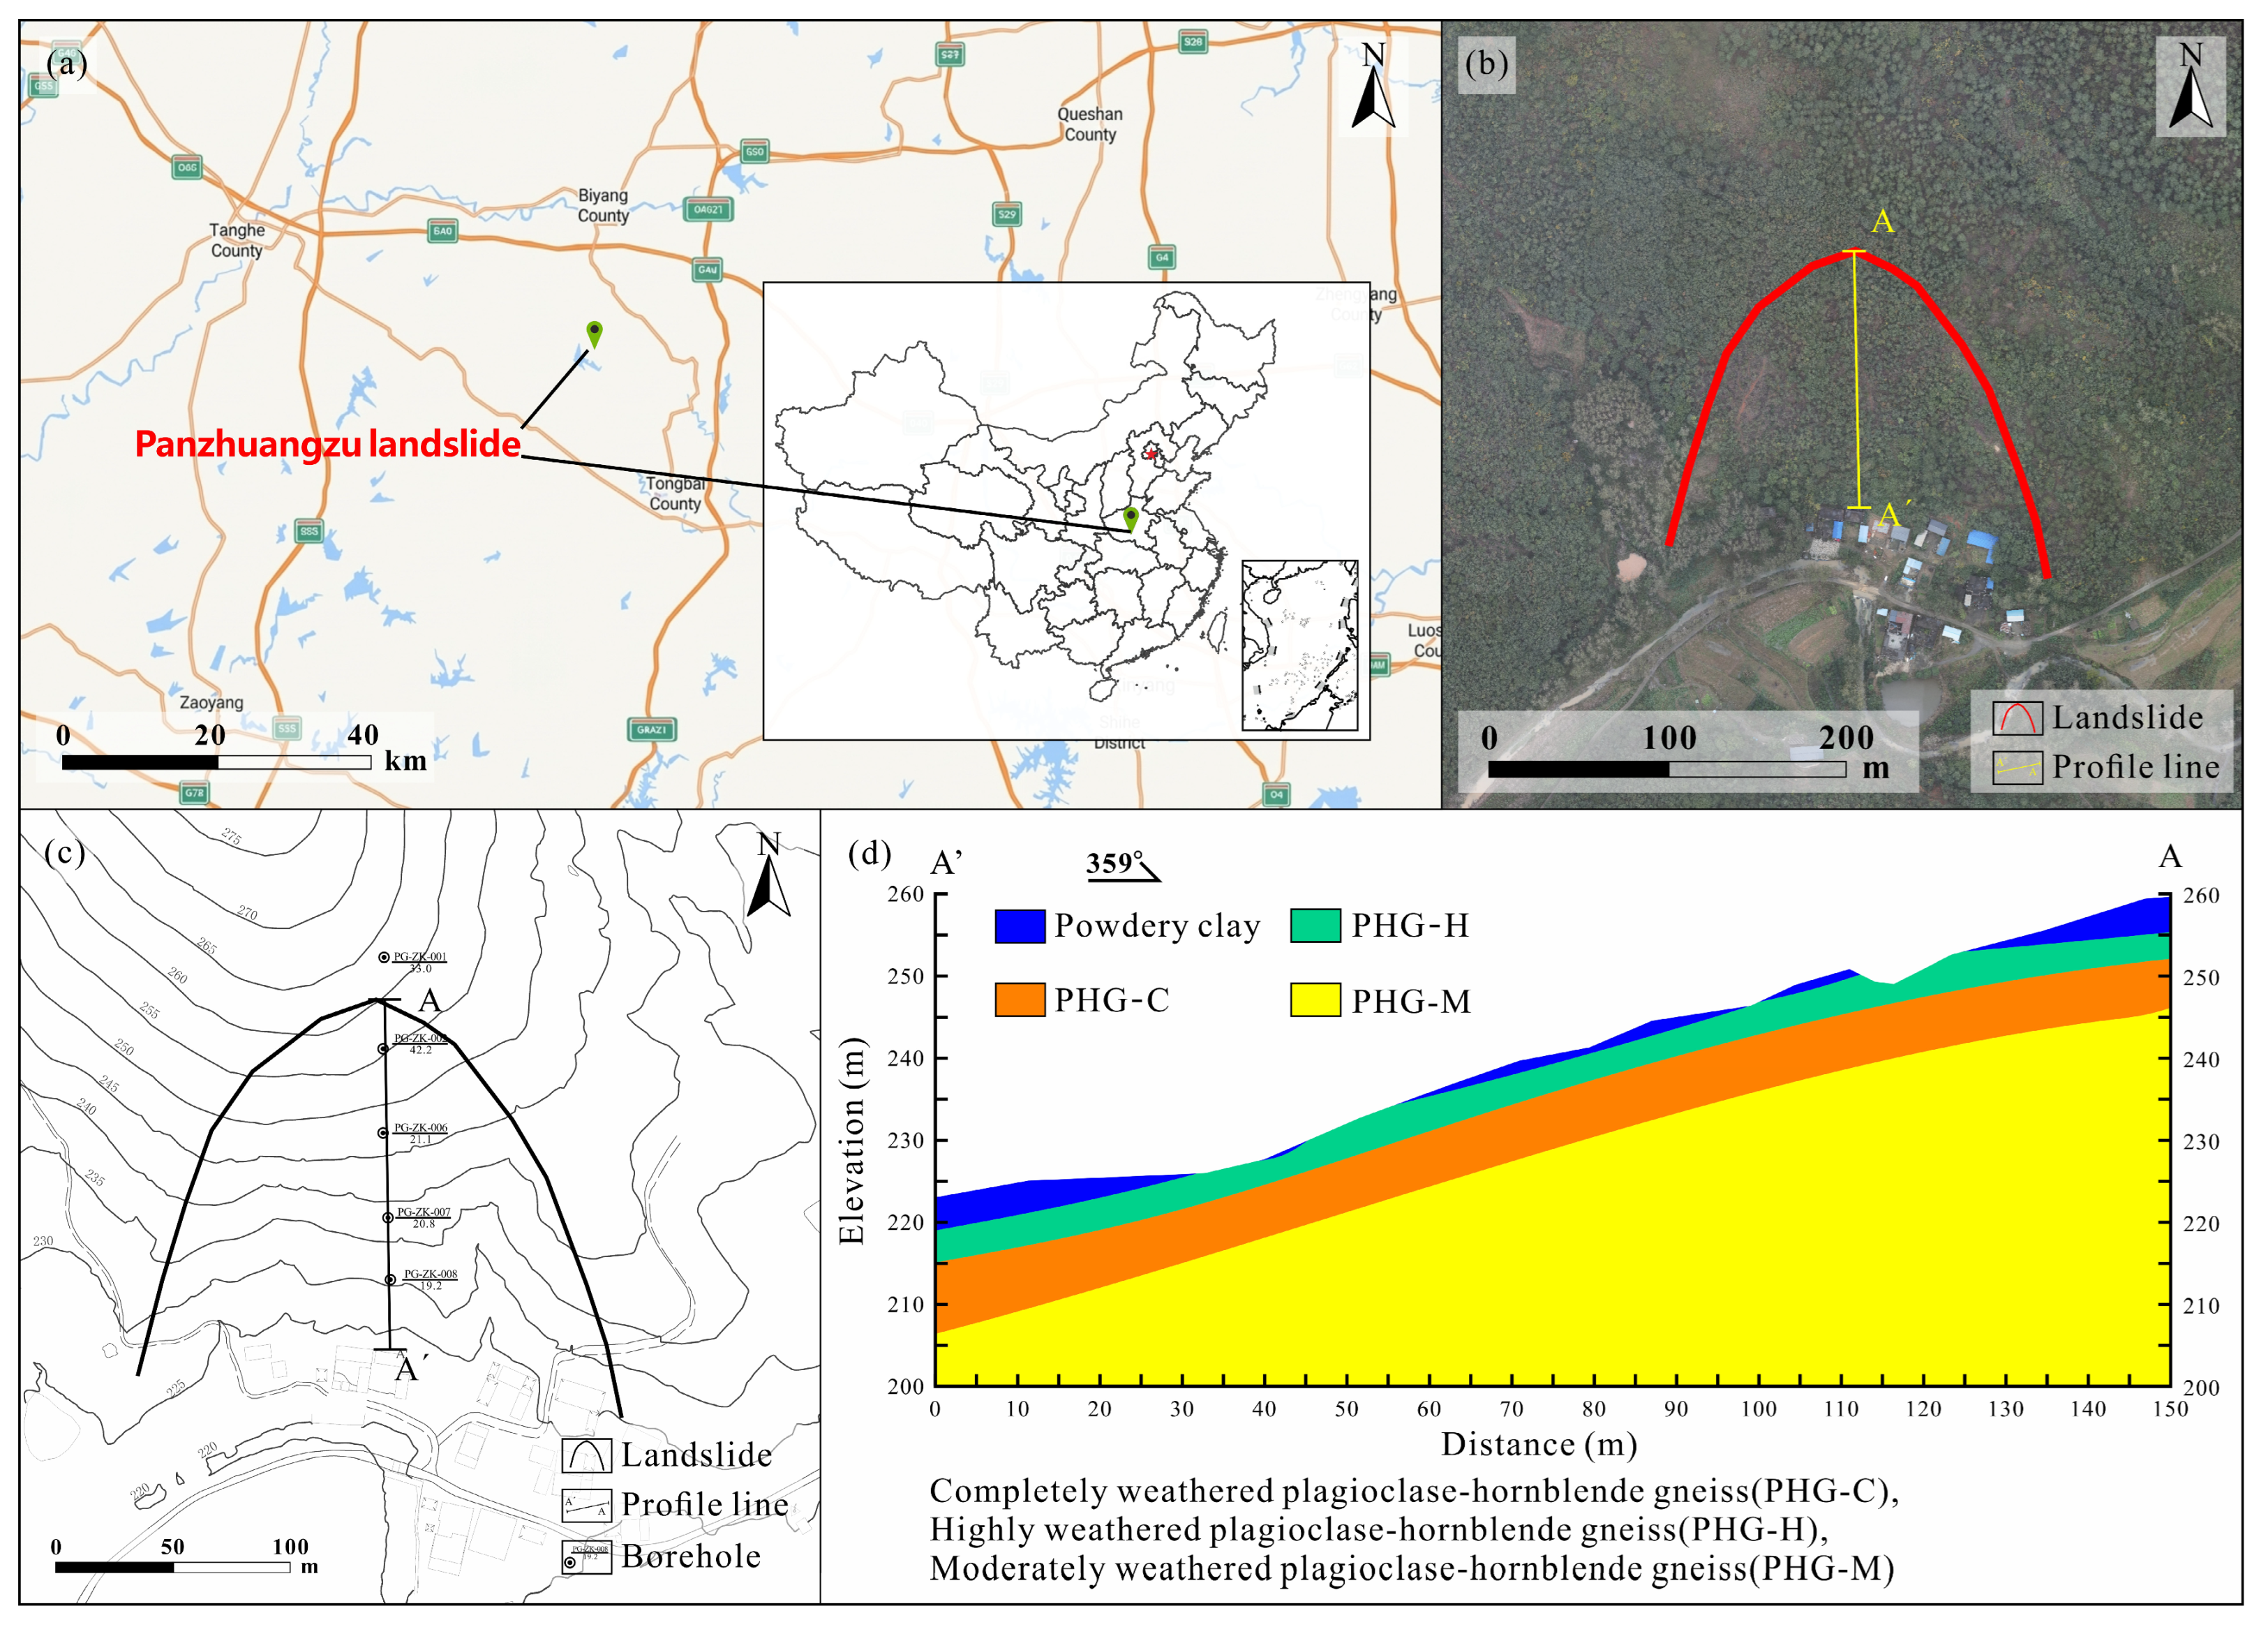
To verify the applicability of the proposed method, the Panzhuangzu Landslide was selected as a case study. The study area is located on the low mountain slopes south of the Panzhuang Group in Moshan Village, Pangu Township, Biyang County, Zhumadian City, Henan Province, China, as shown in
Figure 1a. Its geographic coordinates range from 113°20′21″ E to 113°20′35″ E and from 32°35′29″ N to 32°35′45″ N. The site lies in the southern part of Zhumadian City, about 25–30 km in a straight line from the urban center. The UAV image shown in
Figure 1b provides an overall view of the geomorphological features and surface deformation of the landslide. The engineering geological plan view and the corresponding cross-section of the Panzhuangzu Landslide are presented in
Figure 1c,d, respectively, showing the spatial extent of the landslide, the main geomorphic features, and the stratigraphic and structural characteristics along the representative section. Geomorphologically, the area belongs to an erosion-denudation hilly region. The local terrain is characterized by steep slopes and pronounced relief. The elevation at the crown of the landslide is about 265 m, whereas the residential area at the toe is about 220 m, giving a relative relief of roughly 45 m. The natural slope angle generally ranges from 20° to 50°. The terrain is strongly dissected, with well-developed gullies that favor surface drainage. However, human engineering activities, especially slope cutting for residential construction at the toe, have formed a free face about 1–6 m high, thereby altering the original stress conditions of the landslide.
According to the landslide classification systems proposed by Varnes and Cruden and Varnes [
50,
51], the Panzhuangzu Landslide can be classified as a rainfall-induced soil-rock slide. In terms of movement type, the landslide is dominated by sliding rather than falling, toppling, or flowing. Field investigation and the engineering geological section indicate that the deformation and failure are mainly controlled by rainfall infiltration, the interface between the loose Quaternary cover and the underlying weathered bedrock, and weak structural planes within the weathered plagioclase hornblende gneiss. The sliding surface is mainly associated with the weathered rock interface and weak zones, suggesting that the landslide is closer to a translational slide controlled by weathered bedrock interfaces. This classification is consistent with the observed semi-circular planform, the slope cutting at the toe, and the accumulation of groundwater within the weathered zone during rainfall.
In this study, a two-dimensional geological model was established along the A–A’ profile, which coincides with the main sliding direction of the landslide. The model domain measures 150 m × 60 m, which is sufficient to capture the main stratigraphic features and deformation characteristics of the landslide. As shown in
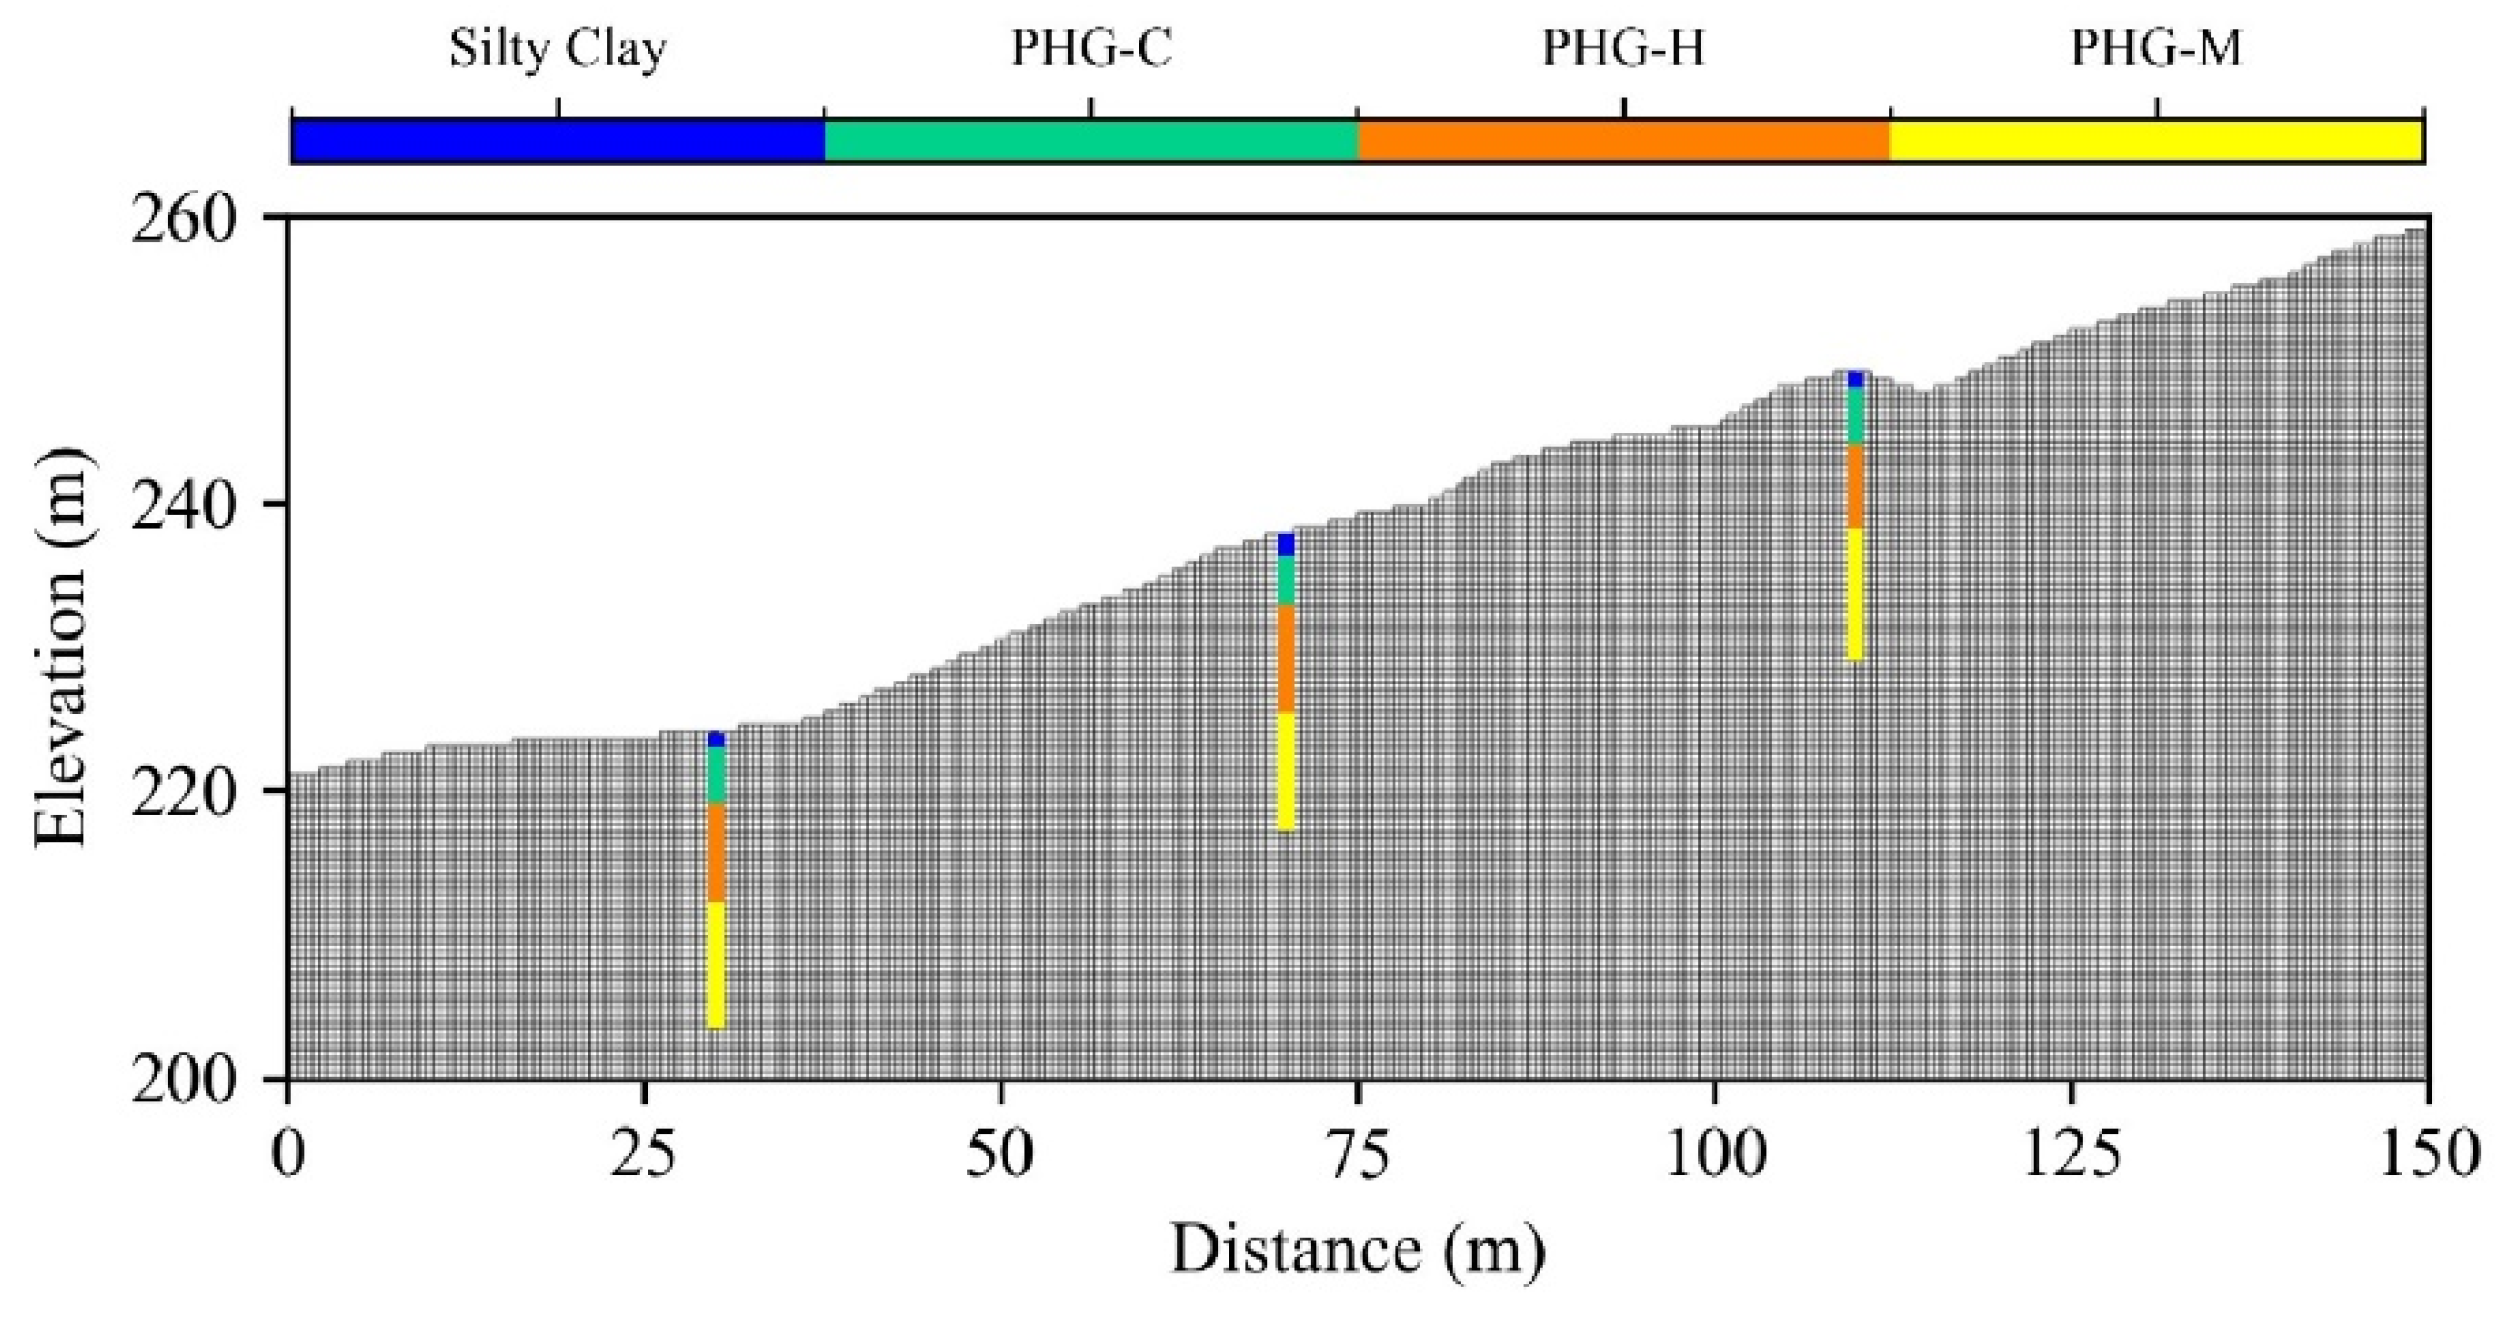
Figure 1c, the site investigation program includes five boreholes and one geophysical survey line, providing both point-scale and continuous subsurface information for geological interpretation. Among these boreholes, ZK006, ZK007, and ZK008 are selected for stratigraphic uncertainty modeling because they are located along the representative section and intersect the main sliding zone, as shown in
Figure 2. Their depths are 20.2 m, 20.8 m, and 21.1 m, respectively. The drilling results identify four stratigraphic units, na mely silty clay, completely weathered plagioclase hornblende gneiss, highly weathered plagioclase hornblende gneiss, and moderately weathered plagioclase hornblende gneiss, as illustrated in
Figure 2.
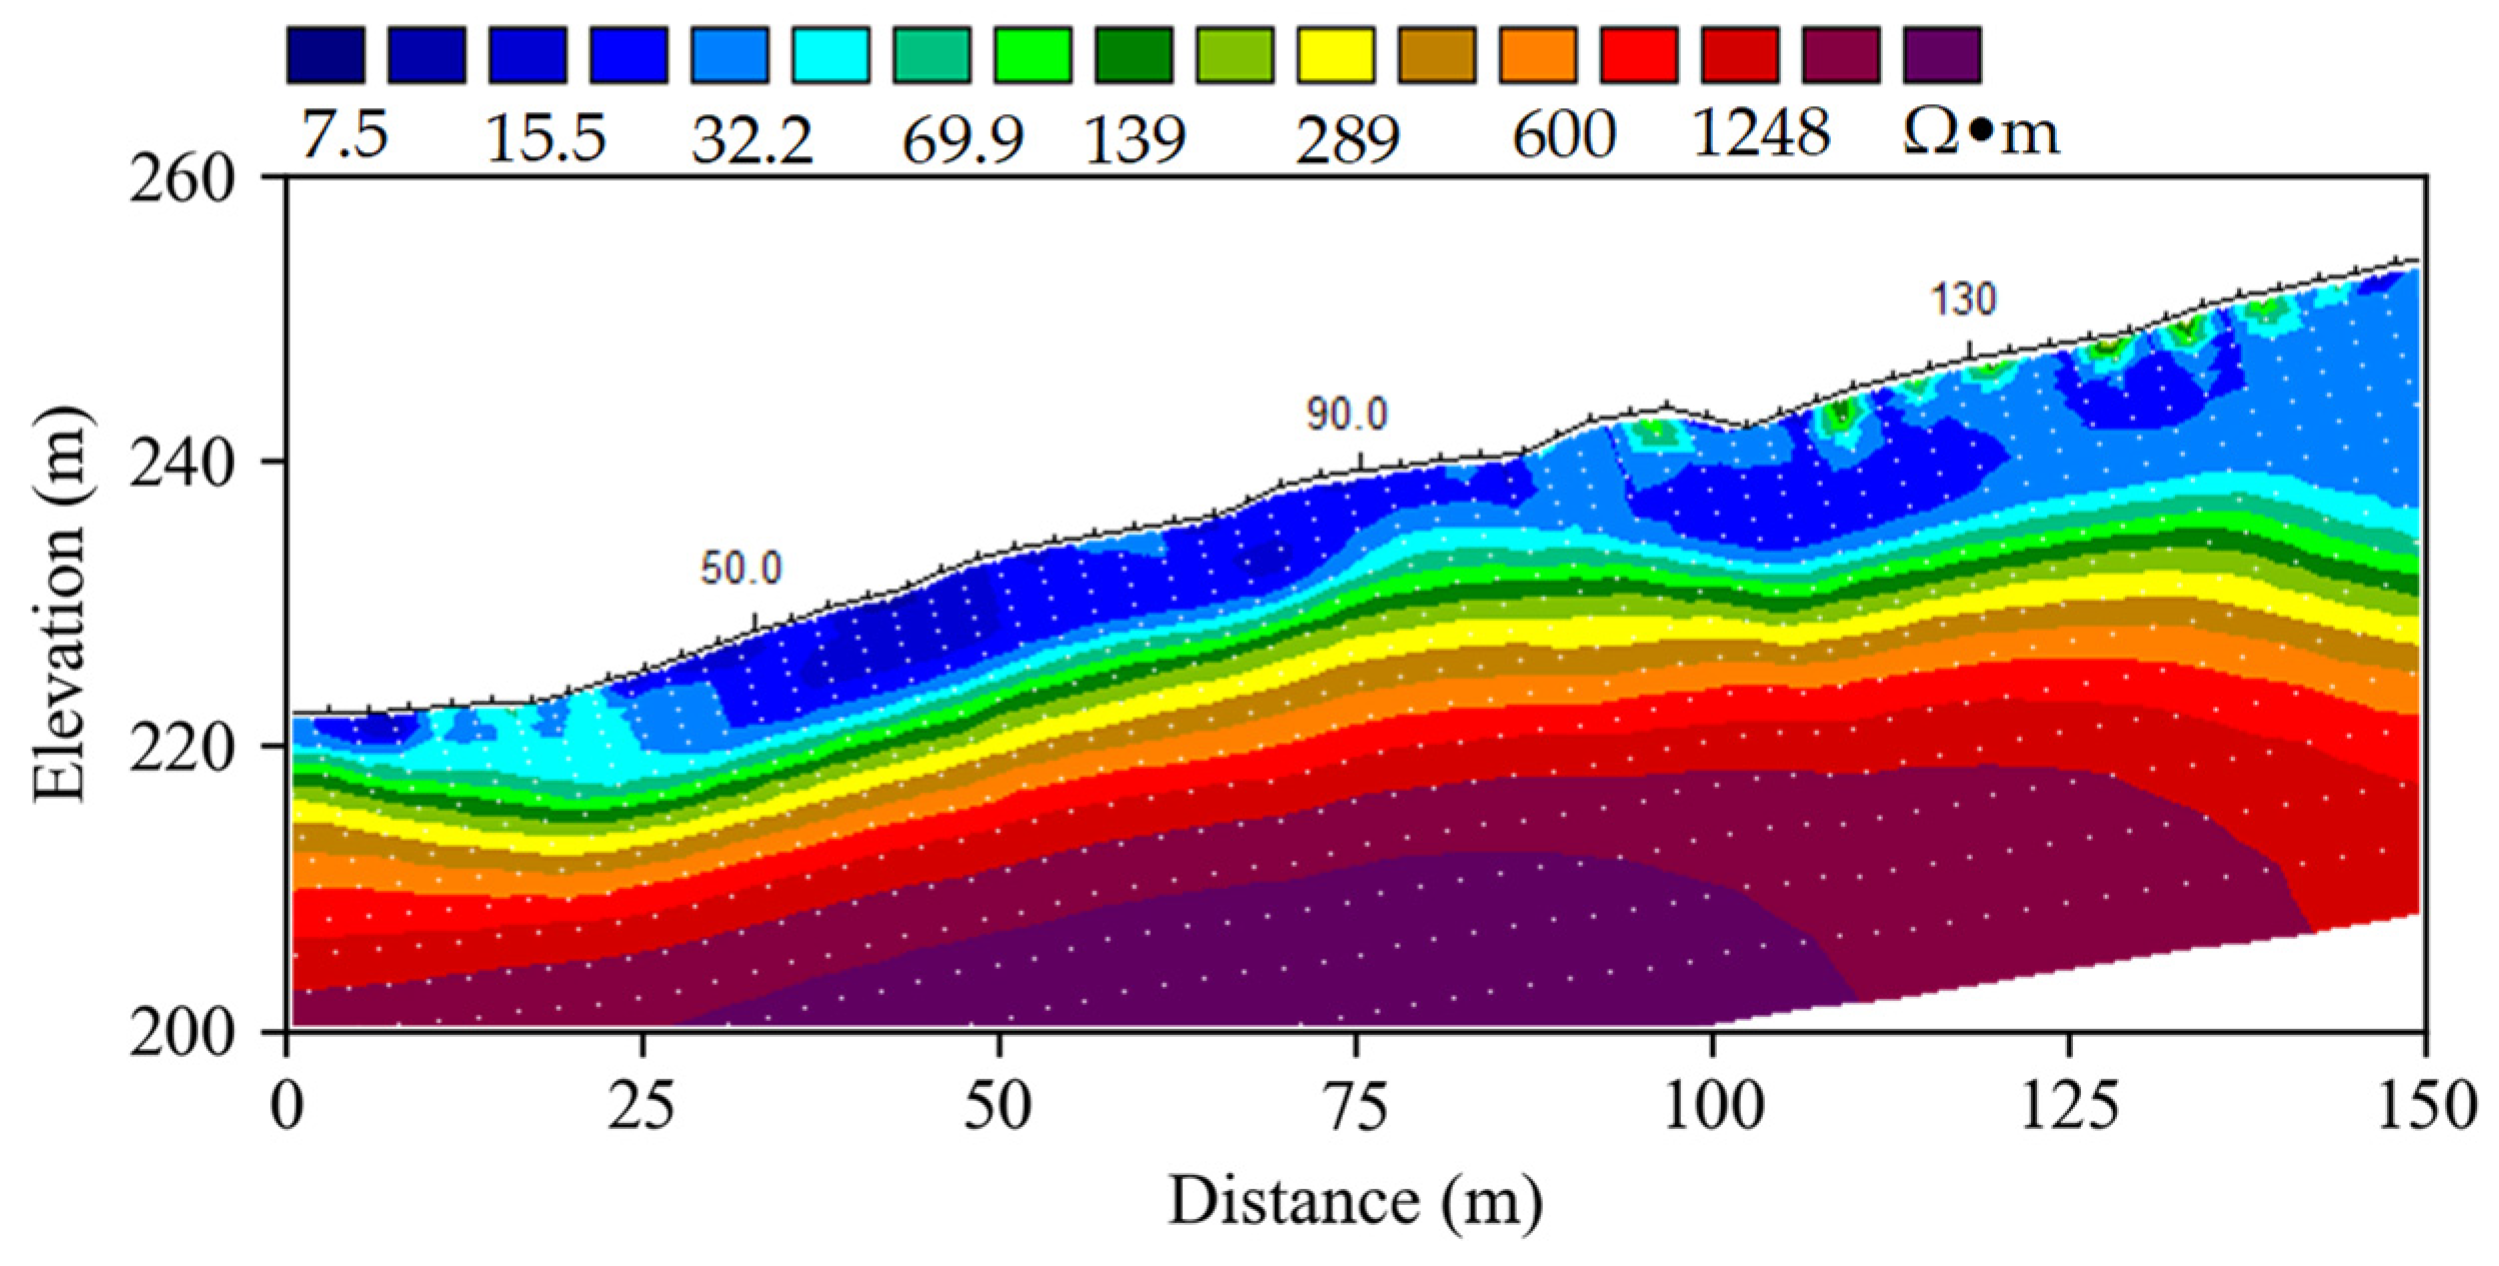
The ERT survey was conducted using a DUK-4 high-density electrical resistivity instrument manufactured by Chongqing Zhongdi Equipment Co., Ltd. (Chongqing Zhongdi Equipment Co., Ltd., Chongqing, China). The survey line was aligned with the A–A’ profile, which also serves as the representative engineering geological section for this study. This layout provides continuous subsurface information along the main sliding direction of the Panzhuangzu Landslide. The Wenner array was used for field measurements because of its relatively strong signal and stable response in near-surface engineering geological investigations. The electrode spacing was 5 m, and the total length of the survey line was 300 m. Because the main landslide body and the numerical model domain lie within the first 150 m of the survey line, the section from 0 to 150 m was selected for stratigraphic modeling and stability analysis in this study.
Before inversion, the apparent resistivity data were checked, and abnormal data points were removed. Terrain correction was also performed using the measured ground surface elevation along the survey line. The ERT data were inverted using a smoothness-constrained least squares method. After five iterations, the root mean square error of the inversion was 2.7 percent, indicating that the fit between the calculated and observed apparent resistivity data was acceptable. The inversion result showed that the resistivity of the rock and soil mass in the study area ranges from 7.25 Ω·m to 1248 Ω·m (see in
Figure 3), reflecting differences in lithology, weathering degree, water content, and fracture development within the landslide. To reduce the influence of the large dynamic range of resistivity values, the inverted resistivity was transformed before being used as an input feature in the subsequent SVM classification.
2.2. Stratigraphic Modeling Method Combining Borehole and Geophysical Data
Accurate characterization of subsurface stratigraphic structure remains a fundamental challenge in geological and geotechnical engineering, particularly in landslide analysis and stability assessment. Traditional drilling investigations provide accurate point-scale information, but their number is often limited by cost and construction constraints, which leads to sparse spatial coverage and considerable uncertainty in stratigraphic interpretation. In contrast, high-density electrical resistivity tomography (ERT) provides continuous subsurface information at the site scale, but its inversion results are inherently non-unique and strongly affected by model assumptions and data quality.
To overcome the limitations of single-source exploration methods, this study proposed a data-driven probabilistic framework for stratigraphic modeling that integrates both borehole and geophysical data. The main idea was to use random field theory to extract spatial structural information from sparse borehole observations and represent it probabilistically as prior stratigraphic constraints. These prior features were then combined with geophysical attributes through the nonlinear mapping capability of a support vector machine (SVM) [
52,
53], thereby establishing a quantitative relationship between the geophysical response field and the stratigraphic field. In this way, probabilistic stratigraphic prediction can be achieved in areas without direct borehole control, while stratigraphic uncertainty is explicitly taken into account.
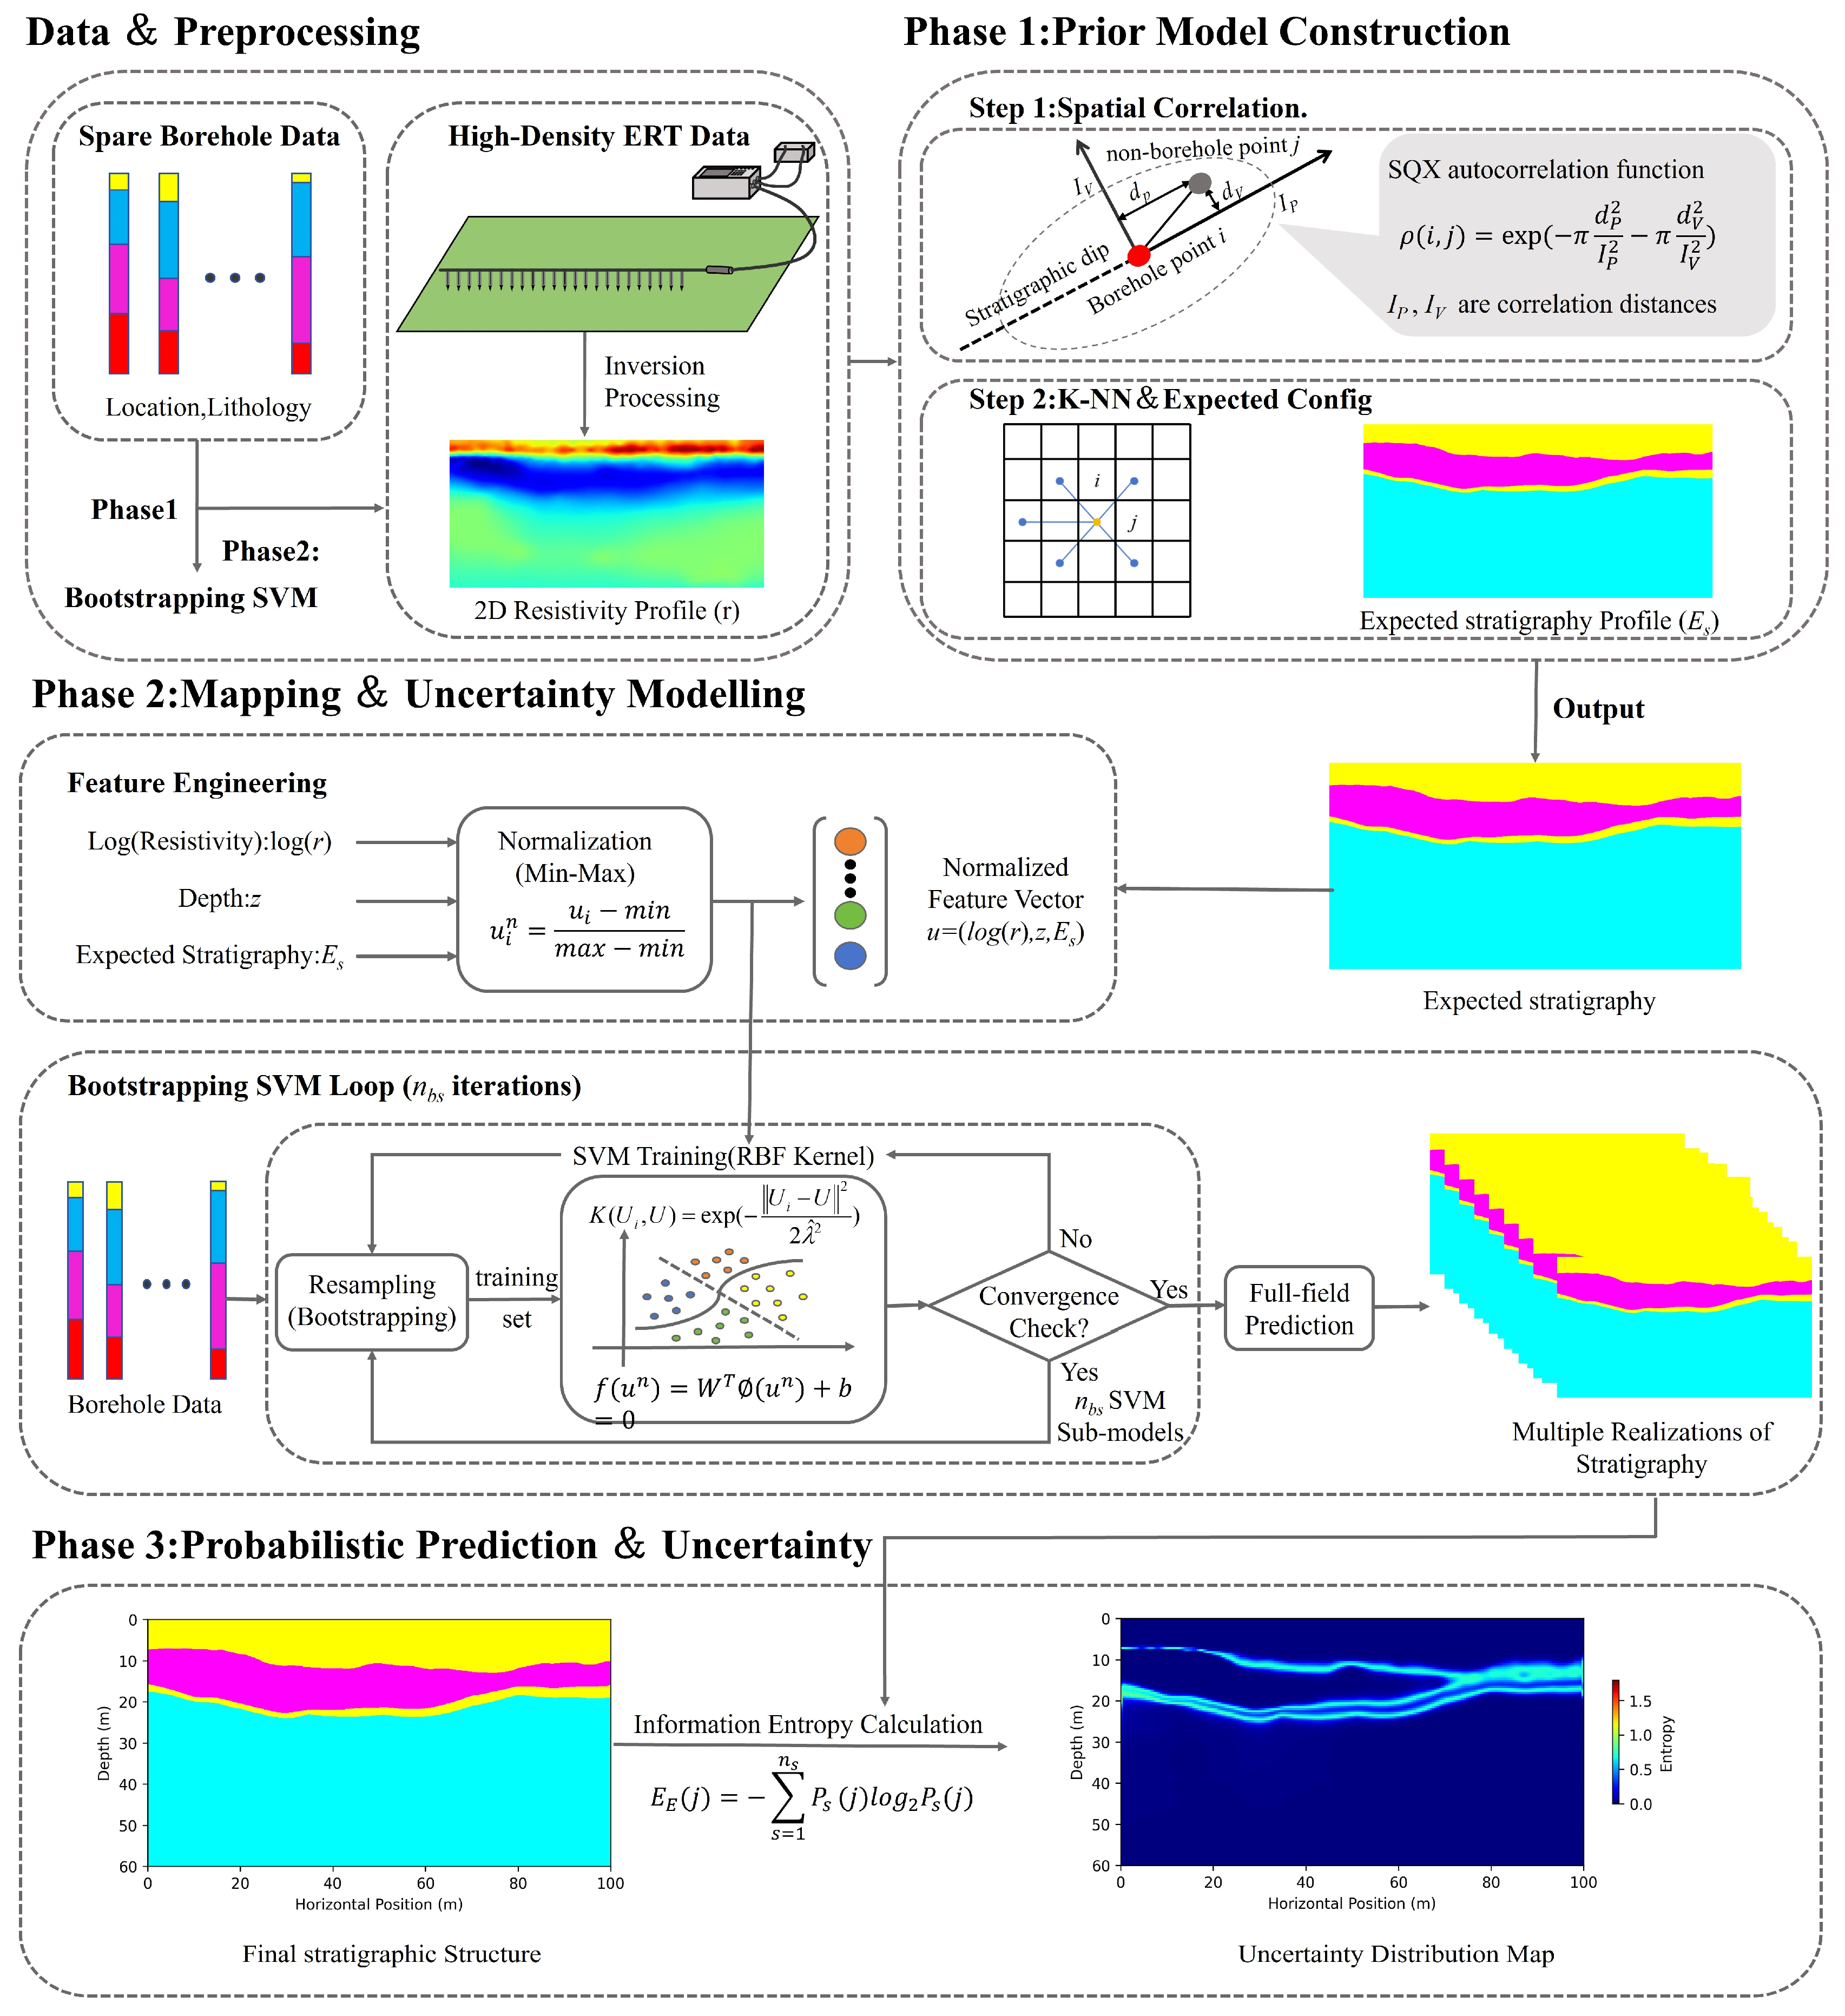
The coupled framework developed in this study was designed to integrate discrete lithological information with continuous physical field data. As shown in
Figure 4, the framework consists of three main stages:
1. Spatial prior feature extraction: Based on random field theory, the spatial autocorrelation of borehole stratigraphic data is quantified to capture the inherent continuity and anisotropy of subsurface layers. By combining the inferred spatial correlation structure with borehole observations, multiple spatially consistent stratigraphic realizations are generated over the study domain. Their ensemble mean is then used to construct a domain-wide expected stratigraphic configuration. This expected configuration represents the most likely spatial distribution of stratigraphic units conditioned on the available borehole data, and it is introduced as a spatial prior feature to guide stratigraphic prediction in unsampled areas.
2. Multi-dimensional feature fusion and mapping: A multi-dimensional feature vector is constructed by combining physical attributes, including electrical resistivity from geophysical surveys, geometric attributes such as depth, and spatial attributes represented by the expected stratigraphic configuration. An SVM-based classification model is then trained to establish a nonlinear mapping between the fused feature space and the stratigraphic categories, allowing geophysical responses to be interpreted under explicit geological constraints. To quantify the uncertainty in stratigraphic prediction, a bootstrapping resampling strategy is adopted, and the prediction uncertainty is evaluated using information entropy, thereby enabling a probabilistic assessment of the classification results.
3. Probabilistic stratigraphic modeling and uncertainty characterization: Based on the ensemble of stratigraphic classification results obtained from bootstrapping, the occurrence probability of each stratigraphic unit is estimated at each spatial location, resulting in a probabilistic stratigraphic model of the study area. Information entropy is used to describe the spatial distribution of stratigraphic uncertainty, with low-entropy regions indicating well-constrained interpretations and high-entropy regions indicating ambiguous areas. This probabilistic representation provides not only the most likely stratigraphic configuration but also an explicit measure of uncertainty, which can be directly propagated into subsequent geotechnical analyses.
2.2.1. Characterization of Spatial Variability and Prior Field Construction
Random field theory has been widely used to characterize the spatial variability of geological and geotechnical materials and to reconstruct subsurface properties from sparse observations [
13,
14,
54,
55,
56,
57,
58]. In regions lacking borehole control, the distribution of stratigraphy exhibits significant randomness. To provide effective spatial geological constraints for the machine learning model, the spatial probability field of the stratigraphy must first be reconstructed based on sparse data. This study employed the squared exponential autocorrelation function to describe the spatial dependence of stratigraphic existence. For any borehole element
and prediction element
j, the correlation coefficient
is defined as:
where
and
represent the distances parallel and perpendicular to the stratigraphic dip, respectively;
and
denote the scales of fluctuation in the corresponding directions, reflecting the continuity scale of the stratigraphy in space. The correlation distances
and
were estimated from the borehole stratigraphic data using the maximum likelihood method. The stratigraphic categories recorded in the borehole logs were first converted into indicator variables. For each stratum, the indicator variable was assigned a value of 1 when a borehole sample belonged to that stratum and 0 otherwise. The spatial correlation of these indicator variables was then described using the squared exponential autocorrelation function. For each pair of borehole samples, the separation distance was decomposed into a component parallel to the general stratigraphic dip and a component perpendicular to it. The two correlation distances were obtained by maximizing the likelihood of the observed borehole stratigraphic indicators under the assumed autocorrelation structure. In this way, the correlation distance parallel to the stratigraphic dip represents the lateral continuity of the strata, while the correlation distance perpendicular to the stratigraphic dip represents the variation in layer thickness and the transition between adjacent weathering zones. This calibration procedure ensures that the spatial prior field used in the subsequent SVM classification was constrained by the actual borehole stratigraphic sequence. Based on this correlation structure, the posterior probability
that an unsampled point
belongs to a specific stratum
is derived:
where
is the indicator function (equal to 1 if borehole element
belongs to stratum
, and 0 otherwise); and
is a smoothing factor. To facilitate subsequent feature fusion, the discrete probability distribution is further transformed into a continuous scalar feature, referred to as the expected stratigraphic configuration
:
This variable is not used as the final classification outcome; instead, it serves as a prior feature encoding spatial structural information and is subsequently incorporated into the SVM classifier.
2.2.2. Non-Linear Geological–Geophysical Mapping Based on SVM
A nonlinear relationship usually exists between the stratigraphic structure and the resistivity response obtained from high-density electrical resistivity tomography. In engineering geological interpretation, the same lithological unit may show different resistivity values because of variations in weathering degree, water content, fracture development, and clay content. At the same time, different strata may have overlapping resistivity ranges. Therefore, directly interpreting the ERT profile using fixed resistivity thresholds may lead to uncertain or unreasonable stratigraphic boundaries. To reduce this ambiguity, an SVM classifier was used to establish the relationship between the fused geological and geophysical features and the stratigraphic categories under the constraint of borehole data [
14,
59,
60,
61].
The training samples were selected from the grid elements intersected by the boreholes. At these locations, the stratigraphic labels are directly determined from the drilling logs. Four stratigraphic categories were considered in this study: silty clay, completely weathered plagioclase hornblende gneiss (PHG-C), highly weathered plagioclase hornblende gneiss (PHG-H), and moderately weathered plagioclase hornblende gneiss (PHG-M). For each labeled sample and each prediction element in the model domain, the feature vector is defined as:
where
is the logarithm of the resistivity obtained from the ERT inversion result;
z is the depth coordinate of the grid element; and
is the expected stratigraphic configuration calculated from the borehole constrained prior field. The logarithmic transformation of resistivity is used because the resistivity values vary over a wide range. This transformation can reduce the influence of extreme values and make the electrical response more suitable for classification. The depth variable is introduced because the degree of weathering, overburden stress, and groundwater condition commonly vary with depth. The prior stratigraphic feature
reflects the spatial continuity and anisotropy of the strata inferred from the borehole data, and it helps to guide the classifier toward geologically reasonable predictions in areas without direct drilling control.
Before training, all input features were normalized to the range
using min–max normalization. This avoids the dominance of features with larger numerical values, especially resistivity, in the classification process. The borehole samples were then used to train the SVM classifier. Because the boundary between different weathering zones is often irregular and the relationship between resistivity and lithology is not linear, the radial basis function kernel was adopted:
where
controls the width of the radial basis function. The penalty parameter and the kernel parameter were selected by cross-validation and grid search using the borehole samples [
52,
53]. This procedure was used to balance the model’s fitting and generalization abilities, especially given the limited number of boreholes.
After training, the SVM classifier was applied to all grid elements in the two-dimensional section to predict the stratigraphic category. In this study, the SVM result was not treated as a single deterministic geological section. Instead, bootstrap resampling was used to quantify the uncertainty of the classification. Multiple training datasets were generated by resampling the borehole samples with replacement, and an independent SVM model was trained for each dataset. These models produced a set of possible stratigraphic interpretations. For a given grid element, the occurrence probability of each stratum was calculated as the proportion of models that predict that stratum for the element. In this way, the SVM procedure provided both the most likely stratigraphic model and the corresponding uncertainty of stratigraphic classification.
The SVM mapping result still depends on the representativeness of the borehole samples and the quality of the ERT inversion. When the number of boreholes is small or different strata have similar resistivity responses, the classification uncertainty may remain high. Therefore, the SVM model in this study was used as an auxiliary tool for engineering geological interpretation rather than a replacement for geological judgment. The uncertainty caused by this classification process was quantified using the bootstrap ensemble and then considered in the subsequent stability analysis.
2.2.3. Characterization of Stratigraphic Uncertainty
Since a single SVM model yields a deterministic stratigraphic prediction that fails to capture the uncertainty inherent in sparse site investigations, this study employed a Bootstrapping-based ensemble approach to quantify the reliability of the interpretation [
14,
60,
61]. Specifically, given that “ground truth” is confined to borehole locations, the Bootstrapping technique was applied to generate
independent training sets via resampling with replacement. This process yielded
independent SVM classifiers, each representing a plausible interpretation logic consistent with the available data. Consequently, for every grid element
in the domain, the ensemble transformed the prediction from a single label into a probability distribution, where the probability
of element
belonging to stratum
was estimated as its frequency of occurrence across the
predictions.
To explicitly map the confidence of the fusion result, Information Entropy is introduced as a scalar metric of uncertainty [
13,
14]. The entropy
for element
is calculated as:
where
denotes the total number of stratigraphic categories. Specifically, low entropy indicates low stratigraphic uncertainty, implying that the majority of the ensemble models converge on a single stratigraphic classification (typically within homogeneous interiors or in the vicinity of boreholes). Conversely, high entropy signifies high stratigraphic uncertainty, characterized by conflicting predictions among models (typically observed at lithological transition zones, stratigraphic boundaries, or regions distal to boreholes). This probabilistic framework ensures that the final output is not confined to a single geological cross-section but incorporates a comprehensive assessment of stratigraphic uncertainty, thereby enabling the explicit identification of reliable versus risky areas within the data fusion interpretation.
2.3. Probabilistic Evaluation of the Panzhuangzu Landslide with Stratigraphic Uncertainty
2.3.1. Numerical Simulation of the Panzhuangzu Landslide
After the improved stratigraphic model was obtained by integrating borehole and geophysical data, it was still recognized that the model contains inherent uncertainty due to data sparsity and the non-uniqueness of geological interpretation. To explicitly account for this uncertainty, a sampling-based numerical simulation framework was adopted, in which multiple plausible realizations of the stratigraphic configuration are generated and analyzed separately. The strength reduction method has become a widely accepted numerical approach for evaluating slope stability [
62,
63], while Monte Carlo simulation is commonly used to propagate uncertainty in geotechnical analyses [
58]. Specifically, numerical simulations were carried out using FLAC3D 7.0 to quantitatively evaluate how stratigraphic uncertainty affects landslide stability results. Each realization was sampled from the probabilistic stratigraphic model and represents a feasible spatial configuration constrained by the available borehole and geophysical data. For each realization, a deterministic numerical model is established along the A–A′ cross-section, which coincides with the main sliding direction of the landslide and captures the overall structural characteristics of the landslide body and the potential sliding paths.
The stratigraphic configuration of the selected cross-section integrated information from borehole investigations and electrical resistivity imaging, thereby reflecting variations in the thickness of weathered layers and the spatial distribution of rock masses with different weathering degrees. The numerical model for each realization is shown in
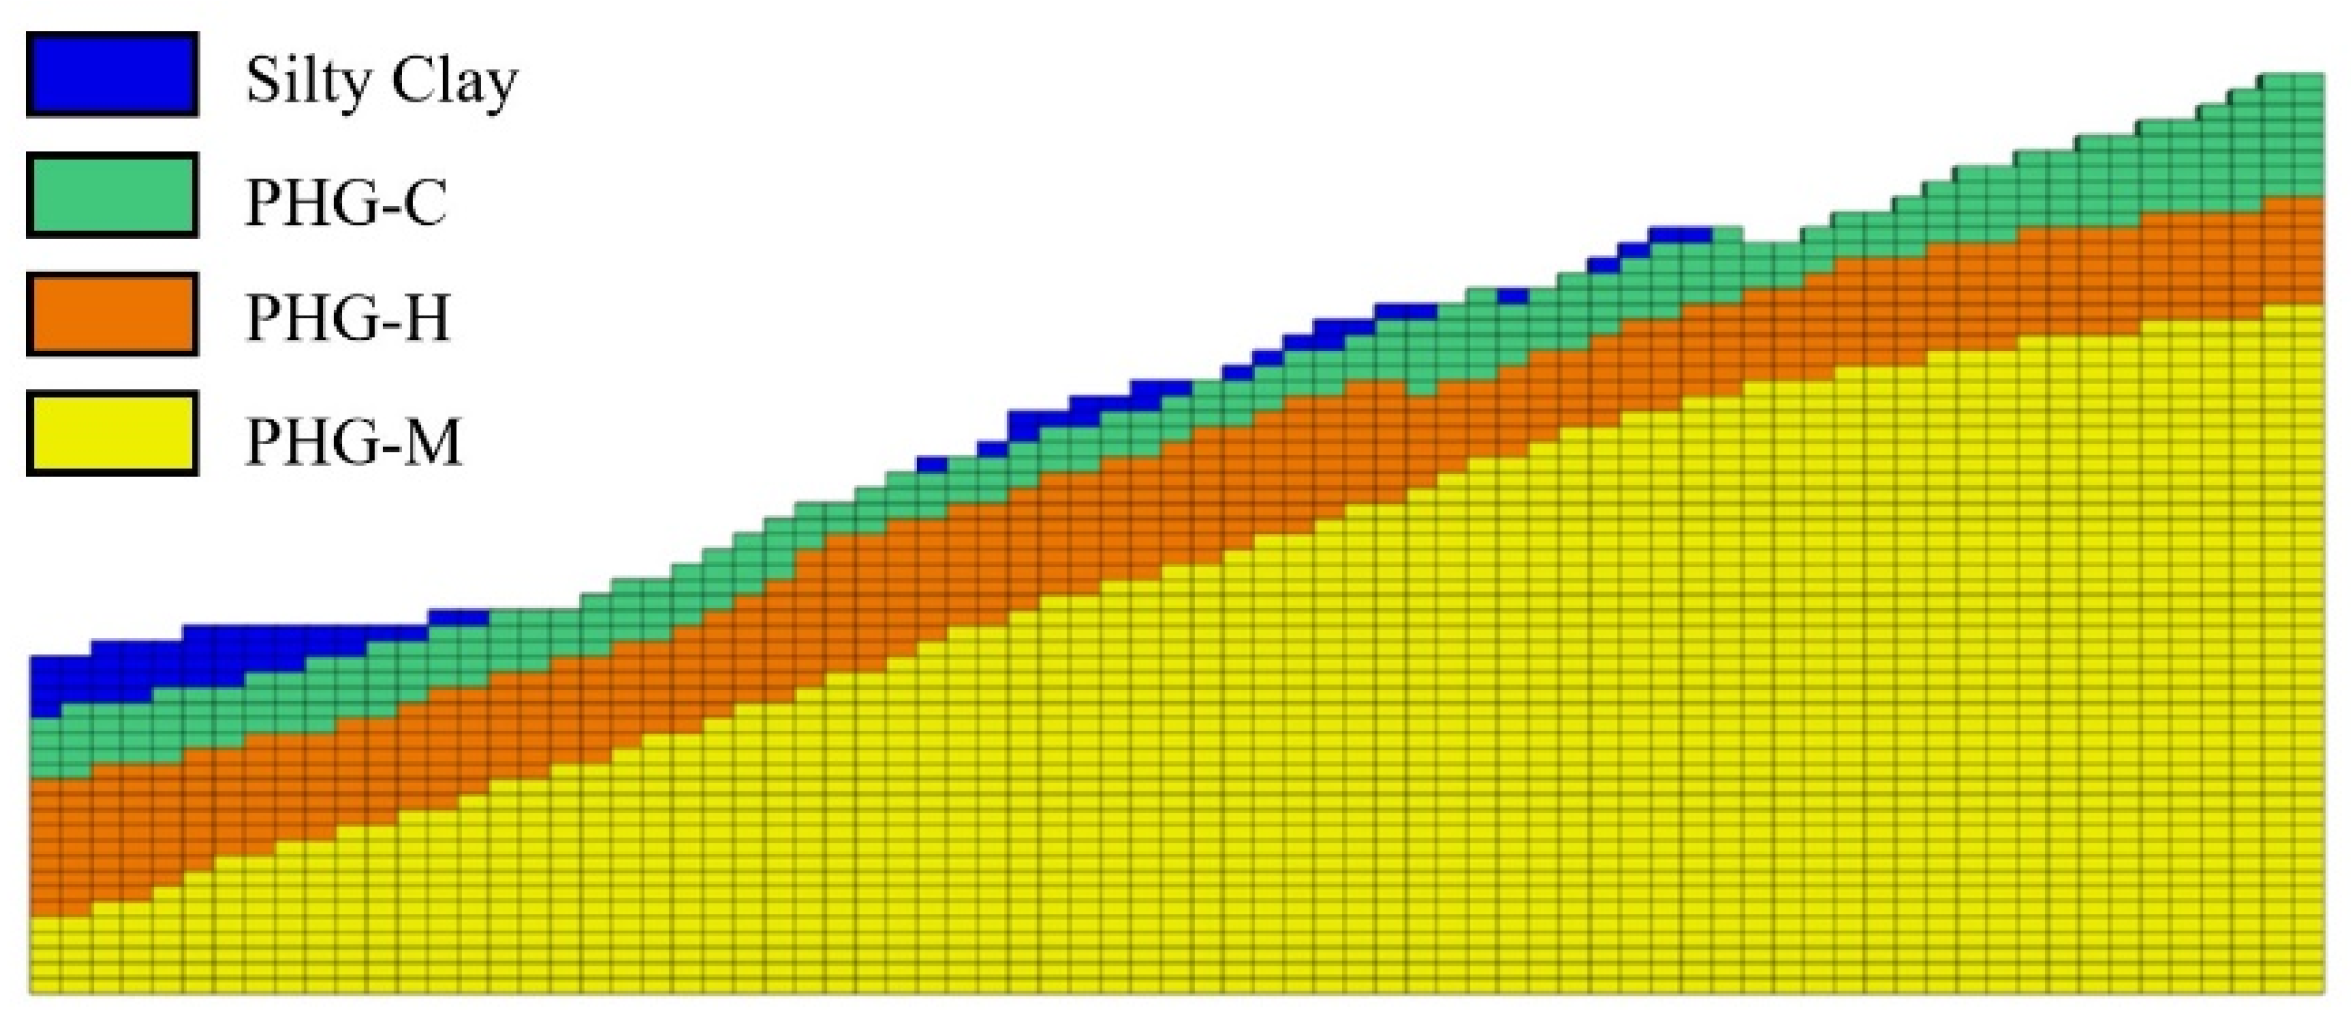
Figure 5. The model has a height of 60.0 m, a length of 150.0 m, and a unit width of 1.0 m. It is discretized into 6186 nodes and 2956 finite-difference zones, with a uniform zone size of 2.0 m × 1.0 m. Appropriate boundary conditions were applied in FLAC3D to ensure numerical stability. The bottom boundary is fixed, normal displacement constraints are imposed on the left and right boundaries, and the landslide surface is treated as a free boundary. The model includes four stratigraphic units, namely silty clay, PHG-C, PHG-H, and PHG-M. All geomaterials were simulated using the elastoplastic Mohr–Coulomb constitutive model in FLAC3D, which reasonably describes the elastoplastic deformation and shear failure behavior of geomaterials. The physical and mechanical parameters used in the numerical model were mainly obtained from the geotechnical test report provided during the project investigation. The parameters were assigned according to the four stratigraphic units considered in the FLAC3D model, including silty clay, completely weathered plagioclase hornblende gneiss, highly weathered plagioclase hornblende gneiss, and moderately weathered plagioclase hornblende gneiss. For the weathered rock units, the values listed in
Table 1 should be regarded as equivalent rock mass parameters rather than intact rock parameters, since their mechanical behavior is affected by weathering degree, joint and fracture development, and water weakening. These parameters were used as the basis for the subsequent strength reduction analysis.
For each sampled stratigraphic realization, landslide stability was evaluated in terms of the factor of safety using the strength reduction method implemented in FLAC3D. In this procedure, a deterministic numerical model was first established by assigning the corresponding stratigraphic geometry and material properties to the finite-difference zones. The mechanical parameters of all stratigraphic units were then reduced uniformly in a stepwise manner, while the boundary and loading conditions remain unchanged. During this process, the numerical model was solved iteratively until a stable equilibrium state is reached or numerical non-convergence occurs. Failure was identified by the development of extensive plastic deformation, the formation of a continuous shear zone, and the inability of the model to reach equilibrium. The reduction factor at this critical state was taken as the factor of safety for the corresponding stratigraphic realization.
2.3.2. Implementation Procedure for Probabilistic Evaluation
Conventional deterministic numerical simulations are usually carried out using a single “optimal” stratigraphic model and therefore cannot quantify the effect of geological uncertainty caused by data sparsity and the non-uniqueness of interpretation on landslide stability. To address this limitation, an integrated probabilistic analysis framework was developed. An ensemble of SVM classifiers trained through repeated bootstrap resampling was used to generate multiple possible realizations of the stratigraphic profile. Each realization represents a feasible subsurface configuration that was consistent with the available borehole and geophysical data. Each stratigraphic realization is then mapped onto a predefined numerical grid. The material type of each numerical element was determined from the coordinates of its centroid and assigned the corresponding mechanical parameters listed in
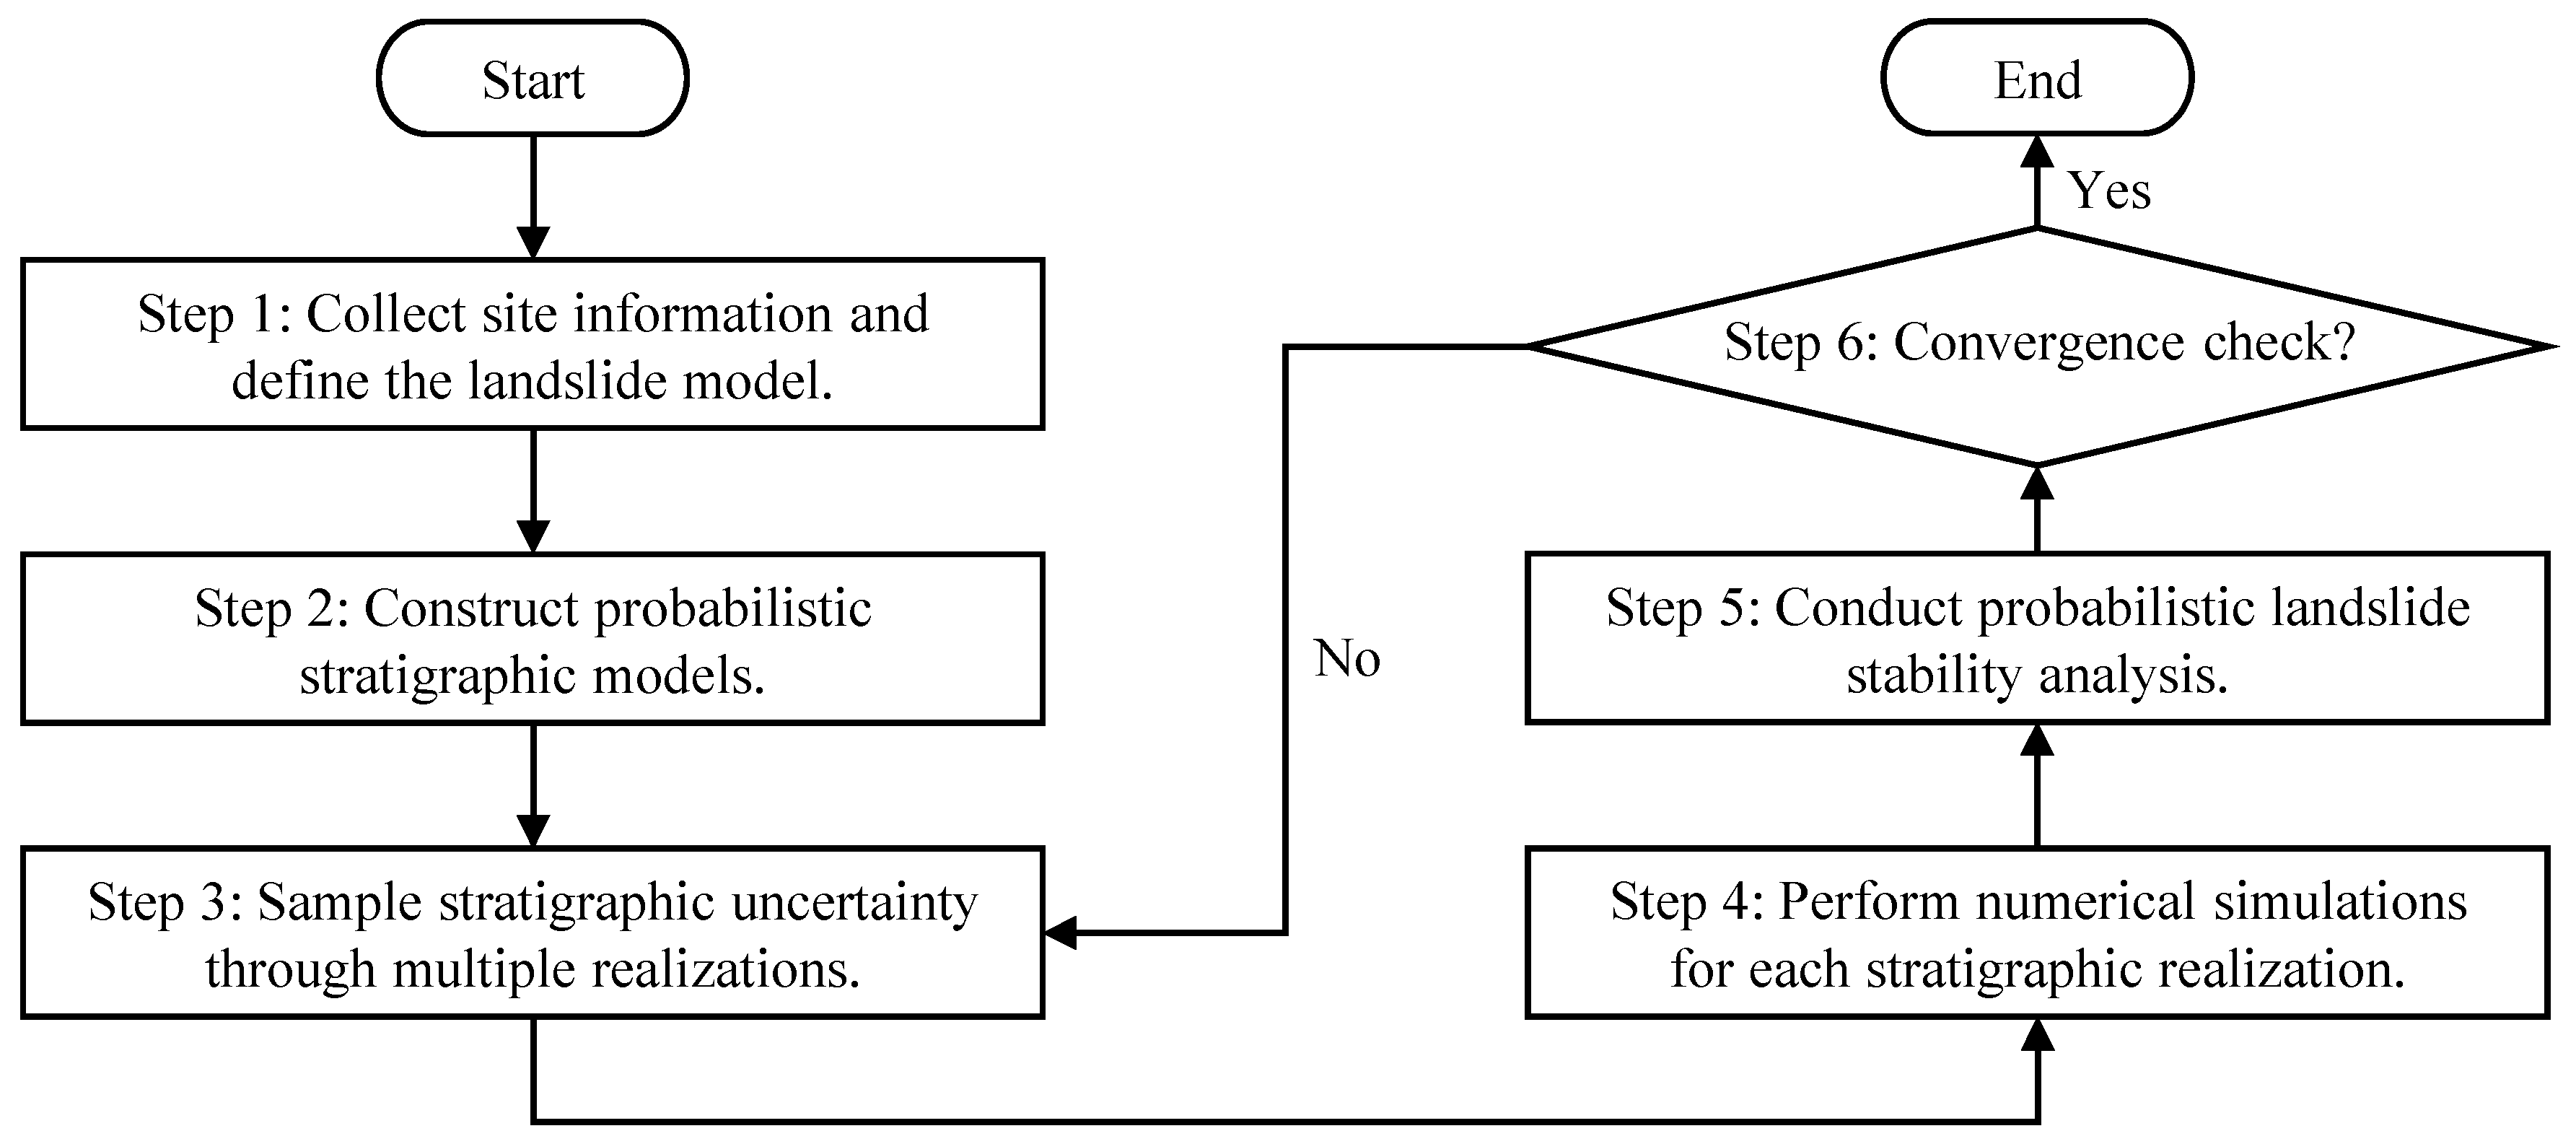
Table 1. The factor of safety for each realization was then evaluated using the strength reduction method. The flowchart of the proposed framework is shown in
Figure 6, and the main procedure is summarized as follows.
Step 1: Collect site information and define the landslide model. Geological, geotechnical, and geophysical data from the landslide site were first collected and integrated to establish the basis for analysis. Borehole logs, electrical resistivity data, surface topography, and existing investigation results are compiled and unified in a common coordinate system. Based on these data, the landslide geometry, the potential sliding direction, and the analysis domain are defined, providing the basic input for subsequent stratigraphic modeling and numerical simulation.
Step 2: Construct probabilistic stratigraphic models. A probabilistic stratigraphic modeling framework was established to characterize uncertainty in subsurface layering. Borehole and electrical resistivity data were used jointly to infer stratigraphic classes, while spatial correlation is introduced through random field theory to constrain stratigraphic continuity. An SVM classifier was trained to map geophysical attributes and spatial information to stratigraphic categories, providing the basis for generating alternative stratigraphic configurations.
Step 3: Sample stratigraphic uncertainty through multiple realizations. Stratigraphic uncertainty was sampled by generating a large number of plausible realizations using a bootstrapping strategy. Through repeated resampling of the training data and retraining of the SVM classifier, multiple predictions of stratigraphic geometry were obtained. Each realization represents a feasible subsurface configuration consistent with the available site investigation data and reflects the uncertainty caused by data sparsity and interpretational non-uniqueness.
Step 4: Perform numerical simulations for each stratigraphic realization. Each stratigraphic realization was mapped onto a predefined FLAC3D numerical grid. The material type of each grid element was determined according to the coordinates of its centroid and assigned the corresponding mechanical parameters. Deterministic numerical simulations were then carried out for each realization using the strength reduction method, and the factor of safety was calculated for every mapped model.
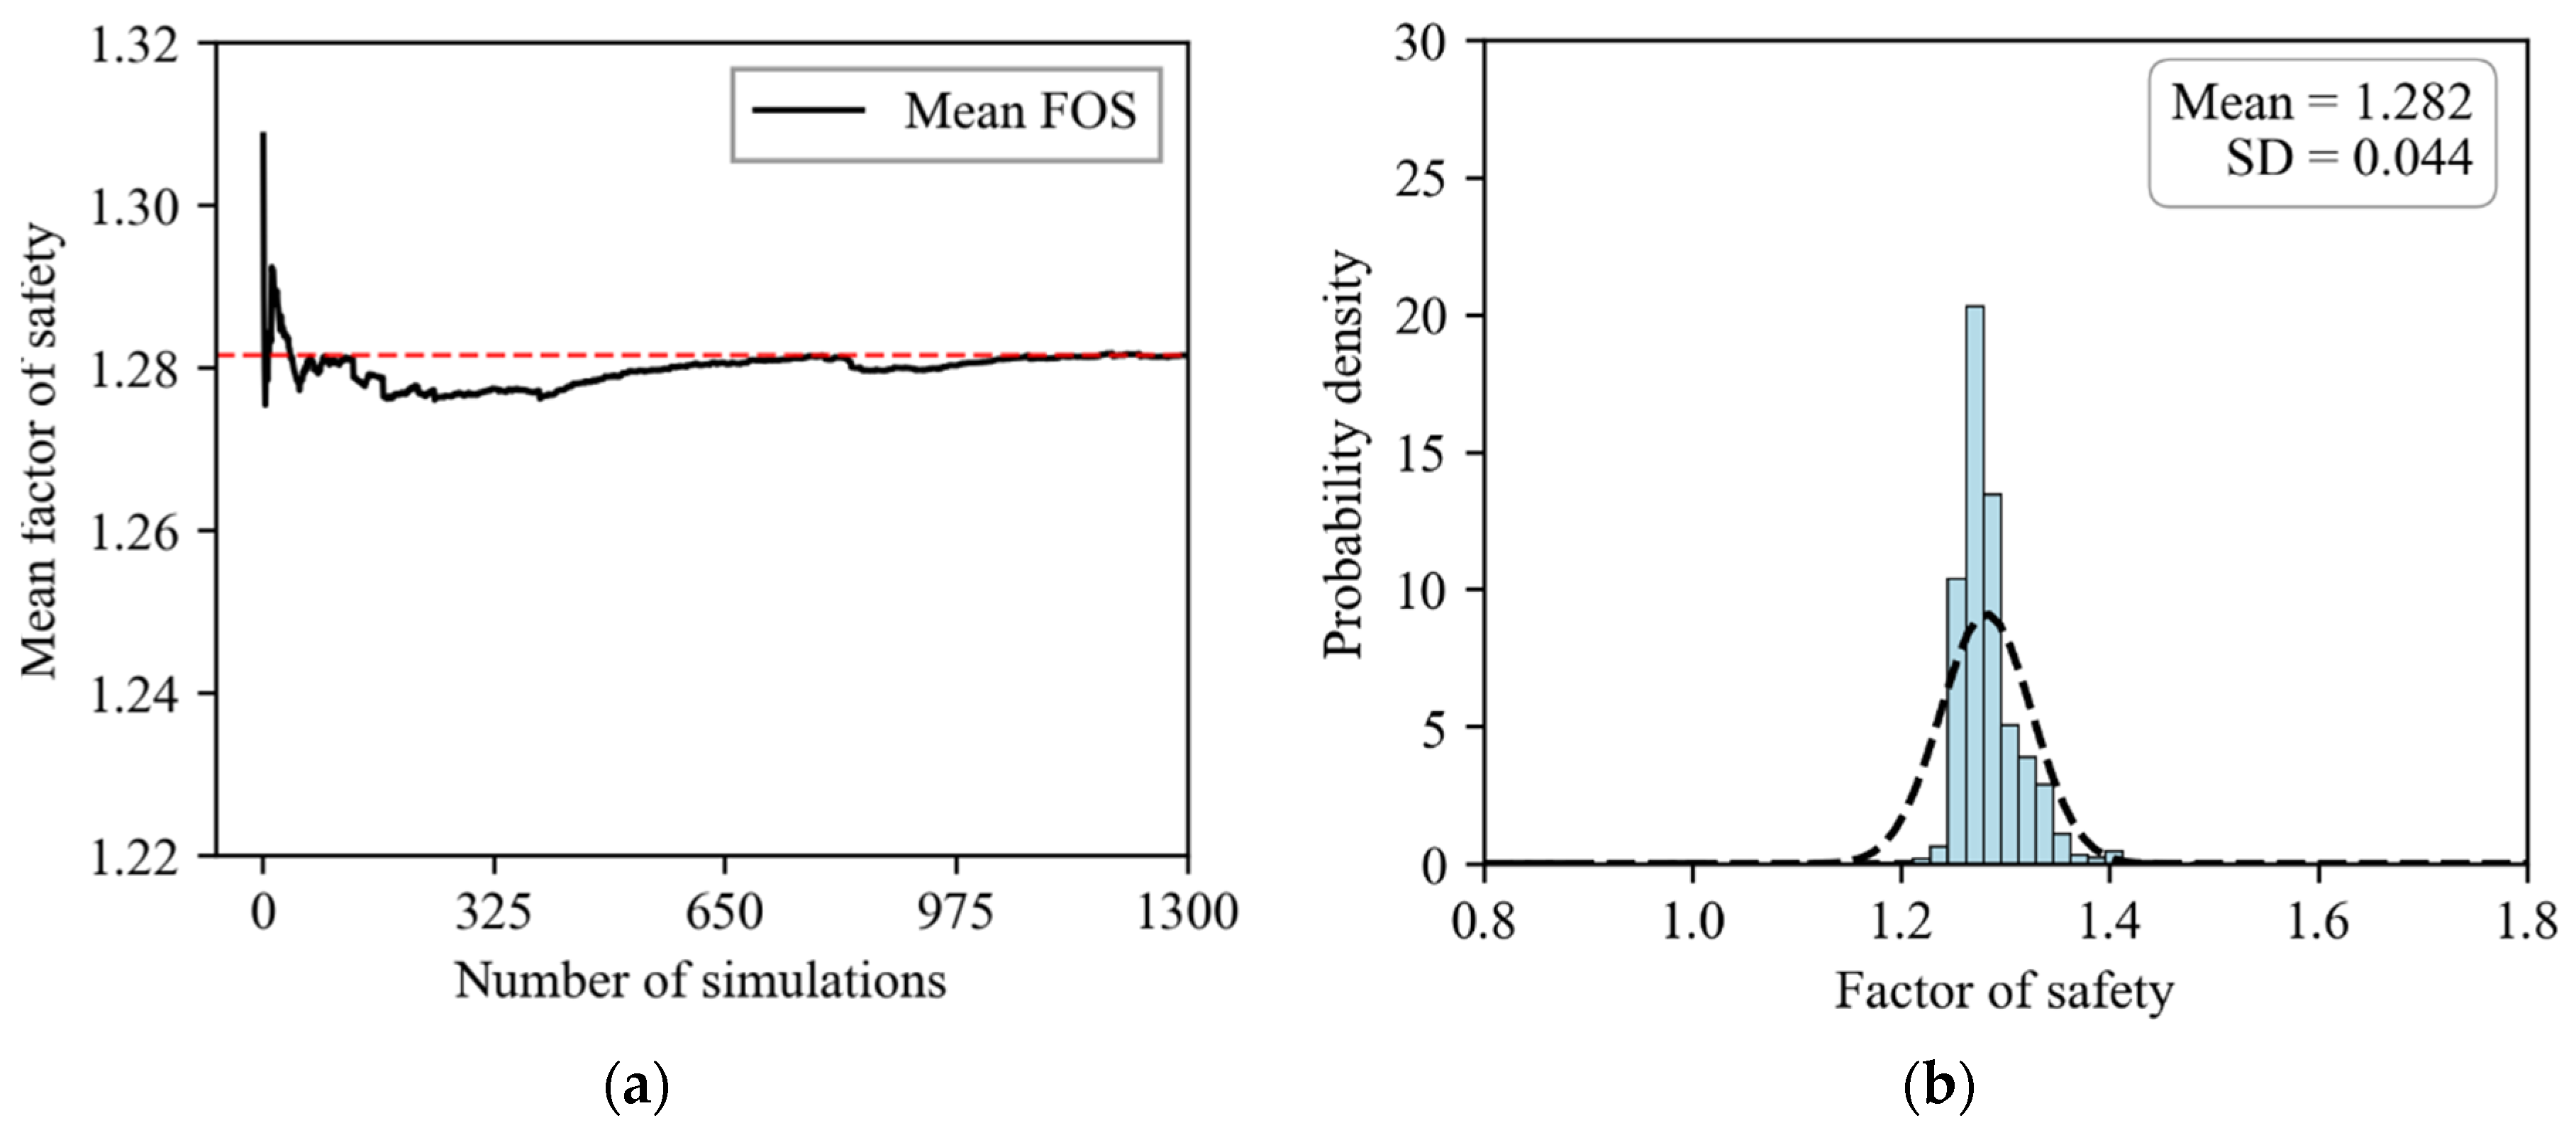
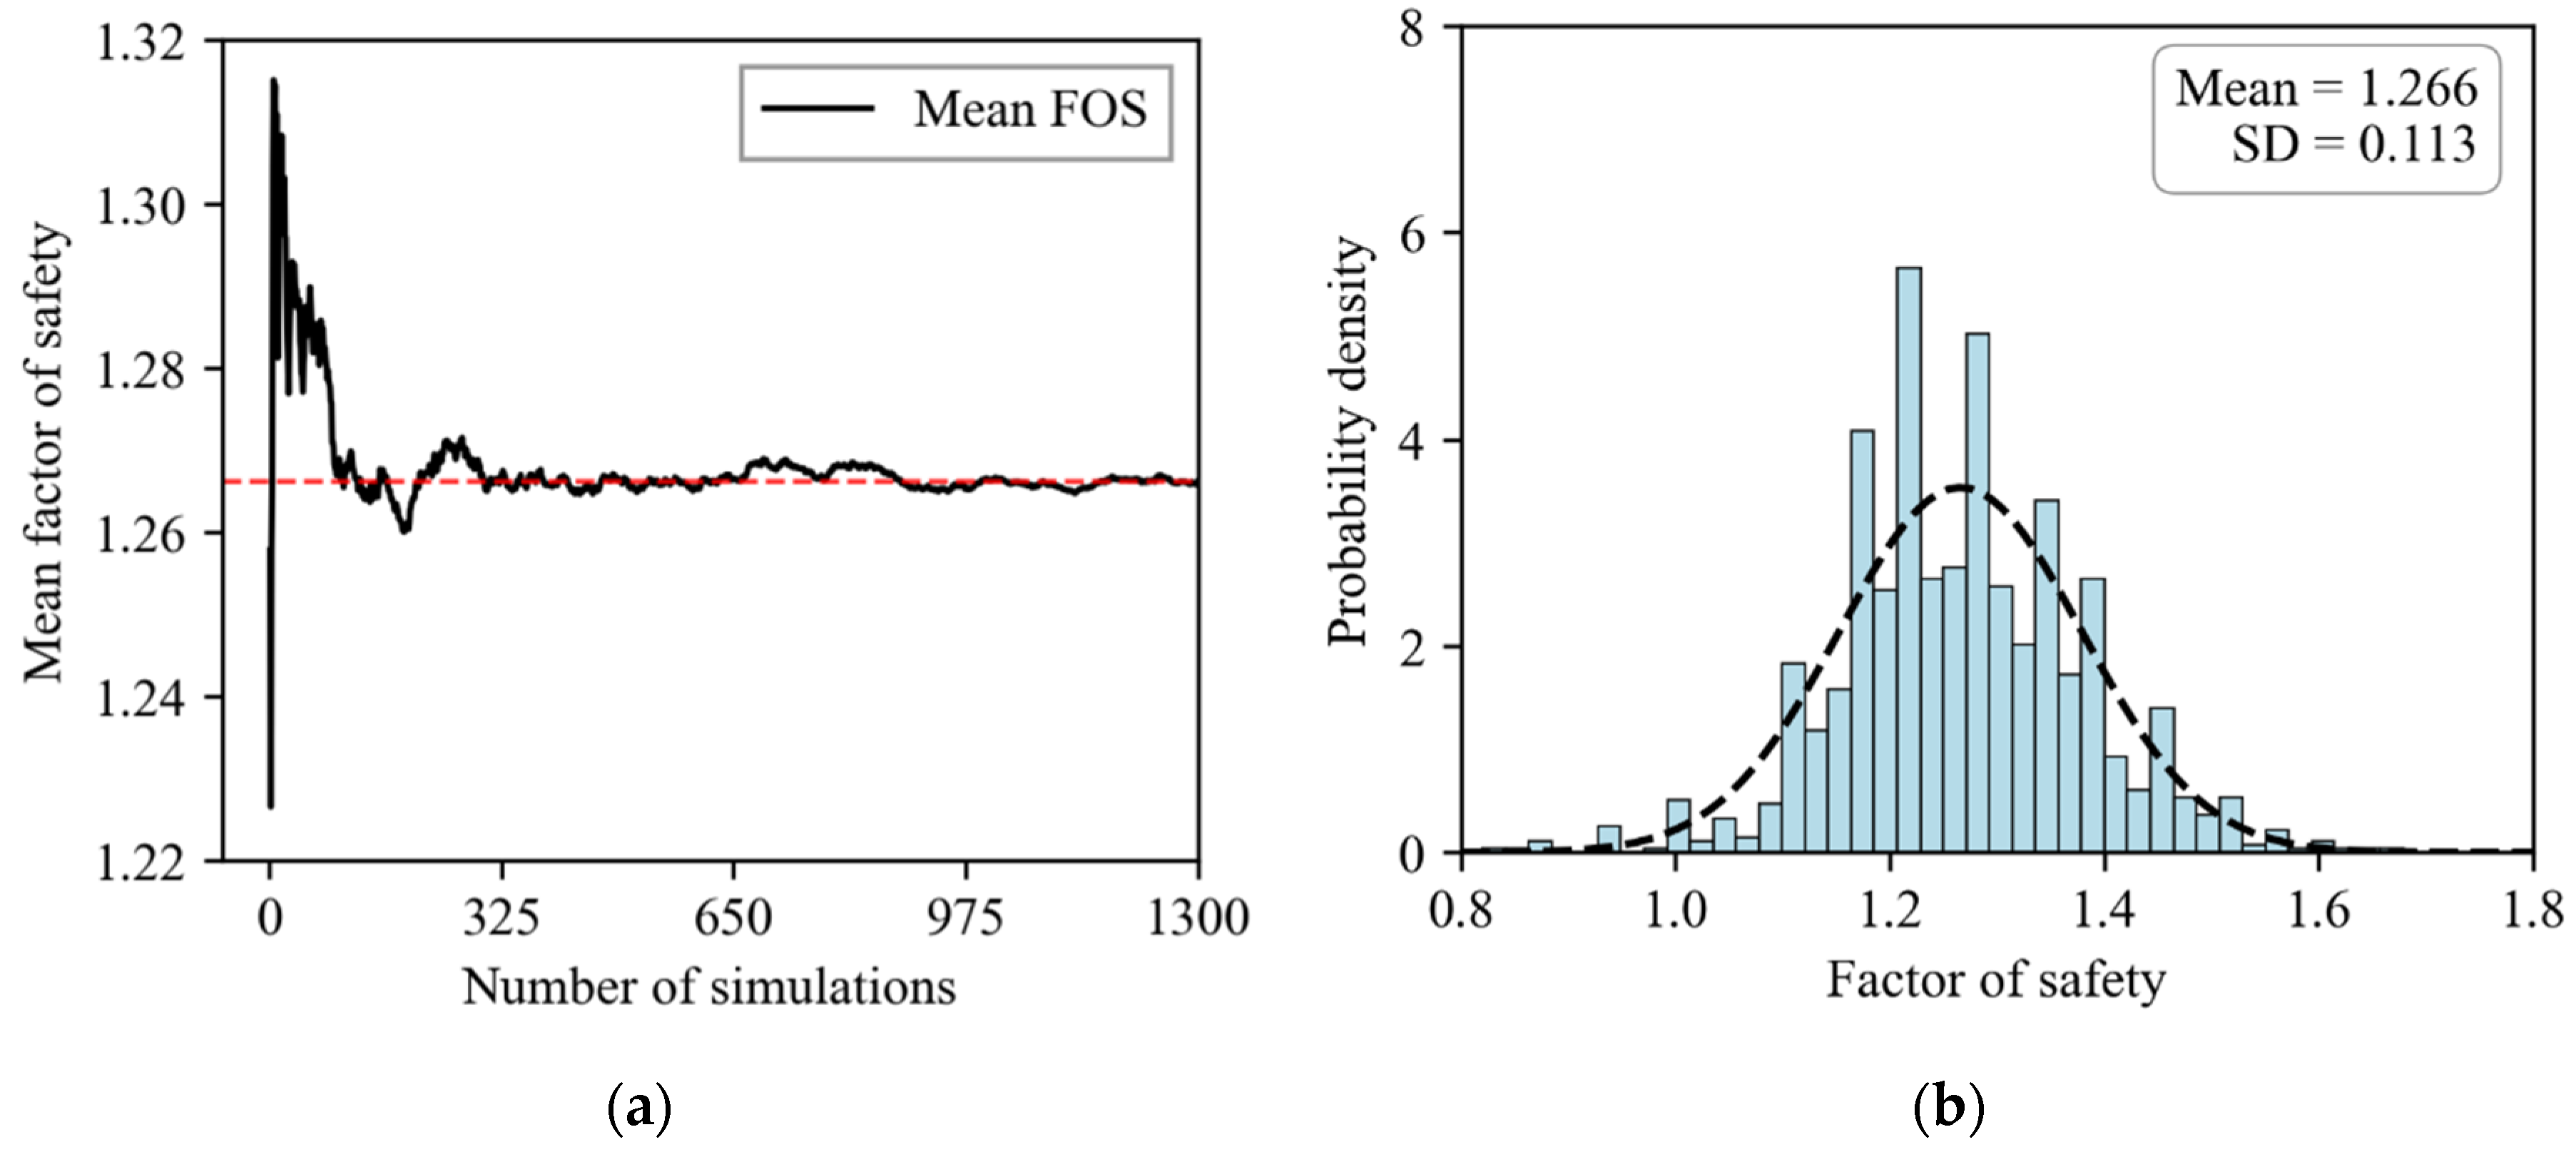
Step 5: Conduct probabilistic landslide stability analysis. The ensemble of factors of safety obtained from all stratigraphic realizations was analyzed to evaluate landslide stability in a probabilistic manner. Statistical analysis was performed to derive the probability distribution of the factor of safety and to estimate the failure probability of the landslide. In addition, information entropy was calculated to quantify geological uncertainty and assess its influence on landslide stability.
Step 6: Check convergence of the probabilistic analysis and update sampling if necessary. Convergence was assessed by monitoring key statistical indicators, including the mean and standard deviation of the factor of safety and the estimated failure probability, as the number of stratigraphic realizations increases. If convergence was achieved within a prescribed tolerance, the analysis is terminated. Otherwise, additional realizations are generated by returning to Step 3, while all previously obtained results are retained and incorporated into the updated probabilistic assessment.
Through this procedure, the spatial variability of stratigraphic boundaries is directly translated into a statistical distribution of the factor of safety. Compared with traditional analysis approaches, this framework not only allows for the calculation of the mean factor of safety, but also quantifies risk fluctuations caused by ambiguous stratigraphic interpretations. By evaluating the probability of failure and the confidence intervals of safety factors, it provides a more scientifically robust basis for landslide risk management.
4. Discussion
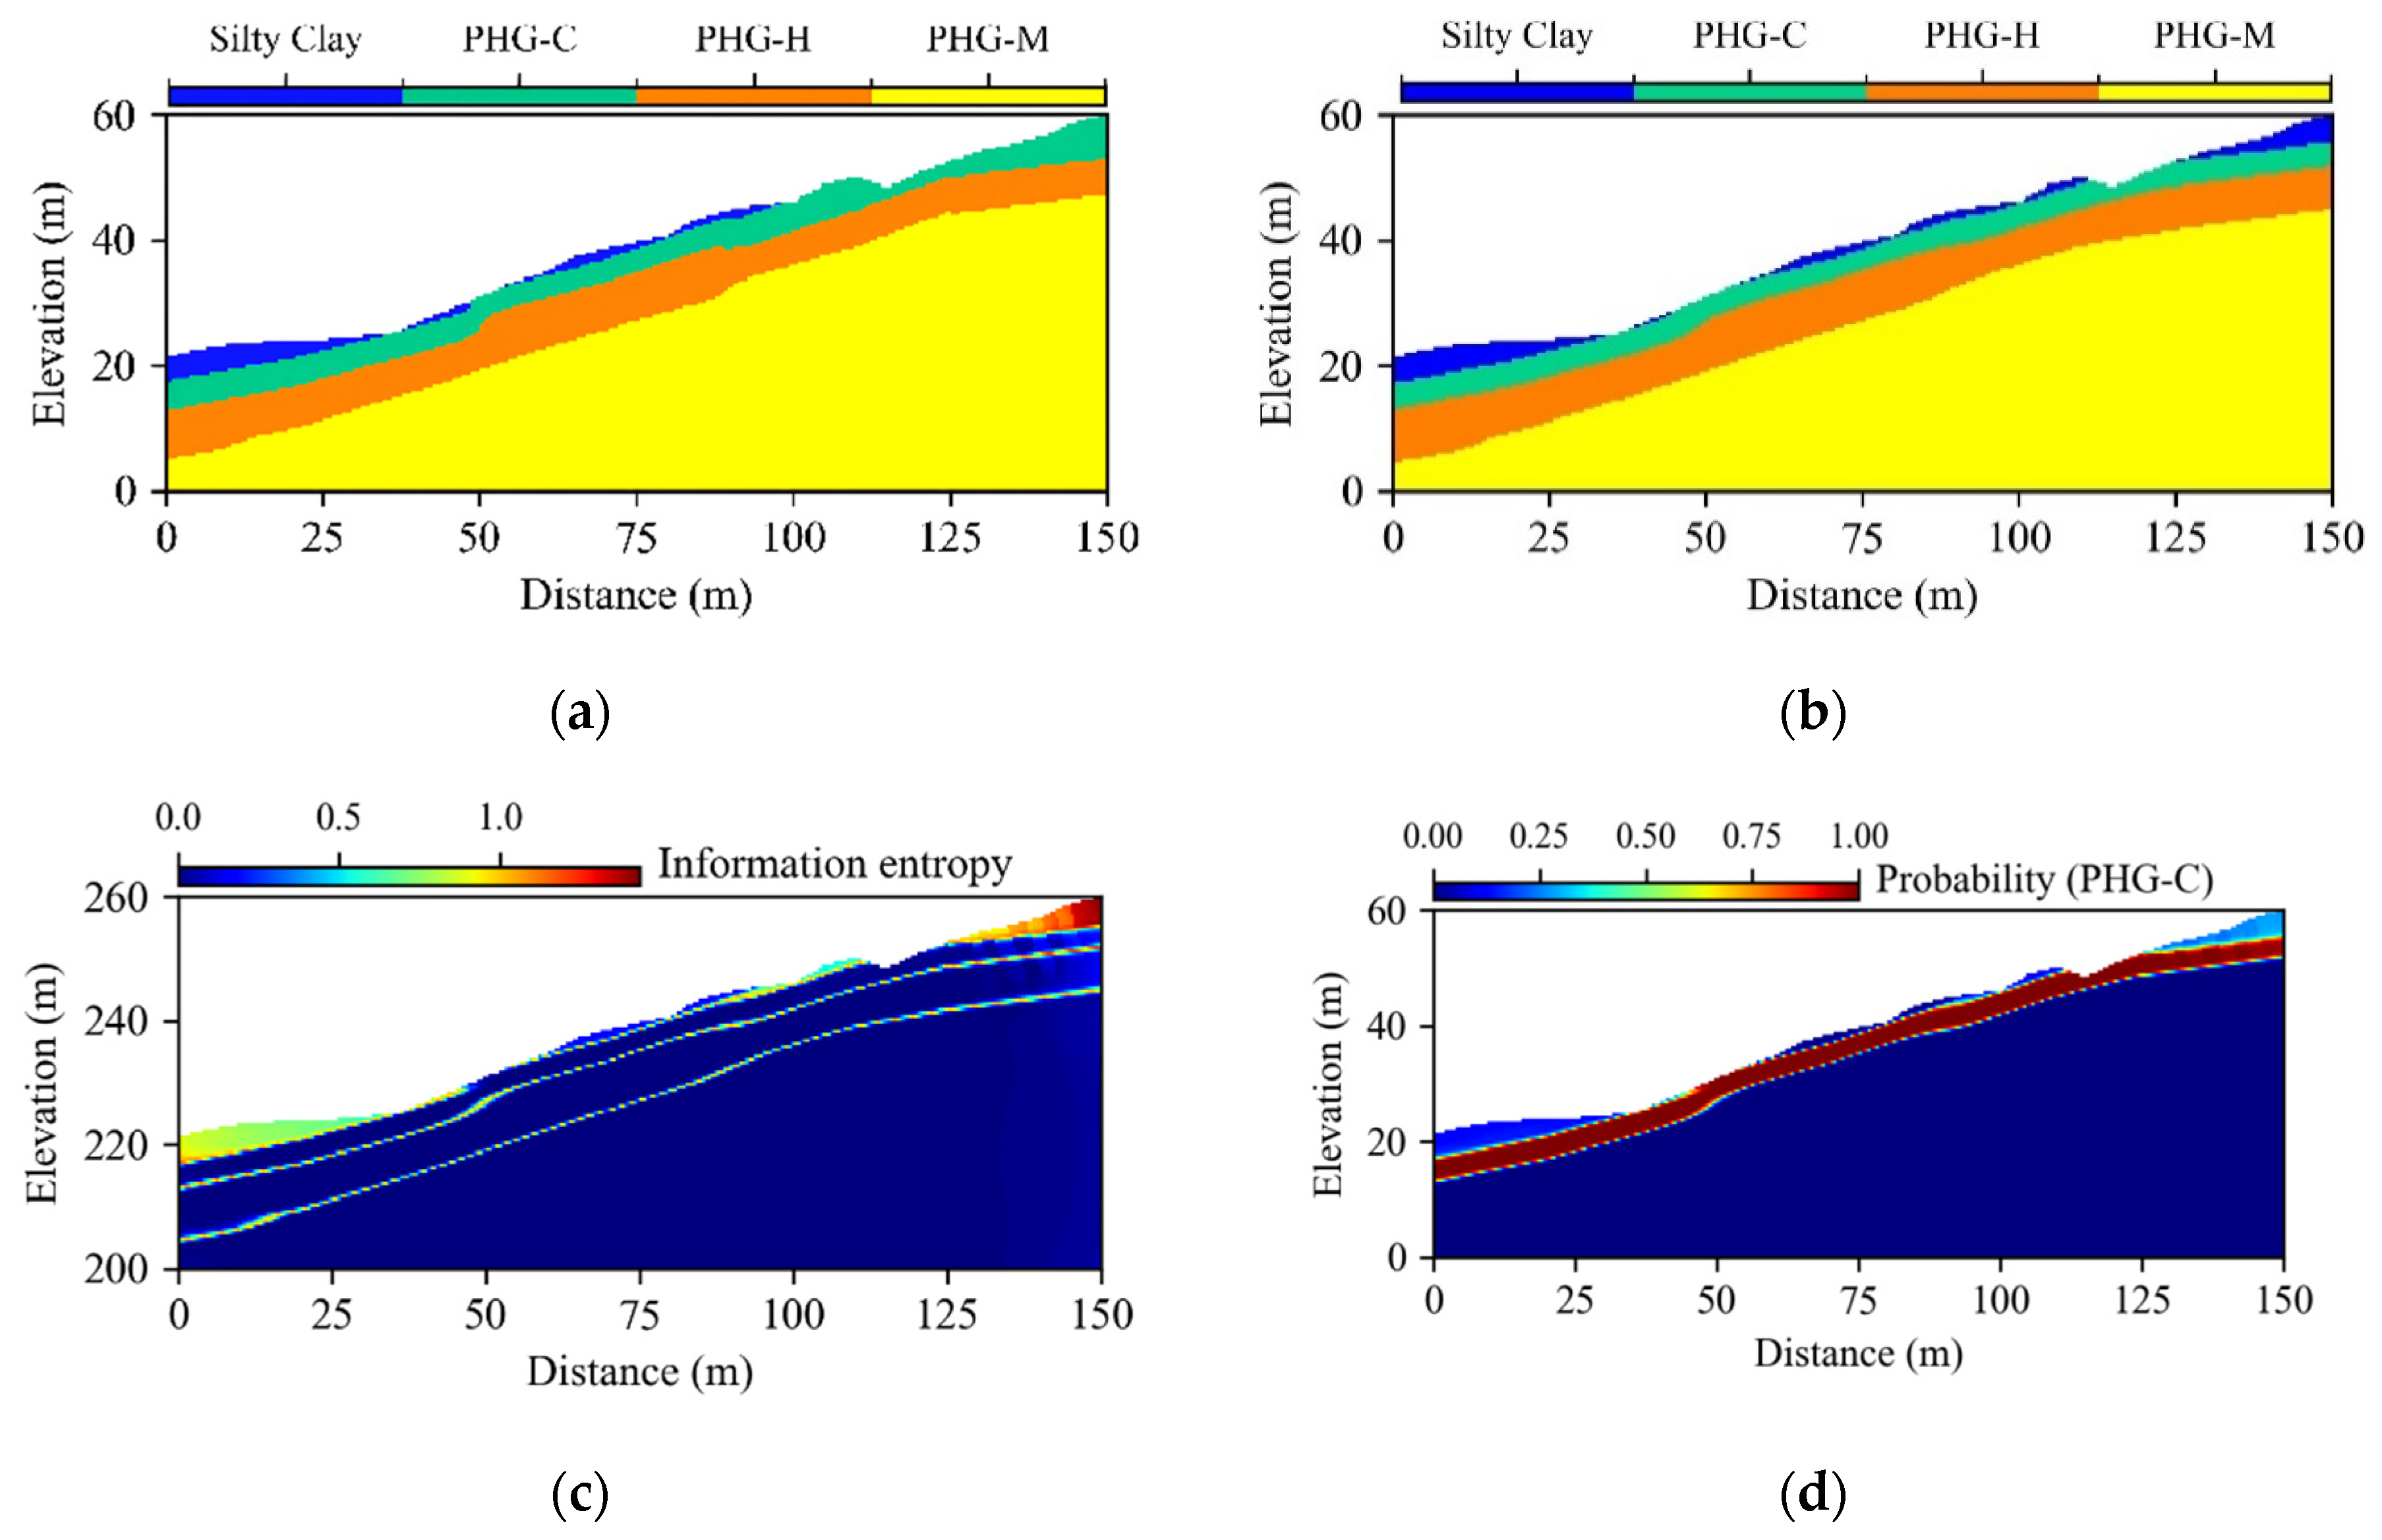
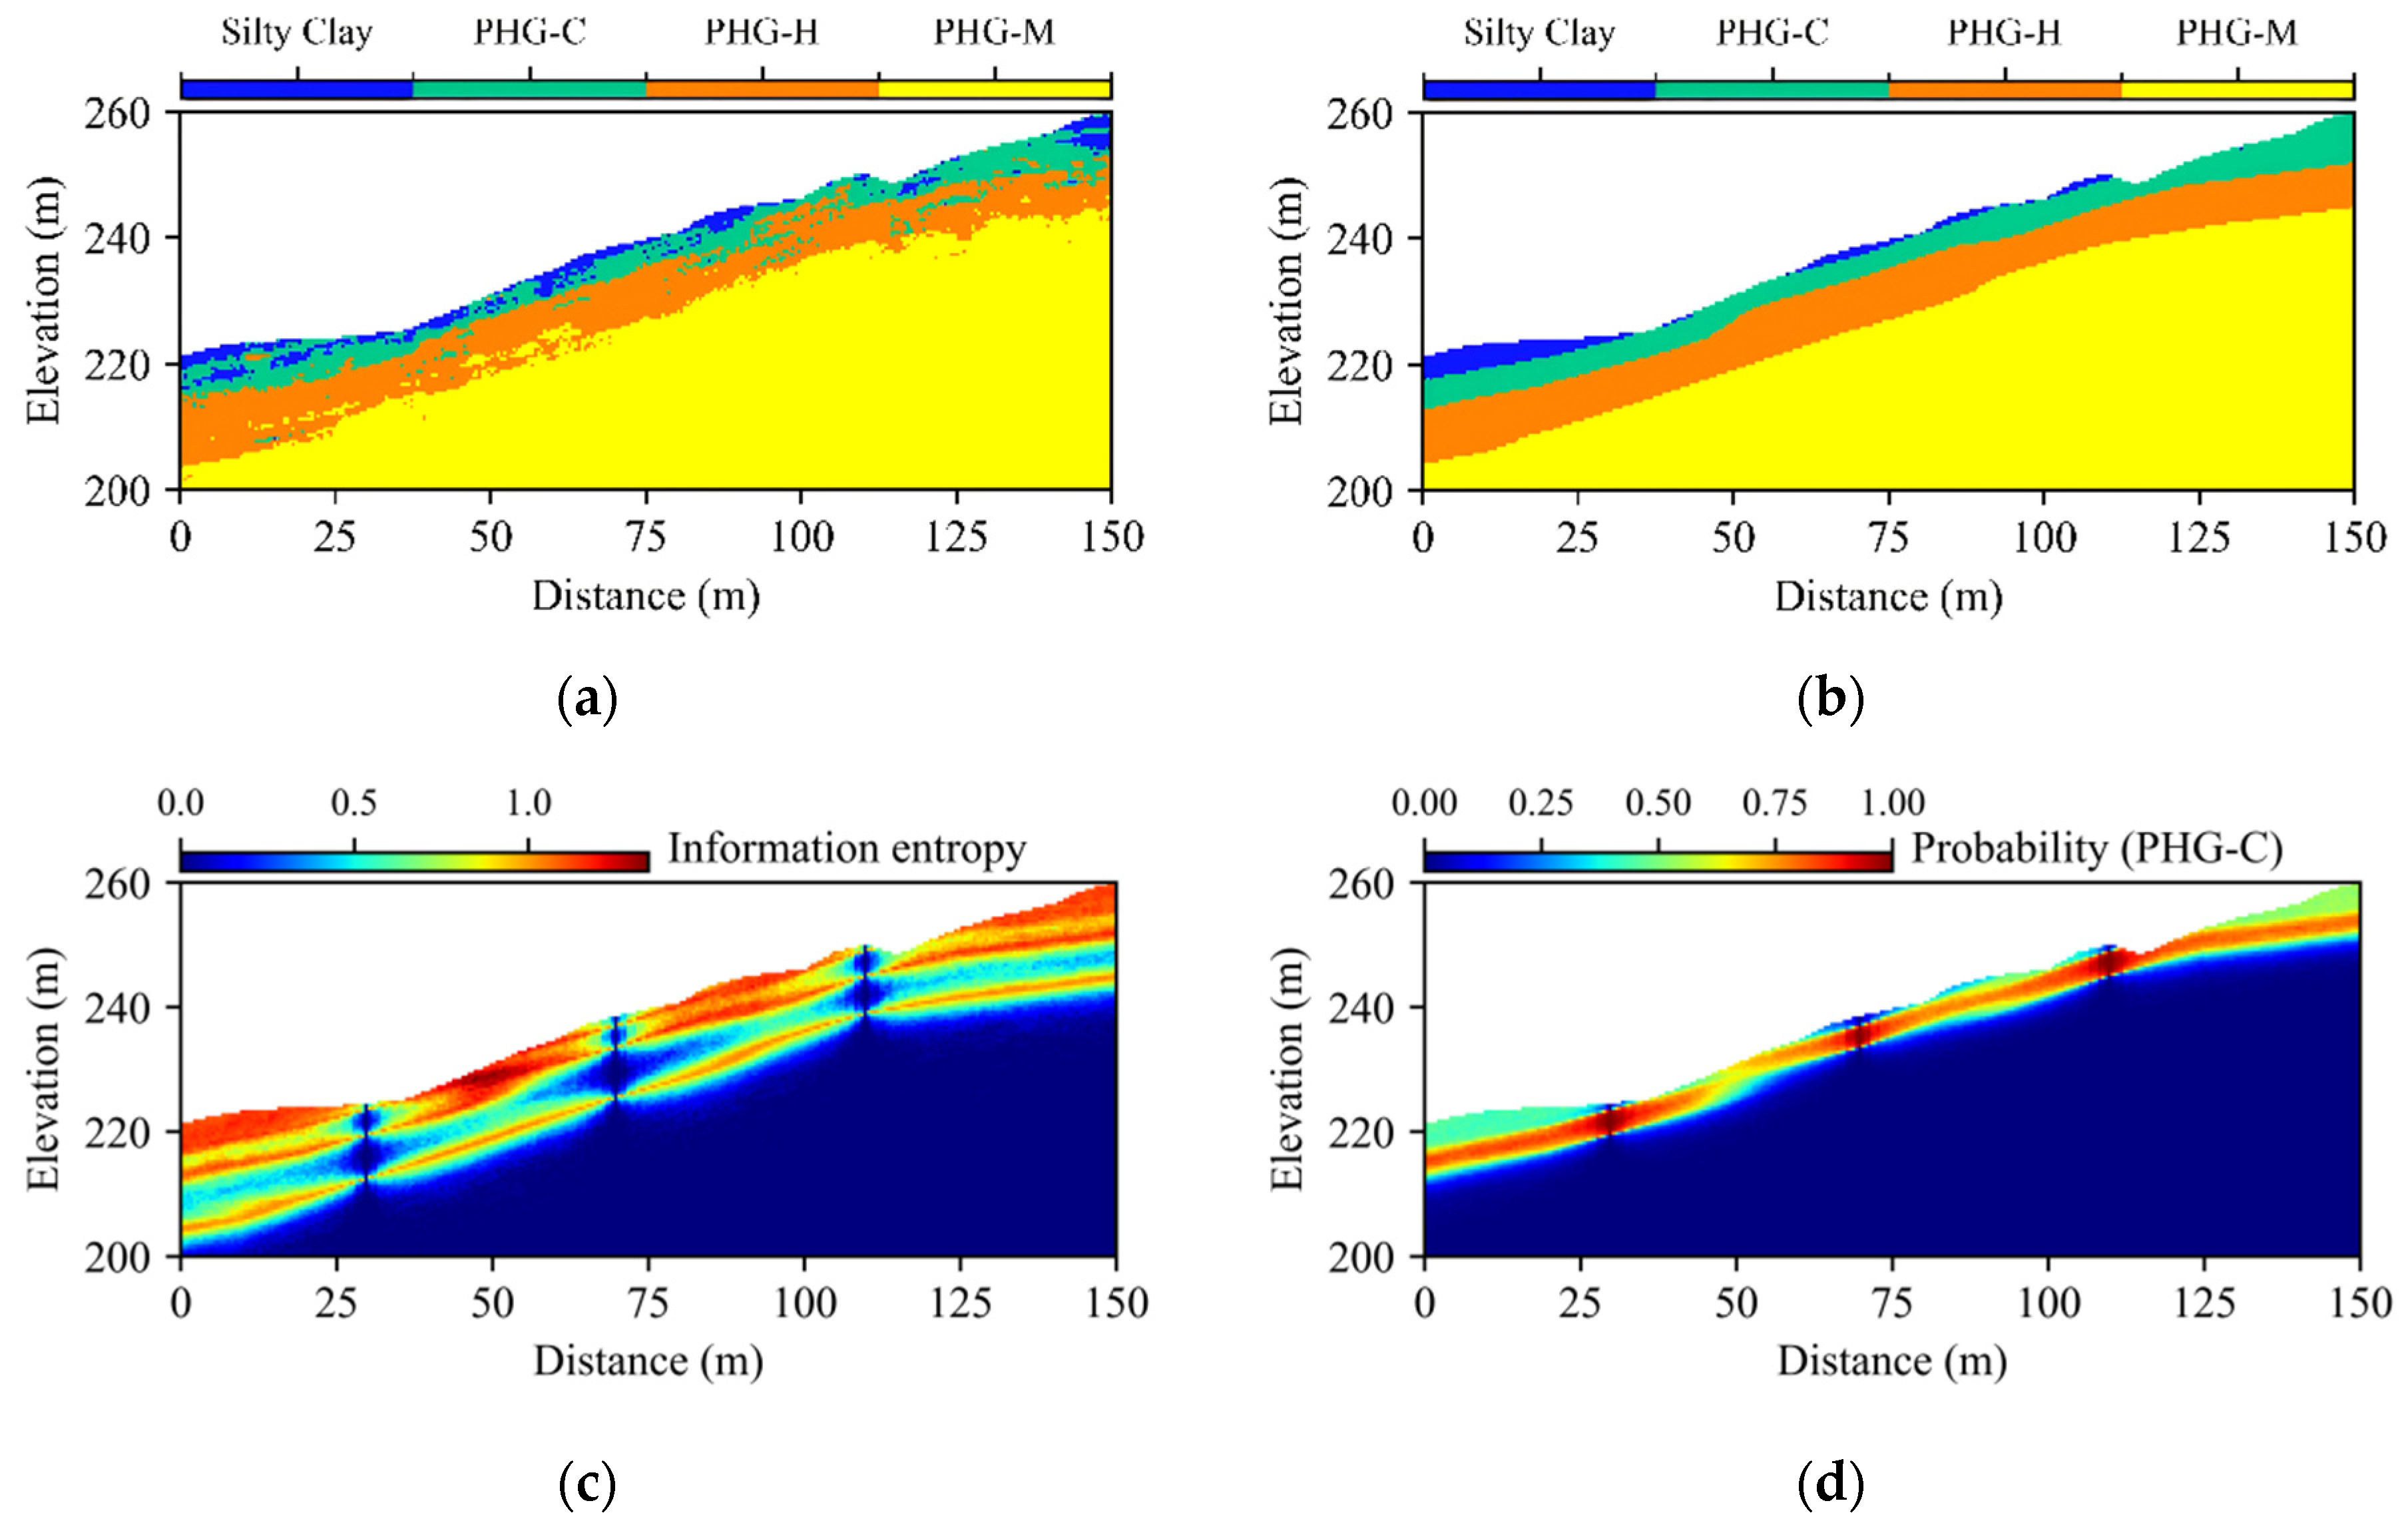
The comparison between the borehole-only case and the borehole and ERT case indicated that ERT data provide an important constraint on the stratigraphic distribution between boreholes. Borehole data provide direct lithological evidence, but the information is limited to discrete locations. When only borehole data were used, the stratigraphic interpretation between boreholes was mainly controlled by the assumed spatial correlation structure, which may lead to a wider range of possible layer boundaries. After ERT data were incorporated, the continuous resistivity field provided additional information on the lateral variation of weathered layers and lithological transition zones. As a result, the stratigraphic boundaries became more continuous, and the high entropy zones were mainly concentrated near the interfaces between adjacent strata.
The present study is built on previous work in probabilistic stratigraphic modeling. Methods such as Markov chain and random field models, conditional simulation, and random field approaches have been used to generate multiple possible stratigraphic realizations and to describe geological uncertainty under sparse site investigation conditions [
18,
19,
20,
21,
22,
23,
24,
25,
26]. However, many of these methods rely primarily on borehole data, and interpretations between boreholes are strongly affected by the assumed spatial correlation structure. In comparison, the present study incorporated ERT data as an additional continuous physical constraint, which helps improve the lateral continuity and geological plausibility of the predicted stratigraphic model.
This study is also related to landslide investigations using ERT, seismic methods, or other geophysical techniques. Previous studies have shown that geophysical data can identify internal structures, saturated zones, weathered rock interfaces, and potential sliding surfaces in landslide areas [
27,
28,
29,
30,
31,
32,
33,
34,
35]. However, many geophysical interpretations remain deterministic profiles. In this study, the ERT profile was not used alone to directly define the strata. Instead, it was combined with borehole labels and spatial prior information to generate probabilistic stratigraphic realizations. This approach quantified geological interpretation uncertainty rather than hiding it in a single interpreted section.
The probabilistic stability results showed that incorporating ERT data primarily affected the dispersion of the factor of safety rather than producing a large change in its mean value. In the borehole and ERT case, the mean factor of safety was 1.282, with a standard deviation of 0.044. In the borehole-only case, the mean factor of safety was 1.266, with a standard deviation of 0.113. The small difference in the mean value indicated that the overall stability level is similar in the two cases. However, the clear reduction in standard deviation indicated that the ERT constraint reduces the uncertainty in the stability results caused by uncertain stratigraphic interpretation.
Many probabilistic slope stability studies primarily consider the spatial variability of mechanical parameters, such as cohesion, friction angle, unit weight, elastic modulus, and permeability [
37,
38,
39,
40,
41,
42,
43,
44,
45,
46,
47,
48]. In these studies, the stratigraphic framework is often assumed fixed. However, for soil-rock landslides in weathered rock masses, the position and continuity of weak layers, weathered interfaces, and potential sliding zones can strongly control the failure mechanism. The present study therefore complemented existing probabilistic stability analyses by focusing on how stratigraphic uncertainty propagates into the distribution of the factor of safety.
From an engineering perspective, the proposed framework provides more information than a conventional deterministic stability analysis. A single factor of safety can indicate whether the landslide is stable under a given geological model, but it cannot express the confidence level of that model. The probabilistic results provided both the distribution of the factor of safety and the spatial distribution of stratigraphic uncertainty. The entropy map can help identify areas where the geological interpretation is less certain, such as layer interfaces, weathered rock boundaries, and possible weak zones. These areas may be prioritized for supplementary drilling, additional geophysical surveys, in situ testing, or monitoring layout. ERT data do not directly provide lithological categories. The resistivity response may be affected by lithology, water content, fracture development, clay content, and inversion quality. Therefore, ERT interpretation is nonunique and should not be used alone for stratigraphic classification. In this study, ERT data were used as continuous physical constraints, while borehole data provide direct lithological labels. The reliability of the final model depends on the consistency among drilling information, geophysical response, and engineering geological judgment.
The proposed borehole–geophysical data fusion framework shares a common objective with previous probabilistic stratigraphic modeling approaches, namely reducing geological uncertainty and improving subsurface characterization. Studies based solely on borehole data, such as stochastic random field and conditional simulation methods [
13,
64,
65], have demonstrated the importance of accounting for stratigraphic uncertainty, but their predictive capability is often limited in areas far from borehole locations. In contrast, geophysical-based investigations have shown that ERT can effectively identify subsurface structures and potential slip surfaces in landslide areas [
66,
67], although interpretation uncertainty remains significant because of the non-uniqueness of geophysical inversion. Compared with these approaches, the proposed method combines the strengths of both data sources. Borehole observations provide reliable geological constraints, while ERT data supply continuous spatial information between boreholes. By integrating these datasets through an SVM-based probabilistic framework, the resulting stratigraphic models exhibit improved spatial continuity and reduced uncertainty. The narrower distribution of the factor of safety obtained in this study further indicates that incorporating geophysical information can improve the robustness of landslide stability assessment. These findings are generally consistent with previous studies that highlighted the benefits of multi-source data integration for geological modeling and geotechnical reliability analysis.
Several limitations should be acknowledged. First, the analysis was performed on a two-dimensional section, whereas actual landslides commonly exhibit three-dimensional stratigraphic and hydrogeological characteristics. Second, the mechanical parameters of each stratum were treated as deterministic values, although their spatial variability may also affect stability predictions. Third, the uncertainty associated with the ERT inversion process was not explicitly incorporated into the analysis. Fourth, although the proposed framework was compared with previous studies on probabilistic stratigraphic modeling and geophysical investigations, the comparison was primarily qualitative. Quantitative evaluation against alternative approaches, such as borehole-only interpolation, Markov random field modeling, or conditional simulation methods, was beyond the scope of the present study. As a result, the extent to which ERT data improve stratigraphic characterization and stability assessment has not been quantified directly. Finally, the proposed framework was demonstrated using a single landslide with a relatively simple stratigraphic structure. Therefore, the calculated factor of safety and its associated variability are specific to this case and should not be generalized directly to other landslides. Additional validation is required for slopes with more complex lithological assemblages, stronger structural controls, complex groundwater conditions, or three-dimensional failure mechanisms.
Future work should extend the framework to three-dimensional probabilistic stratigraphic modeling and incorporate both stratigraphic uncertainty and mechanical parameter variability. For rainfall-induced landslides, transient seepage, pore-water pressure evolution, and water-induced strength degradation should also be considered. In addition, monitoring data such as displacement, rainfall, groundwater level, and pore pressure could be incorporated to update the stability assessment dynamically.
5. Conclusions
In this study, an integrated borehole–geophysical data fusion framework was developed to construct a probabilistic stratigraphic model and to propagate stratigraphic uncertainty into landslide stability evaluation. Borehole logs and electrical resistivity tomography (ERT) data were combined through an SVM-based geological–geophysical mapping, while a bootstrapping ensemble strategy was used to quantify interpretation uncertainty and generate multiple plausible stratigraphic realizations. These realizations were then mapped onto a predefined numerical grid and were analyzed individually using the strength reduction method implemented in FLAC3D. By repeatedly conducting deterministic stability analyses for a large number of realizations, a Monte Carlo-based simulation framework was employed to statistically sample stratigraphic uncertainty and derive the probability distribution of landslide stability indicators, including the factor of safety and its standard deviation. Based on these results, the following conclusions are drawn.
(1) The results show that incorporating geophysical constraints significantly improves the spatial coherence and geological plausibility of the inferred stratigraphic configurations. By providing continuous subsurface information between sparsely distributed boreholes, geophysical data constrain layer geometry, lateral continuity, and thickness variations, thereby localizing stratigraphic uncertainty mainly to geologically meaningful transition zones near layer interfaces. In contrast, stratigraphic models based solely on borehole data exhibit more dispersed and spatially diffuse uncertainty across large inter-borehole regions, highlighting the limited ability of point-scale observations to represent subsurface heterogeneity.
(2) Consistent with the improved stratigraphic modeling, the probabilistic stability analysis showed that incorporating geophysical data yielded a slightly higher mean factor of safety and, more importantly, a much narrower FoS distribution than in the borehole-only case. The reduced dispersion indicated that geophysical constraints effectively limit the propagation of stratigraphic uncertainty into landslide stability metrics, resulting in more concentrated and statistically stable estimates of landslide safety. The findings of this study should be interpreted within the scope of the Panzhuangzu Landslide case. The analysis was carried out along a two-dimensional section; the mechanical parameters were treated as deterministic values; and the uncertainty of ERT inversion was not explicitly considered. Therefore, the quantitative results should not be directly generalized to all landslides. Further studies are needed to validate the framework for landslides with different lithological assemblages, groundwater conditions, structural controls, and failure mechanisms.




 ,
,