Abstract
Indonesia experiences some of the world’s highest seismic activity, making earthquakes a major source of physical, economic, and social losses. To better quantify these impacts, this study proposes a comprehensive evaluation framework with two new metrics: the Seismic Severity Index (SSI) and the Seismic Impact Index (SII). The indices are derived using four weighting methods—Grey Relational Analysis (GRA), Equal Weights, the Entropy Weight Method (EWM), and Criteria Importance Through Intercriteria Correlation (CRITIC)—and applied to 28 regencies and municipalities affected by damaging earthquakes from 2016 to 2022. Results show that the 2018 earthquake, intensified by a tsunami and liquefaction, caused the most severe losses. Palu Municipality and Donggala Regency consistently recorded high SSI values across all weighting schemes. The SII further identifies Sigi Regency, Donggala Regency, and Palu Municipality as the most heavily impacted areas, although rankings varied by method. Overall, Sigi Regency, Palu City, Donggala Regency, North Lombok, West Lombok and Cianjur exhibit the highest combined severity and impact, while Garut, Ciamis, and Cilacap experienced relatively minor effects. The study concludes that integrating GRA with EWM and CRITIC yields a robust earthquake loss index to support future disaster risk reduction policies.
1. Introduction
Earthquakes are devastating natural disasters that cause significant economic losses, physical damage, casualties, and regional economic disruption [1,2,3,4]. Between 2004 and 2023, EM-DAT data show that earthquakes were responsible for 56.24% of all natural disaster-related deaths, resulting annually in an average of 36.88 million fatalities, 6.8 million people affected, and US$43.5 billion in economic losses [5]. Increased earthquake losses are determined not only by ground shaking intensity and the level of building structure exposure. However, they are also significantly influenced by geotechnical hazards such as liquefaction, lateral spreading, and soil amplification [6,7]. These processes can cause severe soil deformation, resulting in significant damage to buildings, vital infrastructure networks, and underground infrastructure systems, while also hindering post-disaster recovery efforts [6]. Given these profound impacts, accurate earthquake disaster loss measurement is fundamental for effective disaster risk management, guiding mitigation priorities, resource allocation, and recovery strategies [8,9].
The Sendai Framework for Disaster Risk Reduction (SFDRR) 2015–2030 underscores the importance of collecting comprehensive and comparable loss data to improve accountability and efficacy of DRR policies [10,11]. It includes four key targets (A, B, C, D) that mandate the reporting of disaster loss data, covering fatalities, affected populations, economic losses relative to GDP, and damage to critical infrastructure, particularly health and education facilities [11]. While estimating both direct and indirect economic losses is crucial for understanding vulnerabilities and designing sustainable reconstruction efforts [12], current loss measurement often falls short by focusing solely on direct economic losses or physical damage, thus failing to capture the full complexity of earthquake impacts on regional systems.
Indonesia’s location on the Pacific Ring of Fire, where the Eurasian, Indo-Australian, and Pacific tectonic plates converge, makes it exceptionally vulnerable to earthquakes [13,14,15]. The subduction processes between these plates not only triggers high seismic activity but also form a chain of active volcanoes scattered throughout Indonesia. The presence of 129 active volcanoes further contributes to its high seismic and volcanic activity, making it one of the world’s most earthquake-prone nations [14,16].
High volcanic activity can trigger various secondary disasters, such as volcanic earthquakes, pyroclastic flows, volcanic landslides, and tsunamis. One example is the 2018 Anak Krakatau event, when the partial collapse of the volcano and the resulting debris flow triggered a tsunami in the Sunda Strait, causing widespread damage and loss of life along the coasts of Banten and Lampung, despite the absence of a major tectonic earthquake [17]. This event demonstrates that tectonic and volcanic dynamics in Indonesia are interrelated and collectively contribute to the high risk of geological disasters in this region.
Previous research has explored composite index-based methods for disaster loss assessment [18,19,20,21]. For instance, Zhao et al. (2024) developed Disaster Severity and Impact Indices for Shanghai using AHP and EWM [21]. However, these studies often lack direct comparisons with nonparametric methods like grey Relational Analysis (GRA) and rarely develop earthquake-specific loss indices. This highlights a gap in understanding how methodological choices influence loss measurement and the ranking of affected areas, particularly as most prior disaster loss indices were developed at the national level with limited comparative analyses.
Significant gaps persist in the literature. Firstly, there is a lack of integration between objective weighting methods like Entropy and CRITIC, which could provide more stable and representative weights. Secondly, the application of grey Relational Analysis (GRA) to earthquake losses, especially in developing countries such as Indonesia, remains rare despite its suitability for systems with limited data and high uncertainty. Thirdly, Indonesian research often prioritizes risk and exposure analysis over comprehensive, multi-indicator loss measurement. Previous studies suggest that GRA can enhance the accuracy of identifying key factors in earthquake losses [22]. Thus, a more integrated and context-specific approach is urgently needed.
To address these limitations, this study distinguishes between measures of the absolute and relative impacts of earthquakes. Previous approaches to disaster loss assessment have generally relied on absolute indicators such as the number of fatalities or total economic losses. However, such measures tend to be biased toward regions with large populations or high economic capacity. Therefore, this study integrates normalized indicators, such as impact per capita and economic losses relative to Regional Gross Domestic Product (RGDP), to represent the burden of disasters more proportionally.
Based on this approach, this study proposes two indices: the Seismic Severity Index (SSI) and the Seismic Impact Index (SII). SSI represents the total human, physical, and economic losses in absolute terms. At the same time, SII describes the relative impact by considering the region’s population size and economic capacity. This index framework enables more relevant analysis for decision-making, particularly in identifying regions that bear a disproportionate disaster burden.
Therefore, this study aims to address these gaps by developing an Earthquake Loss Index, comprising the Seismic Severity Index (SSI) and the Seismic Impact Index (SII), at the district/city level. This is achieved by integrating grey Relational Analysis (GRA) with the Entropy–CRITIC objective weighting method to create a comprehensive and robust measure of earthquake-induced losses. Methodologically, this research will illuminate the strengths and limitations of GRA compared to conventional composite index approaches in disaster loss assessment. Empirically, it will offer a more sensitive, spatially explicit mapping of earthquake losses by capturing regional heterogeneity, thereby informing more targeted, evidence-based policies for disaster risk reduction, mitigation, recovery, and post-disaster reconstruction. The development of this Earthquake Loss Index and the innovative integration of GRA with Entropy-CRITIC promise to significantly advance loss assessment practices for researchers and practitioners alike.
This article is structured into several sections: an introduction outlining the background, problems, and objectives; a literature review on disaster loss measurement and GRA; a methodology section detailing indicator construction and the integration of Entropy, CRITIC, and GRA, along with scope and limitations; an empirical analysis of earthquake loss levels in Indonesia, including a discussion of spatial patterns and influencing factors; and finally, a conclusion summarizing findings and offering strategic recommendations for earthquake risk reduction in Indonesia.
2. Literature Review
Earthquake disasters are one of the largest sources of losses in disaster risk studies due to their sudden nature and potential impact on socioeconomic systems. Various approaches have been developed to assess earthquake losses, including earthquake disaster loss assessments [3,23], impact modeling [24,25], and seismic risk analysis [26], all of which contribute to a better understanding of potential impacts. These approaches focus on absolute indicators such as fatalities, physical damage, and economic losses [3,23]. However, the use of absolute indicators alone is often insufficient to represent the relative pressure on a region’s capacity, particularly socioeconomic disparities between regions.
In response to these limitations, composite index-based approaches have emerged to integrate various dimensions of loss more systematically. Multi-indicator indices allow for the combination of human, physical, and economic dimensions into a single measure, thereby enhancing comparability across regions and the ability to capture variations in impacts that are not apparent in single indicators. Previous studies, such as Zhao et al. [21], emphasize the importance of distinguishing between severity (the level of hazard severity) and impact (the realization of the impact), given that losses are determined not only by hazard intensity but also by regional exposure and mitigation capacity.
Recent literature also indicates that seismic hazards do not influence disaster losses not only directly, but also through geotechnical and multi-hazard processes. Indonesia’s location on the Pacific Ring of Fire means that high seismic activity goes hand in hand with high volcanic activity [17]. Processes such as liquefaction, landslides, ground deformation, and volcanic collapse can significantly amplify the impact of losses. The 2018 event at Anak Krakatau demonstrated that a tsunami can be triggered by volcanic collapse without being preceded by a major earthquake, with a collapse volume of approximately 0.2–0.3 km3 capable of reproducing the observed tsunami characteristics. This finding confirms that non-seismic mechanisms also contribute to loss indicators such as fatalities, displacement, and economic losses.
From a methodological perspective, various multi-criteria decision analysis (MCDA) approaches have been used to measure disaster losses, including AHP, TOPSIS, PROMETHEE, GRA, and composite indices [18,21,27,28]. Among these methods, Grey Relational Analysis (GRA) is employed due to its ability to analyze systems with limited, heterogeneous data and nonlinear relationships. Based on grey system theory, GRA does not require specific distribution assumptions and allows for the evaluation of relational proximity between indicators through the concept of relational grade [2,29,30,31]. Therefore, this method is considered relevant for the context of disaster data, which is often incomplete and has a high degree of uncertainty.
Nevertheless, research on disaster loss indices remains dominated by studies of regions or countries with relatively good data availability, while its application in developing countries with high geographical complexity, such as Indonesia, remains limited. Furthermore, the conceptual distinction between hazard severity and loss impacts at the subnational level has not been extensively explored in the existing literature.
3. Materials and Methods
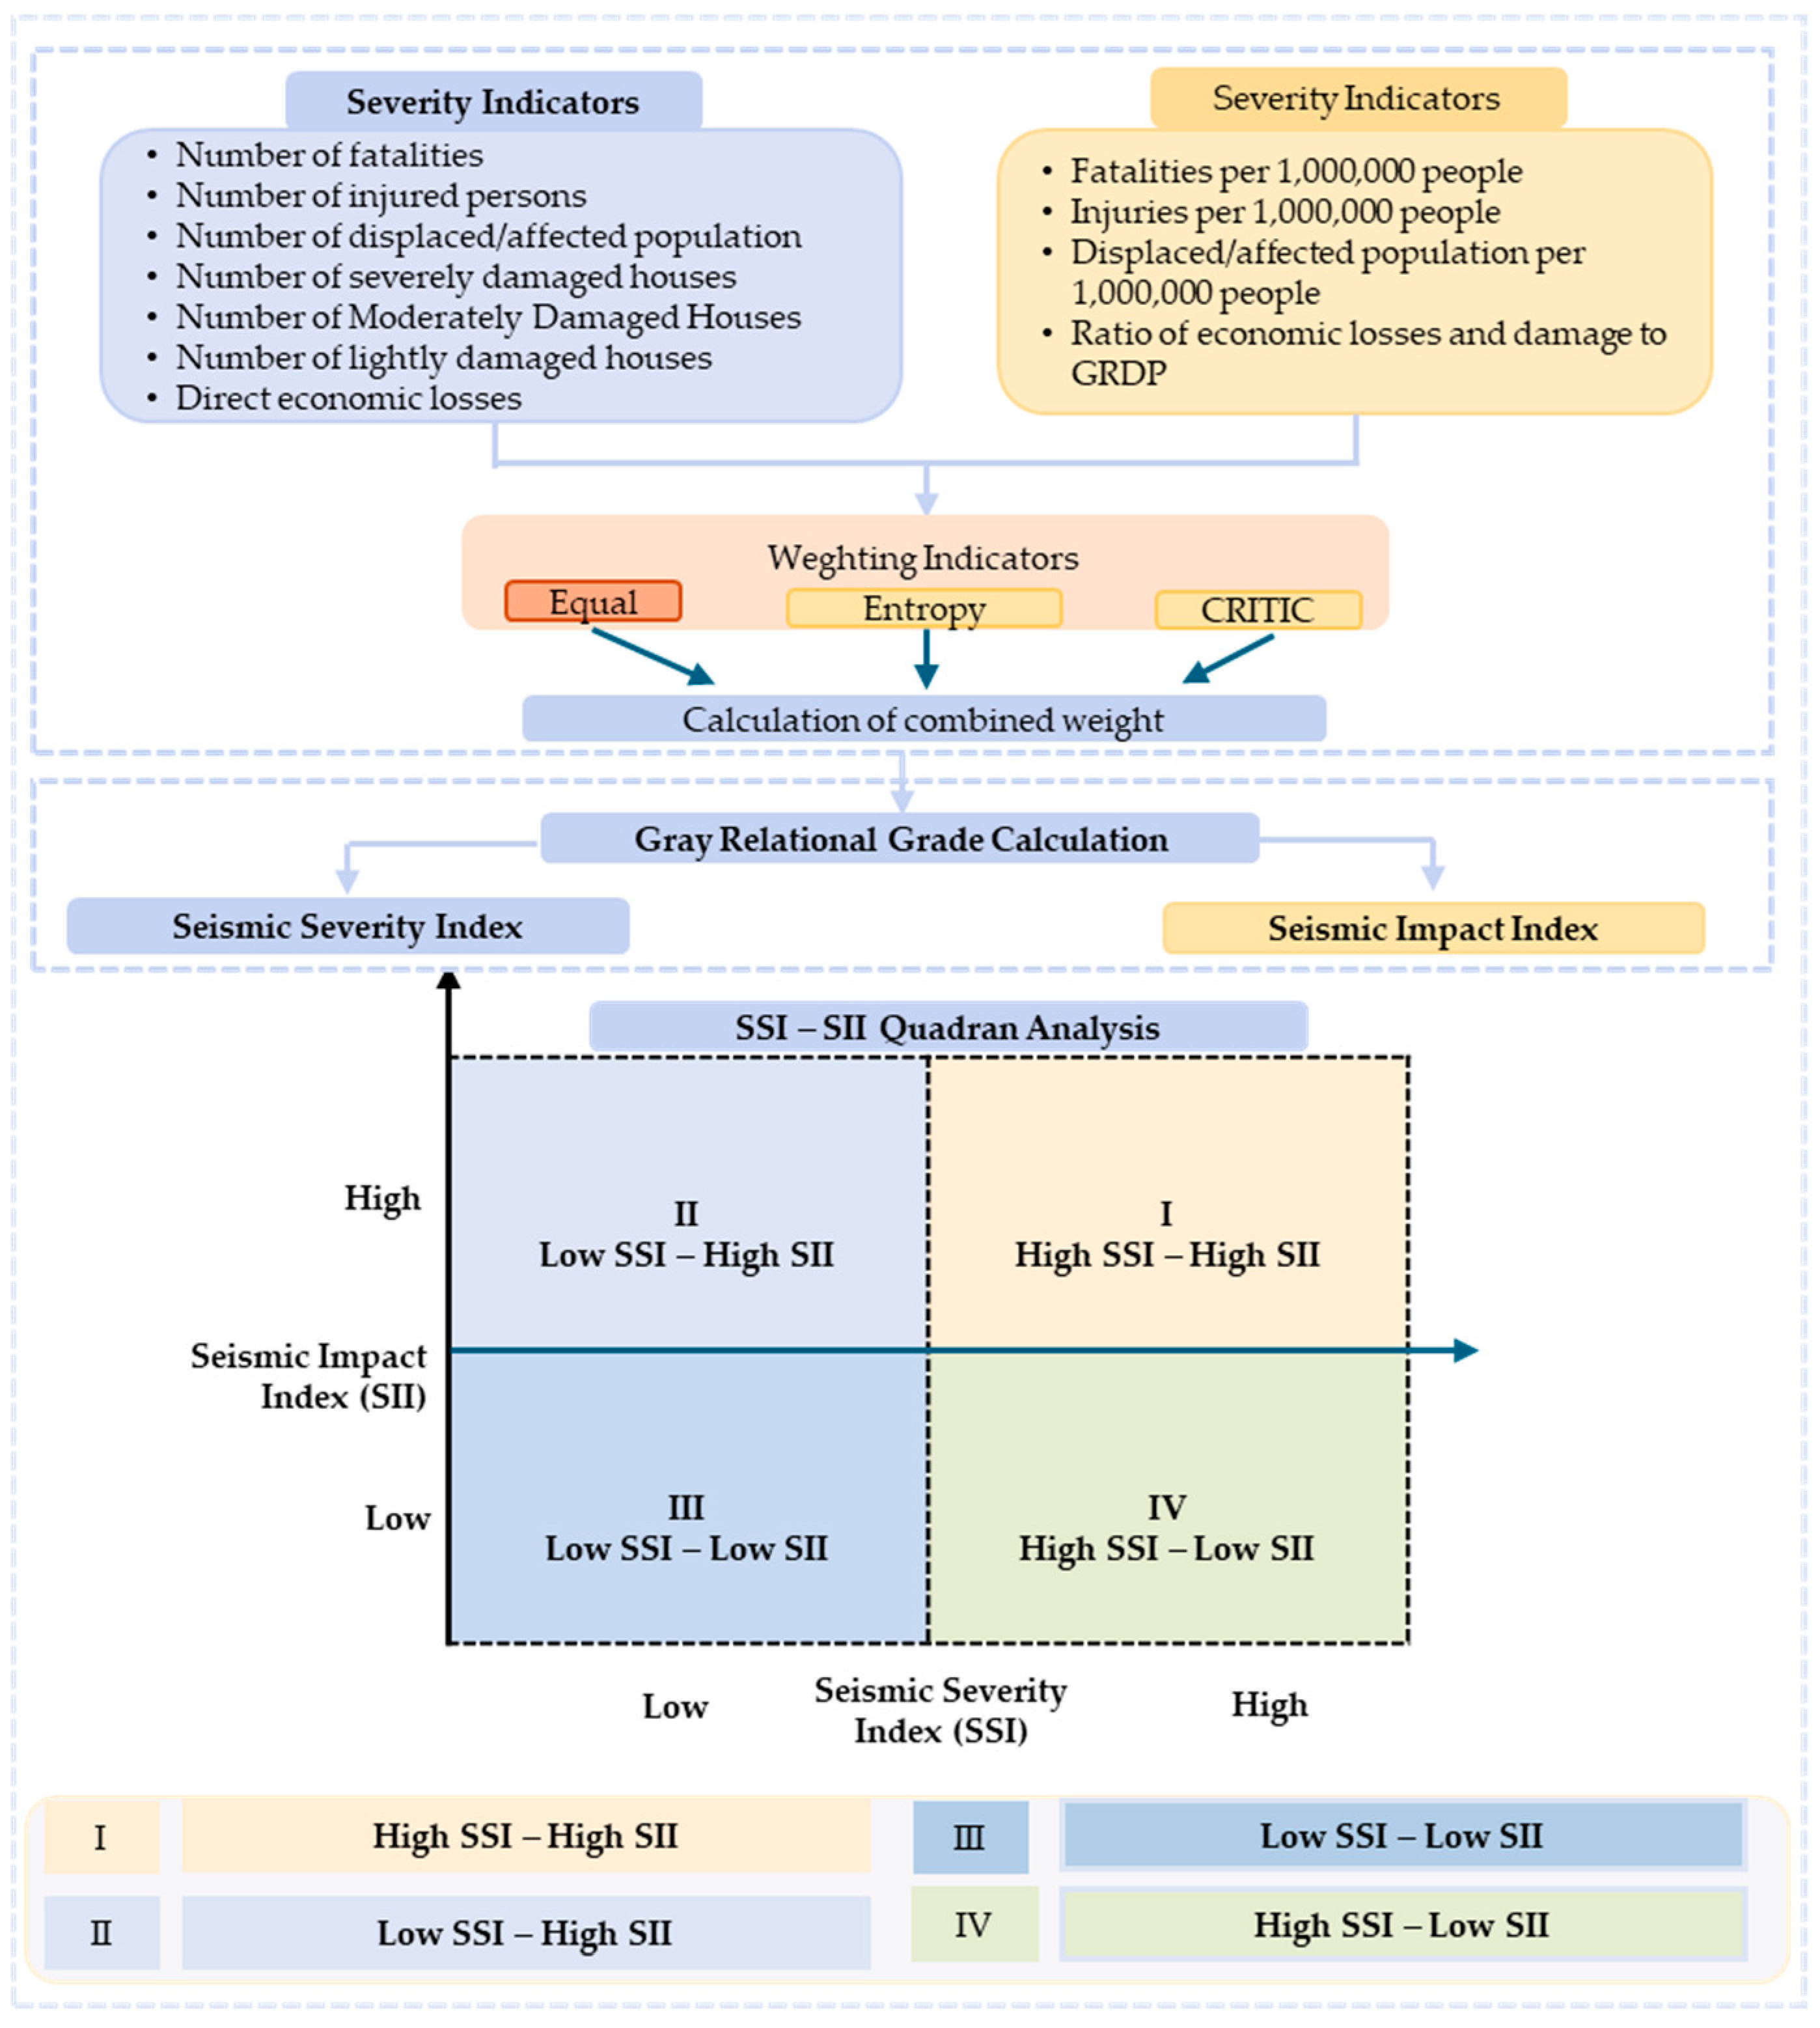
In this study, we introduce a comprehensive framework for earthquake loss assessment that enables comparison of losses across districts and cities. The approach focuses on evaluating how earthquake losses are distributed among administrative regions to reveal patterns of inequality in disaster impacts. It combines the Seismic Severity Index (SSI), which measures absolute losses, with the Seismic Impact Index (SII), which captures the relative impact on regional capacity. Together, these indices provide a deeper understanding of spatial variations in earthquake severity and consequences, as illustrated in Figure 1.
Figure 1.
Methodological framework. SSI denotes the Seismic Severity Index, and SII denotes the Seismic Impact Index.
3.1. Data
The unit of analysis in this study is districts and cities that experienced damaging earthquakes between 2016 and 2022. This period was selected based on data completeness and consistency in reporting damage and loss values resulting from disasters, as documented in the Post-Disaster Rehabilitation and Reconstruction Plans (RRRP) submitted by local governments at the district/city levels and published by the National Disaster Management Agency (BNPB). Earlier events were excluded due to incomplete variable availability, while more recent events fell outside the final dataset used in this analysis. Based on these criteria, 28 districts and municipalities across 15 provinces were selected. The data in this study consists of event-based cross-sectional data, where each observation represents the impact of an earthquake on a specific region during a particular event, and thus does not form panel data or a time series. Furthermore, for regions that experienced multiple destructive earthquakes during the 2016–2022 period, such as the 2018 Lombok Earthquake and the 2028 Palu Earthquake, disaster losses were aggregated using a cumulative event-based approach based on official BNPB reports.
The earthquake loss index comprises two components: the Seismic Severity Index (SSI) and the Seismic Impact Index (SII), which together characterize earthquake-related losses. The SSI captures the absolute losses caused by an earthquake, whereas the SII measures losses relative to local capacity and exposure, normalized by population and economic size. Accordingly, the SSI represents the absolute intensity and outcomes of the earthquake, while the SII indicates the level of stress and relative vulnerability of the affected area. Integrating both indices offers a more holistic and quantifiable basis for evaluating earthquake losses.
The construction of the earthquake severity and impact indices follows an approach consistent with Zhao et al. [21] and draws on key indicators developed by Zhao et al. [21], Li et al. [18], Miao et al. [32], and Haoying et al. [2]. The indicators used in this study focus on the direct impacts of disasters, including deaths, injuries, affected populations, housing damage, and direct economic losses. This study did not explicitly include indirect losses and infrastructure disruptions due to limitations in data availability and consistency across the study areas. Nevertheless, researchers widely use these direct loss indicators in the disaster literature as key proxies for assessing earthquake impacts.
Indicators were selected for their relevance to earthquake impact assessment, availability at the district/city level, and demonstrated effectiveness in previous research. The selection process involved two stages. First, a literature review was conducted on the measurement of earthquake severity and impact indices, including the studies by Zhao et al. [21], Li et al. [18], Miao et al. [32], and Haoying et al. [2]. Second, the indicators were adapted to the Indonesian context and to the availability of subnational data in publications from the Central Statistics Agency (BPS) and the National Agency for Disaster Countermeasure (BNPB). In total, 7 indicators were used to calculate the SSI and 4 indicators to construct the SII, along with their directions of influence, as presented in Table 1.
Table 1.
Seismic Loss Index Indicators.
3.2. Analysis Method
This study employs a Multi-Criteria Decision-Making (MCDM) approach based on grey system theory, originally proposed by Deng Julong in 1982 [33]. This approach is designed to evaluate relationships among factors in systems characterized by limited or incomplete information [2]. The analysis integrates Grey Relational Analysis (GRA) with the Entropy–CRITIC weighting technique. GRA is used to measure and compare earthquake losses across Indonesian districts/cities affected by earthquakes during 2016–2022 and to identify key factors influencing the Seismic Loss Index (SLI) based on geometric correspondence among indicators. A grey relational grade (GRG) for an SLI indicator greater than 0.5 denotes a close correlation, while a GRG exceeding 0.7 indicates a significant influence on the SLI [34].
Compared with regression analysis, analysis of variance, and principal component analysis [31], GRA offers several advantages. It performs well with small sample sizes, a common limitation in earthquake research, while still producing quantitative correlation results that are generally consistent with qualitative assessments. Moreover, it does not require assumptions of normal data distribution or long observation periods, can accommodate grey (incomplete) values, and yields reliable and robust outcomes [2,29,30,31]. GRA is therefore selected for this study due to the limited information on earthquake characteristics and impacts, making it particularly suitable for deriving robust loss estimates.
The steps in the GRA method are as follows.
- Step 1. Create the initial matrix
The GRA calculation begins by creating a decision matrix where represents the districts and cities affected by the earthquake (m = 28), and represents the seven determining attributes of earthquake losses: the earthquake severity index (n = 7) and four indicators for the earthquake impact index (n = 4). Each matrix cell (xij) is represented as a vector xi = (xi1, xi2, …, xij, …, xin), where xij indicates the value of earthquake disaster losses for the i district or city for the j criterion. The form of the xij matrix is as follows:
- Step 2. Grey relational generating calculation
In Grey Relational Analysis (GRA), if the measurement units differ across attributes, the influence of some attributes may be overlooked during analysis. A similar situation can also occur when an attribute with a very large value range dominates others. In addition, if the objectives and directions of these attributes differ, this can lead to inaccurate analysis results [35]. Therefore, before the calculation process, it is necessary to standardize all indicators to a uniform scale and enable objective comparison [30,36,37]. This process is called grey relational generating in the GRA method. This process transforms the original sequence (xij) and produces a value (yij) in each district/city (i) for each attribute (j) in the form of a comparable sequence (yij) whose values range from 0 to 1. In this study, the indicator standardization process uses the range conversion method proposed by Deng Julong (1985) [31] and used by Bonnet et al. [38], Kuo et al. [35], Liu et al. [37], Tang et al. [39] and Rahma et al. [40].
where yij is the normalized value, xij is the original value, max xij is the maximum value of the index and min xij is the minimum value of the index. Calculation of the maximum and minimum values of data on each attribute using the minimum and maximum values of 28 districts/cities that experienced earthquakes in Indonesia in the period 2016 to 2022. Based on the grey relational generating calculation, the following matrix:
- Step 3. Deviation sequence calculation
The deviation sequence is used to measure the absolute difference between a series and a reference series. It is calculated using the following formula:
where ∆ij is deviation sequence, y0j is reference sequence, and yij is comparability sequence. At this stage, all indicators will be converted to a scale between 0 and 1. This process aims to facilitate comparison between alternatives by means of normalization.
- Step 4. Grey relational coefficient calculation
The grey relational coefficient is useful for determining how close the yij value of each district/city in the comparable sequence is to the y0j value of the district/city in the reference sequence, and it ranges from 0 to 1. The greater the grey relational coefficient value of a district/city, the closer the district/city is to its ideal value. The calculation of the grey relational coefficient generally uses the distinguishing coefficient (), which functions to adjust the range of values in the grey relational matrix. The value of the distinguishing coefficient ranges from 0.1 to 1.0 and is expected to yield a variety of results without altering the relative differences between the alternative and ideal designs [41]. This study uses a distinguishing coefficient of 0.5, while other values in that range are used in the sensitivity analysis to ensure consistency in the computational process.
Grey relational coefficient can be calculated with Equation (6) [41,42,43].
where is grey relational coefficient between yij and y0j, , , and is distinguishing coefficient, ζ ϵ [0, 5].
- Step 5. Indicator weight calculation
The weight assigned to each indicator represents its relative importance in the evaluation, underscoring its significance for the audience and reinforcing the value of their contribution. These weights are obtained by integrating three methods: Equal Weight (EW), the Entropy Weight Method (EWM), and Criteria Importance Through Intercriteria Correlation (CRITIC). In the EW approach, all indicators receive the same weight, thereby avoiding subjectivity and providing a baseline for comparison. In contrast, the EWM objectively determines the relative weight of each earthquake loss indicator based on the diversity of information in the data. Prior to computing the EWM, a decision matrix is constructed [44], as expressed in Equation (7):
The Xij value represents the performance of the i alternative against the j criterion. In the matrix, the rows indicate the districts/cities affected by the earthquake, and the columns indicate the natural disaster loss indicators. The EWM procedure consists of the following steps [44,45]:
- Normalization of the decision matrix
At this stage, the value of each indicator is normalized to obtain a value in the range 0–1, using Equation (8).
The value of Pij represents the normalized form of Xij. Normalized decision matrix , after the normalization process, is shown in Equation (9).
- 2.
- Calculation of entropyThe entropy value for each indicator is calculated using Equation (10):where k is a constant with the value:
This constant ensures that . The entropy value reflects the amount of information contained in a criterion. A lower entropy value indicates that the criterion is more important in the decision-making process.
- 3.
- Calculation of divergence degree
The divergence degree () is calculated to describe the level of information contrast for each criterion using Equation (12).
The larger the value, the more important the criterion is in differentiating alternatives.
- 4.
- Entropy weight calculation
The final step of the EWM is to determine the criterion weights () based on the divergence values using Equation (13).
The value indicates the relative weight of each criterion, provided that the sum of all weights equals one.
To derive more objective indicator weights for the Seismic Loss Index, this study also applies the CRITIC (Criteria Importance Through Intercriteria Correlation) method developed by Diakoulaki et al. [46]. This method determines indicator weights using two key elements: data variability, measured by the standard deviation, and the degree of conflict between indicators, measured by the correlation coefficient. Consequently, indicators that exhibit high variability and low correlation with other indicators receive greater weights, as they contribute more significant information to the evaluation process.
The procedural framework for the CRITIC methodology, as outlined by Abirami and Das [47], Gao et al. [48], Krishnan et al. [49], and Razzaq et al. [50], is detailed as follows.
- The decision matrix X = [Xij] is constructed.
- Normalize the decision matrix, as in Equations (2) and (3).
- Calculate the standard deviation of each indicator to measure the level of data variation. The standard deviation is calculated using Equation (14).where is the standard deviation of indicator j, yij is the normalized indicator value, is the average of indicator j, and m is the number of districts/cities.
- 4.
- Determine the correlation coefficient for the attribute using Equation (15)where ρjk is the correlation coefficient between indicators j and k
- 5.
- Accumulate the information for each attribute by using Equation (16)
The higher the cj value, the greater the amount of information the criterion provides. This suggests that the criterion possesses a greater capacity to distinguish earthquake losses among the indicators. Consequently, indicators with higher cj values will be considered more significant and assigned higher weights in the evaluation process than those with lower information values.
- 6.
- Calculation of objective weights
At this stage, Equation (17) is used to determine the final weight for each indicator. These weights represent the relative importance of each indicator in assessing earthquake losses and are the goal of applying this weighting method. Thus, the calculation results at this stage yield the weights used in the GRA.
To obtain more stable and representative final weights, this study combines the three weights using Harmonic Means (HM), which imposes a strong penalty on any low values [51]. Unlike the arithmetic mean, which is susceptible to the compensation effect—where high values from one method can mask the weaknesses of others—the harmonic mean ensures that the contribution of each weighting method remains balanced in the final score [51]. This approach produces a more comprehensive and robust weighting scheme to support the calculation of the Seismic Severity Index (SSI) and the Seismic Impact Index (SII).
The first step involves aggregating the weight calculations for each indicator from the three weighting methods, as shown in Equation (18).
where Wi is the combined weight for each indicator, WEM is the equal weight, WEWM is the entropy weight method, and WCRITIC is the CRITIC weight; n is the number of weighting methods. Furthermore, to ensure consistency and comparability among indicators, the weights of the aggregated results are normalized so that the total weight equals one, as shown in Equation (19).
This approach allows for a more balanced integration of subjective and objective methods, while maintaining sensitivity to indicators with low performance, thereby yielding more representative and stable composite weights.
- Step 6. Grey relational grade
The sixth step in the GRA calculation is to compute the Grey relational grade (GRG). The GRG is a key metric for objectively identifying which districts or cities are most severely affected by earthquakes, thereby supporting targeted response strategies. It is obtained as the weighted sum of the Grey relational coefficients (GRCs) for all attributes in each district or city and reflects the relative closeness between each comparison sequence and the reference sequence [31]. A higher GRG value indicates a stronger correlation with the reference sequence. The GRG is calculated using Equation (20), providing a clear and systematic measure of impact.
The criterion weight value (wj) in the GRG calculation is obtained from the criterion weight value () in step 4, namely, equal weight (EW), entropy weight method (EWM) or CRITIC. The value of or GRG is used to rank districts/cities, illustrating how your analysis directly influences disaster assessment. The greater the value of or GRG, the greater the losses in the region due to the earthquake. In other words, the district/city with the highest GRG value is the region most affected by the earthquake disaster. With this approach, Grey Relational Analysis (GRA) enables the selection of districts/cities with the greatest earthquake-related disaster losses, underscoring the importance of your work in disaster management efforts. Data processing and statistical analyses in this study were conducted using Microsoft Excel 365 (Microsoft Corporation, Redmond, WA, USA) and IBM SPSS Statistics software 31.0.2.

4. Results and Discussion
4.1. Indicator Weight Structure
Table 2 compares the three weighting schemes—equal weight, EWM, and CRITIC—and reveals substantial differences in how indicators contribute to the index. Under equal weighting, all indicators are assumed to contribute identically, making this a normative approach that ignores empirical variation in the data. While it offers a neutral reference point, it may oversimplify the earthquake loss system. By contrast, the EWM and CRITIC methods produce markedly different indicator contribution structures, especially in constructing the Seismic Severity Index (SSI). Using EWM, the number of fatalities receives the highest weight (0.2307), followed by damage and loss values (0.1729) and the number of severely damaged houses (0.1504). The indicators for the number of affected residents (0.1050) and the number of injured (0.1062) received relatively lower weights, indicating a smaller informational contribution in distinguishing the level of impact across regions.
Table 2.
Indicator Weight Structure.
Meanwhile, the CRITIC method, which accounts for data variability and correlations among indicators, reveals a different weighting pattern. The indicator for the number of slightly damaged houses receives the highest weight (0.1792), followed by the number of affected residents (0.1733) and the number of fatalities (0.1663). On the other hand, the indicators for the number of injured victims (0.0943) and moderately damaged houses (0.0861) have lower weights. This difference indicates that the CRITIC method places greater emphasis on indicators that have a high level of contrast and low redundancy with other indicators.
Meanwhile, the weighting values for the Seismic Impact Index (SII) indicators are relatively similar across the two methods. In both, the number of deaths per 1,000,000 people receives the highest weight. However, the weight assigned to the number of displaced persons per 1,000,000 population differs substantially, rising sharply under the CRITIC method (0.3548) compared to the Entropy method (0.2013). This suggests that, in terms of inter-indicator conflict, the displaced persons variable plays a more prominent role in explaining the impact than the other indicators.
Table 2 also provides the aggregated weights (AWs) derived from combining the Equal Weight (EW), Entropy Weight Method (EWM), and CRITIC approaches. It shows that the fatality indicator is the main driver of both the Seismic Severity Index (SSI) and the Seismic Impact Index (SII). Its dominance (SSI = 0.1777; SII = 0.3239) underscores that loss of life is the most critical dimension of earthquake impact. From a vulnerability–resilience perspective, fatalities capture not only hazard intensity but also social vulnerability and adaptive capacity. Regions with high fatality rates typically have insufficient earthquake-resistant infrastructure, limited access to emergency services, lower housing quality, and weaker community preparedness.
4.2. Seismic Loss Index
4.2.1. Seismic Severity Index
The seismic severity index (SSI) results derived from the three weighting methods are summarized in Table 3. Overall, the methods yield broadly consistent spatial patterns in identifying areas with the highest earthquake severity, although minor differences appear in the absolute index values and ranking positions. In all cases, Palu City ranks first, with SSI values of 0.6738 (equal weights), 0.7217 (entropy), and 0.6628 (CRITIC). This consistently high ranking reflects the extreme damage caused by the 2018 Central Sulawesi earthquake and tsunami, which was accompanied by extensive liquefaction. The elevated index values capture the combined effects of high mortality, widespread infrastructure destruction, and substantial economic losses.
Table 3.
Seismic Severity Index in Indonesia based on Equal Weight, Entropy and CRITIC.
Donggala Regency occupies the second position across all weighting methods. Its proximity to the Palu–Koro earthquake epicenter resulted in intense ground shaking, severe structural damage, and additional impacts from tsunami inundation along several coastal areas. The next tier of high-severity areas includes Cianjur Regency, West Lombok Regency, North Lombok Regency, and Sigi Regency, all of which register relatively high SSI values for the three methods. The high indices in West and North Lombok are associated with the 2018 Lombok earthquake, which caused extensive damage to residential buildings and public facilities. Cianjur Regency’s elevated severity reflects the substantial destruction from the 2022 earthquake, driven by local geological conditions and the vulnerability of building stock.
Sigi Regency is also categorized as a higher-severity region. Its high SSI is largely attributable to severe liquefaction, which led to widespread residential damage. These findings are consistent with those of Yew et al. [52], who reported that the 2018 Sulawesi earthquake and tsunami were highly destructive, with impacts that exceeded local coping capacity. A high severity index in this context signals the need for rapid emergency response and external support for post-disaster recovery [52].
By contrast, regions such as Lebak, Tasikmalaya Municipality, Poso, Cilacap, Pangandaran, and Garut show lower SSI values and occupy the lower ranks. While these areas have experienced significant earthquakes, the resulting damage has been comparatively limited. This difference likely reflects variations in earthquake intensity, population exposure, and the structural capacity of buildings across regions.
The analysis of the three weighting methods indicates that regional rankings are generally stable, particularly for regions with the highest and lowest index values. However, shifts in the rankings of several mid-range regions show that the weighting scheme can influence the index’s sensitivity to specific indicators. The entropy method tends to assign higher weights to indicators with greater data variability, whereas the CRITIC method accounts for both variability and inter-indicator correlations. Consequently, the relatively small differences in index values among these methods reflect how each weighting approach responds to the underlying data structure.
Overall, the Seismic Severity Index (SSI) results show that the regions with the highest earthquake severity in Indonesia are primarily located near active tectonic sources, such as the Palu–Koro fault zone in Central Sulawesi and the subduction zones in the Nusa Tenggara region. This spatial pattern is consistent with Indonesia’s tectonic setting, which is dominated by the convergence of major lithospheric plates, which produce high seismic activity and elevate earthquake hazards in areas close to active faults and subduction interfaces. These findings are in line with the hazard–exposure–vulnerability framework, whereby disaster severity is shaped not only by the intensity of the hazard but also by population exposure and the vulnerability of regional infrastructure.
4.2.2. Seismic Impact Index
The seismic impact index (SII) results obtained from the three weighting methods are summarized in Table 4. Overall, the methods yield broadly consistent spatial patterns in identifying areas with the highest earthquake severity, with only minor differences in index magnitudes and rank positions. The analysis indicates that Sigi Regency, Donggala Regency, and Palu City consistently occupy the top three positions across all methods, although the order varies. High SII scores in these areas suggest that earthquakes exert substantial pressure on local socio-economic systems, particularly where economic capacity is relatively limited.
Table 4.
Seismic Impact Index in Indonesia based on Equal Weight, Entropy and CRITIC.
Beyond these three regions in Central Sulawesi Province, other areas with relatively high SII scores include North Lombok Regency, Pidie Jaya Regency, and Cianjur Regency. These regions have experienced major earthquakes in recent years, such as the 2018 Lombok earthquake, the 2016 Pidie Jaya earthquake, and the 2022 Cianjur earthquake. Elevated SII scores in these areas indicate that earthquake impacts are driven not only by the scale of physical damage but also by limited economic capacity to absorb the resulting losses.
In contrast, several regions display relatively low SII scores and appear at the bottom of the ranking, including Cilacap Regency, Ciamis Regency, Garut Regency, Pangandaran Regency, and Lebak Regency. Their lower index values suggest that earthquake impacts on local socio-economic systems are relatively modest. Low SII scores in these regions are associated with lower fatality rates and smaller ratios of economic losses to GRDP compared with other regions.
The results for the three weighting methods show that the regional ranking pattern is largely consistent, especially for regions with the highest index values. Minor differences among some mid-ranked regions suggest that the choice of weighting method can influence the index’s sensitivity to specific indicators. The entropy method highlights variation within indicators, while the CRITIC method accounts for both variability and correlations among indicators. Even so, the relatively small differences in index values indicate that relative earthquake impact is generally stable across weighting methods.
Overall, the Seismic Impact Index suggests that regions with the highest relative earthquake impacts in Indonesia tend to have a high fatality-to-population ratio and substantial economic losses relative to their economic capacity. This indicates that the socio-economic impact of disasters is shaped not only by the extent of physical damage, but also by a region’s economic and demographic capacity to absorb losses.
4.2.3. Comparison of Weighting Methods
To assess the consistency of the constructed indices, this study compares regional rankings generated by three weighting methods: equal weighting (EW), entropy weighting (EWM), and CRITIC weighting. Agreement between the methods is evaluated using Spearman’s correlation and Kendall’s Tau. Employing both measures offers complementary perspectives: Spearman’s correlation reflects the overall similarity of ranking patterns, whereas Kendall’s Tau focuses on the consistency of pairwise relationships between units. Together, they provide a more comprehensive and in-depth assessment of the robustness of the analytical results.
The results show that for the Seismic Severity Index (SSI), Spearman’s correlation values range from 0.9956 to 0.9984 (Table 5), while Kendall’s Tau values range from 0.9630 to 0.9841 (Table 6). For the Seismic Impact Index (SII), Spearman’s correlation coefficients range from 0.9885 to 0.9995 (Table 7), and Kendall’s Tau coefficients range from 0.9365 to 0.9947 (Table 8). These values indicate a very high level of agreement among the weighting methods. High Spearman correlation implies that the overall regional ranking remains consistent across methods, whereas a high Kendall’s Tau indicates that the pairwise ordering of regions is also largely preserved. These findings are consistent with those of Greco et al. [53], who argued that rank correlation is an effective tool for assessing the robustness of composite indices to methodological variation. However, when indicators exhibit heterogeneous distributions, different weighting techniques (e.g., entropy and CRITIC) can yield divergent outcomes [54,55,56].
Table 5.
Spearman Correlation Matrix on SSI.
Table 6.
Kendall Tau Correlation Matrix on SSI.
Table 7.
Spearman Correlation Matrix on SII.
Table 8.
Kendall Tau Correlation Matrix on SII.
In addition, the very high correlation between equal weighting and CRITIC in the SSI (ρ = 0.9841; τ = 0.9841) indicates that variance-based weighting adjustments and indicator conflicts do not substantially modify the ranking structure. This suggests that the contributions of the indicators are relatively balanced, so more sophisticated weighting procedures do not generate major differences in results. These findings are in line with previous research showing that when indicators contribute in a relatively uniform manner, composite indices tend to be robust to changes in weighting methods [56,57,58].
Methodologically, these results imply that the index structure is driven more by the underlying data characteristics than by the specific weighting assumptions. This enhances the validity of the approach by reducing the scope for subjective bias in weighting. The high level of stability also provides strong justification for using the aggregate SSI and SII in subsequent analyses, such as quadrant analysis and policy design. Overall, the comparison of weighting methods indicates that the developed model is highly robust and capable of generating consistent regional rankings, thereby ensuring that analytical results and policy recommendations are reliable and not tied to any single methodological choice.
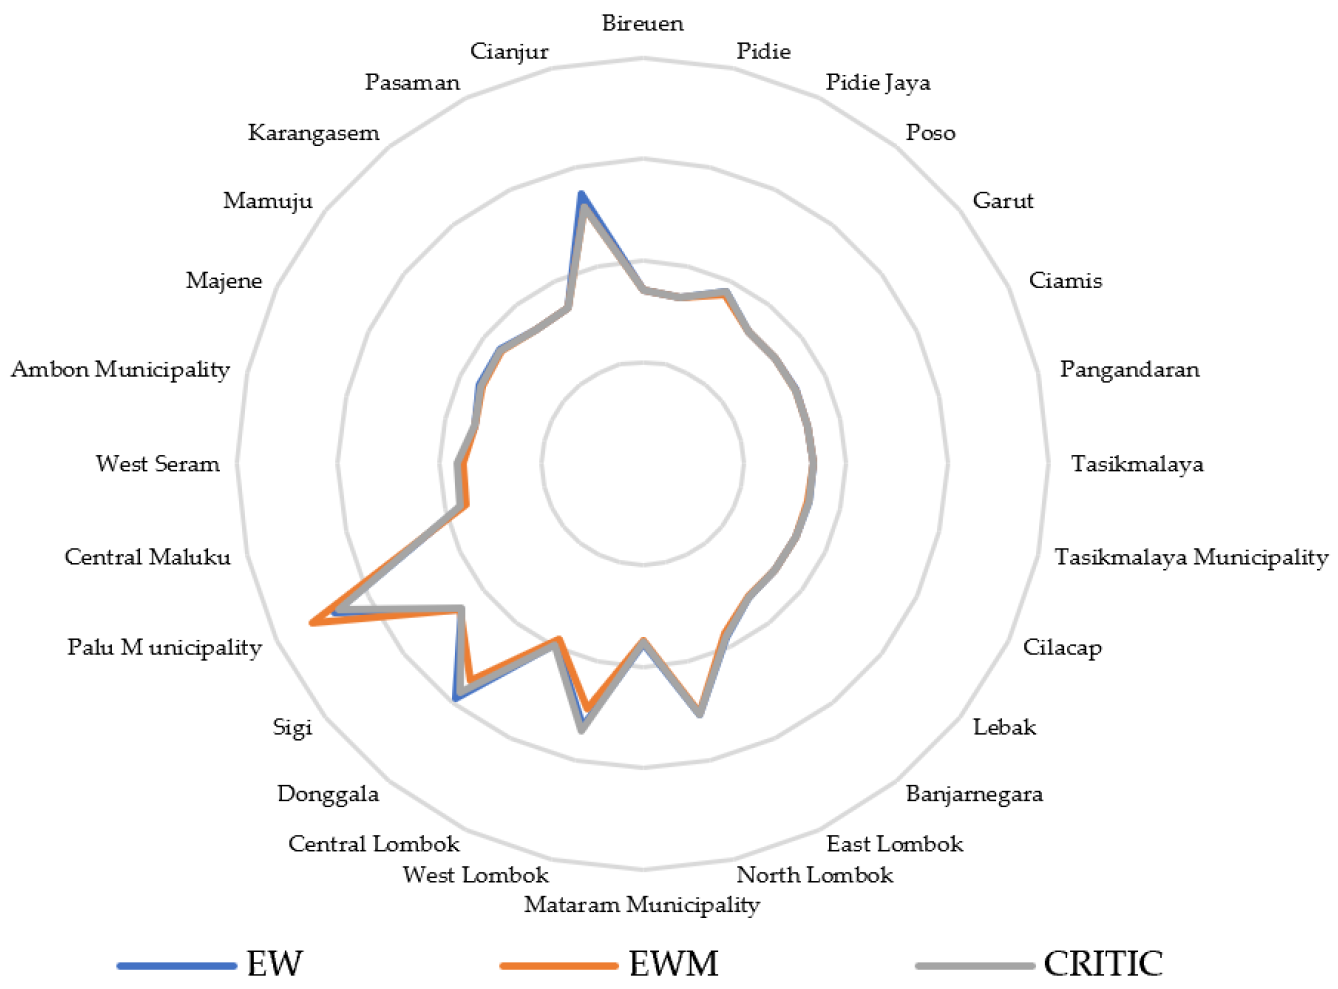
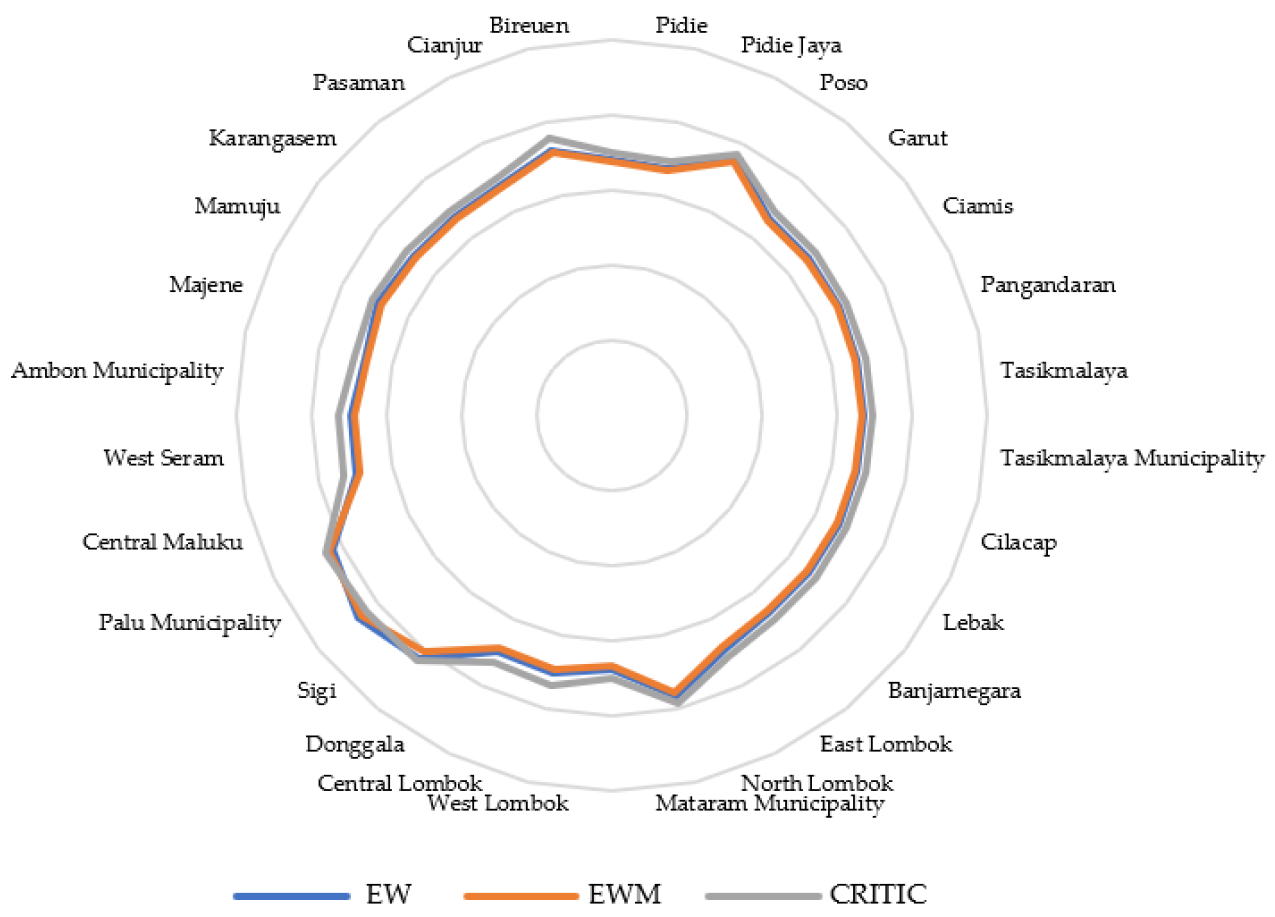
Furthermore, a sensitivity analysis was carried out to assess the robustness of the SII and SSI by comparing the Grey Relational Grades (GRG) obtained under three weighting schemes: Equal Weight, Entropy Weight Method (EWM), and CRITIC. Overall, the results display broadly consistent pattern across all three approaches, indicating that the model is highly stable with respect to weighting variations (Figure 2 and Figure 3).
Figure 2.
Radar diagram of SSI across regencies/municipalities.
Figure 3.
Radar diagram of SII across regencies/municipalities.
The sensitivity analysis for the SSI reveals a similar pattern, though with slightly greater variation than that observed for the SII. Palu consistently ranks first under all three methods, confirming its very high and stable earthquake severity regardless of weighting. Donggala Regency also reliably holds the second position. Some regions, such as Cianjur, West Lombok and North Lombok, show more notable ranking fluctuations. For instance, Cianjur ranks third under the Equal Weight and EWM schemes but rises to fourth under the CRITIC method. This suggests that severity indicators across regions exhibit considerable variability and therefore receive higher weights under the CRITIC approach.
In the SII, most districts and cities retain their relative rankings despite changes in weighting. Palu, Sigi, and Donggala consistently appeared in the top group across all methods. Sigi ranked first under both Equal Weight and EWM, but slipped slightly to second under the CRITIC method, while Palu rose from third (Equal Weight) to first (CRITIC). This suggests that disaster impact indicators in Palu show high variability and thus receive greater weight under CRITIC. Donggala remained relatively stable within the top three for all methods, indicating consistently strong disaster-impact performance regardless of the weighting scheme.
In the middle-to-lower group, including regions in West Java (Garut, Ciamis, Pangandaran, and Cilacap), GRG patterns were nearly identical across methods, with only very small changes. This uniformity in GRG values indicates that disaster impact indicators in these areas exhibit low variability, so different weighting methods have little influence on the final results. Overall, the differences in GRG values among methods in the SII are small (generally < 0.03), confirming that the SII is robust to changes in the weighting scheme.
The more pronounced changes observed in the SSI compared to the SII indicate that the severity index is more sensitive to variations in indicator weights, especially in areas with high indicator heterogeneity. Nevertheless, the overall ranking pattern remains largely unchanged, particularly in the highest- and lowest-ranked groups, suggesting that the assessment’s underlying structure is stable.
Overall, both the SII and SSI exhibit strong robustness, as shown by the consistent ranking patterns and small variations in GRG values across weighting schemes. The CRITIC method tends to yield clearer differentiation in areas with high indicator variability, whereas Equal Weight and EWM produce more uniform distributions. These results suggest that the evaluation is relatively unaffected by the choice of weighting method and can be considered a reliable basis for disaster risk and impact analysis at the district/city level in Indonesia.
4.2.4. Severity–Impact Matrix of Seismic Disaster Losses
The analysis of the relationship between the Seismic Severity Index (SSI) and the Seismic Impact Index (SII) illustrates variations in earthquake-related disaster losses across several regions in Indonesia. The SSI reflects the absolute level of losses, while the SII represents the relative level of losses caused by an event. These indices are derived using an integration of three weighting methods: equal weighting, the Entropy Weight Method (EWM), and CRITIC, with the resulting values and rankings presented in Table 9.
Table 9.
Seismic Severity and Seismic Impact Index in Indonesia based on combined weight.
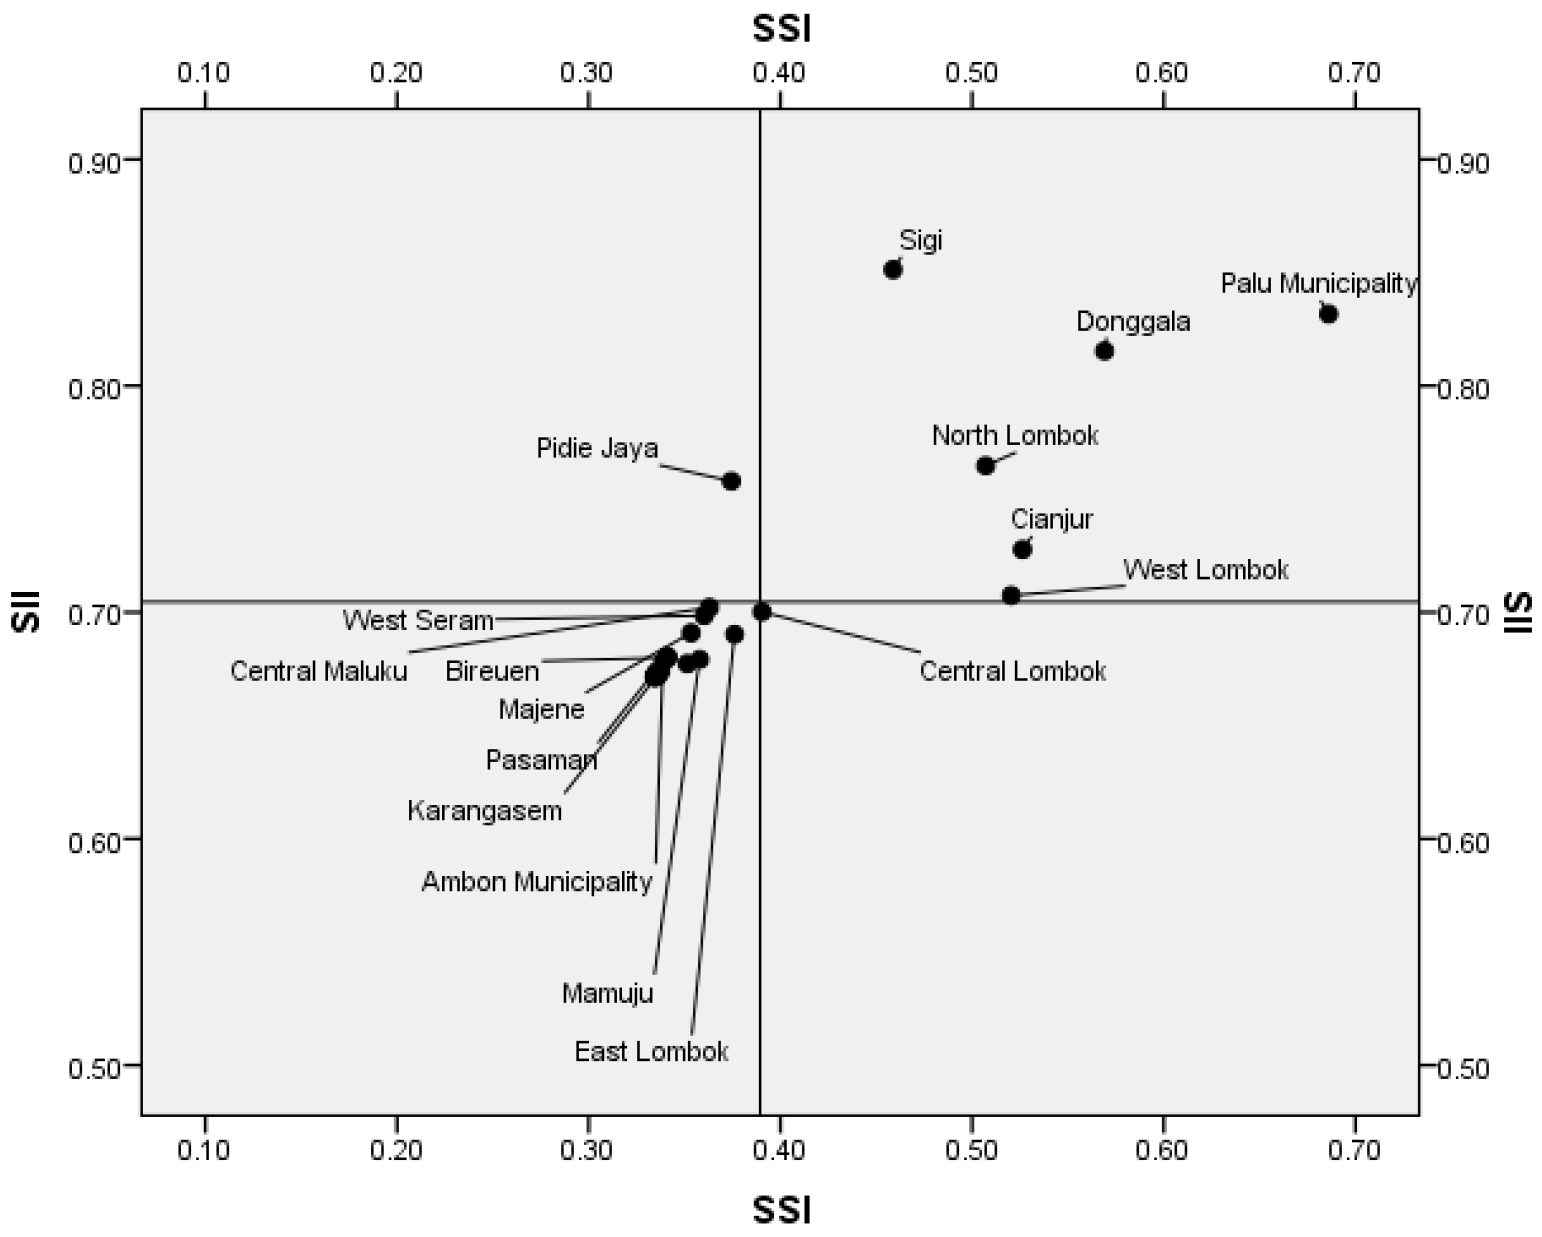
Quadrant analysis based on the average values of SSI and SII classifies regions into four main categories: high severity–high impact, high severity–low impact, low severity–low impact, and high severity–low impact, as shown in Figure 4 and Table 10. Sigi, Palu Municipality, Donggala, North Lombok, Cianjur, and West Lombok fall into the high severity–high impact category (Figure 4 and Table 10). Areas in this group are characterized by a combination of proximity to active earthquake sources, high population exposure, structural vulnerability, and limited mitigation capacity, all of which contribute to increased cumulative losses and casualties [59,60].
Figure 4.
Mapping of Seismic Severity Index (SSI) and Seismic Impact Index (SII) Value.
Table 10.
Categorization of Regencies/Municipalities According to the Seismic Severity Index (SSI) and Seismic Impact Index (SII).
Palu City, Donggala Regency, and Sigi Regency are located in high seismic hazard zones due to their proximity to the active Palu–Koro fault. The high level of damage caused by the earthquake is consistent with the findings of the PusGen study [61], which indicated that the 2018 Mw 7.4 Central Sulawesi earthquake triggered shaking of up to MMI IX–X, surface deformation, tsunamis, and massive liquefaction in areas such as Balaroa, Petobo, and Sigi, as well as landslides that caused widespread damage and large-scale displacement in Palu, Sigi, and Donggala [62,63]. This combination of hazards caused extensive damage to settlements and infrastructure and slowed the process of socio-economic recovery. Recovery efforts in Palu following the disaster showed slow progress, with only 44.2% recovery in socio-economic conditions after one year, highlighting the long-term impacts of disasters on these regions [64]. These findings indicate that the high loss indices in Palu, Donggala, and Sigi were influenced by the interaction between extreme geological hazards, infrastructure vulnerability, and still-limited mitigation capacity.
The 2022 Cianjur earthquake was associated with a previously unidentified shallow active fault, high peak ground acceleration, and local geological conditions that amplified ground shaking [65,66]. The Mw 5.6 earthquake caused widespread damage due to the proximity of the epicenter to residential areas, exacerbated by landslides, ground fissures, poor building construction quality, and weak implementation of earthquake-resistant building standards [66,67]. These results reinforce research findings that the high level of earthquake damage in Cianjur was influenced by a combination of geological factors, building vulnerability, and limited disaster mitigation capacity.
Meanwhile, the severe impacts in West Lombok and North Lombok were associated with the 2018 Lombok earthquake sequence linked to activity along the Flores Fault, with shaking intensities reaching VIII on the Modified Mercalli Intensity (MMI) scale and accompanied by aftershocks and secondary hazards such as landslides and liquefaction [68]. These conditions caused widespread damage and prolonged the socioeconomic recovery of the affected communities [69]. Sunarti et al. [70] also found household economic contraction, increased poverty, and low subjective well-being among the population in the early post-disaster phase. This consistency indicates that the impacts of the 2018 Lombok earthquake were widespread and persistent, thereby reinforcing the high earthquake disaster loss index in the region.
Accordingly, regions in this quadrant should be considered high-priority targets for policy interventions, especially for strengthening earthquake-resistant infrastructure, enhancing emergency response capacity, and implementing risk-based spatial planning.
Meanwhile, Central Maluku, West Seram, Majene, Pasaman, Bireuen, Mamuju, Ambon Municipality, Mataram Municipality, Karangasem, Banjarnegara, Pidie, Tasikmalaya, Poso, Lebak, Tasikmalaya Municipality, Pangandaran, Garut, Ciamis, Cilacap, and East Lombok are in the low severity—low impact category, with relatively small levels of damage and impact, as shown in Figure 4 and Table 10. This condition shows relatively lower disaster losses, both in terms of the event’s intensity and its impact [71]. For example, the Tasikmalaya earthquake of 15 December 2017, which affected Tasikmalaya Regency, Tasikmalaya City, Ciamis Regency, Pangandaran Regency, and Cilacap, had a magnitude of Mw 6.9 and a depth of 107 km [72], resulting in relatively moderate shaking. The results of the PusGen study showed that the maximum PGA value was only around 0.13 g, or equivalent to VI MMI [73], which caused relatively limited structural damage and economic losses. This is also reflected in the determination of the emergency response period by BNPB, which lasted only seven days in the main affected areas.
On the other hand, Central Lombok shows characteristics of high severity–low impact (Figure 4 and Table 10), despite experiencing large absolute losses, relatively low social and economic impacts due to adaptive capacity and fairly effective mitigation systems including the quality of buildings that are more earthquake-resistant, community preparedness, and the effectiveness of emergency response systems in mitigating the impact of disasters, even though they are in earthquake-prone zones.
Interestingly, Pidie Jaya is categorized as low-severity, high-impact. This finding indicates that although the nominal losses were not as high as in other regions, the impact is much more significant. This condition reflects the limited capacity of the region to absorb and recover from the impact of the disaster, so that the resulting pressure is proportionally greater. The combination of the threat of a large earthquake due to proximity to an active fault, soil conditions that amplify shocks, the high vulnerability of buildings that do not meet earthquake-resistant standards, and weak construction supervision and regional preparedness are triggers for the high impact of the disaster in Pidie Jaya [74]. In addition, USGS data shows that the Pidie Jaya region experienced a shaking intensity of MMI V with a PGA value of 4.84 g and PGV of 4.23 cm/s at approximately 93.57 km from the earthquake source. The intensity of MMI V indicates that almost the entire community felt the earthquake shaking and could cause minor damage to vulnerable buildings. The PGA and PGV values indicate a moderate level of shaking that still has the potential to cause structural damage, especially to buildings with low construction quality or those not designed to withstand earthquakes. Although the location is relatively far from the epicenter, this condition shows that seismic wave propagation is still capable of producing significant impacts in the Pidie Jaya area.
The quadrant analysis shows that the relationship between disaster severity and impact is not strictly linear but is instead shaped by complex interactions among hazard, exposure, and capacity. By applying three different weighting methods in constructing the index, we obtain more consistent and robust results for identifying regional priorities. This, in turn, offer a strong basis for designing evidence-based disaster risk reduction policies at the regional level.
Disaster loss assessments based solely on absolute loss values often fail to capture the true severity of impacts. To address this, this study proposes a comprehensive evaluation framework by developing the Seismic Severity Index (SSI) and the Seismic Impact Index (SII), which integrate both absolute and relative loss indicators. In addition, a composite disaster severity matrix is constructed based on these two indices by incorporating inflation, the scale of absolute losses, and the degree of disruption to regional socio-economic conditions. This innovative approach supports a more thorough and objective assessment of disaster severity.
The analysis reveals a clear divergence between absolute losses and relative impacts. For example, although earthquakes in Central Lombok caused extensive physical damage, their socio-economic consequences were relatively limited. Conversely, the earthquakes in Pidie Jaya, despite generating lower absolute losses, had more profound impacts on local economic and social systems. These findings indicate that traditional approaches that focus only on absolute loss values may introduce policy biases, overprioritizing areas with large nominal losses while neglecting regions experiencing more severe relative impacts. To improve objectivity, this study adopts a combined weighting strategy integrating the equal-weight method, the Entropy Weight Method, and the CRITIC method, ensuring that indicator weights more accurately reflect their relative importance in a balanced and robust manner. This integrated approach has proven effective in reducing subjective bias in weight determination.
This study further applies Grey Relational Analysis (GRA) to evaluate the SSI and SII, yet several limitations remain. First, the selection of SSI and SII indicators depends heavily on the availability of secondary data, which may not fully capture all dimensions of disaster risk, such as disruptions to critical infrastructure (electricity, water, transportation), indirect losses, and long-term impacts. This constraint may result in an underestimation of risk. Second, the quality and consistency of historical disaster data at the district or city level vary considerably, including differences in recording practices, which can influence both the normalization process and the calculation of the Grey relational grade.
Furthermore, although GRA is well suited for handling data with heterogeneous scales and high uncertainty, it is sensitive to the choice of normalization method and the selection of the distinguishing coefficient (ξ), both of which can affect the resulting Grey relational grade (GRG). While the use of multiple weighting methods improves the robustness of the analysis, it does not completely eliminate the inherent subjectivity in assigning indicator weights. Finally, the static nature of the current analysis does not account for temporal dynamics or spatial interactions among regions, both of which are critical for a more comprehensive understanding of disaster resilience.
4.3. Sensitivity Analysis
A sensitivity analysis was conducted to assess the robustness of the results of the Grey Relational Analysis with respect to variations in the differentiation coefficient (ζ). The analysis was performed using three values: ζ = 0.3, 0.5, and 0.7. The results show that the ranking structure of districts/cities remains highly stable across various values of ζ. As shown in Table 11 for the SSI ranking and Table 12 for the SII. For the SSI, only Cianjur District and West Lombok experienced a change in ranking at ζ = 0.3, while at ζ = 0.5 and ζ = 0.7, they had the same ranking. Meanwhile, for the SII rankings, only four regions—Majene, East Lombok, Pasaman, and Bireuen—exhibited ranking differences at ζ = 0.3, whereas at ζ = 0.5 and ζ = 0.7 Nevertheless, the results of the Spearman rank correlation in Table 13 and Table 14 show a very strong correlation between the generated rankings, with correlation coefficients exceeding 0.95 in all comparisons. This confirms that the overall ranking pattern is not sensitive to the choice of the differentiation coefficient.
Table 11.
Sensitivity Analysis of SSI.
Table 12.
Sensitivity Analysis of SII.
Table 13.
Spearman Correlation Matrix on SSI.
Table 14.
Spearman Correlation Matrix on SSI.
These findings indicate that the proposed composite index is robust to parameter variations and that selecting ζ = 0.5 as the appropriate baseline value is appropriate, as it provides a balanced level of discrimination without introducing instability into the ranking results.
5. Conclusions
This study proposes a new methodology for assessing earthquake-related losses across 28 regencies and cities in Indonesia from 2016 to 2022. It introduces a comprehensive framework based on the Seismic Severity Index (SSI) and the Seismic Impact Index (SII), supported by an earthquake loss matrix that includes nine absolute and four relative loss indicators. By integrating absolute indicators—such as hazard characteristics and physical damage—with relative indicators that capture impacts on population and economic capacity, the study provides a more holistic assessment than traditional approaches that focus solely on loss magnitude. The use of quadrant analysis further enables a systematic and nuanced identification of patterns in the relationship between disaster severity and impact, thereby supporting policymakers in designing more effective and informed strategies for earthquake risk reduction and resilience enhancement.
The results reveal substantial spatial heterogeneity in earthquake risk at the district and city levels. Areas classified as High–High—such as Sigi, Palu Municipality, Donggala, North Lombok, Cianjur, and West Lombok—are characterized by both high hazard intensity and marked system vulnerability, making them top priorities for policy intervention. In contrast, the Low–High category shows that disaster impacts can remain significant even where hazard severity is relatively low, highlighting the importance of socio-economic vulnerability. Regions in the High–Low category exhibit greater adaptive capacity to reduce relative impacts, while the Low–Low category reflects relatively stable conditions, although continued investment in preventive measures remains necessary.
These findings demonstrate that the relationship between earthquake severity and its impacts is nonlinear and multidimensional, shaped by capacity and vulnerability factors that mediate outcomes. As a result, approaches that employ GRA and composite indices generate more robust insights and better capture the complexity of disaster risk systems. From a policy perspective, the study underscores the need to tailor disaster risk reduction strategies to specific regional contexts. A quadrant-based approach supports the prioritization of targeted measures, such as strengthening earthquake-resistant infrastructure, enhancing institutional capacity, and improving communities’ socio-economic resilience. The analytical framework developed here thus offers a solid foundation for formulating evidence-based policies to enhance regional resilience to earthquakes in Indonesia.
Future research should focus on further refining the SSI and SII by incorporating additional dimensions, including disruptions to critical infrastructure, indirect losses, and long-term economic impacts, to improve the precision of risk assessment. Enhancing data quality through the integration of multiple sources—such as real-time monitoring, remote sensing, and big data—is also essential to address limitations in the consistency and completeness of historical records. Methodologically, subsequent studies could develop more advanced GRA models, such as dynamic or fuzzy GRA, or integrate GRA with other techniques, including machine learning, to reduce sensitivity to normalization procedures and mitigate subjectivity in weighting. Furthermore, applying longitudinal analyses using panel data and spatial methods—such as spatial econometrics or network analysis—will be crucial for capturing temporal dynamics and inter-regional interactions, thereby contributing to a more systematic and comprehensive understanding of disaster resilience.
Author Contributions
Conceptualization, M.R.A.; data curation, M.R.A.; investigation, M.R.A. and A.F.; writing—original draft preparation, M.R.A.; writing—review and editing, A.F., B.J. and A.E.P.; supervision, B.J. and A.E.P. All authors have read and agreed to the published version of the manuscript.
Funding
This research received funding from the Ministry of Higher Education, Science, and Technology of Republic Indonesia (Kemendiktisaintek RI) through the Indonesian Education Scholarship Program (BPI). The funding was administered by the Center for Higher Education Funding and Assessment (PPAPT), Ministry of Higher Education, Science, and Technology of the Republic of Indonesia, and the Indonesia Endowment Fund for Education (LPDP), Ministry of Finance of Republic Indonesia.
Data Availability Statement
The original contributions presented in this study are included in the article. Further inquiries can be directed to the corresponding author.
Acknowledgments
This research was supported by the Indonesian Education Scholarship Program (BPI); the Center for Higher Education Funding and Assessment (PPAPT), Ministry of Higher Education, Science, and Technology of Republic Indonesia (Kemendiktisaintek RI); and the Endowment Fund for Education Agency (LPDP RI), Ministry of Finance of Republic Indonesia for supporting the doctoral study at IPB University under the Indonesian Education Scholarship scheme (Scholarship ID: 202209091230; Contract Number: 00747/J5.2.3/BPI.06/9/2022, dated 9 September 2022). During the preparation of this manuscript, the authors used [google translate, deepL and grammarly] for language editing and improving text clarity. The authors have reviewed and edited the output and take full responsibility for the final content.
Conflicts of Interest
The authors declare no conflicts of interest.
References
- Botzen, W.J.W.; Deschenes, O.; Sanders, M. The Economic Impacts of Natural Disasters: A Review of Models and Empirical Studies. Rev. Environ. Econ. Policy 2019, 13, 167–188. [Google Scholar] [CrossRef] [Scilit]
- Haoying, Z.; Jingjing, P.; Han, Q.; Yun, L. A Methodological Framework for Assessing Economic Loss in Urban Seismic Disaster. Comput. Ind. Eng. 2025, 207, 111273. [Google Scholar] [CrossRef] [Scilit]
- Ozmen, H.B. The Economic Impact of Earthquakes: A Global Assessment of Direct and Indirect Losses. Res. Des. 2025, 2, 147–170. [Google Scholar] [CrossRef] [Scilit]
- Ozcan, C.; Nihan, S.; Ozturk, Y. Impacts of Earthquake Damage on Commercial Life: A RS and GIS Based Case Study of Kahramanmaraş Earthquakes. Int. J. Disaster Risk Reduct. 2024, 107, 104464. [Google Scholar] [CrossRef] [Scilit]
- CRED. 2024 Disasters in Numbers; CRED: Brussels, Belgium, 2025. [Google Scholar]
- Shen, Y.; Hesham El Naggar, M.; Zhang, D.M.; Huang, Z.K.; Du, X.; El Naggar, M.H.; Zhang, D.M.; Huang, Z.K.; Du, X. Seismic Resilience Assessment of Shield Tunnel Linings in Sites Susceptible to Liquefaction. Soil Dyn. Earthq. Eng. 2025, 207, 110320. [Google Scholar] [CrossRef] [Scilit]
- Shen, Y.; Hesham El Naggar, M.; Zhang, D.M.; Huang, Z.K.; Du, X. Scalar- and Vector-Valued Seismic Fragility Assessment of Segmental Shield Tunnel Lining in Liquefiable Soil Deposits. Tunn. Undergr. Space Technol. 2025, 155, 106171. [Google Scholar] [CrossRef] [Scilit]
- Fakhruddin, B.; Murray, V.; Maini, R. Disaster Loss Data in Monitoring the Implementation of the Sendai Framework; Global Platform for Disaster Risk Reduction: Geneva, Switzerland, 2017; pp. 1–4. [Google Scholar]
- Shi, P. Disaster Measurement, Statistics, and Assessment BT—Disaster Risk Science. In Disaster Risk Science; Shi, P., Ed.; Springer: Singapore, 2019; pp. 165–224. [Google Scholar]
- Serje, J. Overview of the United Nations Global Loss Data Collection Initiative. In Flood Damage Survey and Assessment: New Insights from Research and Practice; Wiley: Hoboken, NJ, USA, 2017; pp. 1–16. [Google Scholar]
- Bhuiyan, T.R.; Er, A.C.; Lim, C.; Muhamad, N.; Bakar, A.A.; Pereira, J.J. Disaster Loss Indicators for Reporting to DesInventar Sendai and Enabling Rapid Monetary Valuation in Malaysia. Weather Clim. Extrem. 2022, 37, 100488. [Google Scholar] [CrossRef] [Scilit]
- Wu, J.D.; Li, N. Elementary Discussion about Importance of Indirect Economic Loss Estimation of Disasters. J. Nat. Disasters 2012, 21, 15–21. [Google Scholar]
- Rizal, E.; Winoto, Y.; Sugito, T.; Nugroho, C.; Septian, F.I. Disaster Communication in the Digital Age: A Community-Based Case Study of Media, Education, and Local Knowledge in Pangandaran, Indonesia. Front. Commun. 2025, 10, 1–14. [Google Scholar] [CrossRef] [Scilit]
- Kausar, D.R.K.; Agustan. Disaster Management in Tourism: Public-Private Collaboration and Early Warning Innovations in Bali and Yogyakarta. J. Kaji. Bali 2025, 15, 582–600. [Google Scholar]
- Cummins, P.R. Geohazards in Indonesia: Earth Science for Disaster Risk Reduction—Introduction; Geological Society: London, UK, 2017; pp. 1–7. [Google Scholar]
- Hariani, R.R.; Badaruddin; Bengkel; Irmayani, T. Strengthening Disaster Mitigation of Mount Sinabung through the Integration of Local Wisdom and Social. J. Proj. Manag. 2026, 11, 169–180. [Google Scholar] [CrossRef] [Scilit]
- Ren, Z.; Wang, Y.; Wang, P.; Hou, J.; Gao, Y.; Zhao, L. Numerical Study of the Triggering Mechanism of the 2018 Anak Krakatau Tsunami: Eruption or Collapsed Landslide? Nat. Hazards 2020, 102, 1–13. [Google Scholar] [CrossRef] [Scilit]
- Li, L.; Wen, J.; Shi, Y.; Chen, Y.; Shi, Z.; Wu, Y.; Liu, J.; Tian, T.; Yan, J.; Zhao, L.; et al. Disaster Losses in Shanghai Decreased under Rapid Urbanization: Evidence from 1980 to 2019. Urban Clim. 2025, 59, 1–14. [Google Scholar] [CrossRef] [Scilit]
- Parodi, E.; Kahhat, R.; Ian, V. Multi-Dimensional Damage Assessment (MDDA): A Case Study of El Nino Flood Disasters in Peru Ni N. Clim. Risk Manag. 2021, 33, 100329. [Google Scholar] [CrossRef] [Scilit]
- Qi, Q.; Jiang, B.; Ma, W.; Marley, G. Trend Analysis and Spatial Distribution of Meteorological Disaster Losses in China, 2004–2015. Atmosphere 2022, 13, 208. [Google Scholar] [CrossRef] [Scilit]
- Zhao, L.; Wen, J.; Wan, C.; Li, L.; Chen, Y.; Zhang, H.; Liu, H.; Yan, J.; Tian, T.; Shi, Y. Disaster Loss Index Development and Comprehensive Assessment: A Case Study of Shanghai. Ecol. Indic. 2024, 166, 112497. [Google Scholar] [CrossRef] [Scilit]
- Li, X.Z.; Wang, Z.T.; Guo, X.D. Economic Losses Research of Seismic Damage Based on Grey Correlation and Genetic Neural Network. Appl. Mech. Mater. 2012, 166–169, 2054–2059. [Google Scholar] [CrossRef] [Scilit]
- Silva, V.; Jaiswal, K.; Weatherill, G.; Crowley, H. Global Assesment of Human Losses Due to Earthquake. In Proceedings of the Second European Conference on Earthquake Engineering and Seismology, Istanbul, Turkey, 25–29 August 2014. [Google Scholar]
- Silva, V. Critical Issues in Earthquake Scenario Loss Modeling Critical Issues in Earthquake Scenario Loss. J. Earthq. Enguneering 2016, 20, 1322–1341. [Google Scholar] [CrossRef] [Scilit]
- Markhvida, M.; Baker, J.W. Towards Seismic Well-Being, A Comprehensive Approach to Modeling Earthquake Consequences from Regional Hazard to Household; Stanford University: Stanford, CA, USA, 2020. [Google Scholar]
- Silva, V.; Aljawhari, K.; Baiguera, M.; Calderón, A.; Caruso, M.; Costa, C.; González, D.G.; Mouayed, A.; Nafeh, B.; Rao, A.; et al. Drivers of Earthquake Damage and Losses: A Global Perspective on Where and Why Seismic Risk Is High. In Proceedings of the EGU General Assembly Conference Abstracts, Vienna, Austria, 27 April–2 May 2025; p. EGU25-21102. [Google Scholar]
- Kuo, J.Y.; Chen, Y.C. Loss Severity Evaluation Using Grey Relational Analysis: A Case Study of Natural Disasters in Taiwan. Open Autom. Control Syst. J. 2015, 7, 1057–1060. [Google Scholar] [CrossRef] [Scilit]
- Pang, S.; Hu, X.; Wen, Z. Environmental Risk Assessment and Comprehensive Index Model of Disaster Loss for COVID-19 Transmission. Environ. Technol. Innov. 2021, 23, 101597. [Google Scholar] [CrossRef] [Scilit] [PubMed]
- Alshuwaikhat, H.M.; Adenle, Y.A.; Alotaishan, T.N. The Development of a Grey Relational Analysis-Based Composite Index for Environmental Sustainability Assessment: Towards a Net-Zero Emissions Strategy in Saudi Arabia. Heliyon 2023, 9, e18192. [Google Scholar] [CrossRef] [Scilit] [PubMed]
- Yang, Y.; John, R. Grey Sets and Greyness. Inf. Sci. 2012, 185, 249–264. [Google Scholar] [CrossRef] [Scilit]
- Liu, S.; Yang, Y.; Yi-Lin Forrest, J. Grey Systems Analysis: Methods, Models and Aplplications, 2nd ed.; Springer: Singapore, 2025. [Google Scholar]
- Miao, C.; Ding, M.; Qiu, J.; Wang, J.; Wu, J.; Sun, D. Severity of Earthquake Disasters Triggered by MS ≥ 5.0 Events: Retrospective Analysis of 288 Cases in China (1991–2020). Nat. Hazards 2025, 121, 15993–16011. [Google Scholar] [CrossRef] [Scilit]
- Pakkar, M.S. An Integrated Approach to Grey Relational Analysis, Analytic Hierarchy Process and Data Envelopment Analysis. J. Cent. Cathedra 2016, 9, 71–86. [Google Scholar] [CrossRef] [Scilit]
- Zhu, J.; Zhang, S.; Chen, Y.; Zhang, L. A Hierarchical Clustering Approach Based on Three-Dimensional Gray Relational Analysis for Clustering a Large Group of Decision Makers with Double Information. Group Decis. Negot. 2016, 25, 325–354. [Google Scholar] [CrossRef] [Scilit]
- Kuo, Y.; Yang, T.; Huang, G.W. The Use of Grey Relational Analysis in Solving Multiple Attribute Decision-Making Problems. Comput. Ind. Eng. 2008, 55, 80–93. [Google Scholar] [CrossRef] [Scilit]
- Hu, K.; Wang, R.; Xu, J.; Constantinescu, C.; Chen, Y.; Ling, C. Extreme Analysis of Typhoons Disaster in Mainland China with Insurance Management. Int. J. Disaster Risk Reduct. 2024, 106, 104411. [Google Scholar] [CrossRef] [Scilit]
- Liu, P.; Liu, X.; Yang, H. Evaluation of the Marine Economic Development Quality in Qingdao Based on Entropy and Grey Relational Analysis. Mar. Econ. Manag. 2019, 2, 29–38. [Google Scholar] [CrossRef] [Scilit]
- Bonnet, J.; Coll-Martínez, E.; Renou-Maissant, P. Evaluating Sustainable Development by Composite Index: Evidence from French Departments. Sustainability 2021, 13, 761. [Google Scholar] [CrossRef] [Scilit]
- Tang, J.; Zhu, H.L.; Liu, Z.; Jia, F.; Zheng, X.X. Urban Sustainability Evaluation under the Modified TOPSIS Based on Grey Relational Analysis. Int. J. Environ. Res. Public Health 2019, 16, 256. [Google Scholar] [CrossRef] [Scilit] [PubMed]
- Rahma, H.; Fauzi, A.; Juanda, B.; Widjojanto, B. Development of a Composite Measure of Regional Sustainable Development in Indonesia. Sustainability 2019, 11, 5861. [Google Scholar] [CrossRef] [Scilit]
- Olabanji, O.M.; Mpofu, K. Appraisal of Conceptual Designs: Coalescing Fuzzy Analytic Hierarchy Process (F-AHP) and Fuzzy Grey Relational Analysis (F-GRA). Results Eng. 2021, 9, 100194. [Google Scholar] [CrossRef] [Scilit]
- Pu, Y.; Zhao, Y.; Meng, J. Process Parameters Optimization Using Taguchi-Based Grey Relational Analysis in Laser-Assisted Machining of Si3N4. Materials 2021, 14, 529. [Google Scholar] [CrossRef] [Scilit]
- Shrotriya, A.; Nayak, C.; Sahu, N.K. Dispersion Properties Evaluation of Copper- Based Nanoparticles as Cutting Fluid Using Taguchi-Based Grey Relational Analysis. J. Eng. Appl. Sci. 2025, 72, 82. [Google Scholar] [CrossRef] [Scilit]
- Gürmeriç, V.; Dogan, M. The Quantitative Assessment of the Mixing Time on the Effect of Mixing Homogeneity in Different Food Powder Mixers: Entropy-Weighted Grey Relational Analysis. J. Food Eng. 2026, 410, 112936. [Google Scholar] [CrossRef] [Scilit]
- Ye, C.; Hu, M.; Lu, L.; Dong, Q.; Gu, M. Spatio-Temporal Evolution and Factor Explanatory Power Analysis of Urban Resilience in the Yangtze River Economic Belt. Geogr. Sustain. 2022, 3, 299–311. [Google Scholar] [CrossRef] [Scilit]
- Diakoulaki, D.; Mavrotas, G.; Papayannakis, L. Determining Objective Weights in Multiple Criteria Problems: The Critic Method. Comput. Oper. Res. 1995, 22, 763–770. [Google Scholar] [CrossRef] [Scilit]
- Abirami, M.; Das, D. Multi-Criteria Evaluation of Green Microalgal Variants for Biodiesel Using an Integrated CRITIC—BWM—CoCoSo Screening Framework. Biomass Bioenergy 2026, 210, 109063. [Google Scholar] [CrossRef] [Scilit]
- Gao, J.; Lin, Z.; Liu, Q. A Decision Making Algorithm for Economic Growth in the Digital Economy Using CRITIC WASPAS Based Circular Picture Fuzzy Information. Sci. Rep. 2026, 16, 1608. [Google Scholar]
- Krishnan, A.R.; Kasim, M.M.; Hamid, R.; Ghazali, M.F. A Modified CRITIC Method to Estimate the Objective Weights of Decision Criteria. Symmetry 2021, 13, 973. [Google Scholar] [CrossRef] [Scilit]
- Razzaq, A.; Khan, Z.A.; Naeem, K.; Riaz, M. Picture Fuzzy Complex Proportional Assessment Approach with Step-Wise Weight Assessment Ratio Analysis and Criteria Importance through Intercriteria Correlation. Eng. Appl. Artif. Intell. 2025, 139, 109554. [Google Scholar] [CrossRef] [Scilit]
- Zhang, W.; Liu, X.; Zhao, W.; He, Q.; Guo, C.; Su, B. Spatiotemporal-Aware Multi-Agent Reinforcement Learning for Revisit-Oriented Multi-Satellite Observation Task Scheduling. Appl. Sci. 2026, 16, 2685. [Google Scholar] [CrossRef] [Scilit]
- Yew, Y.; González, P.A.; Delgado, R.C. Real-Time Impact Analysis and Response Using a New Disaster Metrics: 2018 Sulawesi (Indonesia) Earthquake and Tsunami. Prehosp. Disaster Med. 2020, 35, 76–82. [Google Scholar] [CrossRef] [Scilit]
- Greco, S.; Ishizaka, A.; Tasiou, M.; Torrisi, G. On the Methodological Framework of Composite Indices: A Review of the Issues of Weighting, Aggregation, and Robustness. Soc. Indic. Res. 2019, 141, 61–94. [Google Scholar] [CrossRef] [Scilit]
- Liu, H.; Li, Z.; He, Q. Suitability Assessment of Multilayer Urban Underground Space Based on Entropy and CRITIC Combined Weighting Method: A Case Study in Xiong’an New Area, China. Appl. Sci. 2023, 13, 10231. [Google Scholar] [CrossRef] [Scilit]
- Pan, Z.; Huang, X. A Multivariate Statistical Process Control Model Based on CRITIC Entropy Method and EWMA. Adv. Comput. Signals Syst. 2023, 7, 20–26. [Google Scholar] [CrossRef] [Scilit]
- Robles-Algarin, C.; Castrillo-Fernandes, L.; Resrepo-Leal, D. Optimal Site Selection for Solar PV Systems in the Colombian Caribbean: Evaluating Weighting Methods in a TOPSIS Framework. Sustainability 2024, 16, 8761. [Google Scholar] [CrossRef] [Scilit]
- Gomez-Limon, J.A.; Arriaza, M.; Guerrero-Baena, M.D. Building a Composite Indicator to Measure Environmental Sustainability Using Alternative Weighting Methods. Sustainability 2020, 12, 4398. [Google Scholar] [CrossRef] [Scilit]
- Lewerenz, S.; Lambrecht, H.; Tietze, I.; Lazar, L. Can an Ecological Scarcity Method for Germany Support Robust Decisions? – Analysing the Effect of Uncertain Target Values on the Impact Assessment of Energy Generation Technologies. Int. J. Life Cycle Assess. 2024, 29, 614–631. [Google Scholar] [CrossRef] [Scilit]
- Jayadi, H.; Meidji, I.U.; Hidayat, I. Earthquake Analysis Using the Probabilistic Seismic Hazard Analysis (PSHA) Method in Palu City. Faraday J. Fundam. Phys. Res. Appl. Sci. 2025, 1, 60–66. [Google Scholar] [CrossRef] [Scilit]
- Susetyo, A.; Handayani, W.; Awalia, R. Social Vulnerability of Multi-Hazard Disaster-Prone Areas in Palu City, Central Sulawesi. Eduvest-J. Univers. Stud. 2025, 5, 3940–3950. [Google Scholar] [CrossRef] [Scilit]
- Pusat Studi Gempa Nasional. Kajian Gempa Palu Provinsi Sulawesi Tengah 28 September 2018 (M7.4); Rsyam, M., Hanifa, N.R., Djarwadi, D., Sarsito, D.A., Eds.; Pusat Studi Gempa Nasional: Bandung, Indonesia, 2018. [Google Scholar]
- Jaya, A.; Nishikawa, O.; Jumadil, S. Distribution and Morphology of the Surface Ruptures of the 2018 Donggala–Palu Earthquake, Central Sulawesi, Indonesia. Earth Planets Space 2019, 71, 144. [Google Scholar] [CrossRef] [Scilit]
- Montgomery, J.; Wartman, J.; Reed, A.N.; Gallant, A.P.; Hutabarat, D.; Mason, H.B. Field Reconnaissance Data from GEER Investigation of the 2018 MW 7.5 Palu-Donggala Earthquake. Data Brief 2021, 34, 106742. [Google Scholar] [CrossRef] [Scilit]
- Tope, P.; Ichwan, M.; Tenge, E.; Suparman, S. Social Economic Index Analysis of Palu Disaster Recovery. Environ. Ecol. Res. 2022, 10, 728–737. [Google Scholar] [CrossRef] [Scilit]
- Ardha, Y.K.; Satyarno, I.; Marliyani, G.I. Probabilistic Seismic Hazard Analysis Assessment in Cianjur Following the M w 5.6, 2022 Earthquake. J. Civ. Eng. Forum 2025, 11, 245–256. [Google Scholar] [CrossRef]
- Pusat Studi Gempa Nasional. Kajian Gempa Bumi Cianjur Provinsi Jawa Barat; Irsyam, A., Widiantoro, S., Natawidjaya, D.H., Imran, I., Partono, W., Hanifa, N.R., Gunawan, E., Hendarto, Sunarhadi, A., Sukamta, D., et al., Eds.; Kementerian Pekerjaan Umum dan Perumahan Rakyat: Jakarta, Indonesia, 2023. [Google Scholar]
- Kurniadi, A.; Maarif, S.; Syamsunasir; Widana, I.D.K.K. The Influence of Changes in Sundanese Cultural Behavior on Post-Earthquake Disaster Assistance Program Support in Cianjur Regency. E3S Web Conf. 2024, 604, 02002. [Google Scholar] [CrossRef] [Scilit]
- Irsyam, M.; Hanifa, N.R.; Djarwadi, D. Kajian Rangkaian Gempa Lombok Nusa Tenggara Barat; Pusat Studi Gempa Nasional: Bandung, Indonesia, 2018. [Google Scholar]
- Pribadi, K.S.; Pradoto, R.G.; Hanafi, E.A.; Made Adhi Bayu Rasmawan, I. Lombok Earthquake, One Year Later: Housing Sector Recovery. E3S Web Conf. 2019, 156, 01012. [Google Scholar] [CrossRef] [Scilit]
- Sunarti, E.; Gunawan, E.; Widiyantoro, S.; Marliyani, G.I.; Ida, R. Critical Point on Housing Construction, Resilience and Family Subjective Welfare after Disaster: Notes from the Lombok, Indonesia, Earthquake Sequence of July-August 2018. Geomat. Nat. Hazards Risk 2021, 12, 922–938. [Google Scholar] [CrossRef] [Scilit]
- Caldera, H.J.; Wirasinghe, S.C. A Universal Severity Classification for Natural Disasters. Nat. Hazards 2022, 111, 1533–1573. [Google Scholar] [CrossRef] [Scilit]
- Rosyida, A.; Nurmalasari, R.; Suprapto. Data Bencana Indonesia 2017; BNPB: Jakarta, Indonesia, 2017. [Google Scholar]
- Tim Pusat Studi Gempa Nasional. Laporan Cepat Gempa Tasikmalaya Provinsi Jawa Barat 15 Desember 2017; Hanifa, N.R., Irsyam, M., Supartoyo, Djarwadi, D., Eds.; Pusat Penelitian dan Pengembangan Perumahan dan Permukiman Badan Penelitian dan Pengembangan Kementerian Pekerjaan Umum dan Perumahan Rakyat 6: Bandung, Indonesia, 2017. [Google Scholar]
- Tim Pusat Studi Gempa Nasional. Kajian Gempa Pidie Jaya, Provinsi Aceh, Indonesia, 7 Desember 2016 (M6.5); Irsyam, M., Hanifa, N.R., Djarwadi, D., Eds.; Pusat Penelitian dan Pengembangan Perumahan dan Permukiman Badan Penelitian dan Pengembangan Kementerian Pekerjaan Umum dan Perumahan Rakyat: Bandung, Indonesia, 2017. [Google Scholar]
Disclaimer/Publisher’s Note: The statements, opinions and data contained in all publications are solely those of the individual author(s) and contributor(s) and not of MDPI and/or the editor(s). MDPI and/or the editor(s) disclaim responsibility for any injury to people or property resulting from any ideas, methods, instructions or products referred to in the content. |
© 2026 by the authors. Licensee MDPI, Basel, Switzerland. This article is an open access article distributed under the terms and conditions of the Creative Commons Attribution (CC BY) license.