1. Introduction and Objectives
La Palma, with 706 km2 in extension and a maximum altitude of 2423 m a.s.l., is the most active volcanic island in the Canary Archipelago according to historical records. It has a roughly triangular shape with a predominant N–S axis, and consists of two main volcanic edifices: an almost hexagonal northern ancient shield formed by the Garafia, Taburiente, and Bejenado volcanoes, dating from 2 to 0.5 Ma ago, and a more recent southern rift zone elongated in a N–S direction known as Cumbre Vieja volcano, with ages ranging from 0.5 Ma to present. Historic eruptions have occurred approximately in 1480 (Tacande), 1585 (Tahuya), 1646 (Tigalate), 1677 (San Antonio), 1712 (El Charco), 1949 (San Juan), 1971 (Teneguía), and 2021 (known as Tajogaite).
Previous historical eruptions along the Cumbre Vieja north–south rift zone have been characterized by the emergence of multiple vents aligned obliquely to the rift zone. Eruptive activity has typically been explosive at the summit vents and effusive at the base and flanks of the volcanoes, producing basaltic lavas, basanites, tephrites, and phonotephrites [
1,
2,
3].
The eruption of the Tajogaite volcano has had a catastrophic effect on the population residing on the western side of the island [
4,
5,
6]. The regional and national authorities are collaborating with the scientific community to find solutions to aid recovery of the impacted area in the shortest possible time while ensuring the safety of the population.
One of the main current problems is the lack of knowledge regarding the cooling rate for lava flows of great thicknesses, as observed in the case here studied. Even two years after the end of the eruption, there are still areas where surface or near-surface temperatures remain above 500 °C. This poses a critical obstacle to the recovery and reconstruction efforts. Studies on this subject are scarce [
7,
8,
9,
10,
11,
12,
13,
14]. On the other hand, cooling mechanisms of lava flows have been considered by [
15,
16,
17].
The main aim of this study is to evaluate and assess the cooling rates of lava flows, which is a key question for providing engineering solutions for infrastructure reconstruction and territorial planning, as well as implementing post-eruption mitigation measures.
Effects of the Volcanic Eruption
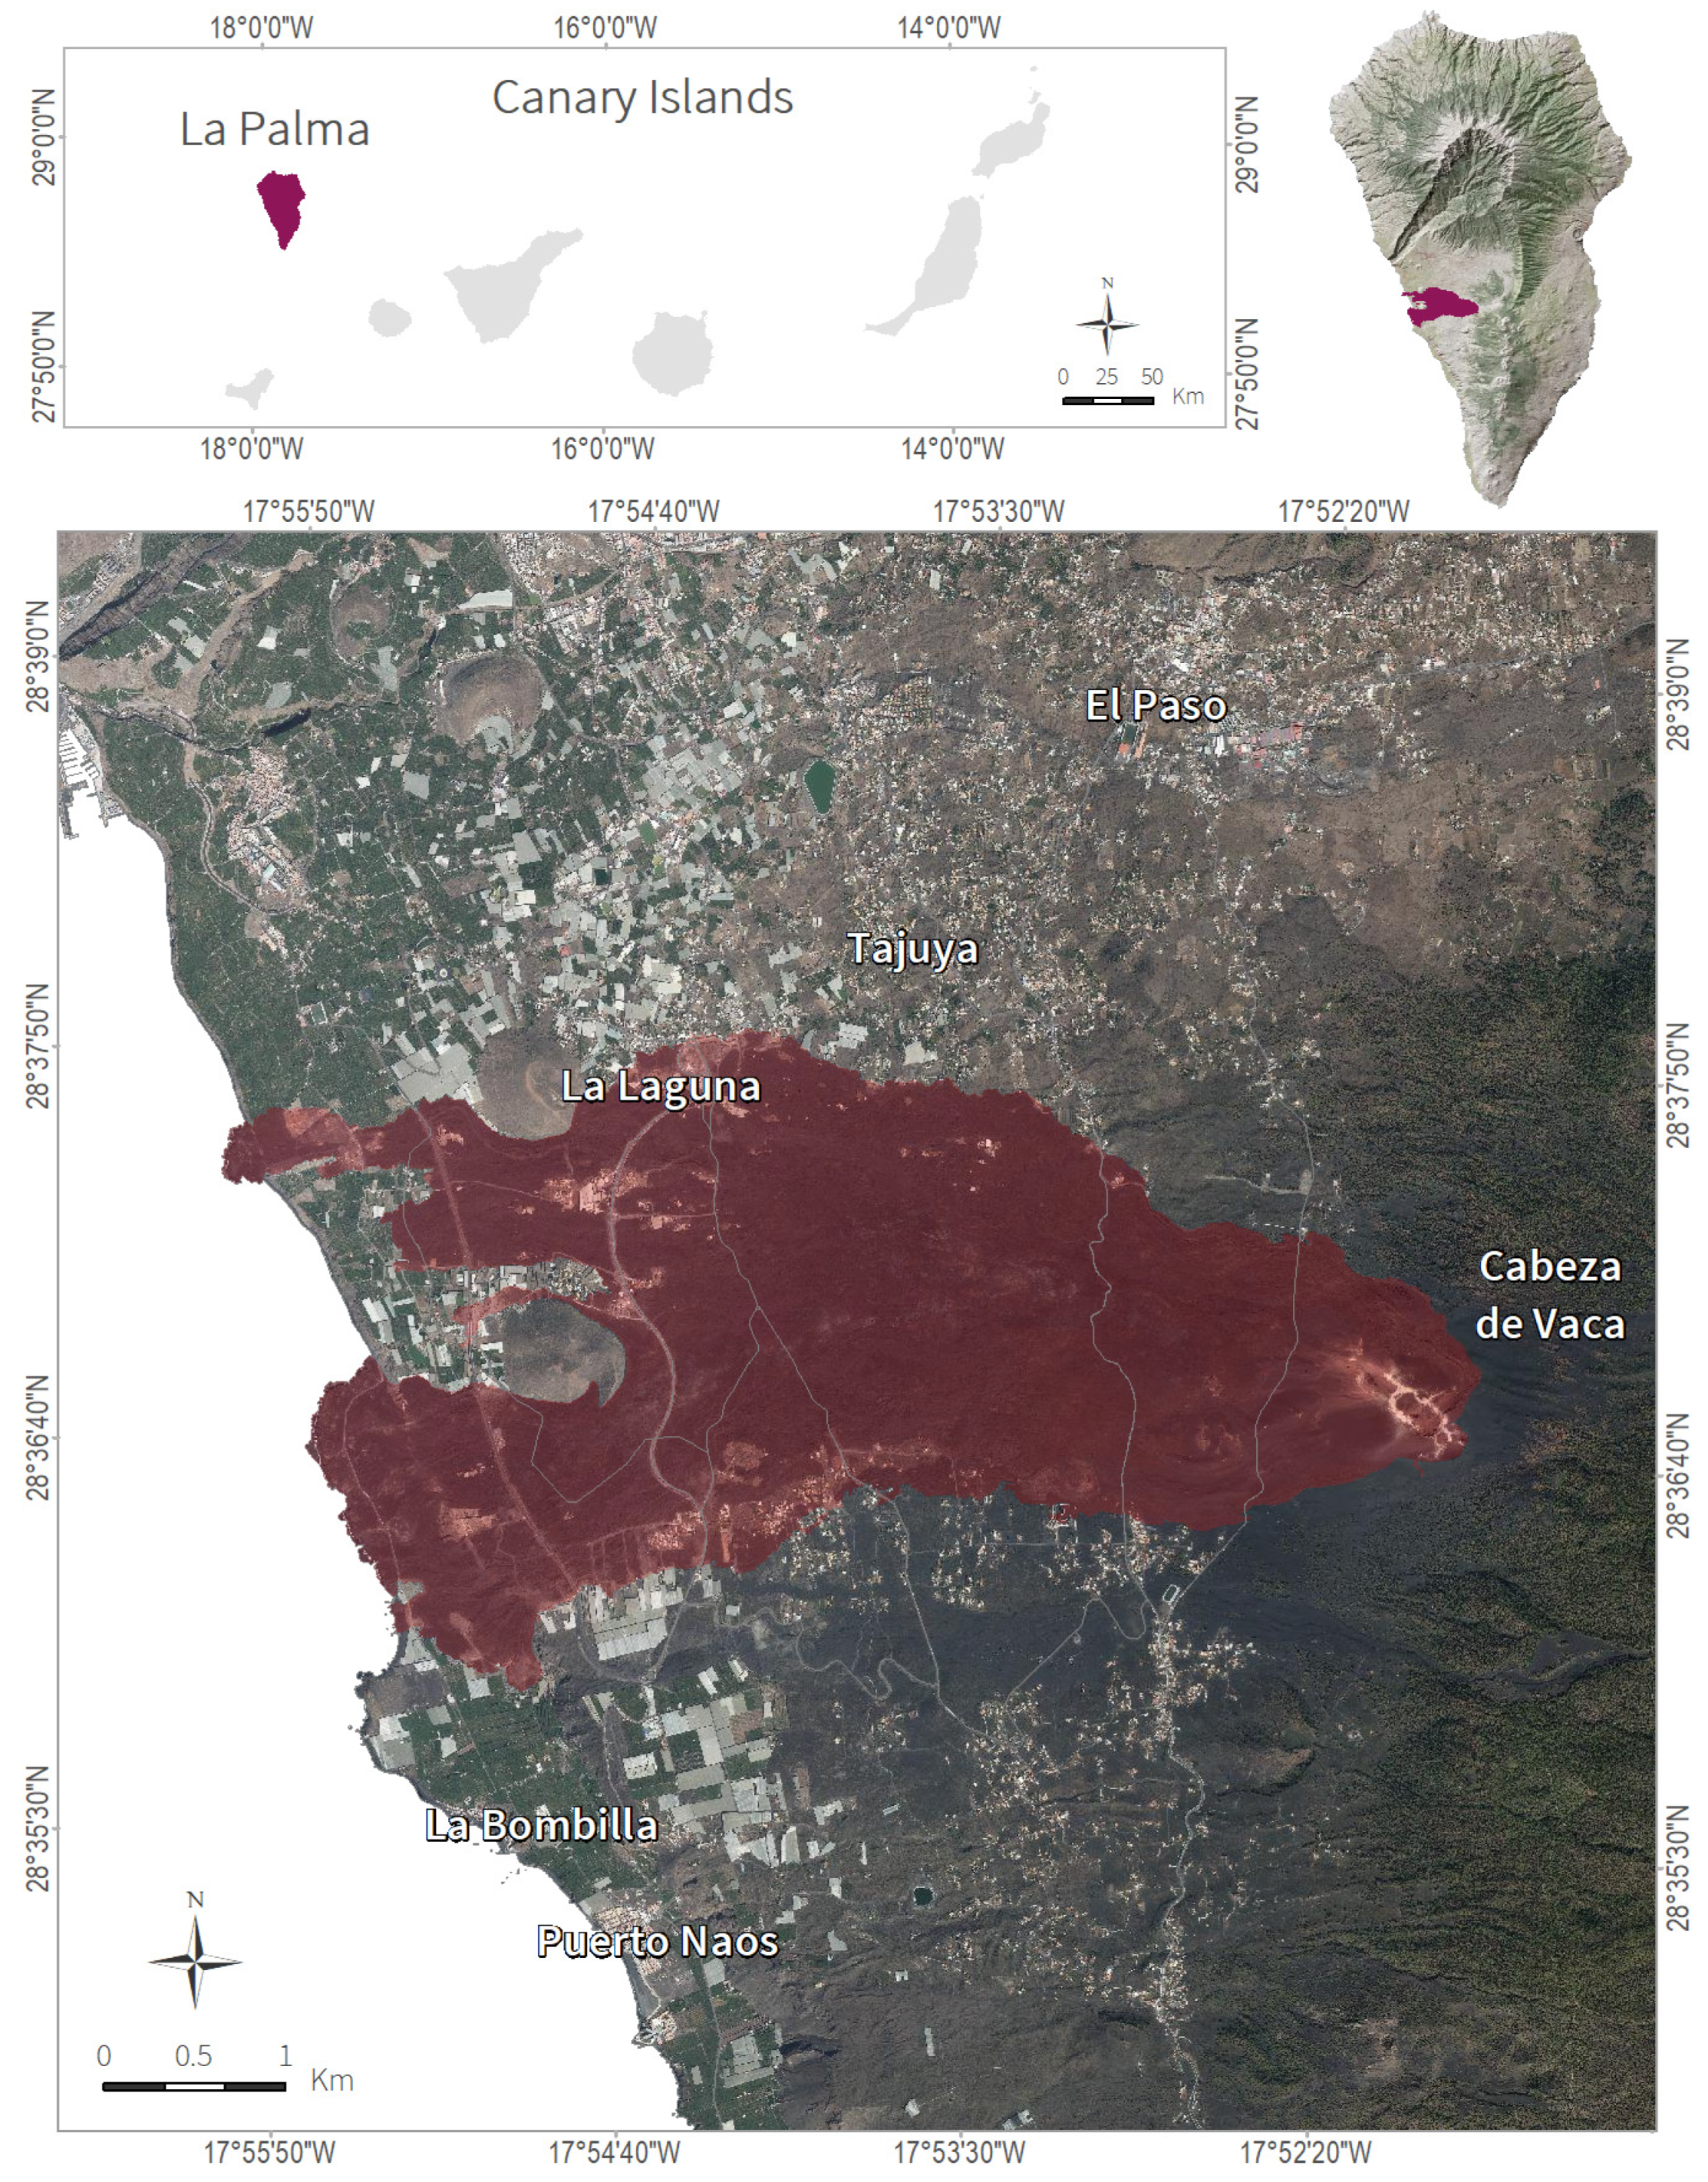
The Tajogaite volcanic eruption occurred on the west side of La Palma near the Cabeza de Vaca trail in the municipality of El Paso, on 19 September 2021 (
Figure 1), following 50 years of volcanic quiescence on the island. The eruption lasted for nearly three months, ceasing on 13 December 2021, resulting in the destruction of about 1700 buildings and the displacement of approximately 7000 people.
A total of 73.8 km of roads and 370 Ha of agricultural land were buried by lava flows, and 2988 buildings were affected. Damage to public and private property resulting from the eruption exceeded 842 M euros [
18], distributed as follows:
Damage to roads: 228 M euros.
Destruction of crops and associated production losses: 200 M euros.
Destruction of buildings: 165 M euros.
In addition, the eruption has caused economic stagnation in the affected areas, stemming from both material losses and the inability to access workplaces and business centers.
2. Geological Setting and Lava Flows Description
The 2021 eruption was characterized as a fissural basaltic eruption, predominantly exhibiting strombolian activity with occasional phreatomagmatic episodes [
4]. The magnitude of the eruption, according to the Volcanic Explosivity Index VEI [
19], has been classified as VEI 3 on a scale from 0 to 8 [
20].
The total estimated volume of material emitted in the eruption exceeded 200 M m
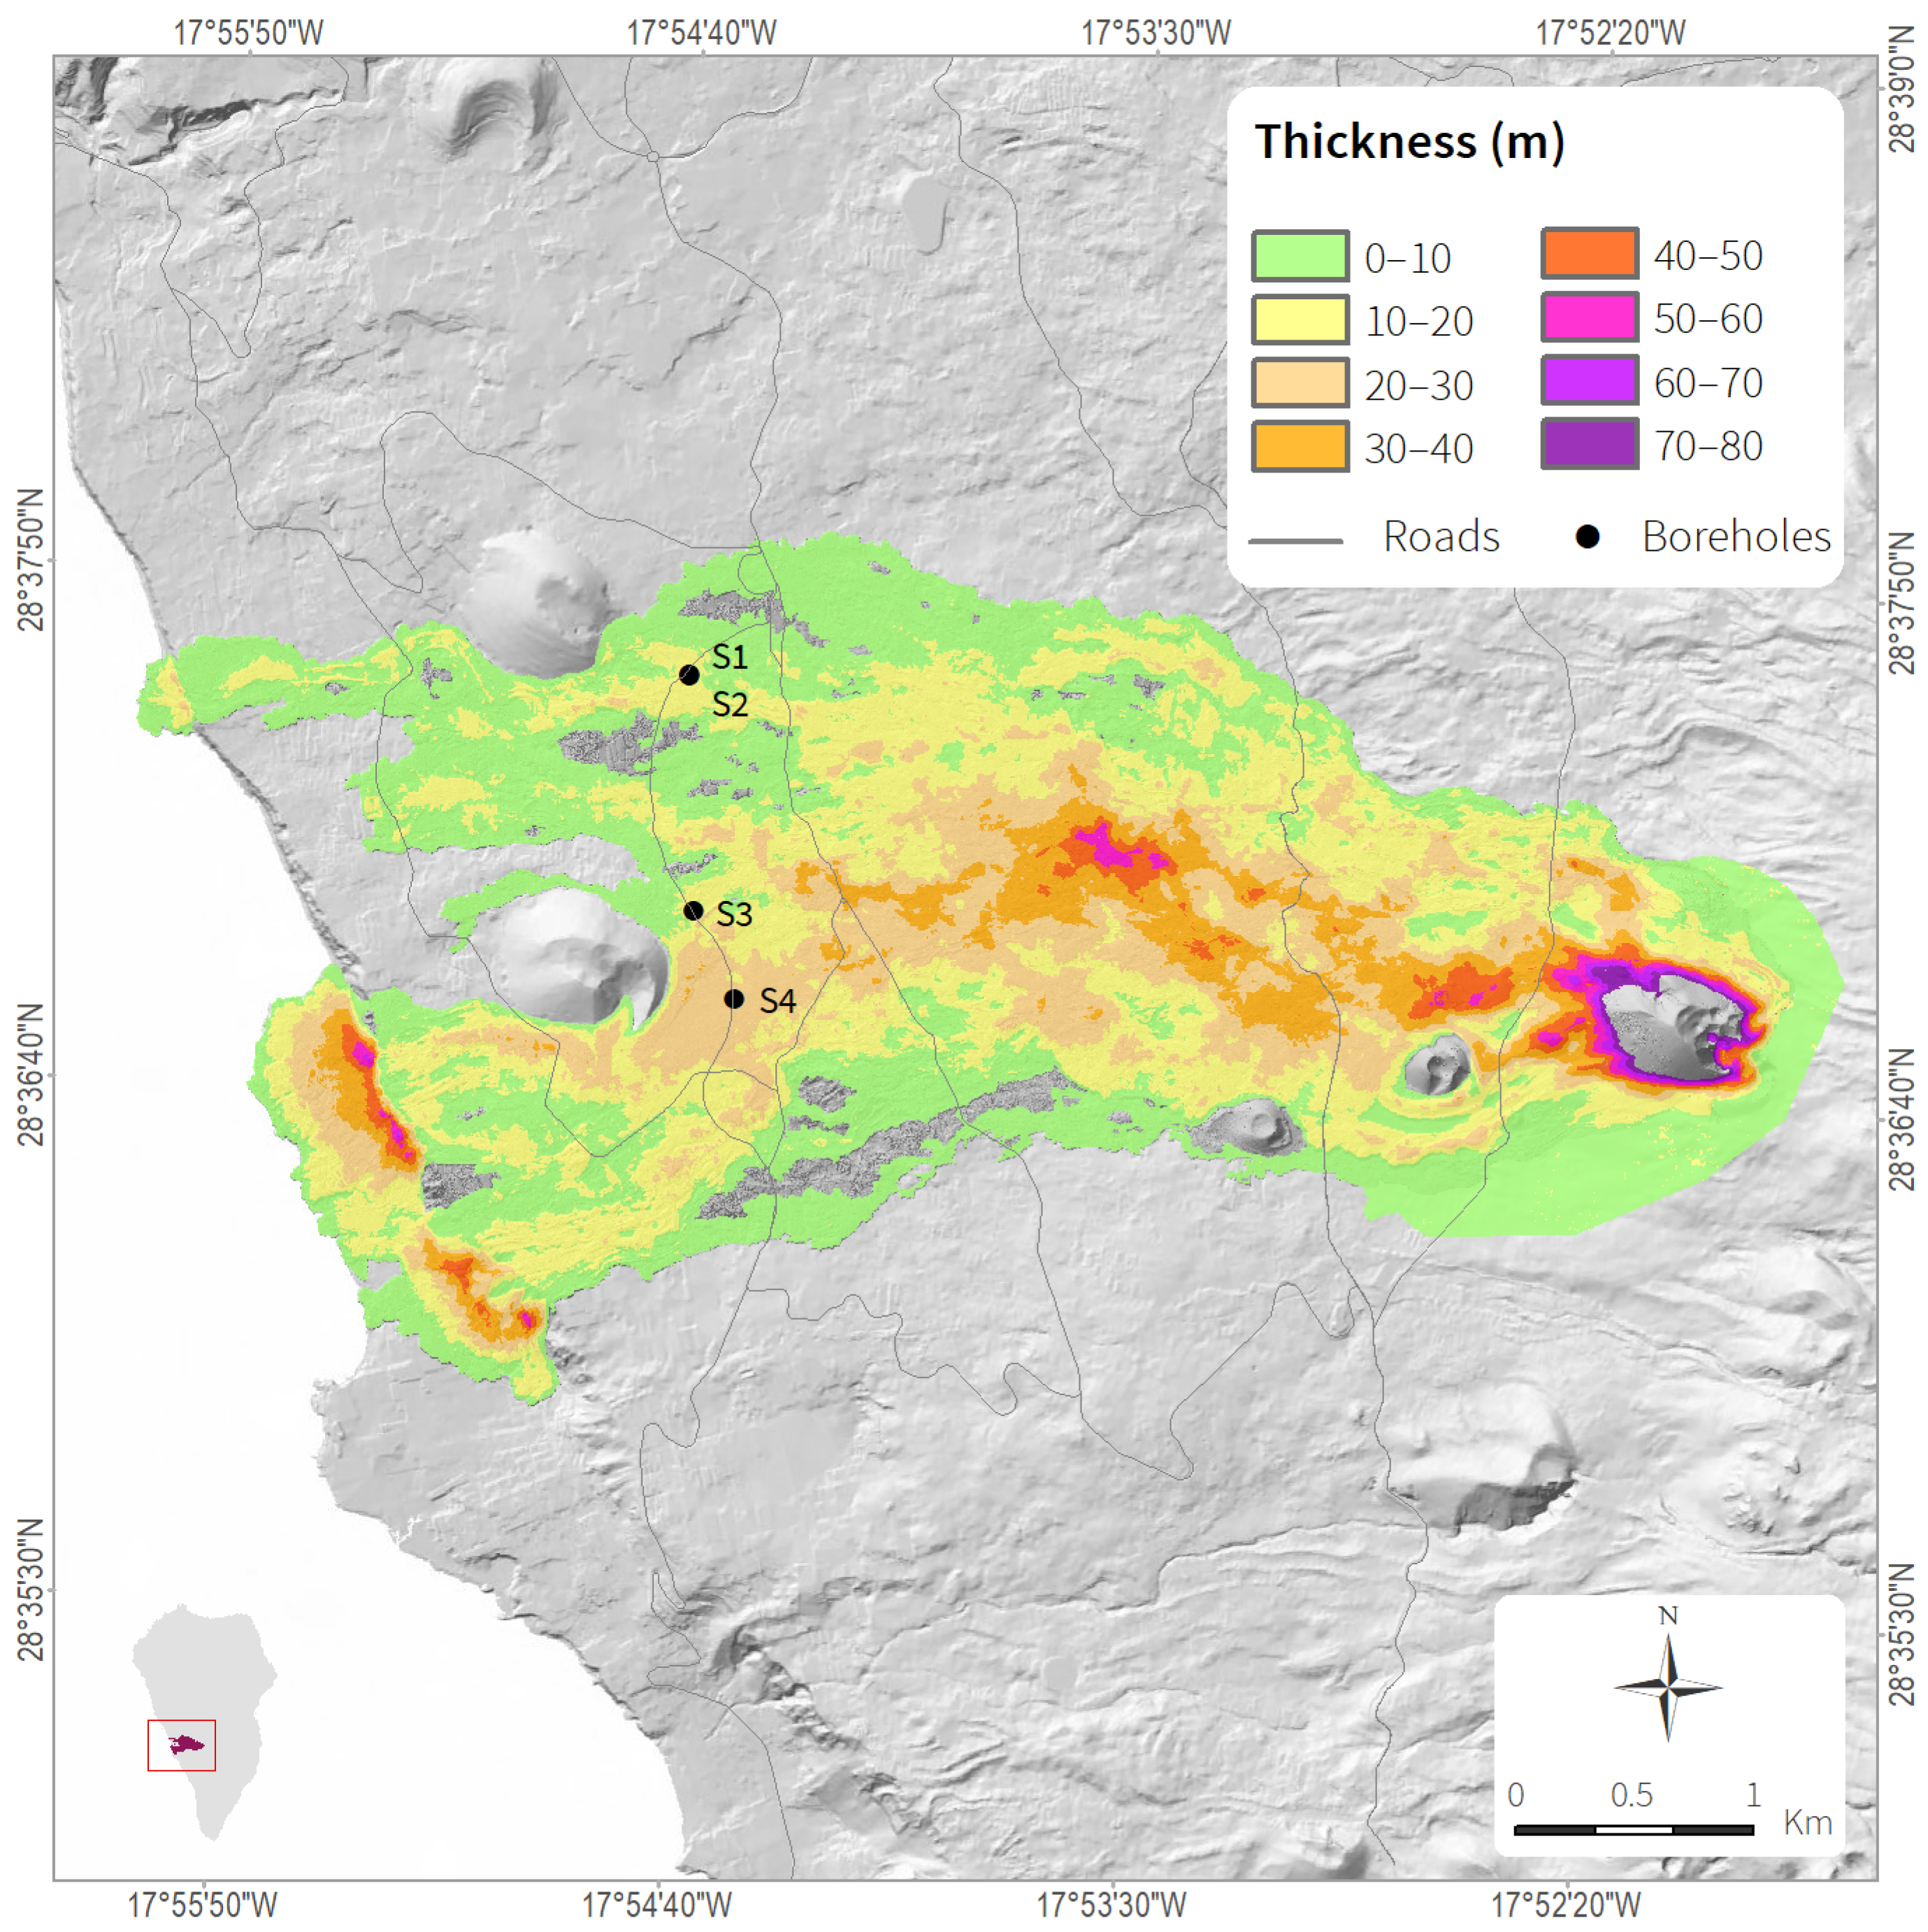
3. The extensive new lava field formed in the western part of the island covers an area of 1219 Ha. Approximately 67% of the lava reaches thicknesses of up to 15 m, 24% reaches 30 m, 7% reaches 45 m, and roughly 1.2% reaches thicknesses of up to 60 m. The estimated average thickness of the lava is 12 m, with a maximum of over 70 m (see
Section 3.1). This volume of lavas accumulated in just 85 days, the duration of the eruption from 19 September to 13 December 2021) (
Figure 2).
The two main types of basaltic lavas, aa and pahoehoe, were emitted, with block lavas and accretionary lava balls also identified [
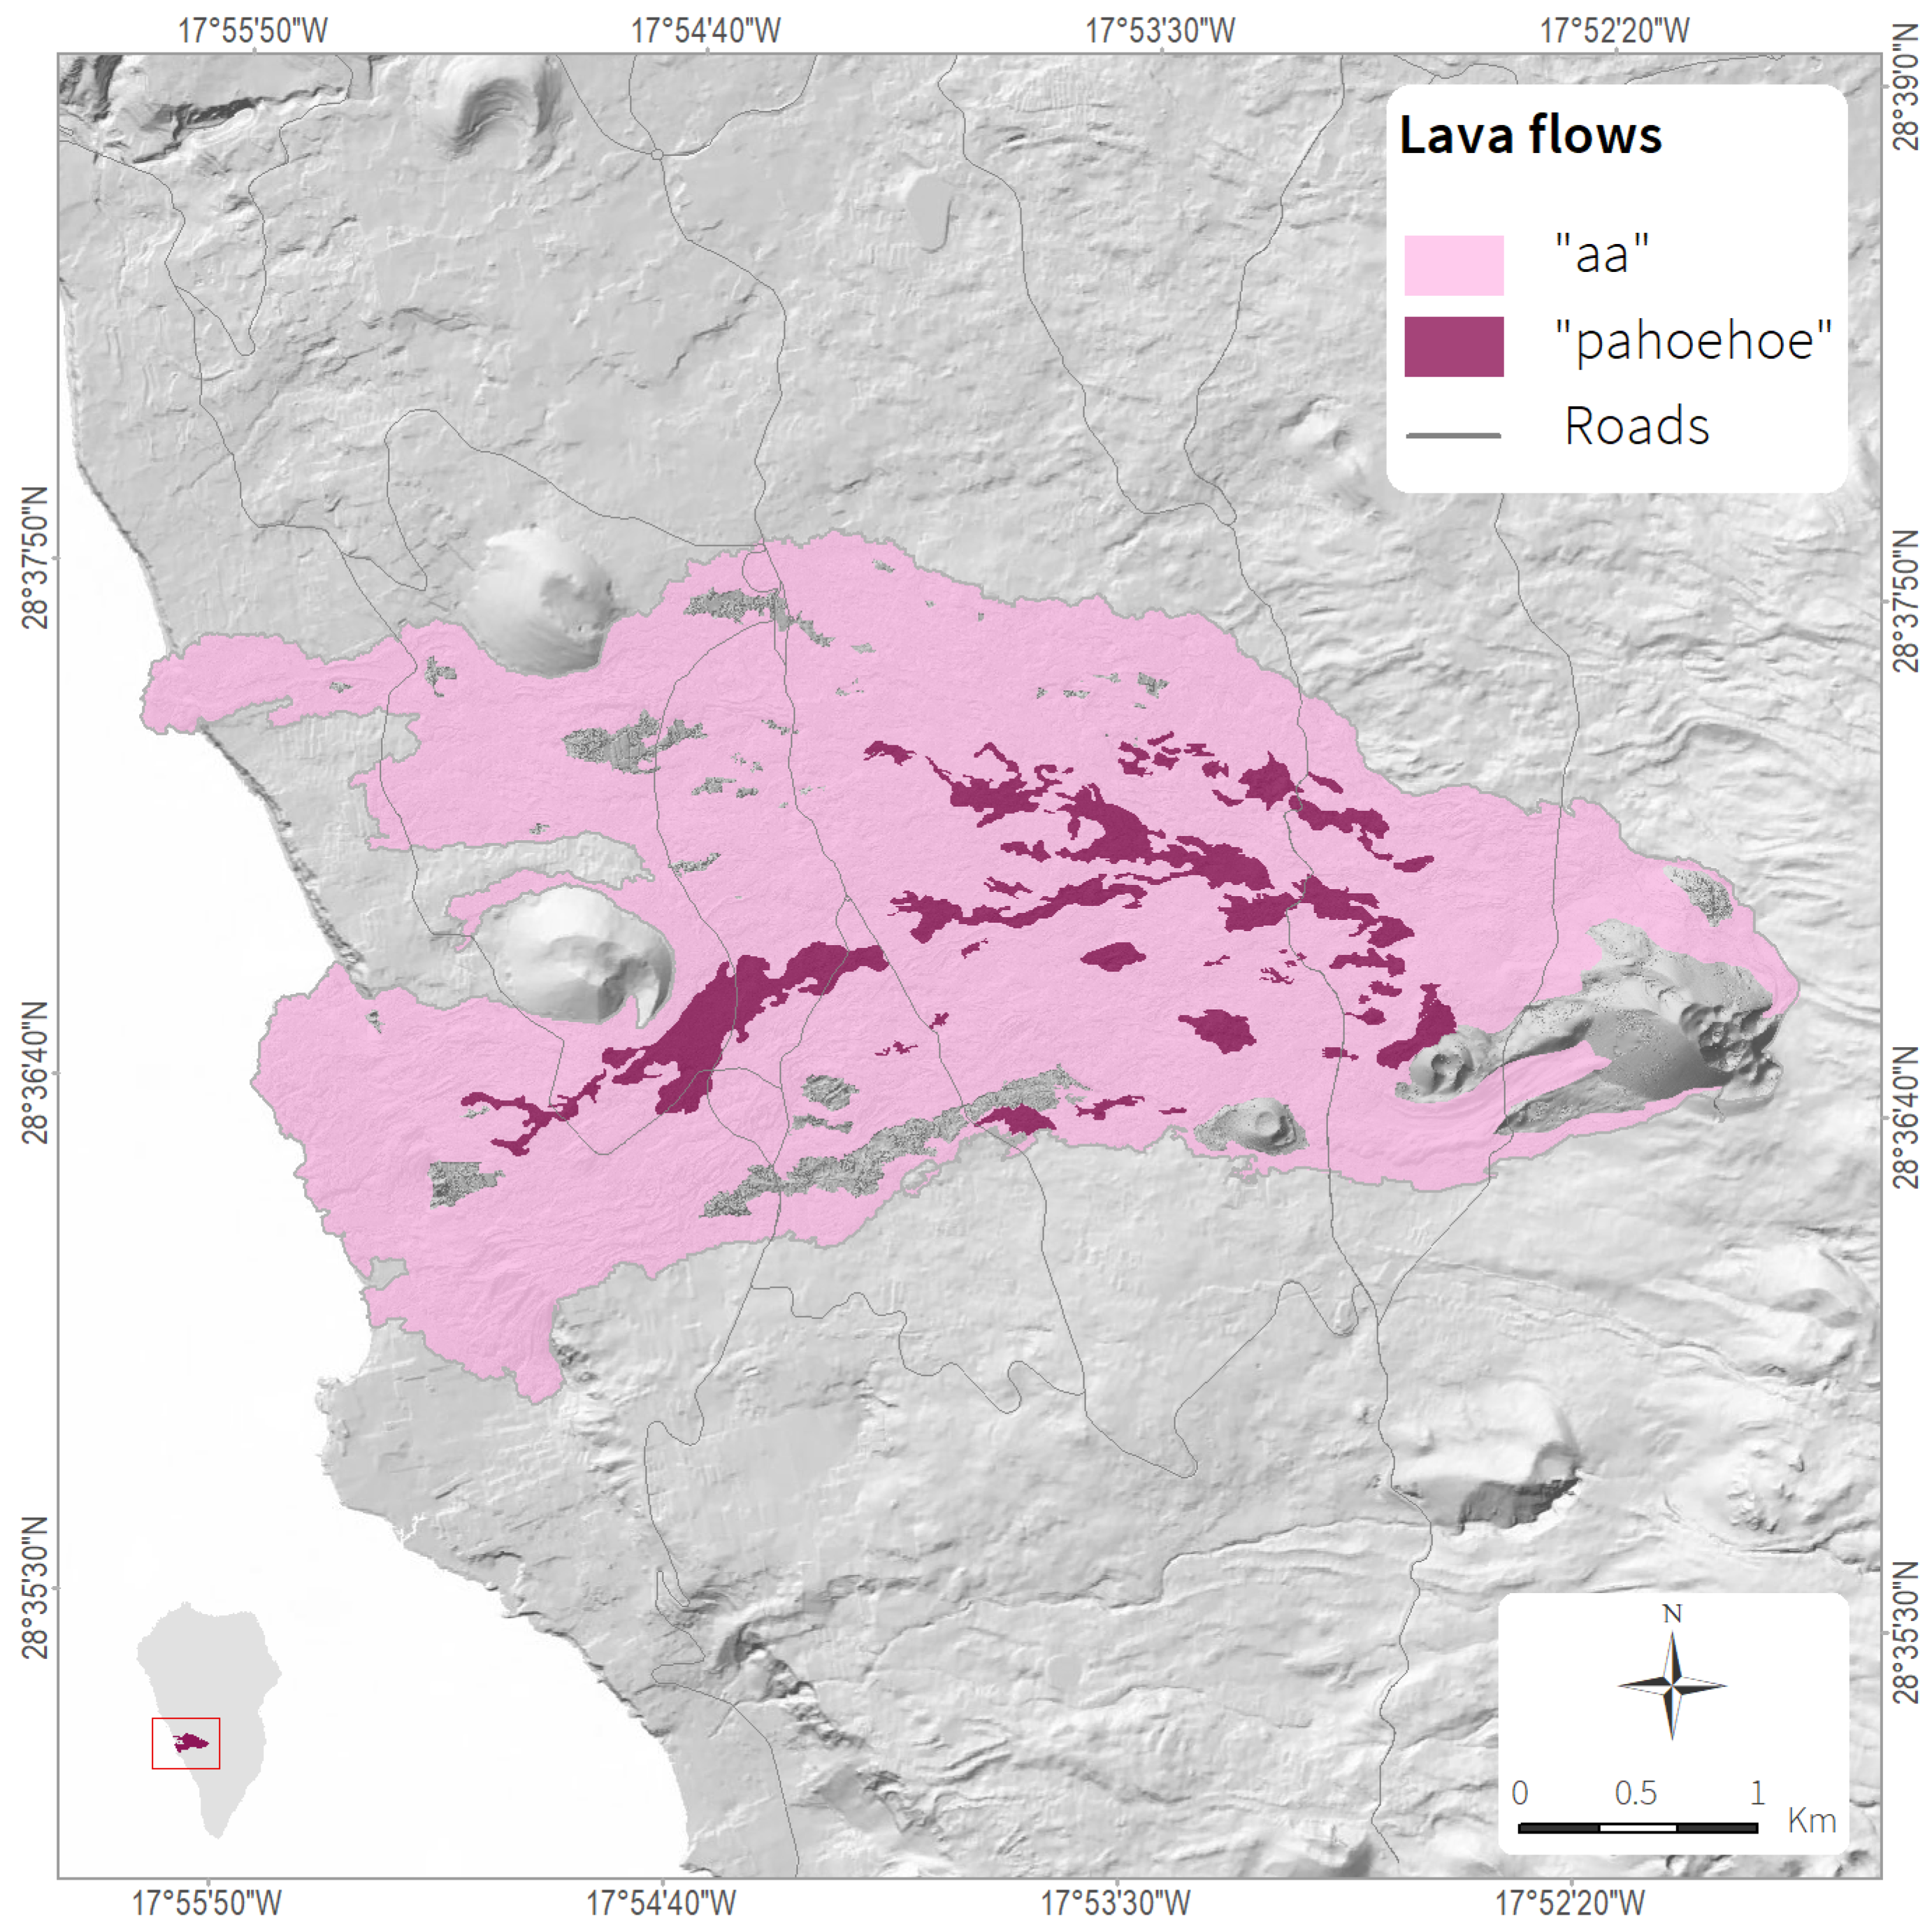
21]. Aa lavas predominate over the pahoehoe lavas, and their percentages in surface area (
Figure 3) have been estimated: 91.2% aa lavas (10,653,860 m
2) and 8.4% pahoehoe (979,426 m
2). The main characteristics of the two types of lava have been described by [
15,
22,
23]. The Tajogaite lava flows present the following characteristics:
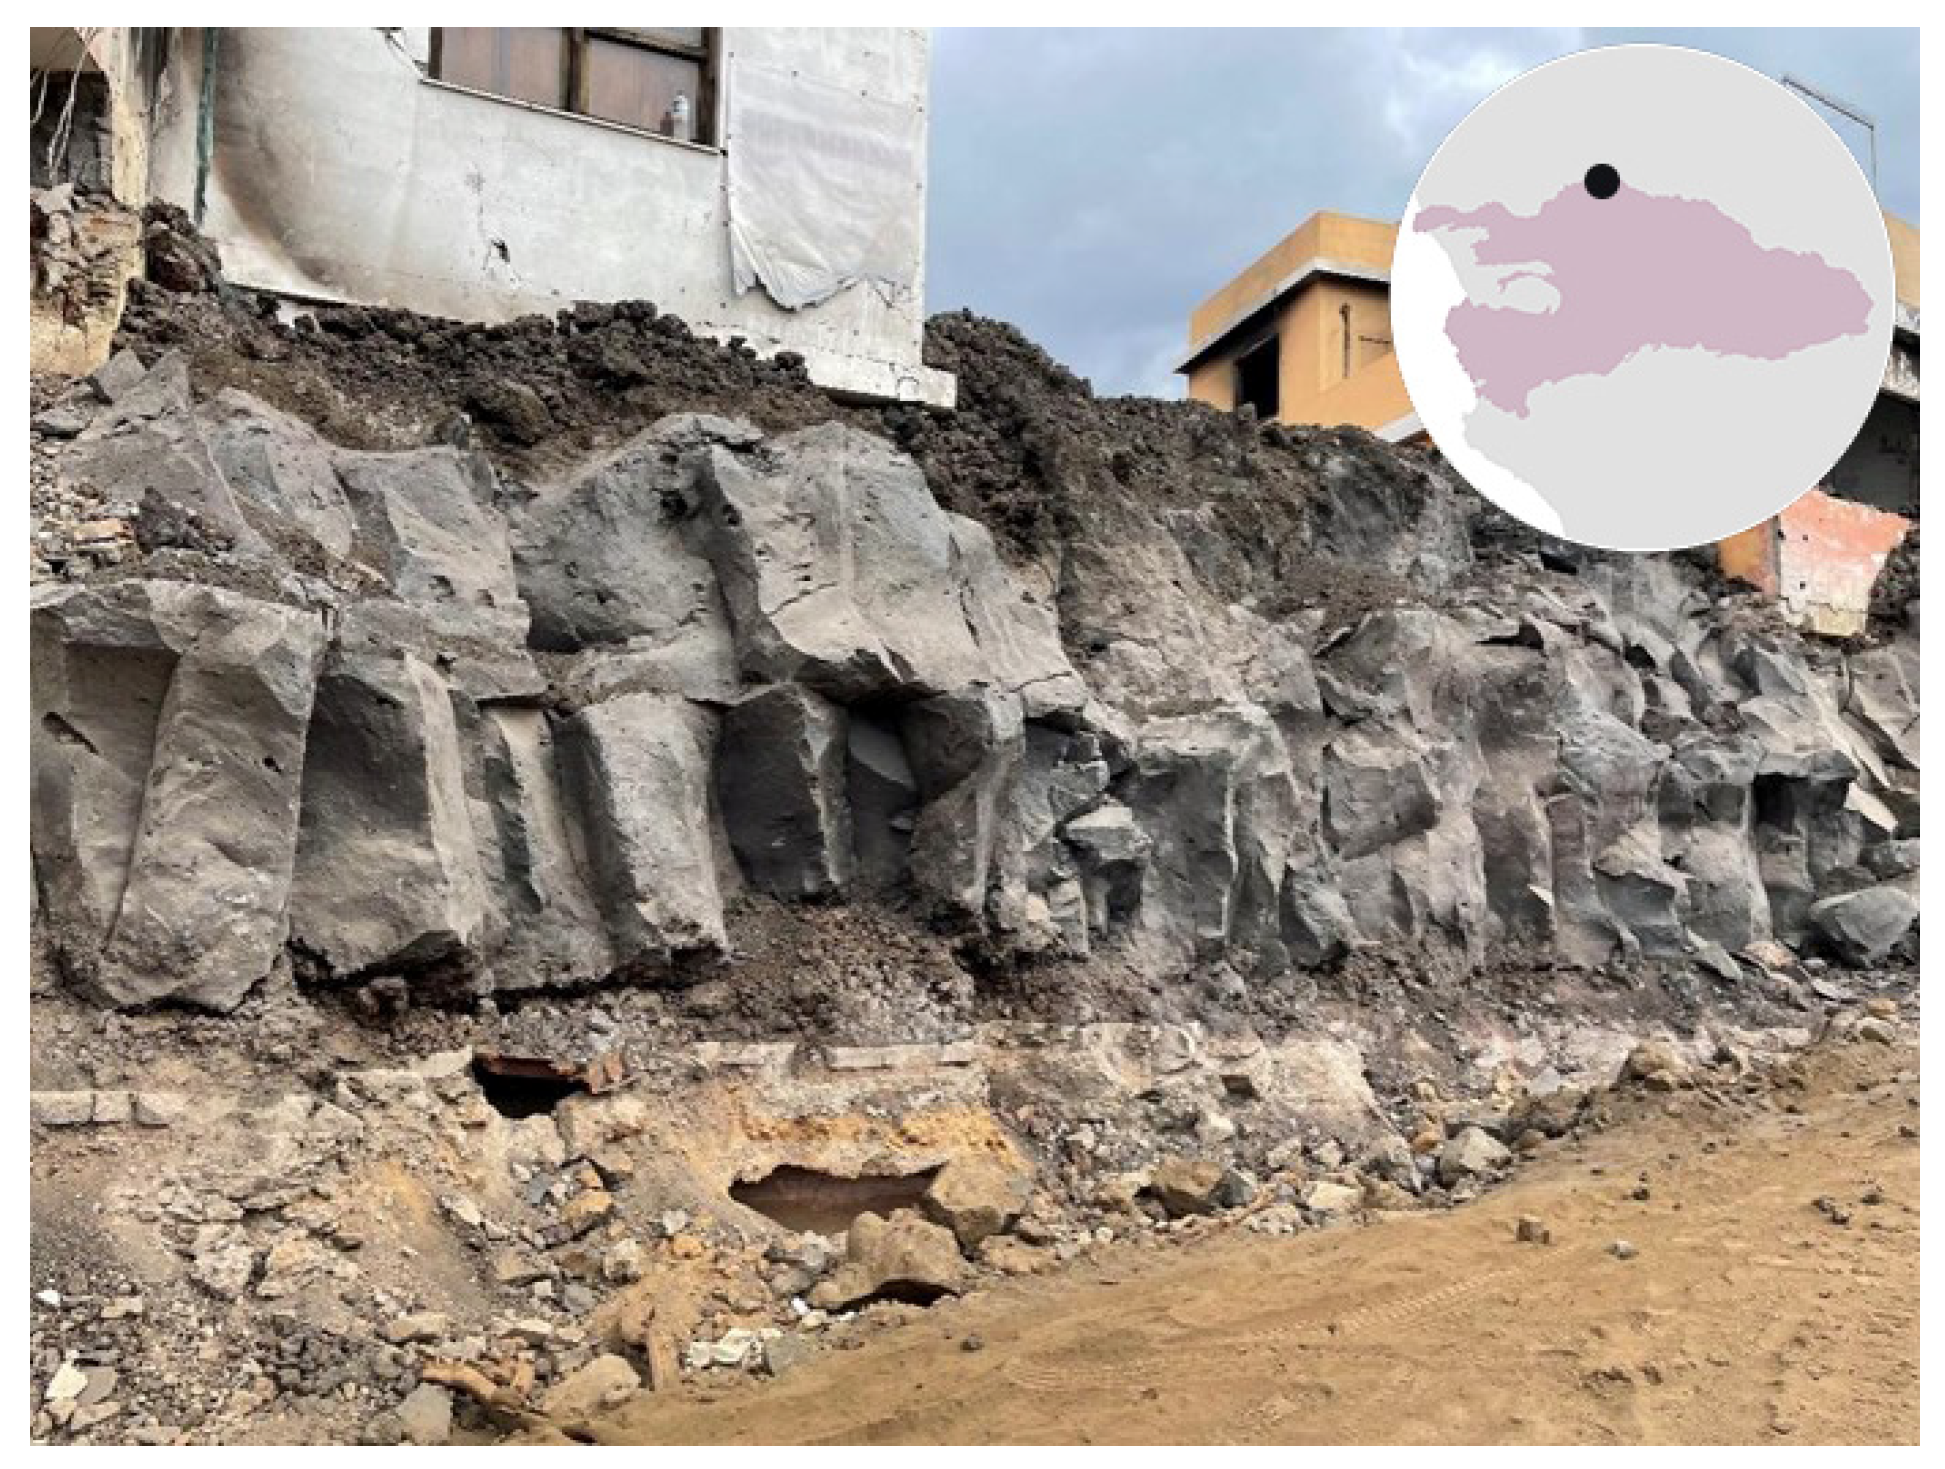
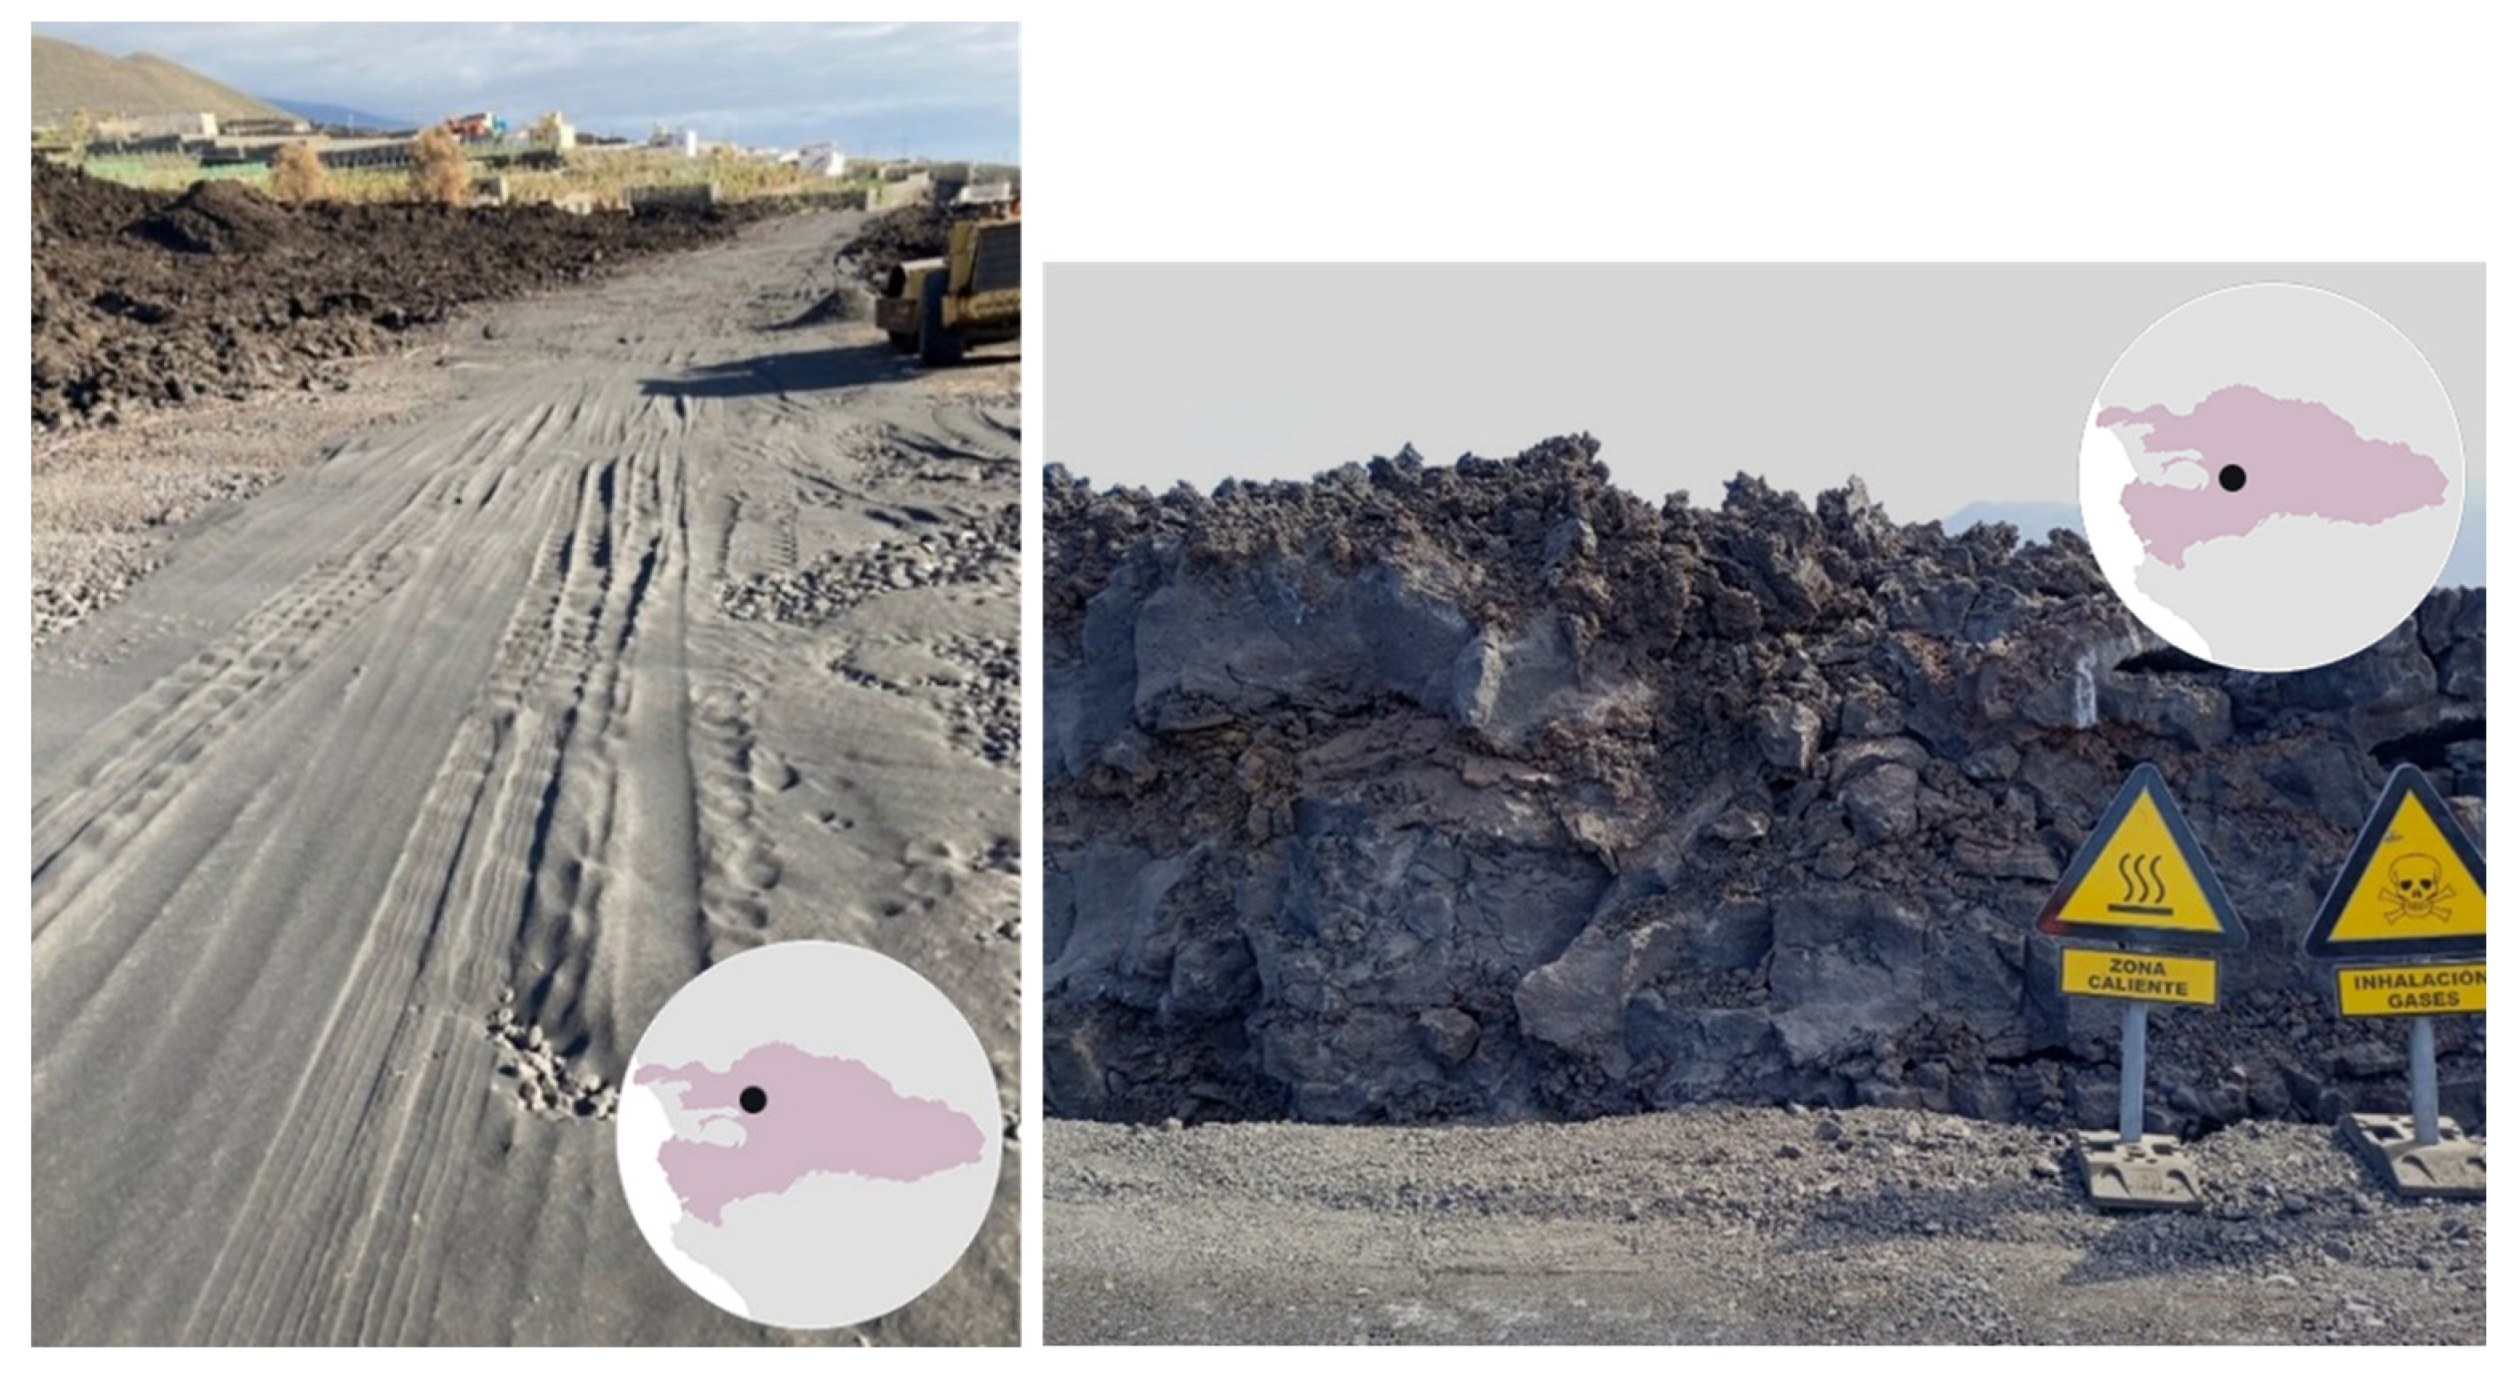
Aa lavas are formed from magmas with higher viscosity compared to pahoehoe lavas, flow more slowly, and have a markedly different appearance. Their surface is extremely rough or even spiny. A vertical section of aa lava consists of an inner core of dense basalts marked by a network of joints or fissures, formed by contraction as the molten material cools and solidifies; this core is bounded below and above by irregular scoriaceous crusts or bands (
Figure 4). When multiple aa lavas stack upon each other, the uppermost layer of scoria mixes with those at the base of the melt immediately above, resulting in an alternation of basalts and scoria autobreccia.
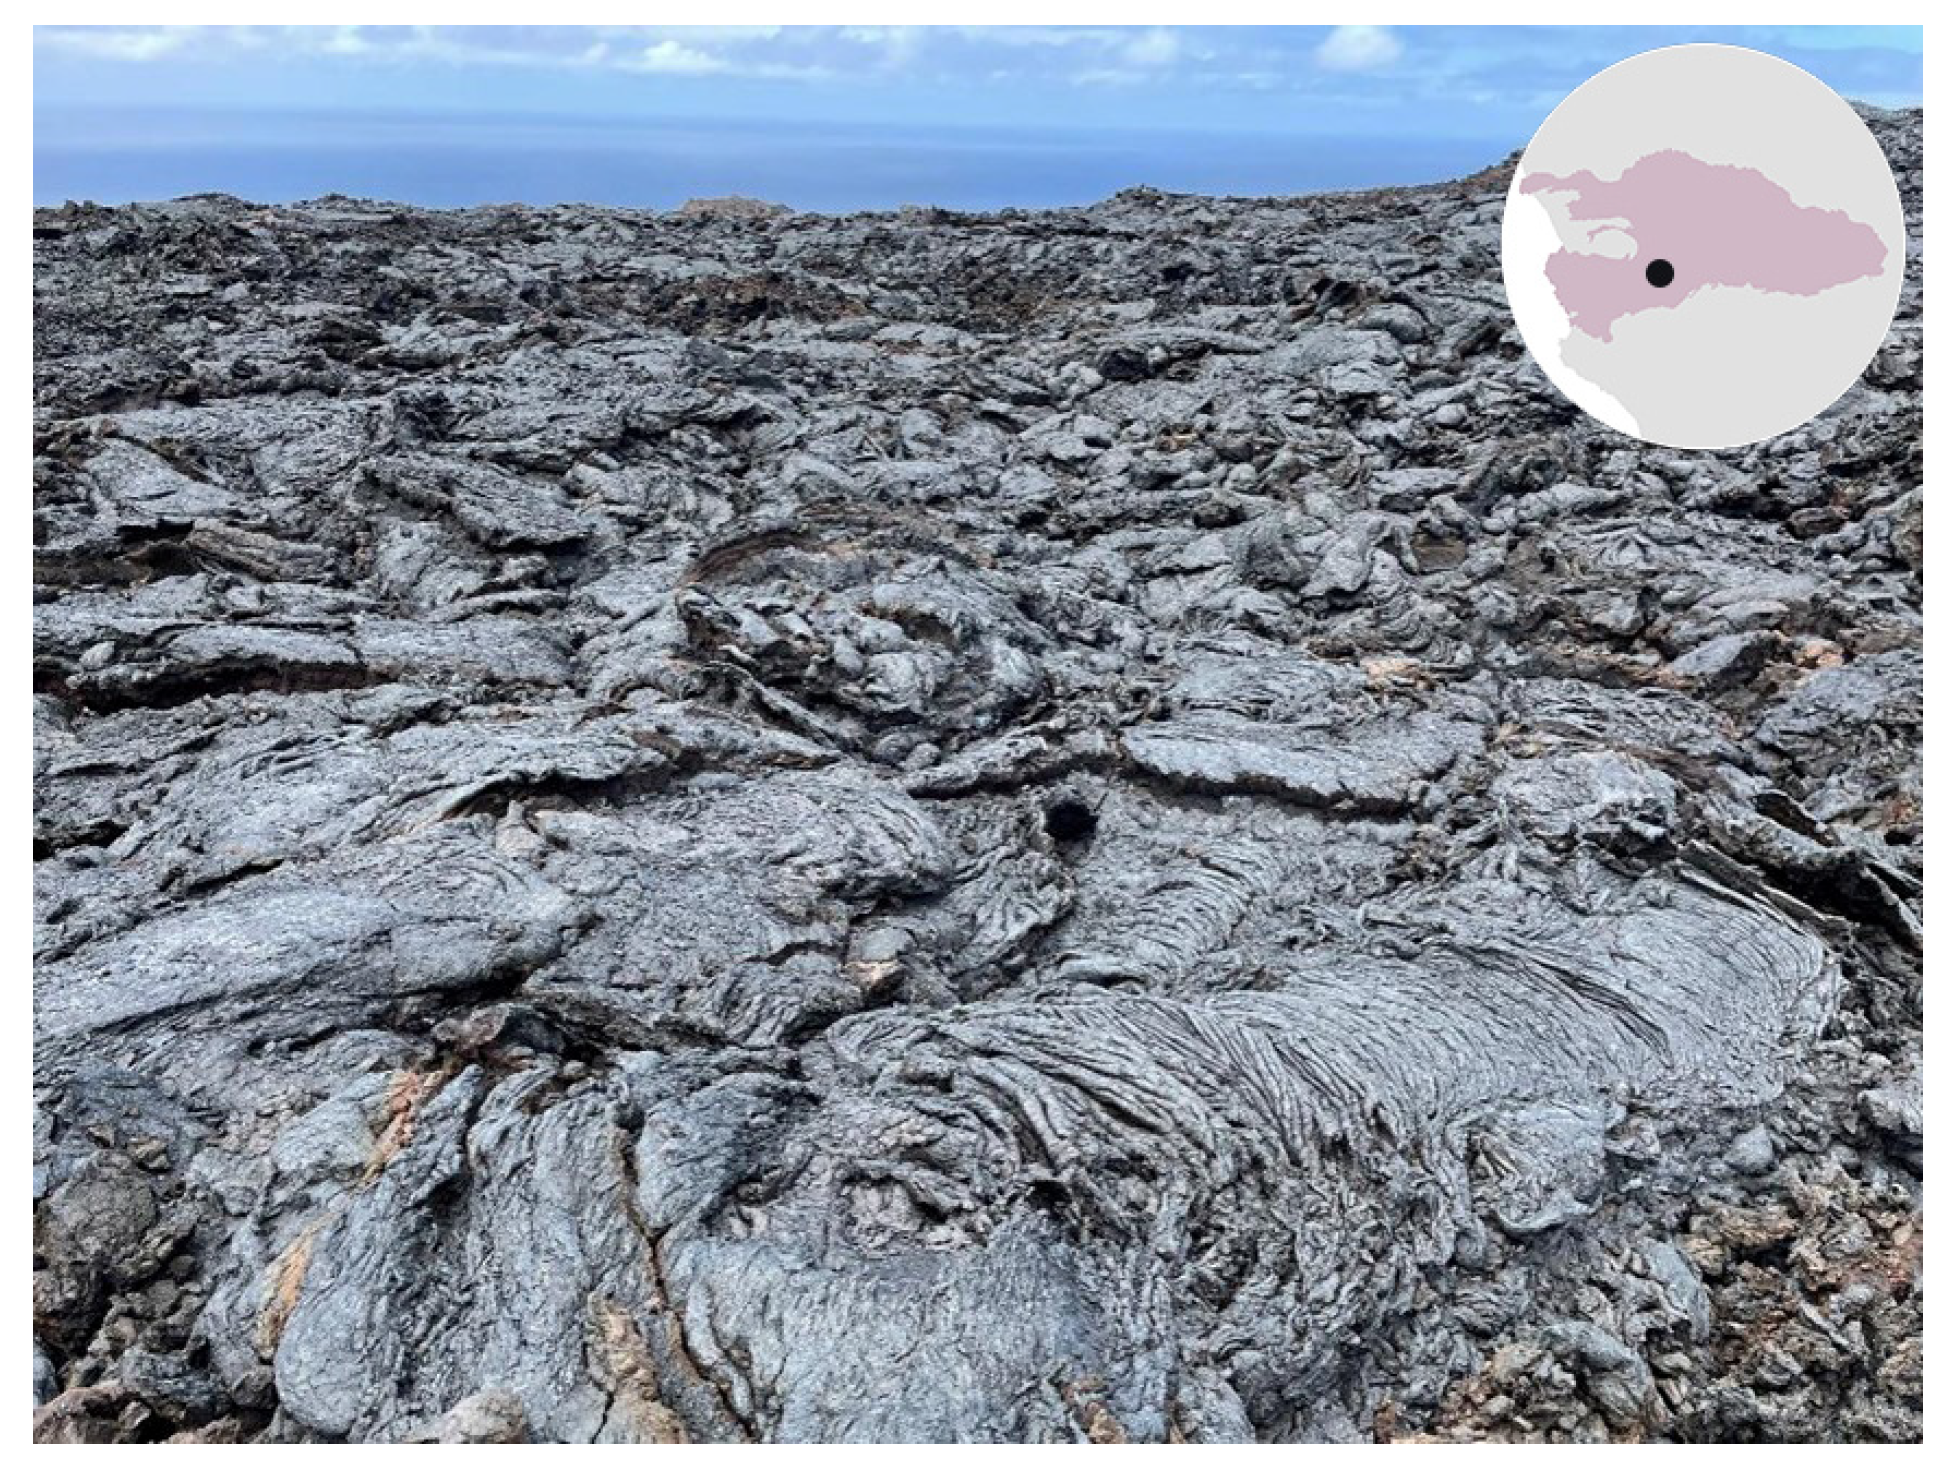
Pahoehoe lavas are characterized by a smooth and undulating surface, forming cooling ropes (
Figure 5). This type of lava contains numerous vesicles and is marked by the presence of volcanic cavities or caves, which can extend kilometers in length with diameters reaching several meters. In situ investigations carried out on these materials have identified several of these volcanic caves (see
Section 3.2).
Figure 2.
Aerial views before and after the 2021 volcanic eruption (Source: Google Earth).
Figure 2.
Aerial views before and after the 2021 volcanic eruption (Source: Google Earth).
Figure 3.
Type of lava flows’ distribution from the La Palma 2021 eruption.
Figure 3.
Type of lava flows’ distribution from the La Palma 2021 eruption.
Figure 4.
Aa lava flow section showing upper and lower scoriaceous crusts (dark brown) surrounding dense aa core (gray). The black point inside the circle indicates the site where the photo was taken on the lava field (see
Figure 3).
Figure 4.
Aa lava flow section showing upper and lower scoriaceous crusts (dark brown) surrounding dense aa core (gray). The black point inside the circle indicates the site where the photo was taken on the lava field (see
Figure 3).
Figure 5.
Pahoehoe lava flows showing cooling ropes from the La Palma 2021 eruption. The black point inside the circle indicates the site where the photo was taken on the lava field (see
Figure 3).
Figure 5.
Pahoehoe lava flows showing cooling ropes from the La Palma 2021 eruption. The black point inside the circle indicates the site where the photo was taken on the lava field (see
Figure 3).
4. Cooling Rates of Lava Flows’ Estimation
The cooling rates of lava flows have been estimated in certain volcanoes around the world, such as Mauna Loa and Kilauea in Hawaii [
7,
24], Okmok volcano in Alaska [
10], Holuhraun volcano in Iceland [
25], and Lonquima volcano in Chile [
26]. However, these authors did not provide validation results or applicable methodologies for the La Palma eruption; consequently, we had to develop a new methodology based on in situ data and reconstruction requirements (
Section 5).
4.1. Cooling Models
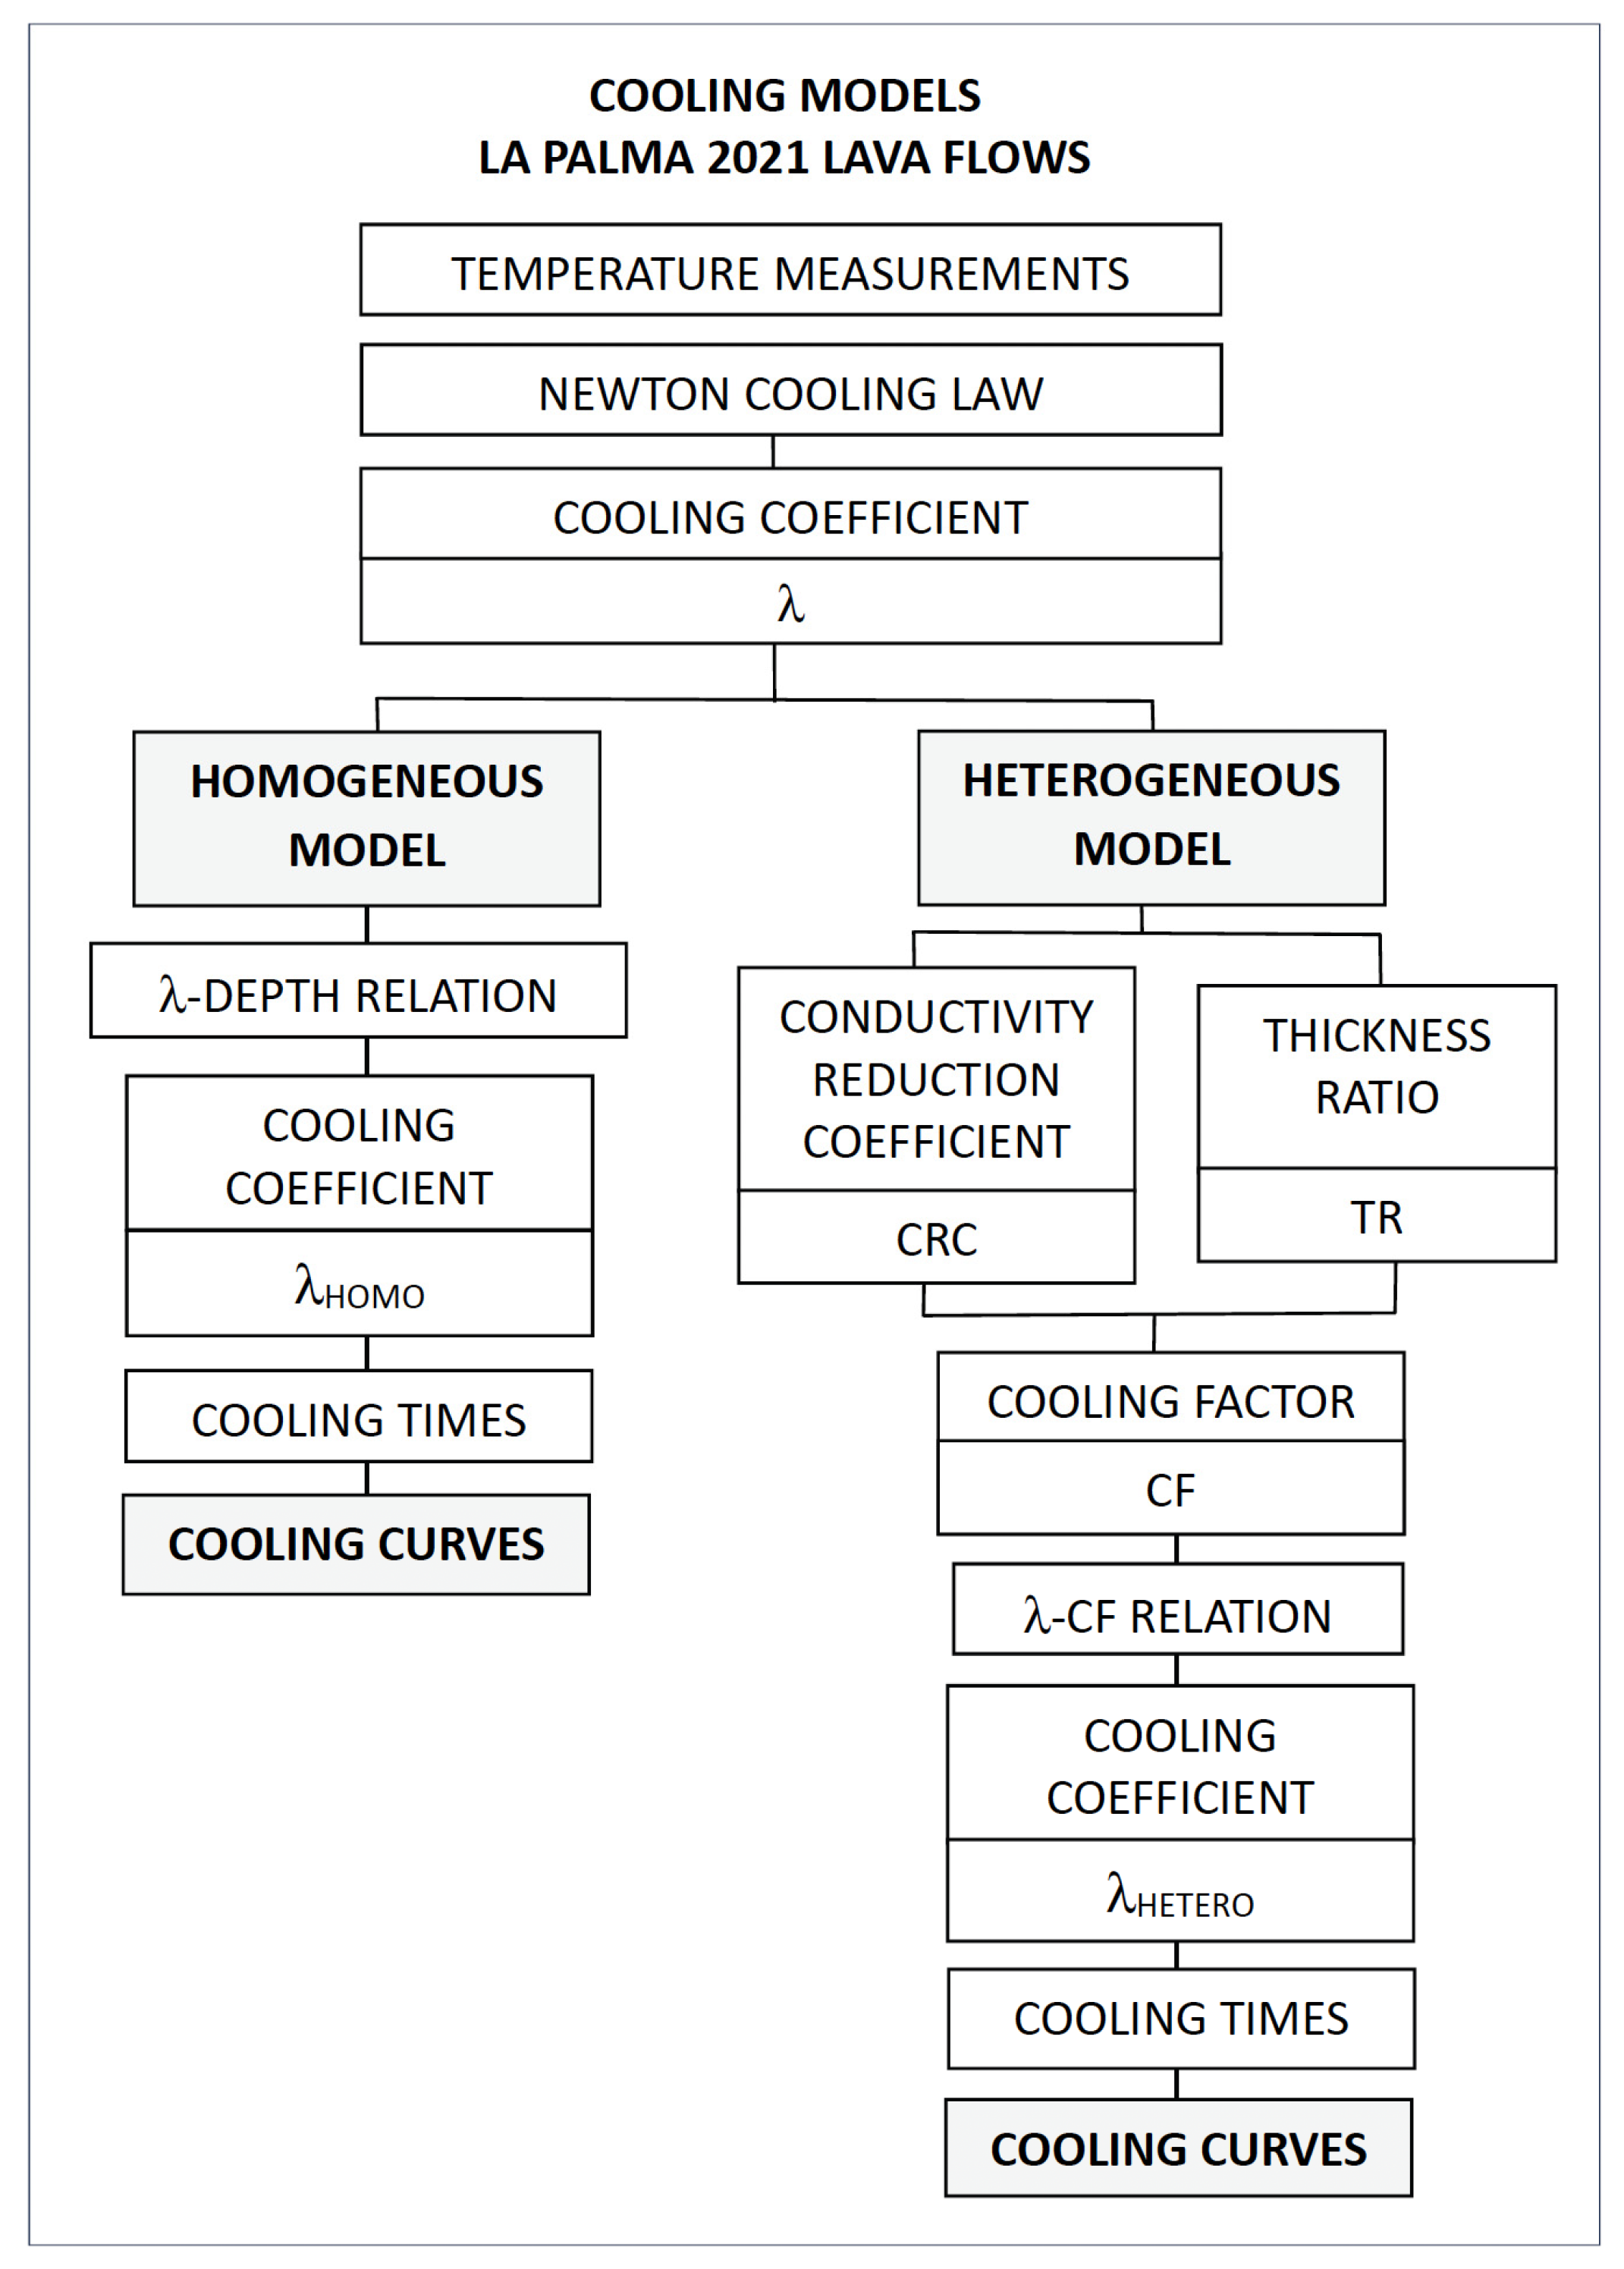
To estimate the cooling times of the lava flows, two cooling models have been developed: the homogeneous model and the heterogeneous model. In the first one, all the lavas are considered as a single medium composed of the same material and formed by isotropic and homogeneous basaltic lavas and, therefore, with consistent physicochemical properties, without considering the total thickness of the lava flow. On the other hand, the second model considers a heterogeneous and anisotropic medium, characterized by different types of lithologies, and it takes into account the various layers of lavas, their thickness, composition, and thermal conductivity, as well as the total thickness of the entire lava flow.
The homogeneous model assumes an isotropic material and does not account for variations in lava flow thickness, which limits its applicability to regions where the thickness is above approximately 15 m.
The heterogeneous model attempts to incorporate lithology and thermal properties, allowing us to include pahoehoe lavas. However, this model also has the same thickness limitation (it is less applicable in regions where the lava flow thickness is below approximately 15 m). Additionally, it requires detailed lithological data, necessitating boreholes for accurate application. As more borehole data become available in future studies, we anticipate that the model will better align with observed data.
The two cooling models, homogeneous and heterogeneous, are based on Newton’s Cooling Law (1792), recently reviewed by Maruyama and Moriya [
27], which defines the cooling coefficient (
λ), which relates the time it takes for a body to cool from an initial temperature to a lower one. In our study area, an initial temperature of 1100 °C and a final temperature of 20 °C were considered, the latter corresponding to the average surface air temperature.
The cooling coefficient is expressed by the following differential equation, indicating the cooling rate of the body under consideration:
where
T is the temperature of the body under analysis (variable), t is the time, and
Tamb is the air temperature. The minus sign indicates the natural process of temperature decay that a body undergoes when it is at a higher temperature than the air temperature. The cooling coefficient is a constant parameter whose dimension is the inverse of time (s
−1 in SI), i.e., synonymous with velocity, so that the cooling coefficient can be considered as a cooling rate. If the air temperature is assumed to be constant, Expression (1) can be reduced to the following:
Equations (4) and (5) are equivalent, with Expression (5) being the one used to estimate the cooling coefficient. It must be taken into account that both C and
τ are constants, so both values have been calculated applying an Initial Values Problem solution, in which the initial temperature is assumed to be known, i.e., when t = 0. Since in this case the exponential model has been applied,
τ has been calculated by means of the following expression:
where (8) is the equation defining the cooling coefficient. The initial cooling time of the lava flows has been taken as the time corresponding to the end of the eruption (23 December 2021).
4.2. Cooling Coefficients Estimated from Newton’s Cooling Law
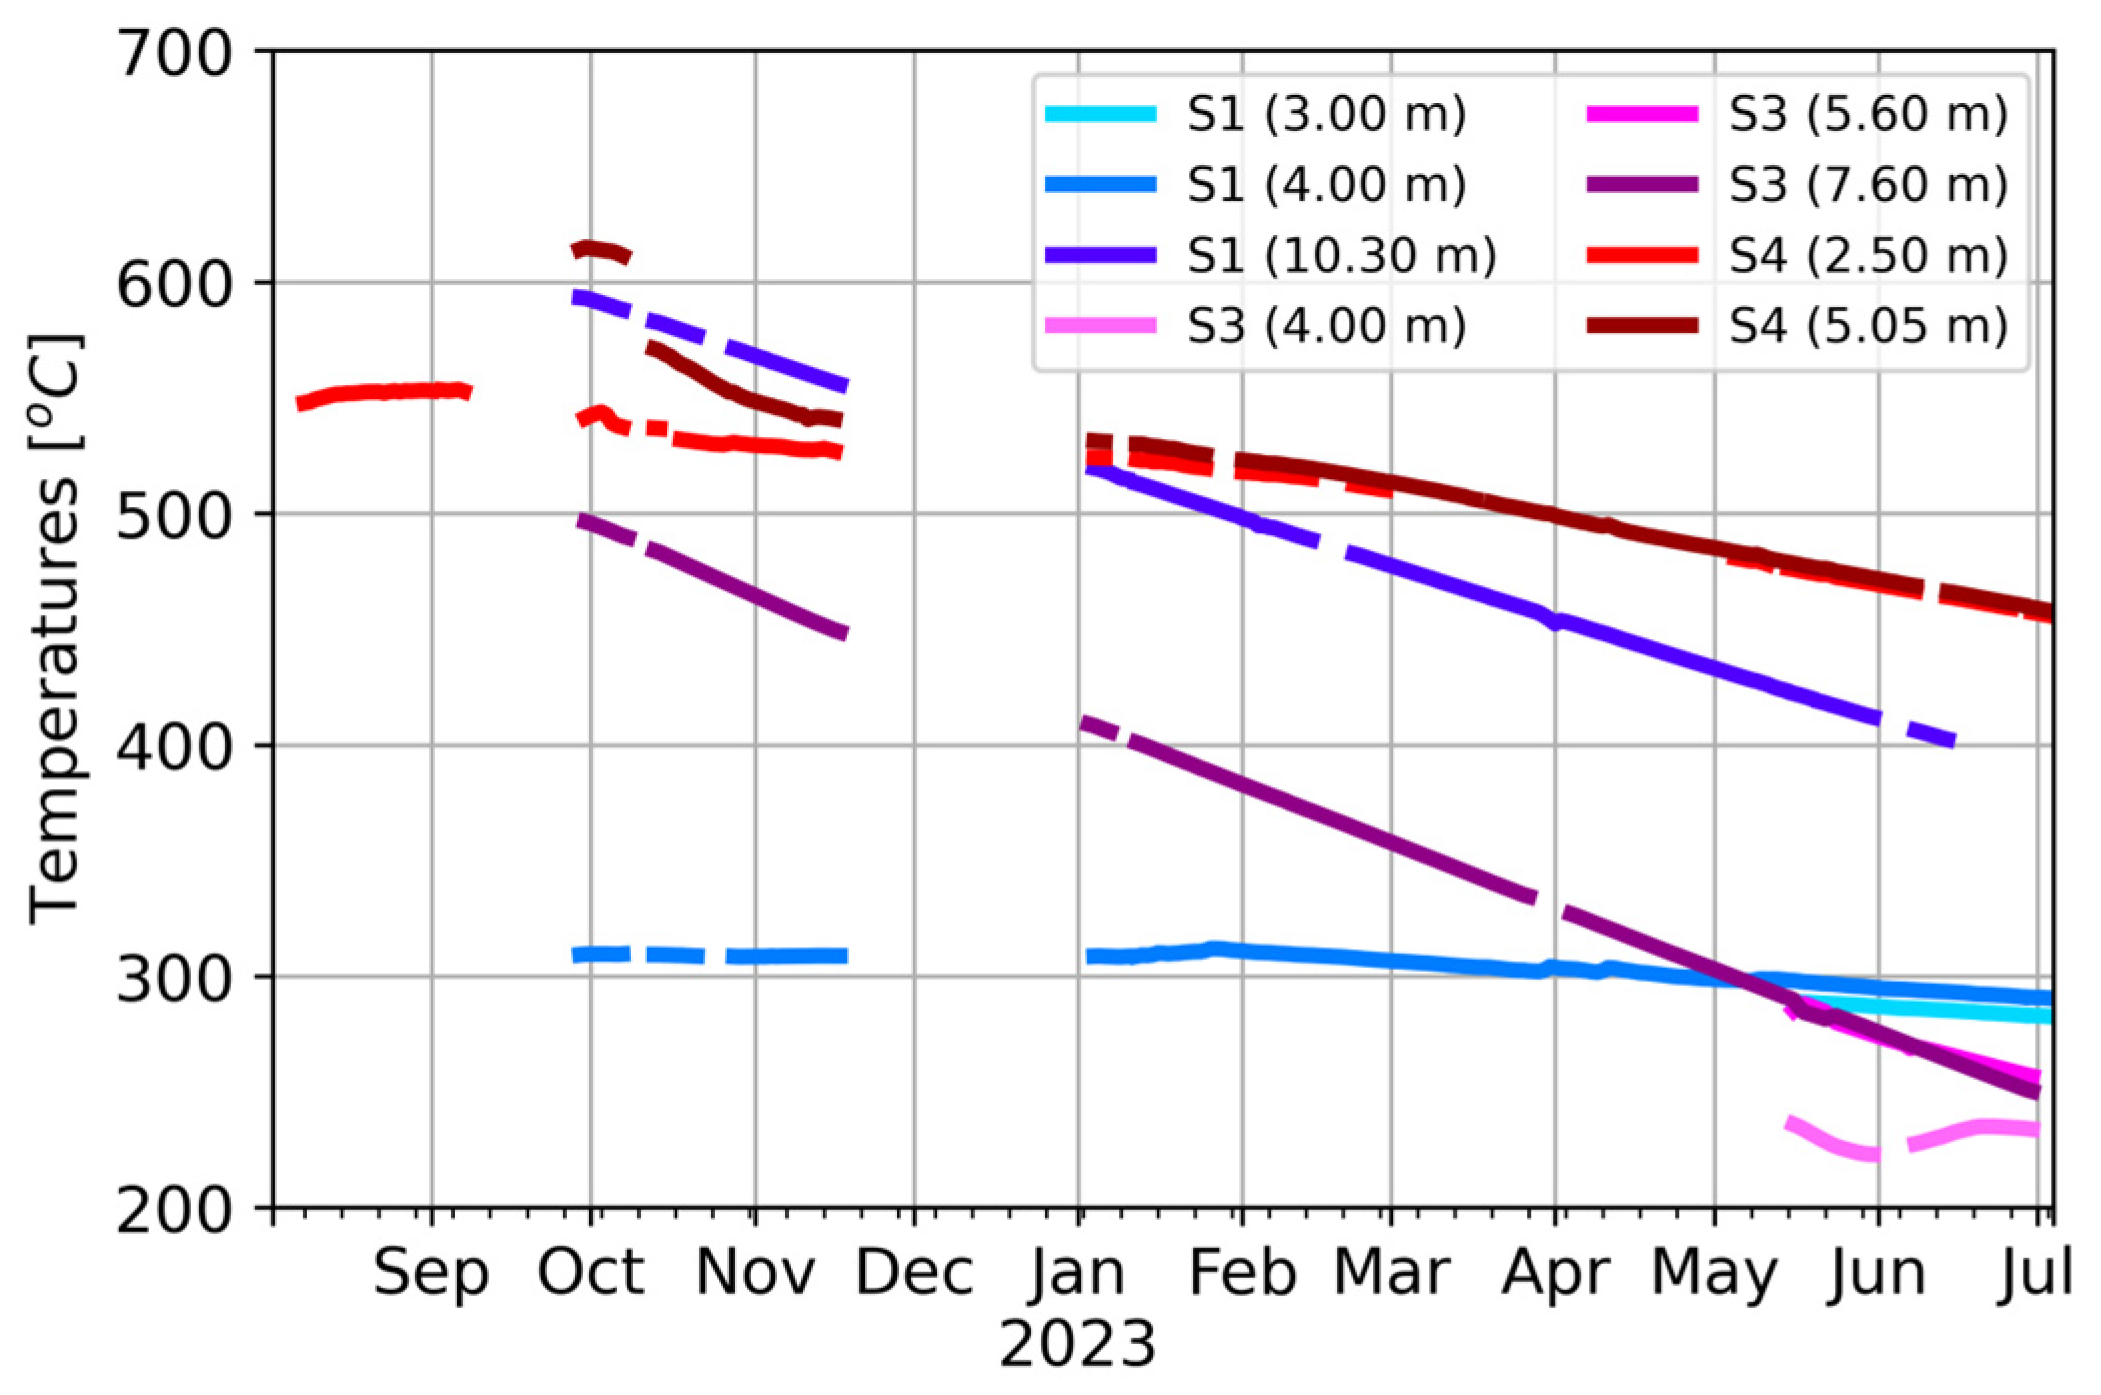
The time series of temperatures measured inside the boreholes during the period from 2 August 2022 to 4 July 2023 was used, and Expression (8) was applied to estimate the cooling coefficient, taking the temperature of 1100 °C corresponding to the initial cooling date, and 20 °C for the average air temperature in the study area. To measure the temperatures inside the boreholes, data loggers connected to probes installed at the following depths were used:
3.00, 4.00, and 10.30 m depths in borehole S1, and at 4.00, 5.60, and 7.60 m depths in borehole S3, both in aa lava flows.
2.50 m and 5.05 m depths in borehole S4 in pahoehoe lava flows. Borehole S2 has not been included due to erroneous temperature readings.
Given the oscillatory temperature regime observed in the surface layers of the boreholes due to the incidence of solar radiation, temperature data obtained at depths of less than 2.5 m have not been considered, nor have temperature data that could be altered by proximity to roads under construction [
9].
Cooling coefficients have been obtained as a function of the data of each borehole and the depth of temperature measurement, by means of Least-squares Adjustment curves (
Table 2).
4.3. Cooling Coefficients for Homogeneous Conditions
The homogeneous model assumes that the lava flows are of the aa type and consist solely of compact basalts with a continuous and uniform structure; it also assumes that their thermal and lithological properties are homogeneous and isotropic.
Based on the data obtained from boreholes S1 and S3 (
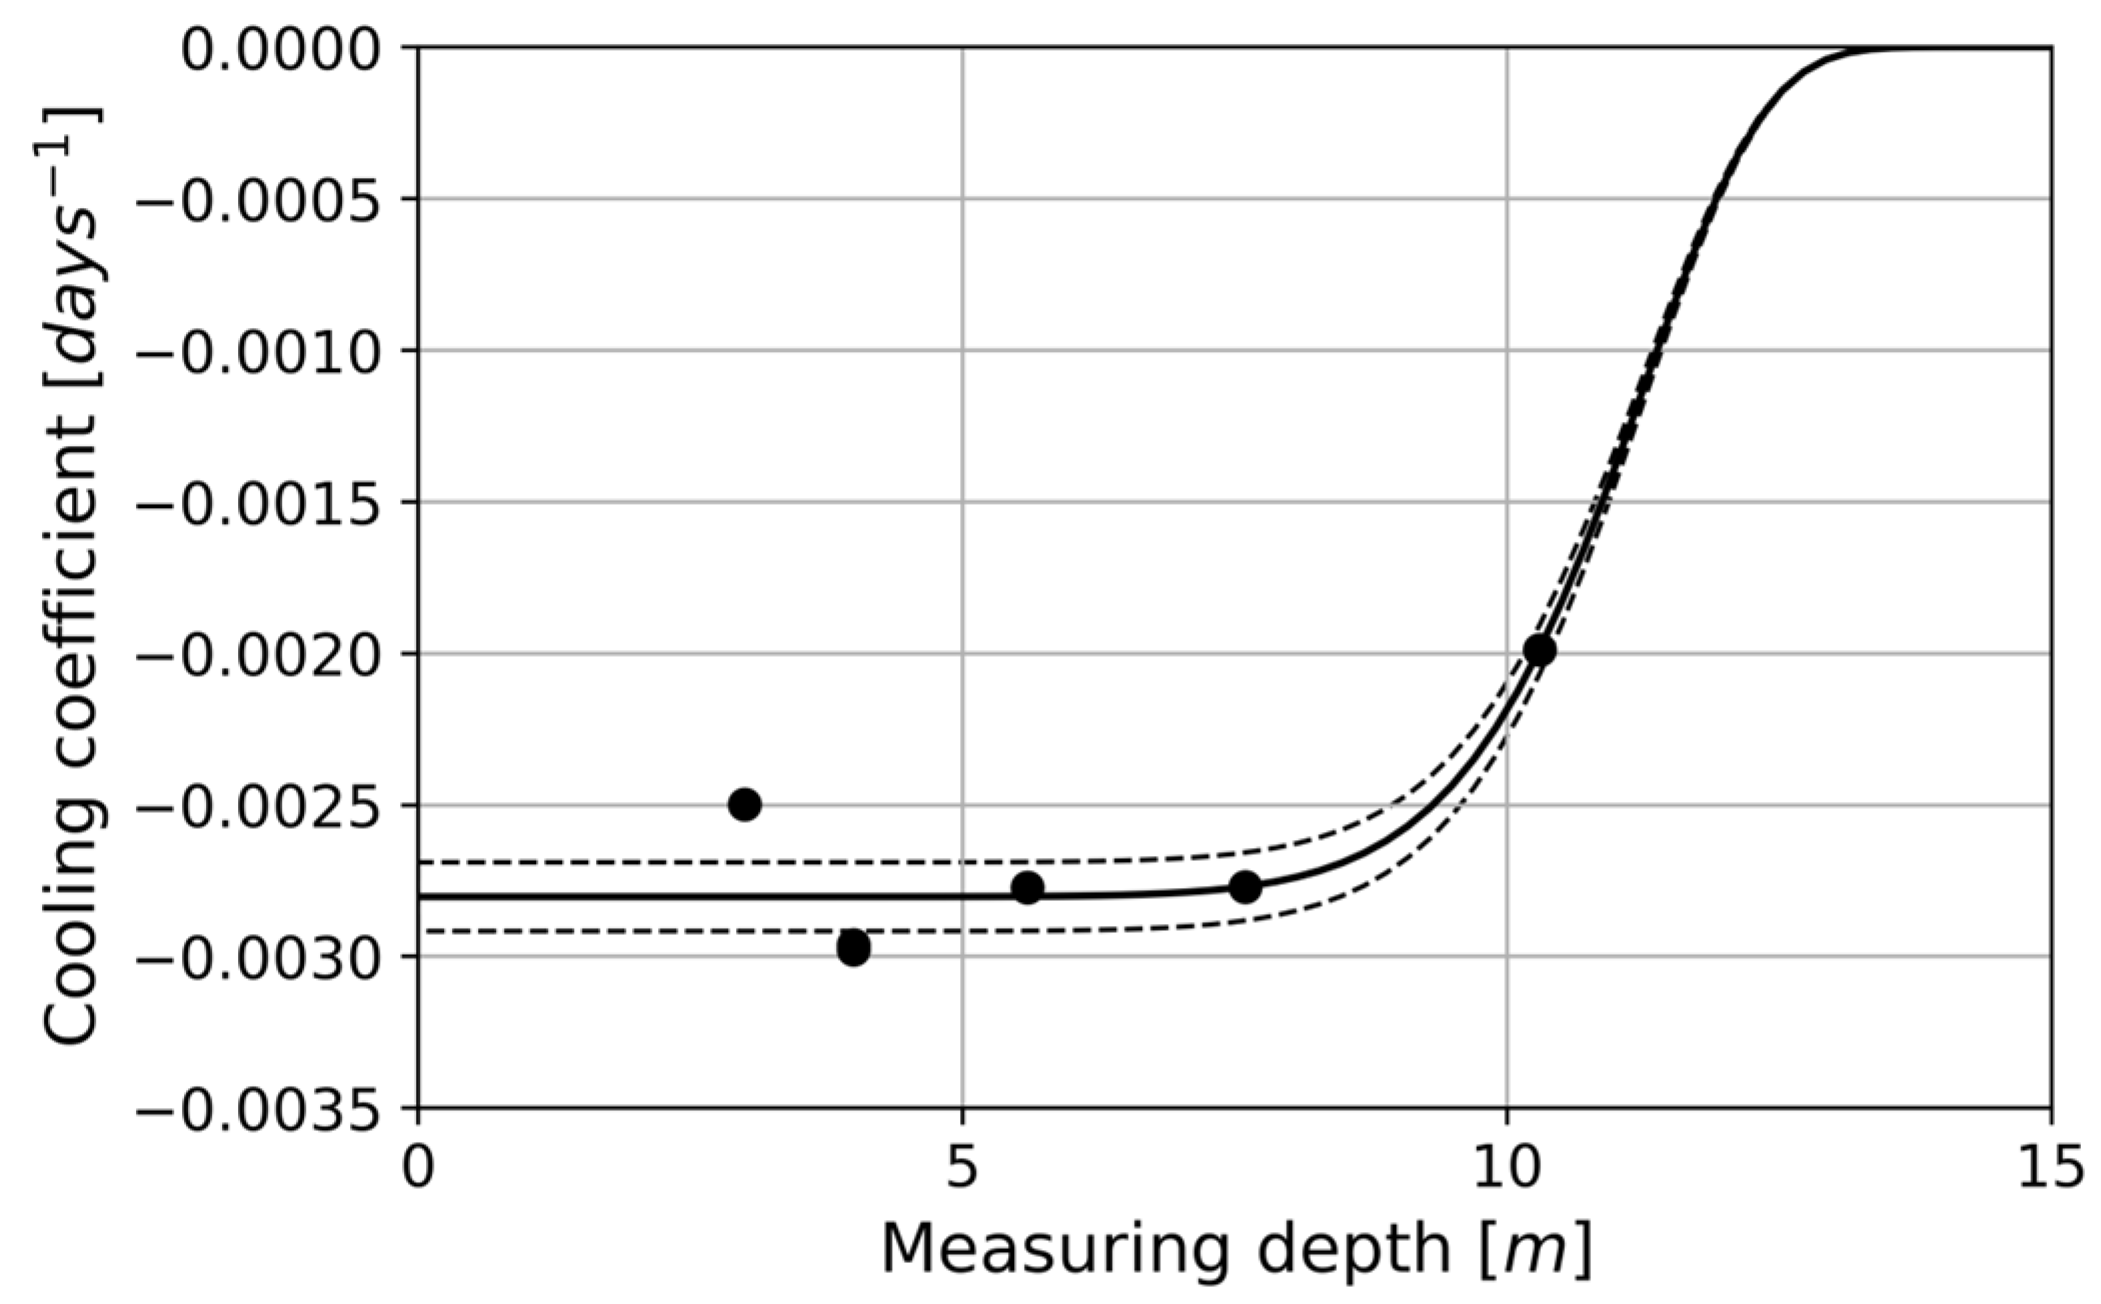
Table 2), an exponential fit has been performed in order to estimate the temperatures at different depths. The result of the cooling coefficient obtained is as follows:
where λ
homo is the cooling coefficient under homogeneous conditions for aa lavas and
P is the depth of temperature measurement. The range of validity of this expression is between 3 m and 10.3 m depths, inclusive.
Figure 11 shows the obtained fitting curve as a function of the cooling coefficient.
From Expression (9), the cooling times necessary to reach certain depths of 3, 5, 7, and 10 m (
Table 3) have been estimated. The resulting cooling curves are shown in
Figure 11. As can be seen, the lower the cooling coefficient, the longer the cooling times, or the greater the depths.
Figure 12 shows the simulated curves for different depths using the homogeneous model. As expected, the greater the depth, the longer the cooling time. However, for depths between 3 and 7 m, the differences are hardly noticeable, as can be seen by comparing this last graph with the data collected in
Figure 11 and
Table 3.
4.4. Cooling Coefficients for Heterogeneous Conditions
The heterogeneous model considers the specific geological characteristics of several sites where boreholes have been drilled and temperatures have been measured at different depths, down to 10 m. The thickness of each lava layer, its lithology, and petrological composition were determined. The total thickness of the lava flows was estimated using GIS tools by comparing digital terrain models from before and after the 2021 eruption (see
Figure 6). The thermal conductivities of each material were estimated by averaging the thermal conductivity values of materials with the same petrological composition as Canary Island lavas (
Table 4). The cooling coefficients obtained previously from Newton’s Cooling Law (
Table 2) were used, and each type of lithology composing the lava flows was differentiated: olivine–pyroxene basalts and lava scoria, as well as the presence of cavities, in which case the air conductivity was considered. In the heterogeneous model, both aa and pahoehoe lava flows have been analyzed.
The depths at which the temperatures were measured in the boreholes were the same as those in the homogeneous model:
aa lava flows: S1 at 3.00, 4.00, and 10.30 m depths; and S3 at 4.00, 5.60, and 7.60 m depths.
pahoehoe lava flows: S4 at 2.50 and 5.05 m depths.
On the other hand, to obtain the cooling coefficient under heterogeneous conditions, three new parameters have been defined:
Thermal Conductivity Reduction Coefficient (CRC), that takes into account the thermal conductivity of each material (
κ) and its thickness, as follows:
where
κs is the thermal conductivity of the materials above a certain depth at which the temperature has been measured, and
κb is the thermal conductivity of the basalt.
κs can be estimated according to the following polynomial expression:
where
xn represents the ratio, or nth fraction, of a given material to the borehole length, and varies between 0 and 1, and
κn represents the nth thermal conductivity of that material, where n can be
b (basalt),
e (scoria), and
a (cavity).
Thickness Ratio (TR), which relates the depth of temperature measurement and the total thickness of the whole lava flow, as both parameters are related to the process and cooling times. TR can be expressed as:
where z is the measuring depth, and E is the thickness of the lava flow at that point.
Cooling Factor (CF), which relates the CRC to the TR, and is expressed as follows:
where a and n are known parameters and Δa and Δn are their corresponding errors, respectively, the calculation of which is shown in
Appendix B. The results obtained are as follows:
Applying these results to Expressions (15) and (16), we obtain:
Table 4 shows the average thermal conductivity values for the olivine–pyroxene basalts and slags, as well as the assumed theoretical value for the thermal conductivity of air.
Table 5 shows the thickness data for each material and their relative proportion with respect to the borehole length.
From the thermal conductivity and thickness data (
Table 3 and
Table 4), Expressions (10)–(13) have been applied to obtain the thermal Conductivity Reduction Coefficient (CRC) as a function of depth (
Table 6).
From Expression (14), the Thickness Ratios shown in
Table 7 have been estimated.
Both CRC and TR are dimensionless and vary between 0 and 1. Thus, CRC = 0 would mean void, and a value of CRC = 1 would indicate that the borehole column would be entirely made up of basalt. A value of TR = 0 would mean a depth of 0 (surface), while a value of TR = 1 would correspond to a measurement depth equivalent to the total thickness of the lava flow at that point.
Table 8 shows the results obtained by applying Expressions (17) and (18) to the estimation of the Cooling Factor (CF). These results indicate that the higher the cooling factor (CF), the higher the cooling rate of the lava flows, and it varies between 0 and 1, as in the previous CRC and TR parameters. On the other hand, the higher the CRC, the higher the cooling rate, while the higher the TR, the lower the cooling rate.
From the CF values estimated for heterogeneous conditions (
Table 8), and the cooling coefficients calculated from Newton’s Cooling Law (
Table 2), the cooling coefficient for heterogeneous conditions has been obtained, using the following expression:
where
λhetero is the estimated cooling coefficient for heterogeneous conditions.
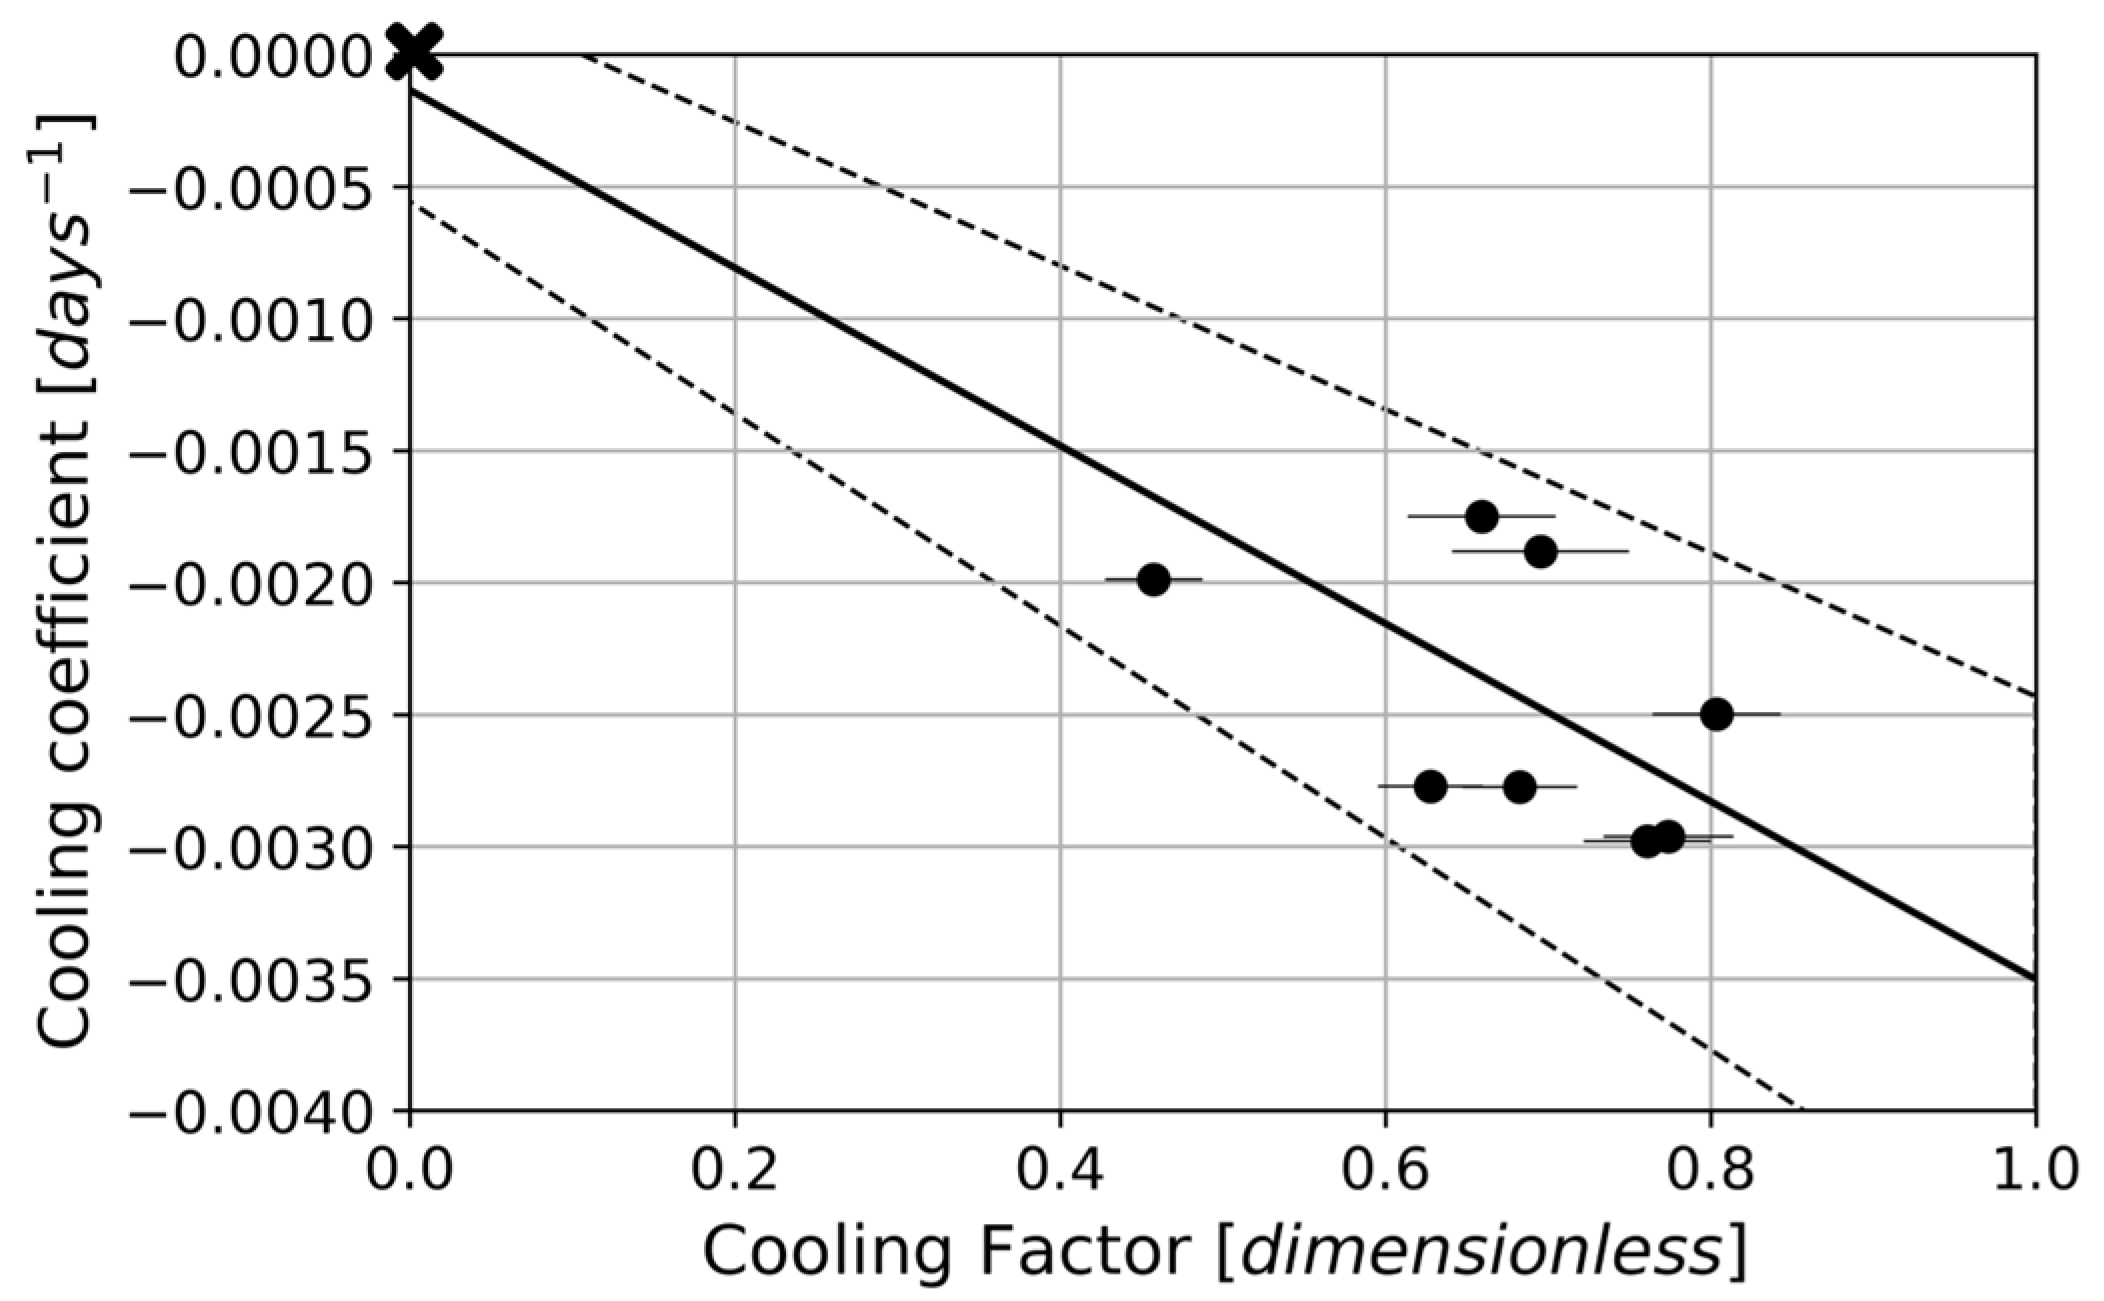
Figure 13 shows the relationship between the cooling coefficient estimated from Newton’s Cooling Law and the Cooling Factor (CF), obtaining a correlation coefficient (R) of 0.9797.
These results indicate that the higher the cooling coefficient, the higher the cooling rate should be, which is compatible with Expression (19) and with the results shown in
Figure 13. The point X shown in
Figure 13 represents a theoretical value corresponding to a cooling factor equal to zero, according to Expression (17).
Table 8 and
Table 9 show the cooling times to reach certain temperatures as a function of depth and the cooling coefficients obtained according to the heterogeneous model.
From the data shown in
Table 8 and
Table 9, a series of cooling curves have been fitted (
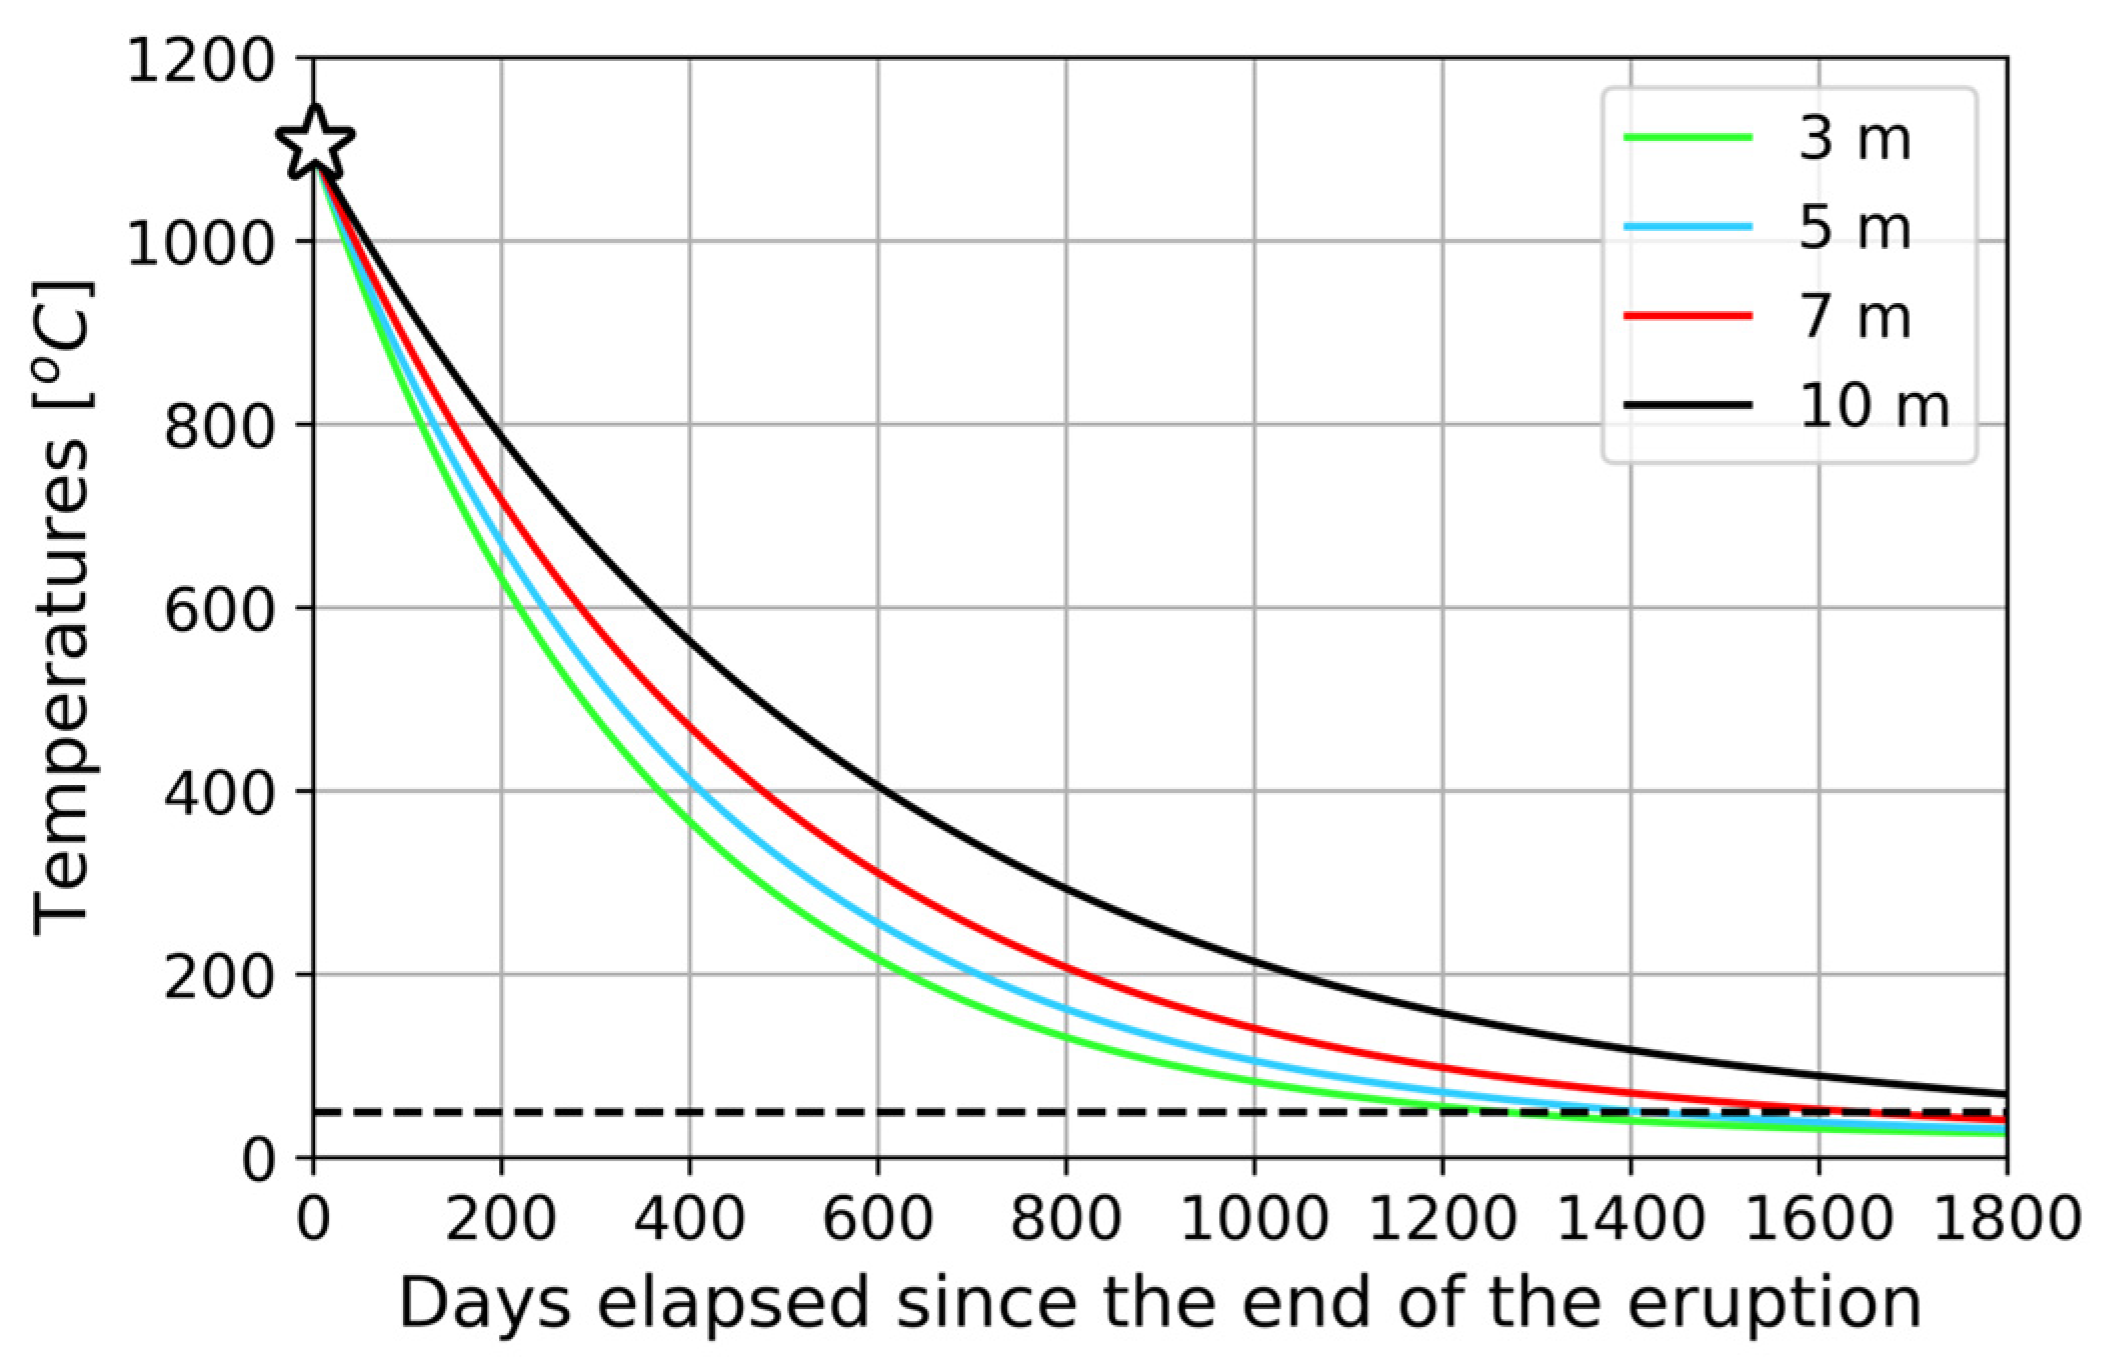
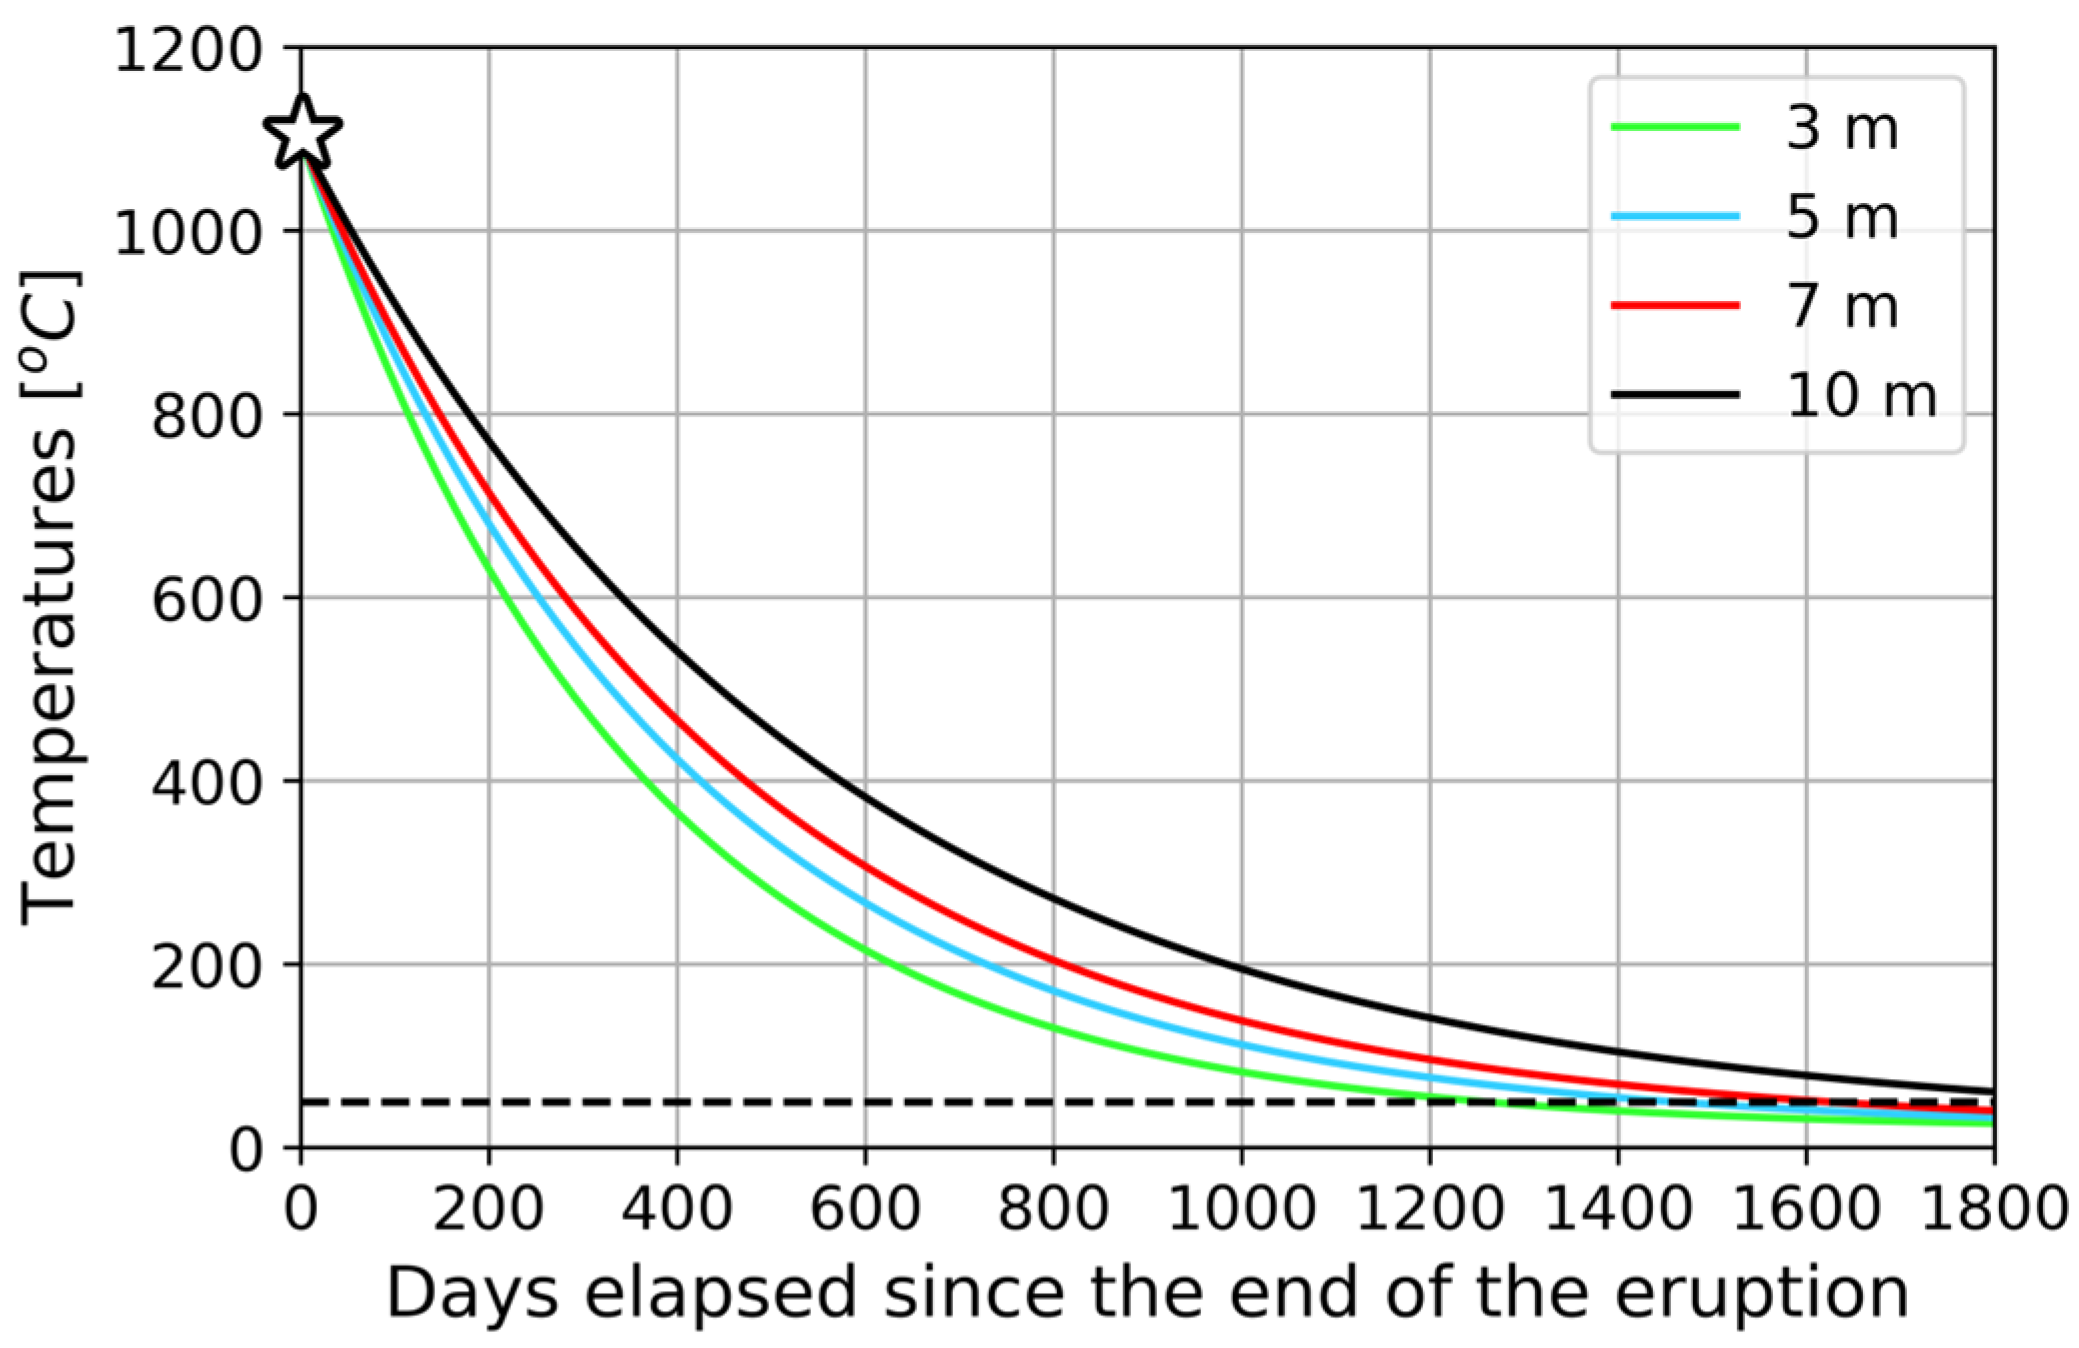
Figure 14 and
Figure 15), the first one corresponding to the data in
Table 9, and the second one to
Table 10, corresponding to aa lava flows, within a time interval of 1800 days from when the lava flow began to cool.
The cooling curves, obtained from data from boreholes S1 and S3, located 990 m apart, show similar trends, but with some differences due to variations in thickness and thermal conductivity that reflect variable and heterogeneous behavior.
Figure 14 and
Figure 15 show the cooling curves simulated from the heterogeneous model for boreholes S1 and S3, respectively. In both cases, it can be clearly seen that the deeper the borehole, the lower the cooling rate, i.e., the longer it takes to reach a certain temperature. The differences between the two boreholes are miniscule; but it can be seen, for example, that for a depth of 10 m, the cooling process is faster for borehole S3 than for S1. This is because the proportion of scoria in the first is lower than in the second, as the thermal conductivity of the scoria is lower than that of the basalt.
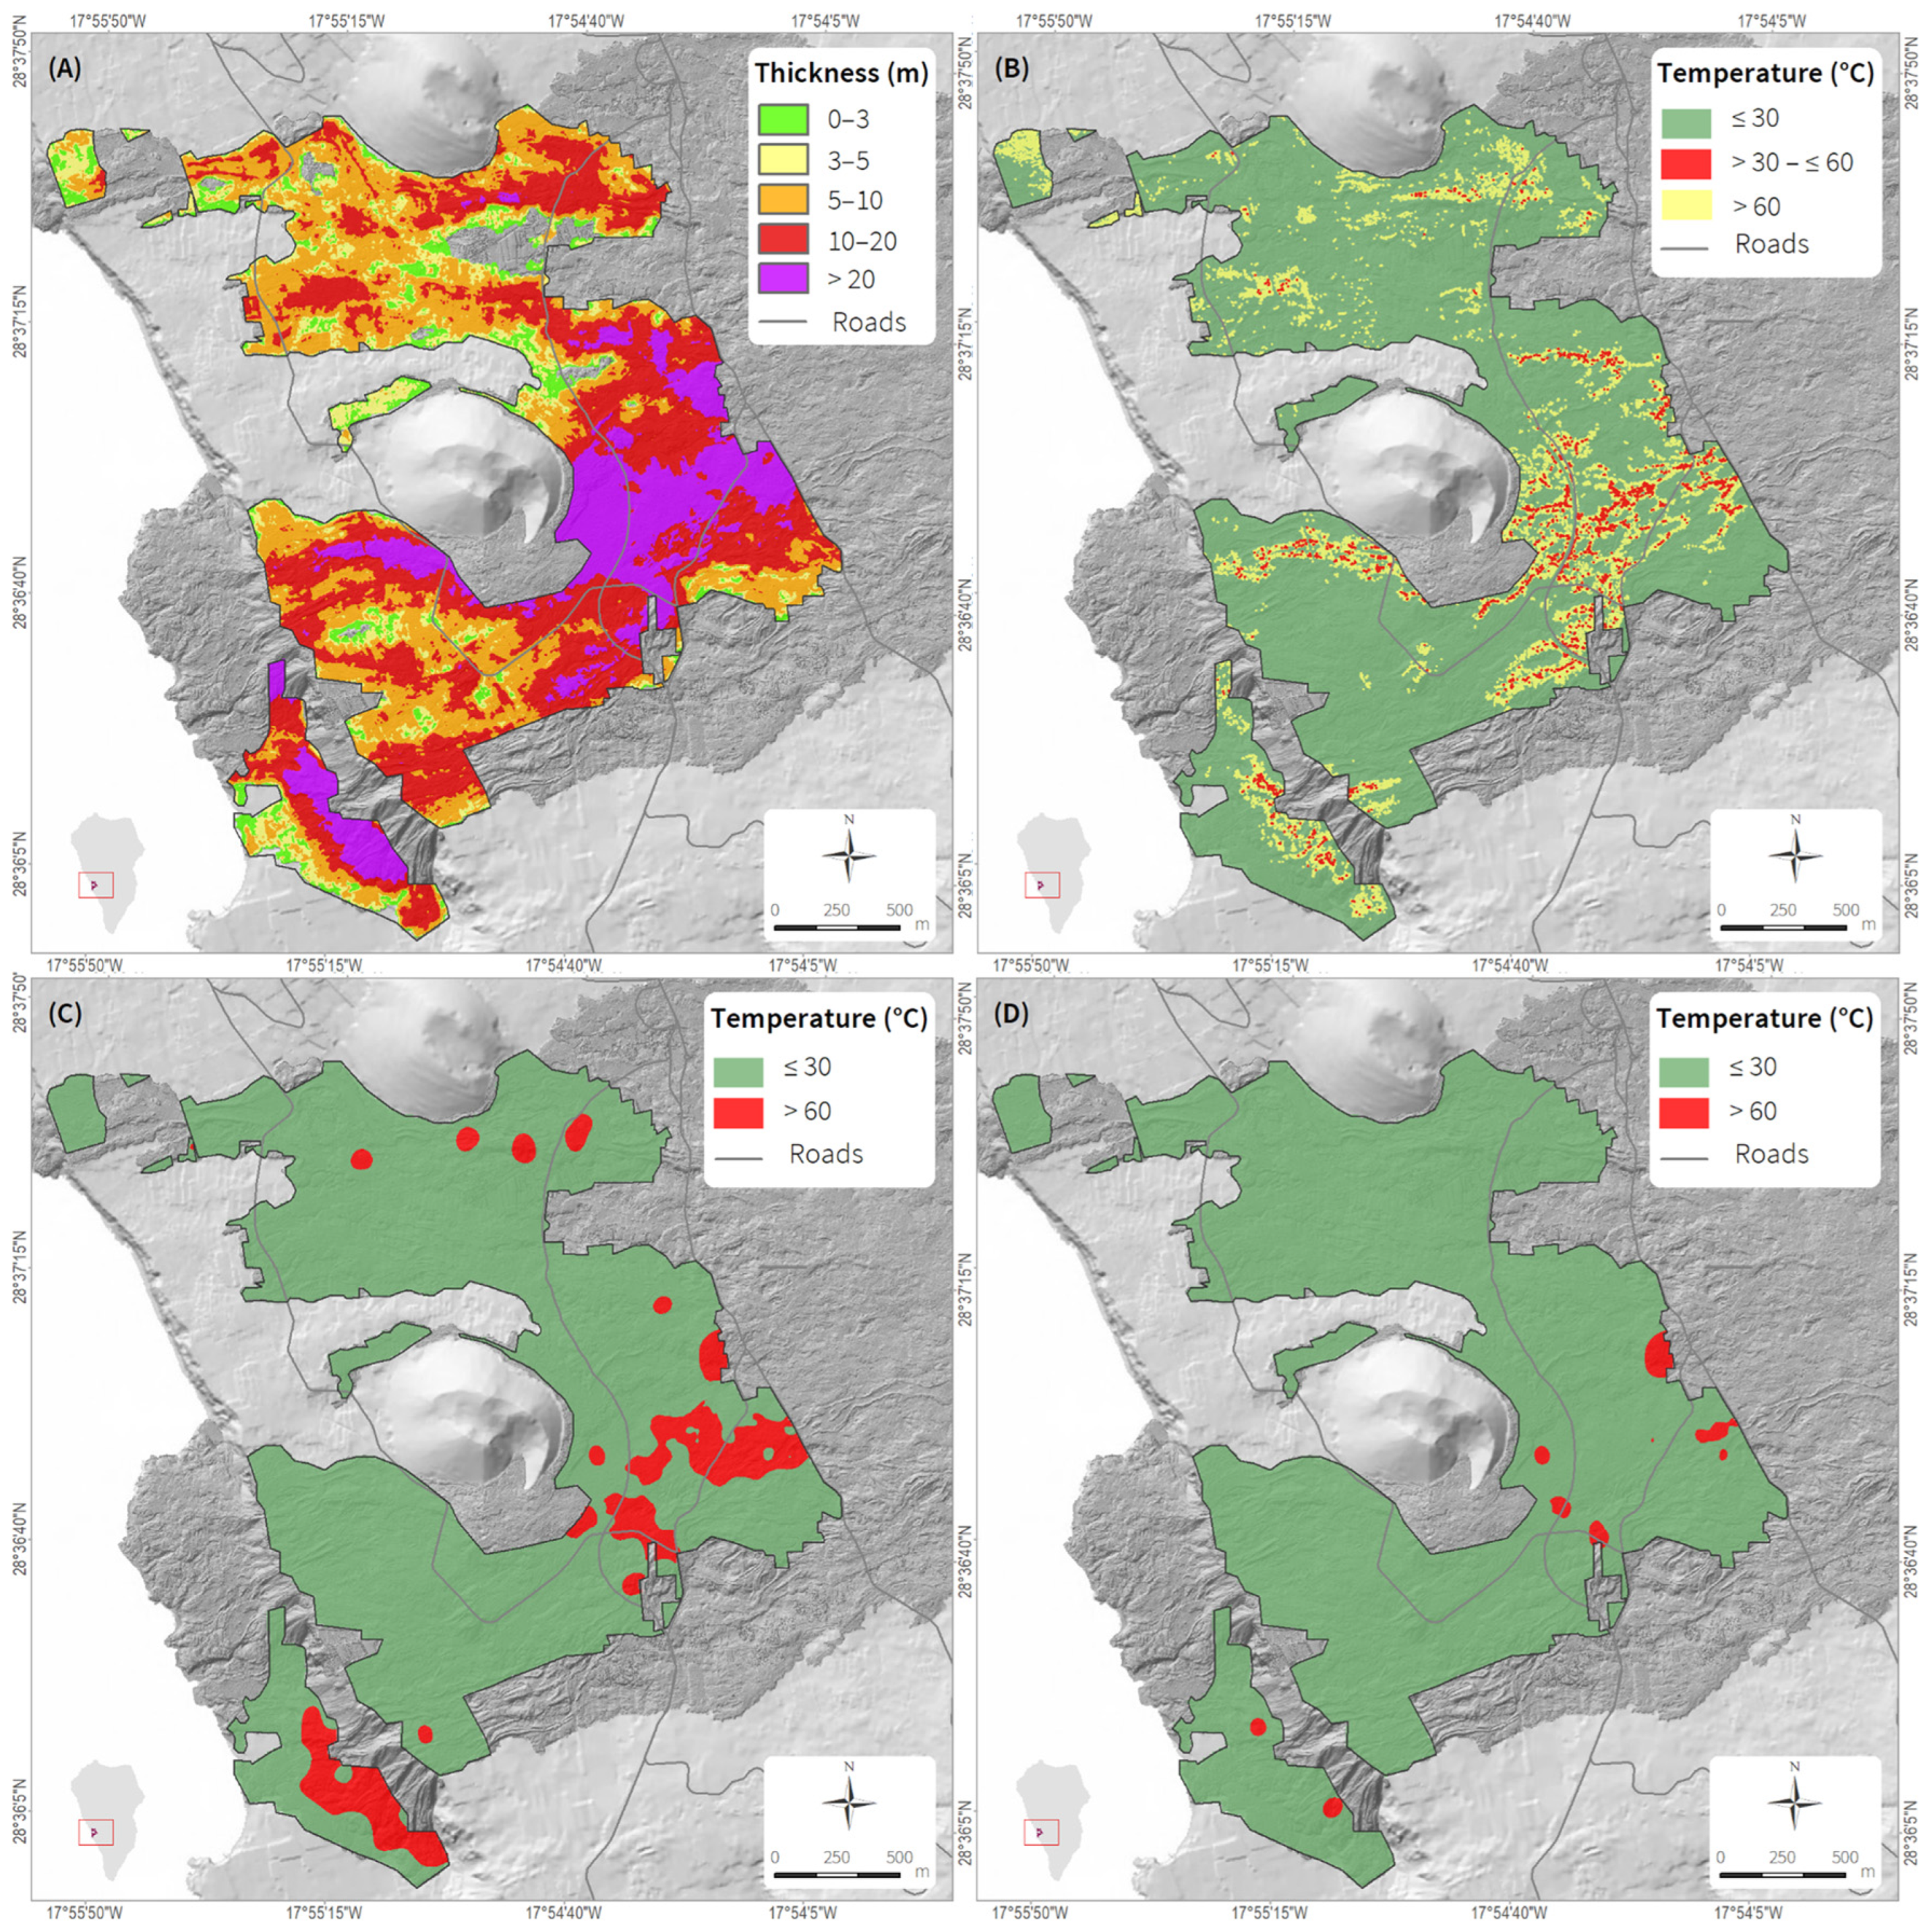
Figure 16 summarizes the main methodological steps to be followed for the calculation of the cooling coefficients for homogeneous and heterogeneous conditions.
4.5. Comparative Analysis between Temperatures Measured In Situ and Those Estimated by Cooling Models
To compare the temperature differences between the instrumentally recorded values and those estimated by the cooling models, boreholes S1 and S3 have been selected due to their smaller dispersions of results compared to the other boreholes; these boreholes were used to compare the two models and estimate the deviations with respect to the recorded temperatures. The results are presented in
Table 11.
The results shown in
Table 11 indicate that in the homogeneous model, the maximum deviation was 12.81%, with values of less than 6% predominating, while for the heterogeneous model, in
Table 12, the highest value was 16.34%, with deviations of less than 11%. In both models, the overestimation of temperatures predominates, which is equivalent to longer cooling times, this difference not being significant given the low deviation of temperatures between the two estimated models and the instrumental measurements.
6. Discussion
The volcanic eruption of Cumbre Vieja, La Palma 2021, was the most important and devastating urban eruption of the last 100 years in Europe. Over 1.2 billion euros were spent on reconstruction projects and aid to minimize the social and economic impacts. These projects were planned on the lava flows, with the objective of starting works in less than 1 year after the eruption for roads, and between 2 and 3 years for other types of projects. However, the estimated cooling times for the lava flows have been estimated to be more than 5 years, which was not acceptable for project timelines.
In order to provide feasible solutions to initiate reconstruction in the shortest possible timeframe, thermal, geological, and geotechnical investigations were conducted with the objective of calculating the cooling rates of the lava flows and hence the time required to reach acceptable temperatures, as well as their thermal and geomechanical properties. The results from in situ investigations have enabled the estimation of cooling times through the development of two ad hoc models, namely the homogeneous and heterogeneous models. In the former, lava flows were considered as a physical element exhibiting isotropic and homogeneous behavior, while in the latter model, their behavior was characterized as anisotropic and heterogeneous. In both models, data from four boreholes drilling on aa and pahoehoe lavas up to a depth of 10.5 m have been utilized.
The systematic recording of temperatures measured at surface and in the boreholes at various depths during the period between August 2022 and November 2023 has enabled comparison between the measured in situ temperatures and those estimated from the models (
Section 4.5), yielding maximum deviations of 12.8% for the homogeneous model and 16.3% for the heterogeneous model, with temperatures being overestimated by both models.
Although the homogeneous model yielded smaller deviations, the heterogeneous model is more representative of the actual conditions of the lava flows. Additionally, the majority of the data from the boreholes correspond to aa lavas, with a smaller proportion pertaining to pahoehoe lavas, which may result in less representative results for pahoehoe lavas. On the other hand, the homogeneous model cannot be extrapolated to other locations, unlike the heterogeneous model. This is because the homogeneous model requires periodic temperature measurements from a specific site, whereas the heterogeneous model needs information regarding the lithological composition and thickness of various materials, typically acquired through borehole drilling, to estimate cooling times.
The lava flows’ cooling times provided by the models to reach temperatures below 50 °C at depths less than 10 m have averaged 5 years. However, the deadlines to initiate reconstruction were less than 3 years, and even less than 1 year for roads. Consequently, to meet the requirements, two possible solutions based on the thermal behavior of the lava flows to achieve temperatures between 30 °C and 50 °C, compatible with reconstruction activities and within shorter timeframes, were studied.
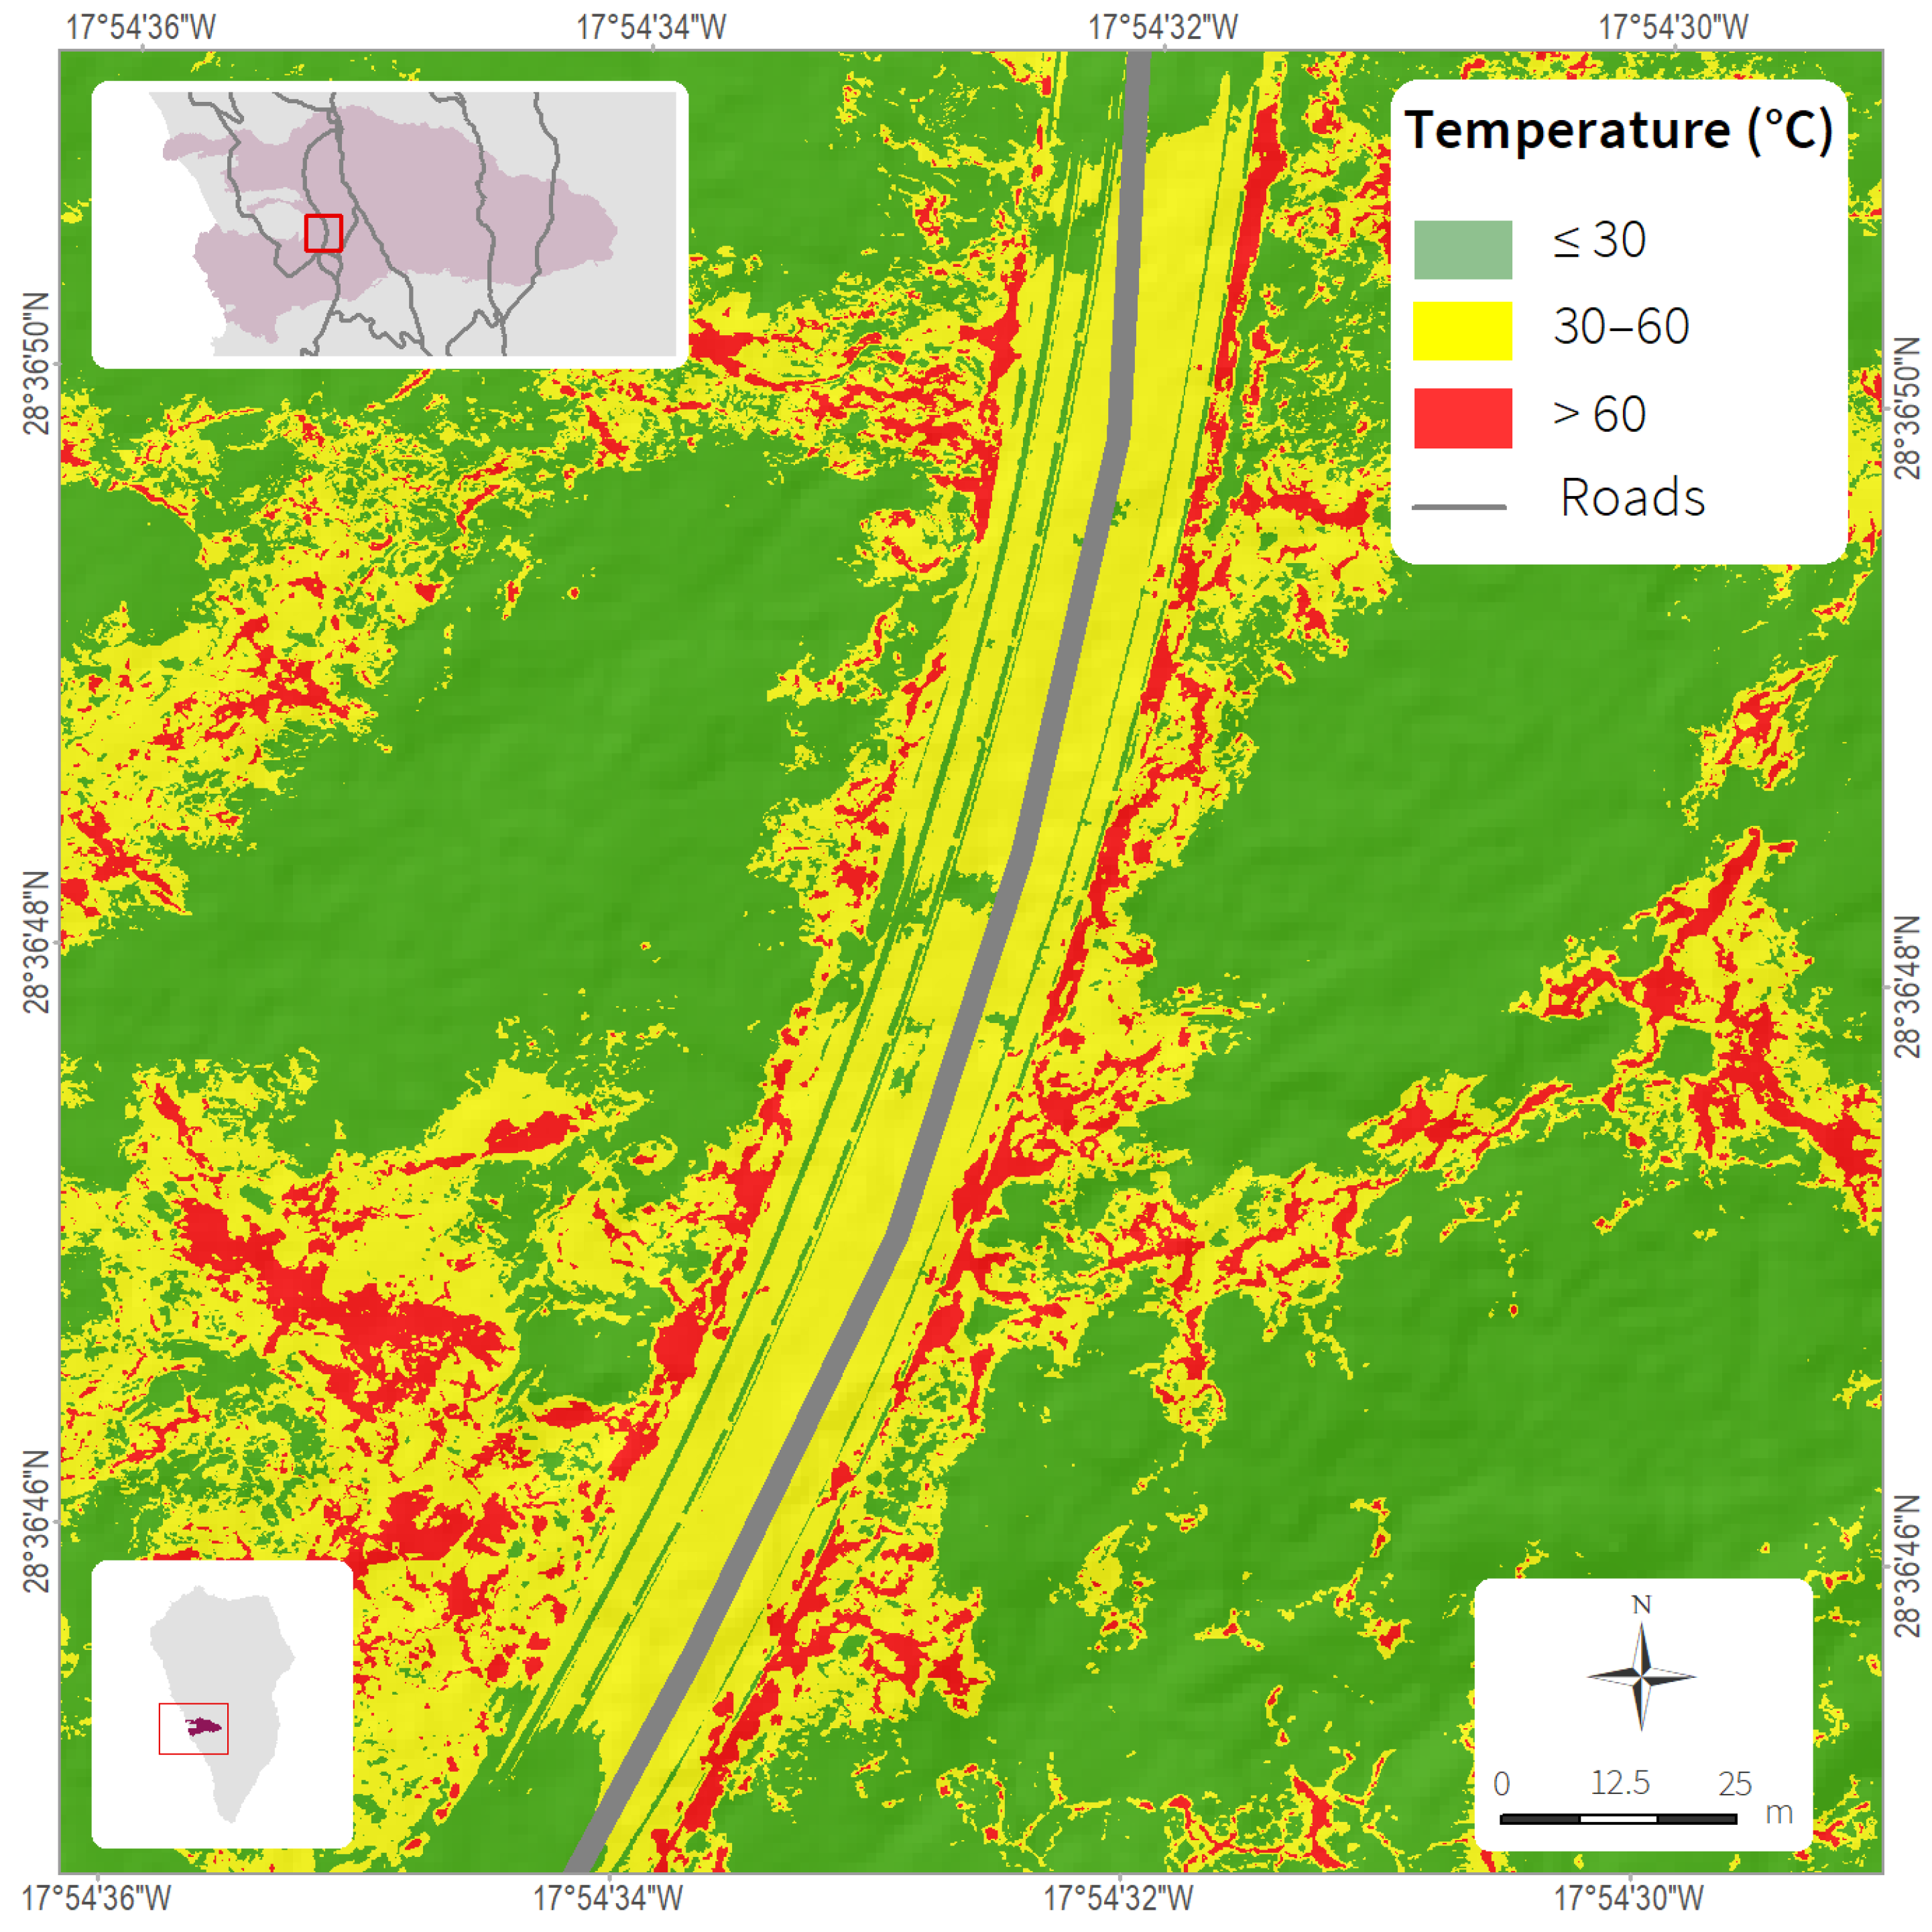
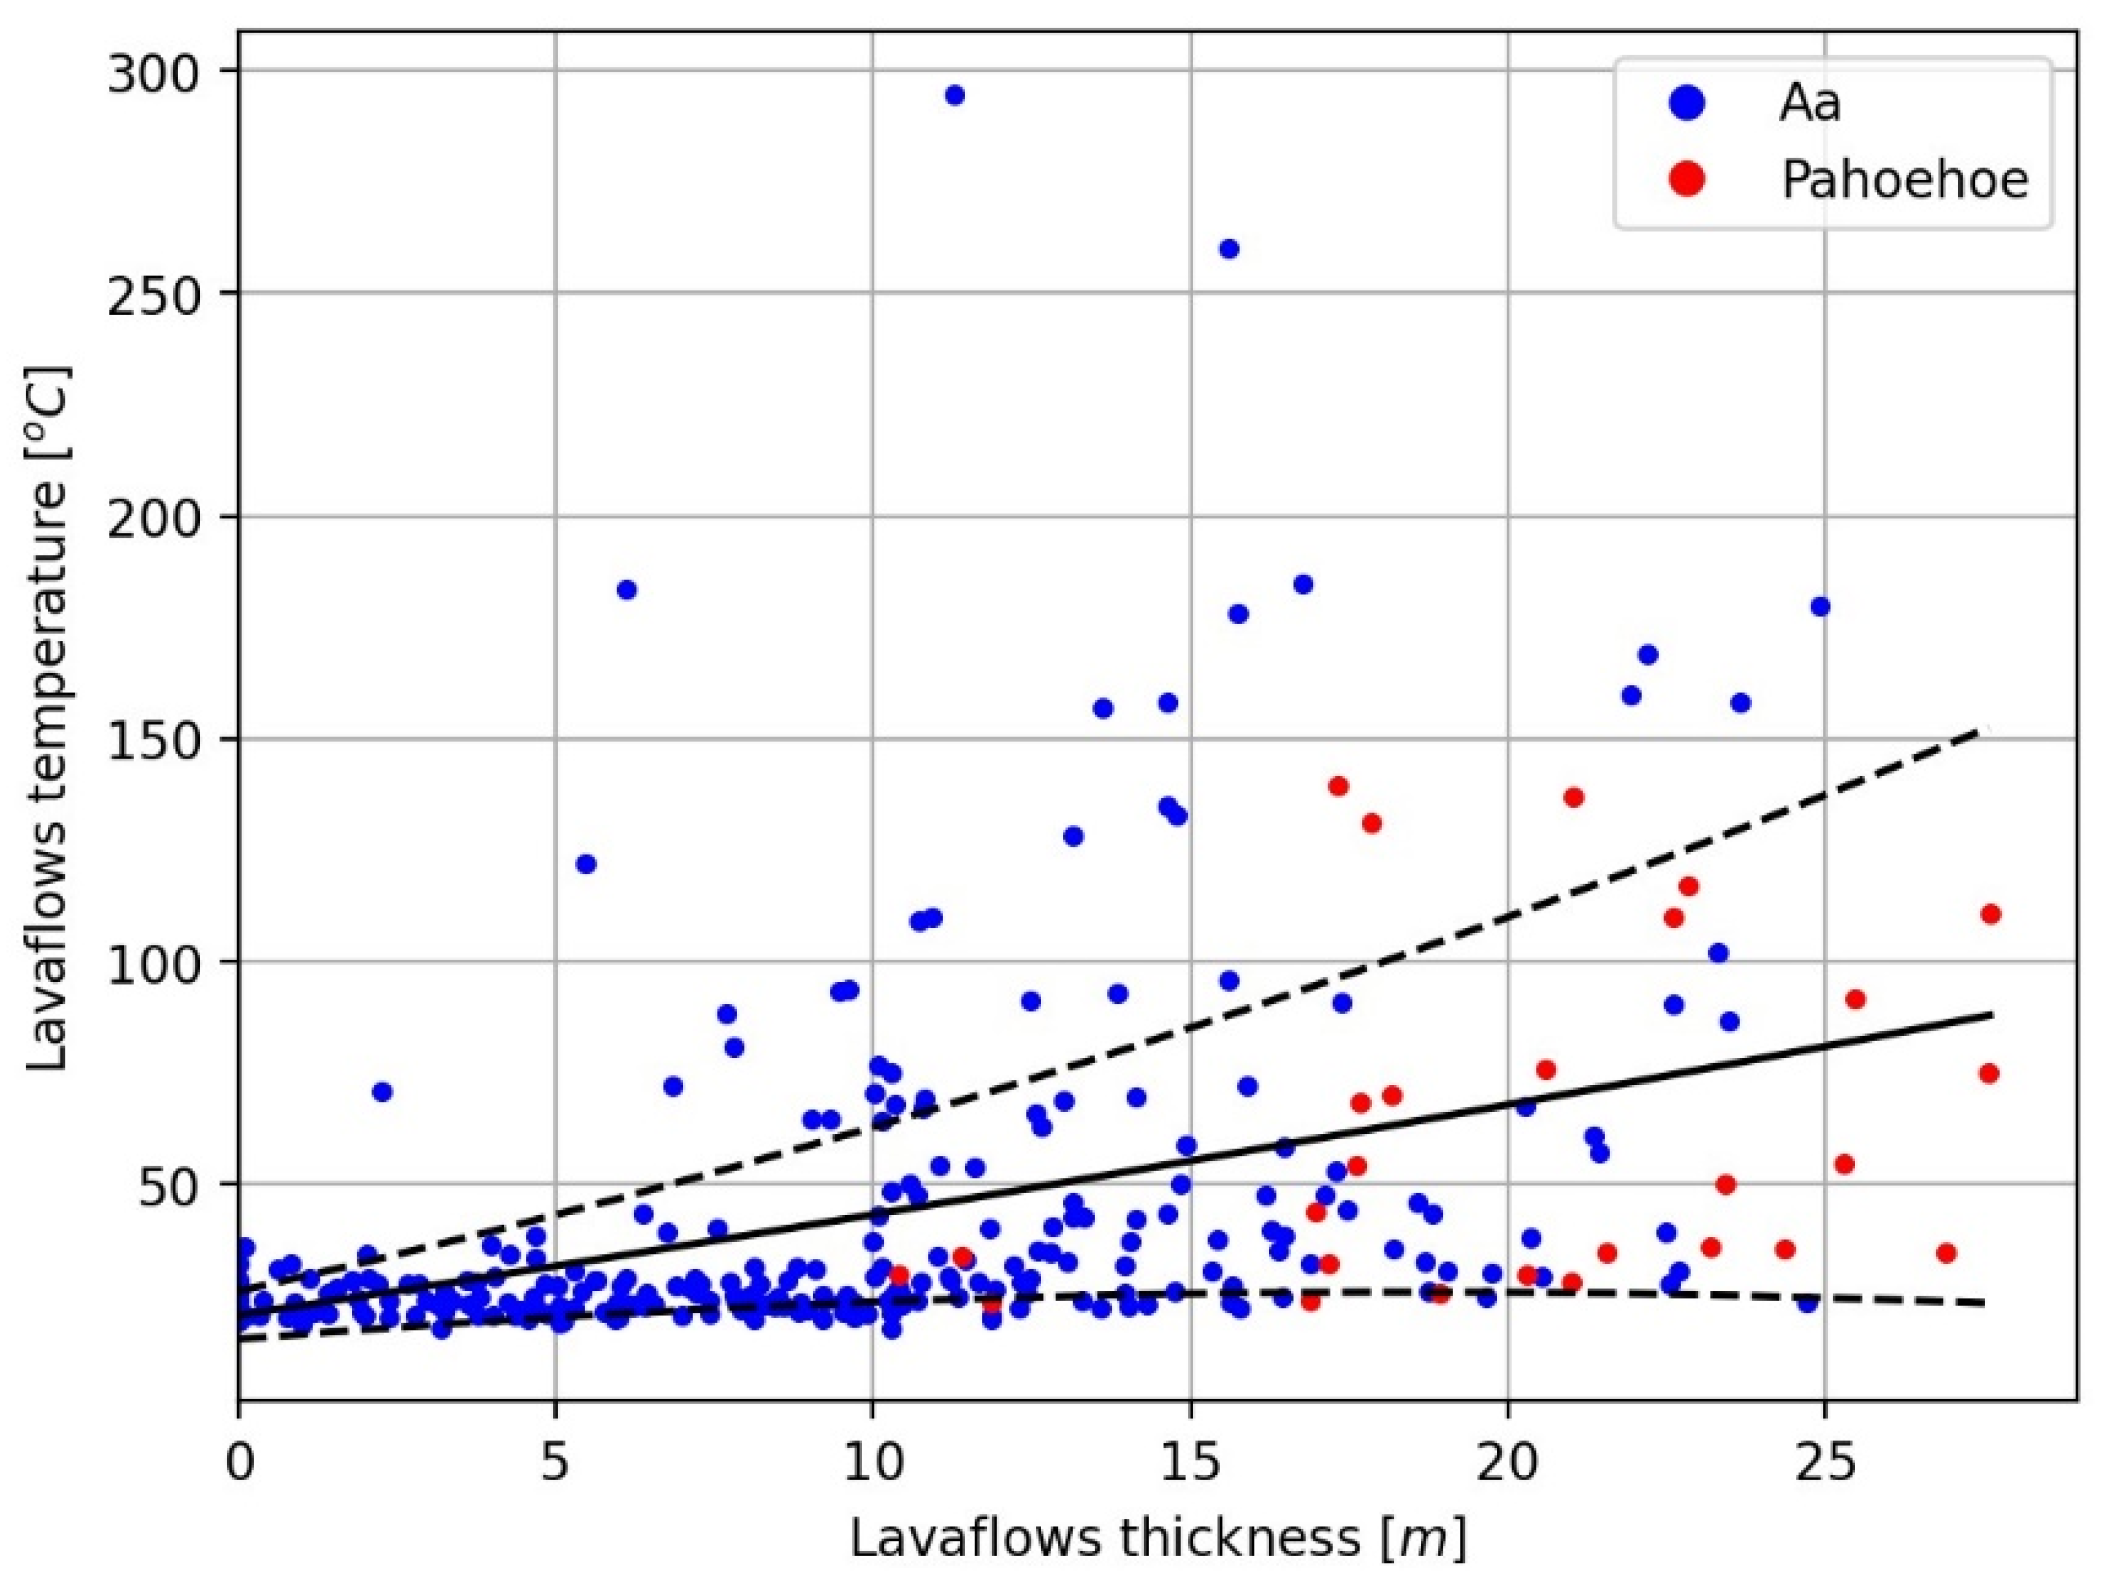
The first solution was based on avoiding excavation of the upper scoriaceous crust of the lava flow, which has relatively low thermal conductivity. This crust would act as an insulating material compared to the basaltic inner core of the lava flow, which has relatively high thermal conductivity. In this way, the infrastructure should rest on the surface of the lava flow, duly conditioned for the type of construction in question (road, foundation). This thermal behavior of the lava flows was experimentally verified during the construction of new roads by measuring temperatures on the surface of the lava flows. In areas where the upper scoriaceous crust was excavated, these temperatures were compared with those measured in areas around 20 m away from the road where the upper scoriaceous crust was not excavated. The results obtained consistently showed much lower temperatures where the upper crust of the lava flow had not been excavated (
Figure 17 and
Figure 18). The application of this solution to the construction of new roads would allow to start the works before 1 year after the eruption.
The second and complementary solution involved constructing a low-thermal-conductivity soil fill on the surface of the lava flow, so that this fill would act as an insulating element. The thickness of soil needed to achieve surface temperatures on the lava flows compatible with the type of activity was calculated; for agricultural recovery purposes, the soil fill thickness was calculated between 1.5 and 2.5 m, to reach a surface compatible temperature of 30 °C (
Section 5.3).
In Hawaii, it has been found that breaking down the size of lava fragments promotes fertility and results in improved water storage capacity. Thus, mechanical preparation of ground for planting is also critical.
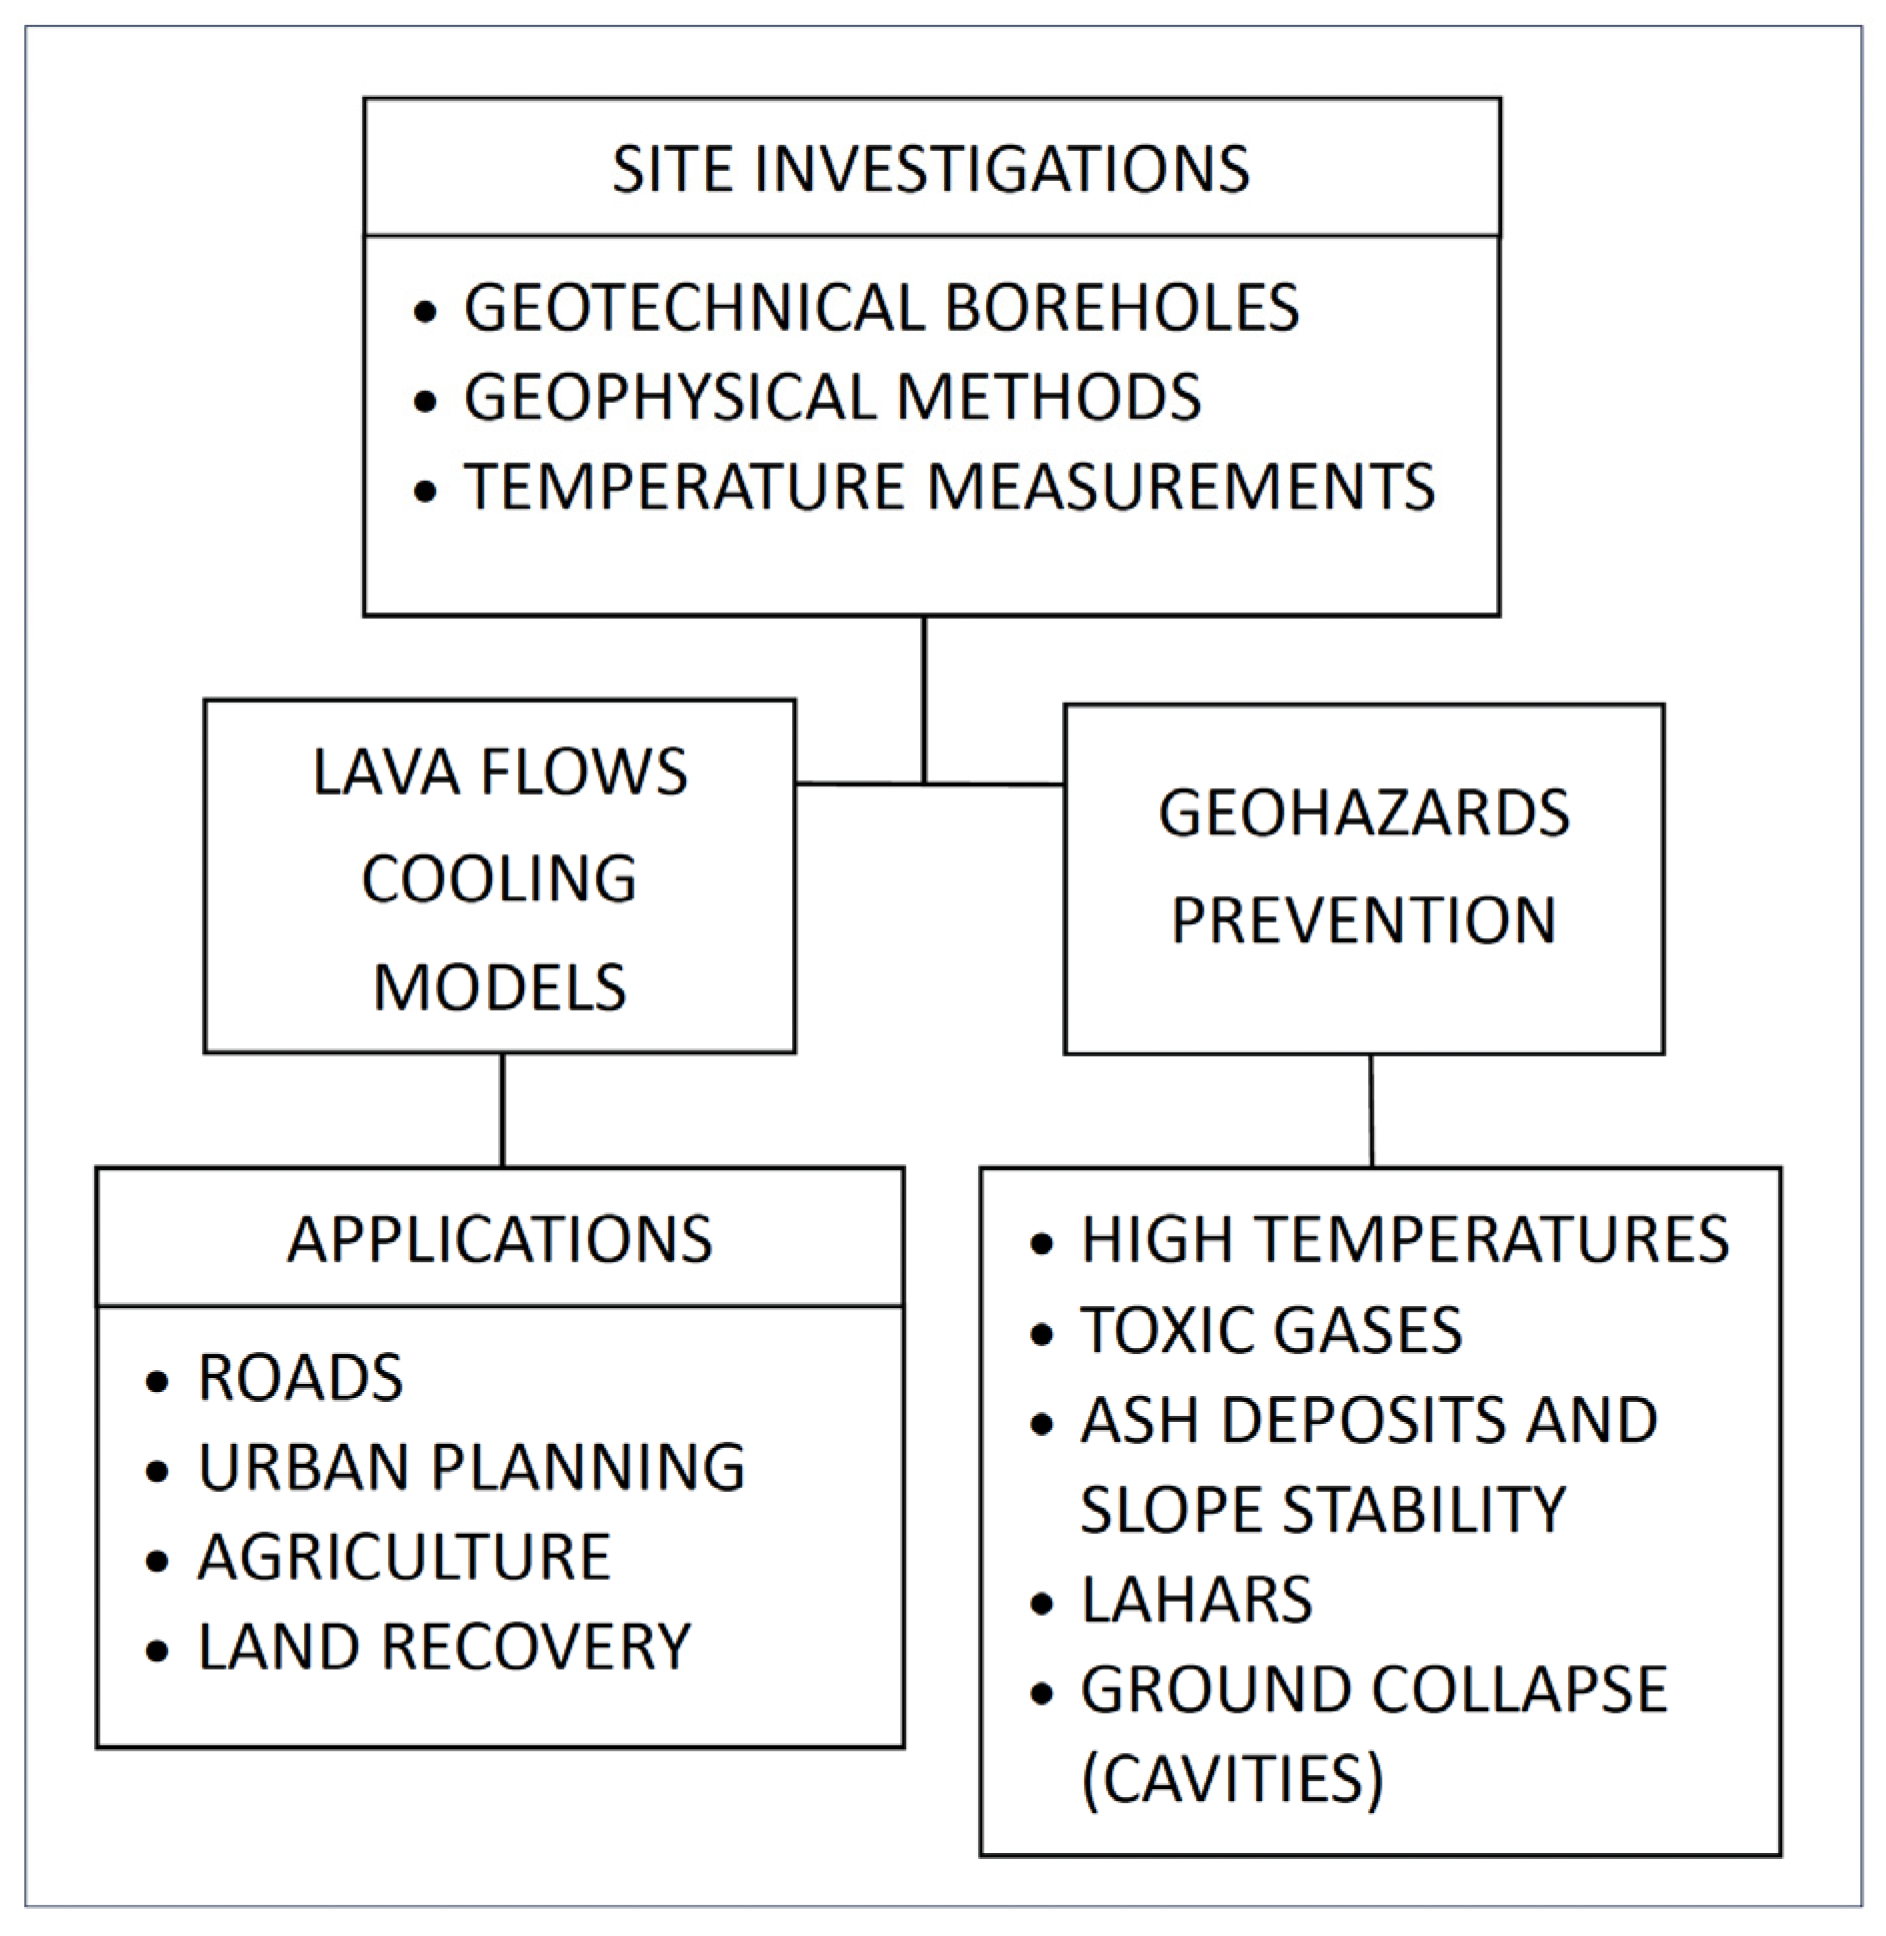
The volcanic eruption of Cumbre Vieja in 2021 has resulted in a significant geomorphological transformation of the landscape, with the emission of large volumes of lava flows and pyroclastic materials, in addition to the formation of a large volcanic cone. These new lava deposits could give rise to potential geohazards, including ground subsidence due to collapses of cavities or lava tubes, instability and failure of the volcanic cone slopes, ash and pyroclasts lahars in the event of very heavy rains, and the emission of toxic gases.
Some of these hazards are contingent upon very intense precipitation events, being of low probability, although historical records confirm this possibility. In response, certain prevention measures have been proposed to avoid geohazards and mitigate possible consequences. Preventive measures have been taken by evacuating the affected population and installing a permanent system for monitoring gas emissions.
La Palma Island has a twin sister volcanic island in the middle of the Pacific Ocean, 12,000 km to the west. Like La Palma, Hawaii Island’s economy is based on tourism and agriculture, and both islands are noted for their astronomical observatories. Although more voluminous and more geochemically complex [
29], the 2018 eruption of Kilauea volcano [
30] was very similar to La Palma’s 2021 eruption, devastating agricultural lands with 36 km
2 of basalt lava, destroying over 700 structures, and covering more than 50 km of paved roads [
31]. Reconstruction of major roads over lava flows with thicknesses in excess of 25 m was an economic priority, but surface lava temperatures in excess of 400 °C damaged equipment and hindered re-paving. Cooperative discussions between Hawaiian and Spanish engineers and geologists about road reconstruction were useful, and the La Palma engineering studies will be beneficial to lava flow recovery in other volcanic areas world-wide.

