Article

Combined Effect of the Microstructure and Mechanical Behavior of Lateritic Soils in the Instability of a Road Cut Slope in Rwanda

1
Department of Chemistry, Life Sciences and Environmental Sustainability, University of Parma, Parco Area delle Scienze 157/A, 43124 Parma, Italy
2
College of Science and Technology, University of Rwanda, Kigali P.O. Box 3900, Rwanda
*
Author to whom correspondence should be addressed.
GeoHazards 2024, 5(2), 559-581; https://doi.org/10.3390/geohazards5020029
Submission received: 28 April 2024 / Revised: 15 June 2024 / Accepted: 17 June 2024 / Published: 18 June 2024
(This article belongs to the Topic Geotechnics for Hazard Mitigation)

Abstract

:
A very common hazard in Rwanda is represented by the instability of steep road cut slopes in lateritic soil. In its natural state, this material appears as a fine-grained weak and altered rock, generally in unsaturated conditions. Steep cut slopes made by this material could remain stable for a long time unless weathering weakens its mechanical behavior and heavy rainfall provokes a rapid landslide. This paper presents the results of an experimental investigation on the microstructural, petrophysical, and geotechnical properties of lateritic soil from a road cut slope located in Kabaya (Ngororero District—Rwanda), which was recently subjected to a landslide. The mechanical properties of the material are strictly related to the geological origin and history of the deposits, their formation environment, and weathering processes. These characteristics were revealed by peculiar microstructural features (micro-texture, porosity, and degree of alteration of original mineral paragenesis). The experimental investigations included identification and classification tests, direct shear tests on saturated samples, and swelling tests. This multidisciplinary approach provided insights into the relationship between geotechnical properties and the microstructural, petrophysical, and chemical characteristics of the altered rocks. This study showed how different levels of chemical alteration operated by weathering processes, in conjunction with brittle deformation related to the tectonic history, formed in the same site two shallow rock layers with similar macro-scale features and mechanical behaviors but markedly different microstructural and chemical properties. The innovative aspect of this research suggests an integrated multidisciplinary approach to considering microstructural aspects in addition to mechanical behavior in the slope stability analyses in lateritic soil. In particular, this study demonstrates the importance of such an approach since the failure mechanism is better explained if it is based on microstructural observations instead of considering the soil shear strength parameters only. This research helped to explain the formation of the landslide failure mechanism in a specific road cut slope, which could be assumed as representative of many other similar slopes subjected to landslides in Rwanda.

1. Introduction

Landslides are widespread natural phenomena that cause lots of damage to structures, infrastructures, human activities, and human life. Landslides have proven to be the most challenging socio-economic disasters along road corridors in hilly landscapes all over the world, which led to huge losses of life and property and environmental deterioration [1,2,3,4]. Some areas in the world are particularly affected by these phenomena. For example, mountainous Asian regions are impacted by extreme monsoonal rainfall that triggers many landslides, resulting in human impacts and damage to infrastructure every year [5]. Some mountainous areas in Sub-Saharan Africa, which include the Democratic Republic of Congo (DRC), Uganda, and Rwanda, are particularly landslide prone and are representative of other mountainous regions in the tropics [6]. Moreover, these areas have many characteristics in common with tropical regions where landslides cause loss of lives and damage to infrastructure and, at the same time, landslide hazard is still poorly understood [7,8,9,10,11]. In particular, Rwanda extends over a mountainous region, which is characterized by very steep slopes. Mountain reliefs with heights of up to 4486 m above sea level mostly dominate the western and northern areas of Rwanda. Due to the steep topographic gradient, associated with the construction of extensive road cut slopes, landslides in Rwanda are very frequent phenomena [12,13,14,15].
Most failures, in Rwanda as in other countries, regard road cut slopes and are caused by the natural weathering of soft rocks, which appear rather stable in the short term after excavation but become unstable and may fail in the long term [16,17]. For some cut slopes, failures are due to extreme steepness, slope height, and inadequate estimation of soil resistance. In most cases, especially in Rwanda, slope failures are caused by heavy rainfalls associated with human interventions, such as excavations, the construction of roads and buildings, and logging [18]. Every year in Rwanda, landslides cause loss of human lives, damage to properties, and leave hundreds of people homeless due to house destruction. One of the most recent disasters caused by heavy rainfalls occurred during the night of 2–3 May 2023, resulting in significant damage and loss of lives in different parts of the western, northern, and southern provinces. The disasters claimed the lives of 131 people, injured several others, and damaged public infrastructures [19].
The soil that covers most of Rwanda’s northern and western mountains derives from the weathering of the original bedrock. It is well known that weathering is one of the predisposing causes of landslides. Some researchers investigated the impact of weathering on slope stability in soft rocks, demonstrating that weathering produces both shear strength reduction in deeper layers and the disintegration of material on the surface of the slope [20].
Two dominant processes are recognized: chemical and physical weathering. Chemical weathering is the decomposition of the constituent minerals into more stable secondary mineral products, while physical weathering is related to the disaggregation of rocks without significant variation in mineralogical composition [20]. The properties of rocks and their behaviors during exposure to exogenic agents are mainly controlled by their mineralogical composition, pre-consolidation history, level of cementation and rock texture, and composition of binding material in their structure. Of course, water content plays a crucial role in the alteration of soft rocks [20]. Depending on the mineralogical composition of the rock and the chemical composition of water, different forms of chemical weathering can develop on the rock surface [20]. In combination with weathering, especially in road cut slopes, the removal of material during excavations produces a stress release that provokes the formation of internal weakness surfaces, which may be exploited during failure [20].
Although the effect of weathering on the shear strength reduction is widely studied in many regions characterized by the presence of tropical unsaturated soils, in Rwanda, there are very few detailed studies on both soils and soft rocks subjected to landslides at the moment.
In other similar environments in Africa, weathered soils are often named “lateritic soils”. According to Oyelami and Van Rooy [21], the term “lateritic soil” is used to describe a highly weathered tropical or sub-tropical residual soil, which is generally well graded and coated with sesquioxide-rich concretions. Residual soils are formed directly or almost directly on the parent rock, making it possible to retain some of their characteristics [21,22]. These residual soils are generally produced by intense chemical weathering due to relatively high air temperature and high water content [23]. The geotechnical behavior of lateritic soils is mainly controlled by micro-textures, mineralogical compositions, and geochemical environmental conditions. Normally, alternating rainy and dry seasons favor the formation of thick lateritic soils. In fact, when the rainy season leaching of the parent rocks takes place during the dry season, capillary action transporting solutions of leached ions to the surface occurs. From the surface, the evaporation of water leaves the salts behind to be washed down during the following wet season. Thus, the whole zone could be progressively depleted of the more mobile elements, such as K, Na, and Ca [24]. Olanipekun [25] observed that the high proportion of Fe3þ oxides in laterites signifies a left-over accumulation as a result of the removal of alkalis and silica. Moreover, it seems that chemical weathering progresses more rapidly in warm than in cool climates, and provided there is good drainage, it is more prevalent in wet than dry climates [26]. This explains the more pronounced lateralization processes observed in the tropics compared to arid regions.
Kasthurba et al. [27] observed a downward softening of altered material as a result of an increase in the amount of clay-filled pores and a decrease in sesquioxide cementation. This explains why, in most cases, lateritic profiles are characterized by kaolinitization at lower levels, and the accumulation of sesquioxides occurs in the upper horizons.
Depending on the percentage of clay and the presence of expanding clay minerals, some lateritic soils change volume when exposed to humidity variations, while others are not affected [21]. Hence, some components, such as sand and gravel, are referred to as stable, while silt and clay are referred to as unstable. Stability in this sense is based on their ability to withstand variations in terms of moisture without a significant change in their properties [21].
Many studies have been carried out at a microscopic level to investigate the mechanical behavior of some lateritic soils in partially saturated conditions. Gao et al. [28] investigated the influences of drying–wetting cycles and dry density changes on the water retention characteristics of compacted lateritic soils. They used scanning electron microscopy and mercury intrusion porosimetry to explore the underlying microscopic mechanism. Kong et al. [29] evaluated the effects of multiple drying–wetting cycles on the soil–water characteristic curve (SWCC) of some undisturbed granite residual soils. They also applied advanced techniques to analyze the structure at the microscopic level to understand the possible microstructural variations of granite residual soils subject to a periodic drying and wetting process. Bai et al. [30] investigated the mechanical behavior of lateritic soil using the pressuremeter test, obtaining a pressuremeter curve that was analyzed in combination with the actual soil conditions. They determined the strength and deformation characteristics of lateritic soil under different free-iron oxide contents and different depths.
This paper presents the results of different investigations carried out on lateritic soil that was subjected to a landslide in early May 2018 in Kabaya, Ngororero district (Rwanda). The landslide is regarded as a road cut slope, which can be considered representative of many similar situations in the surrounding areas. The micro-investigations were carried out on two different soil samples, collected at different depths on site, and aimed at understanding which aspects of the microstructure could be considered directly related to the triggering mechanism of the landslide.
In particular, laboratory analyses included soil classification, which was carried out through both classical techniques and laser diffraction analysis, microstructural characterization connected with two-dimensional porosity estimation, mineralogical–chemical analysis via SEM, failure conditions through direct shear tests on saturated samples, and swelling tests.
The microstructural analysis showed how different levels of chemical alteration operated by weathering processes, which, in conjunction with the tectonic history, produced the formation of two shallow rock layers with similar macro-scale features and mechanical behavior but markedly different microstructural and chemical properties. Based on both microstructural and geotechnical characterization, this study demonstrated that the deepest layer was weaker than the more superficial one. This research helped to explain the formation of the landslide failure mechanism in correspondence with the weaker layer at the slope toe.
The main outcome of this research is emphasizing the importance of considering microstructural aspects in addition to mechanical behavior in the slope stability analyses in lateritic soil since the triggering mechanism of the landslide could be better explained based on microstructural observations than on shear strength parameters only.

2. Geological Origin and Site Description

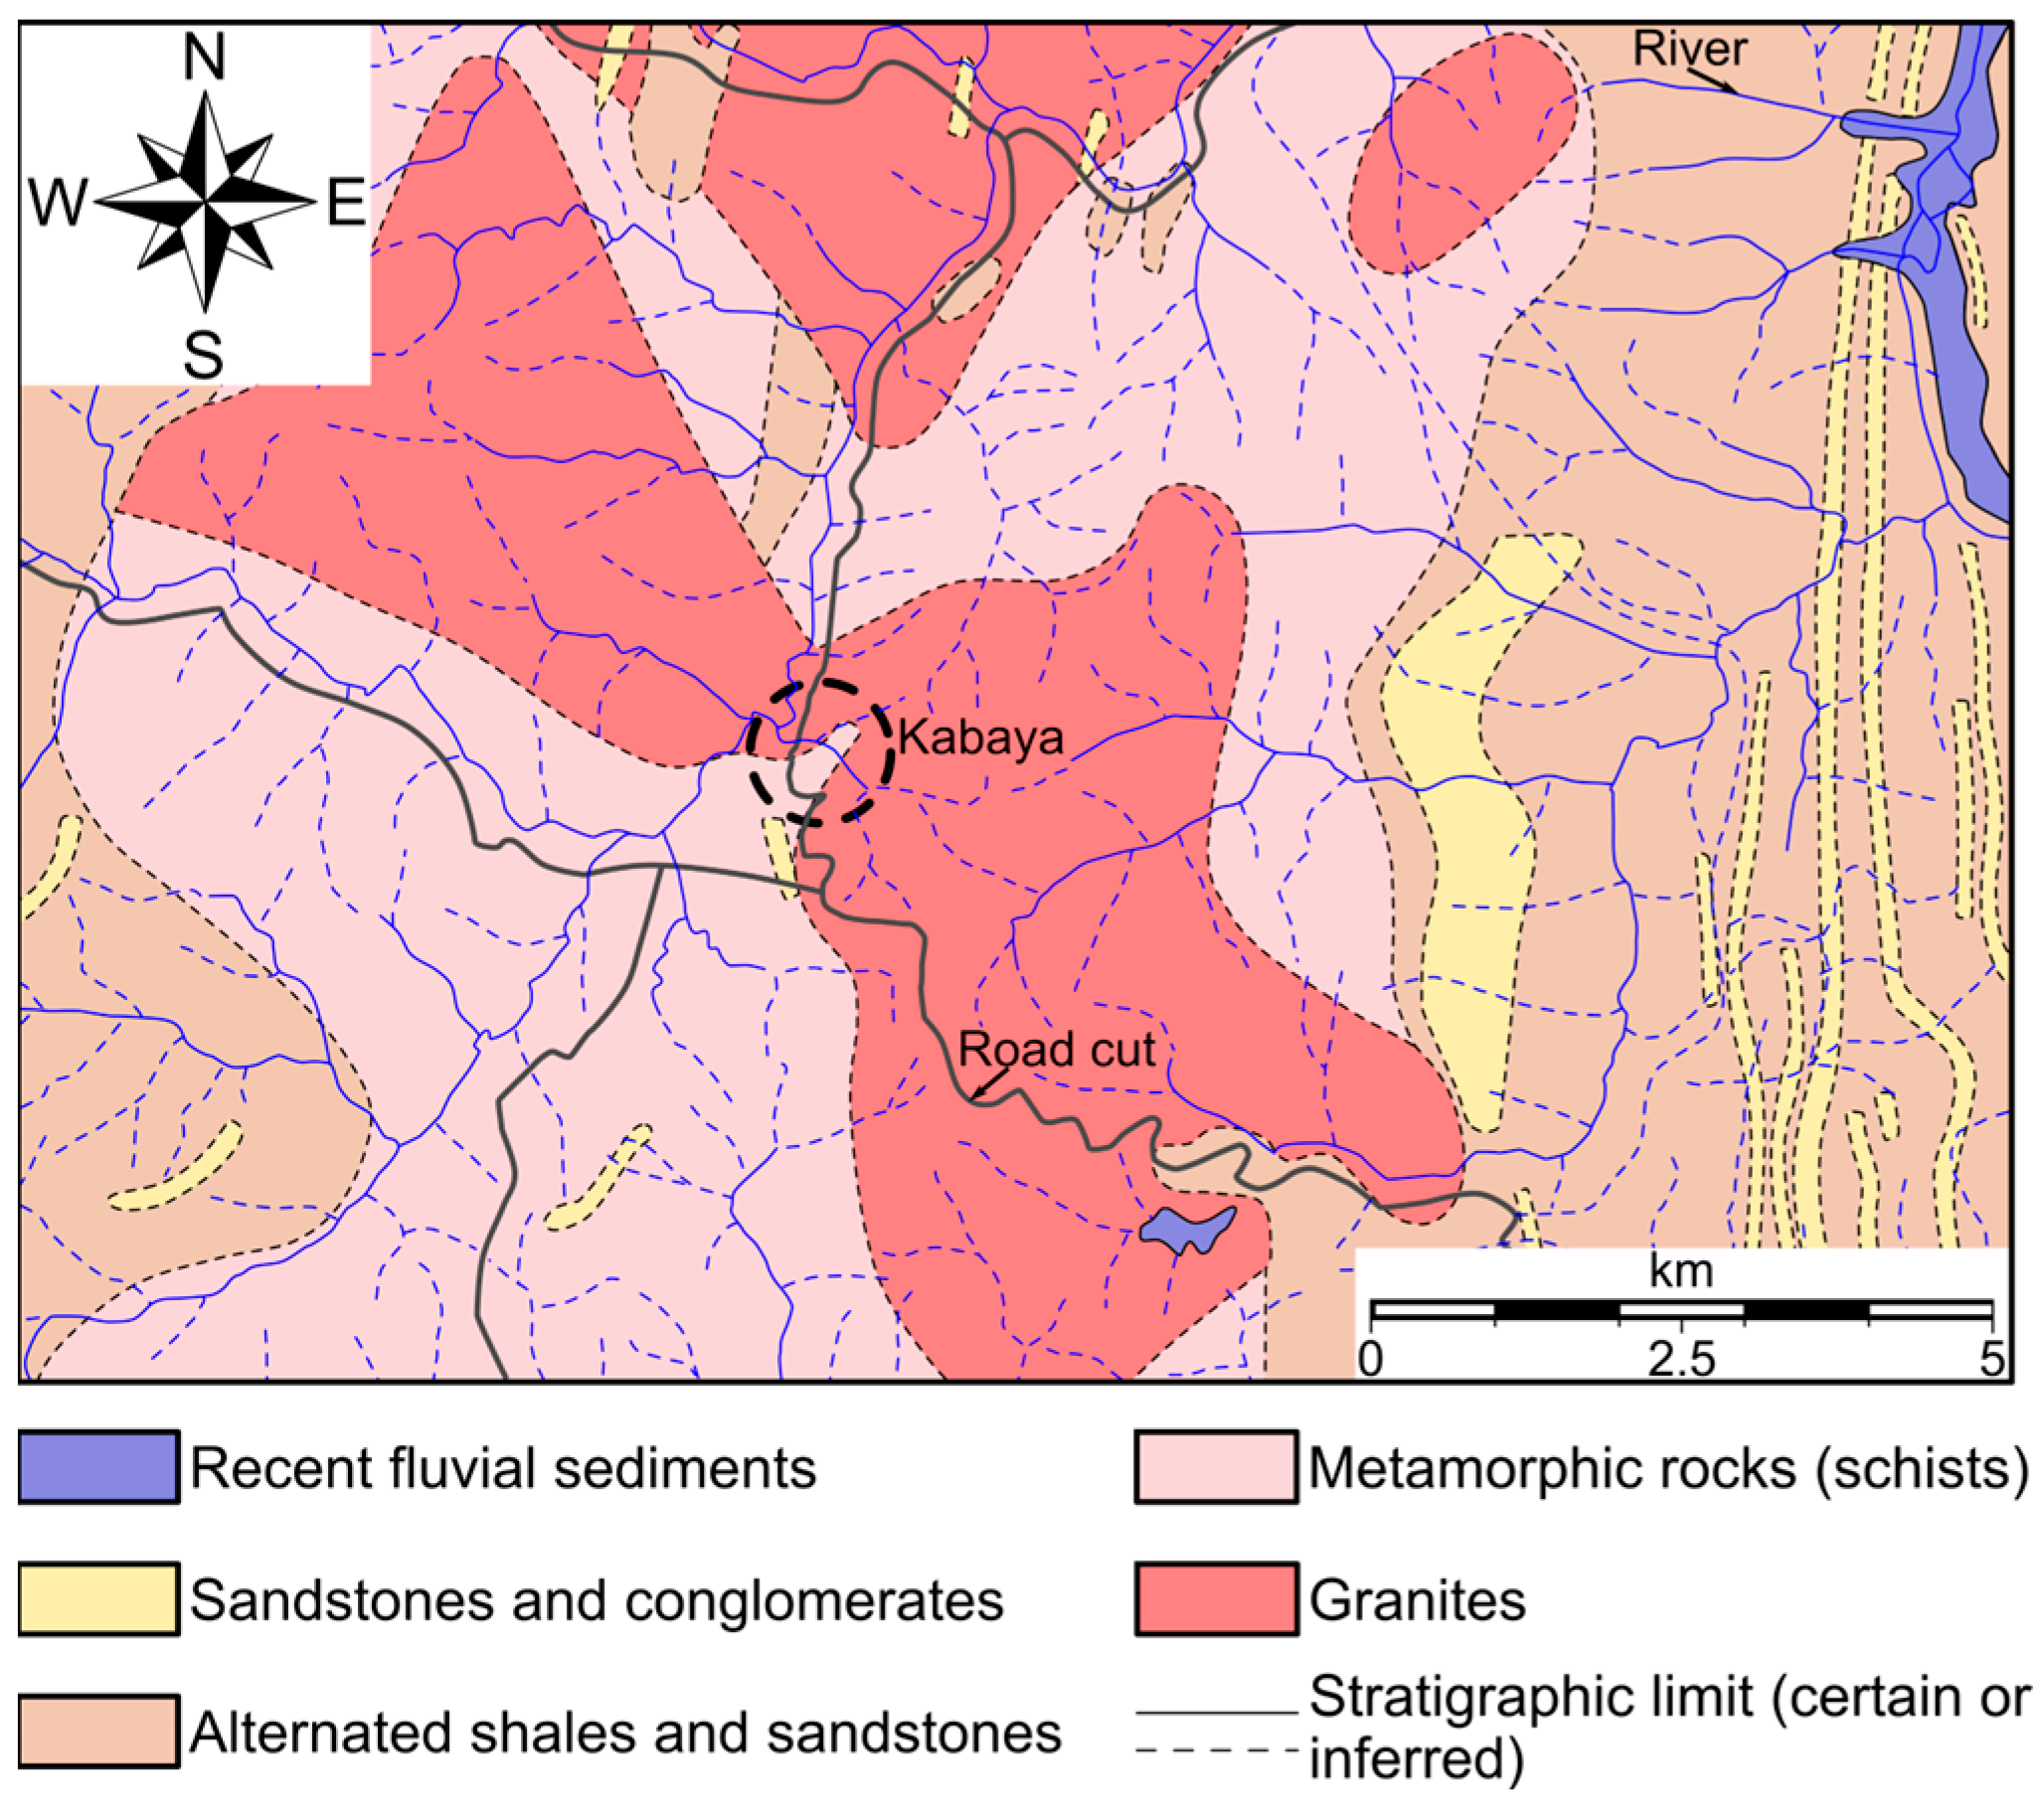
The geology of Rwanda is dominantly composed of ancient metamorphic and igneous-intrusive rocks, followed by more recent lava flow emissions and subordinate sedimentary rocks [31]. The oldest rocks are located in the eastern Kivu lake district, at the southern border with Burundi, and in the central north-western region, where extensive exposures of Paleoproterozoic rocks (2.5 to 1.6 Ga) are present (Figure 1). These rocks are mainly composed of gneisses, schists, quartzites, and granites, which experienced severe alteration to sericite (alteration of alkali feldspar minerals to sericite) operated by weathering processes in conjunction with brittle deformation. Paleoproterozoic rocks are followed by the Mesoproterozoic series (1.6 to 1.0 Ga), which are composed of sedimentary rocks (sandstone and conglomerate) metamorphosed at high-temperature and low-pressure conditions (quartzite) (Figure 1). In the westernmost portion of Rwanda, dominated by Lake Kivu, there is extensive occurrence of lavas and associated pyroclastic rocks, the oldest of which can be dated back to the Cretaceous–Paleogene boundary (65 Ma). Volcanic rocks dated to the Cenozoic are found in the northwest and west of the country. Some of these volcanoes are highly alkaline and are the prosecutions of the Virunga volcanic area of southwestern Uganda. Tertiary and Quaternary clastic sediments fill parts of the Western Rift in the western part of the country, as well as other lakes in eastern Rwanda [32]. The Kabaya landslide, which is the focus of the present study, is located in the northwestern region, where rocks belonging to the Paleoproterozoic sequence crop out, at the boundary with Plio-Pleistocene age basaltic lava flows. In the study area, rocks are classified as gneisses, granites, and metamorphic schists (Figure 2) [31].

Case Study in Ngororero District

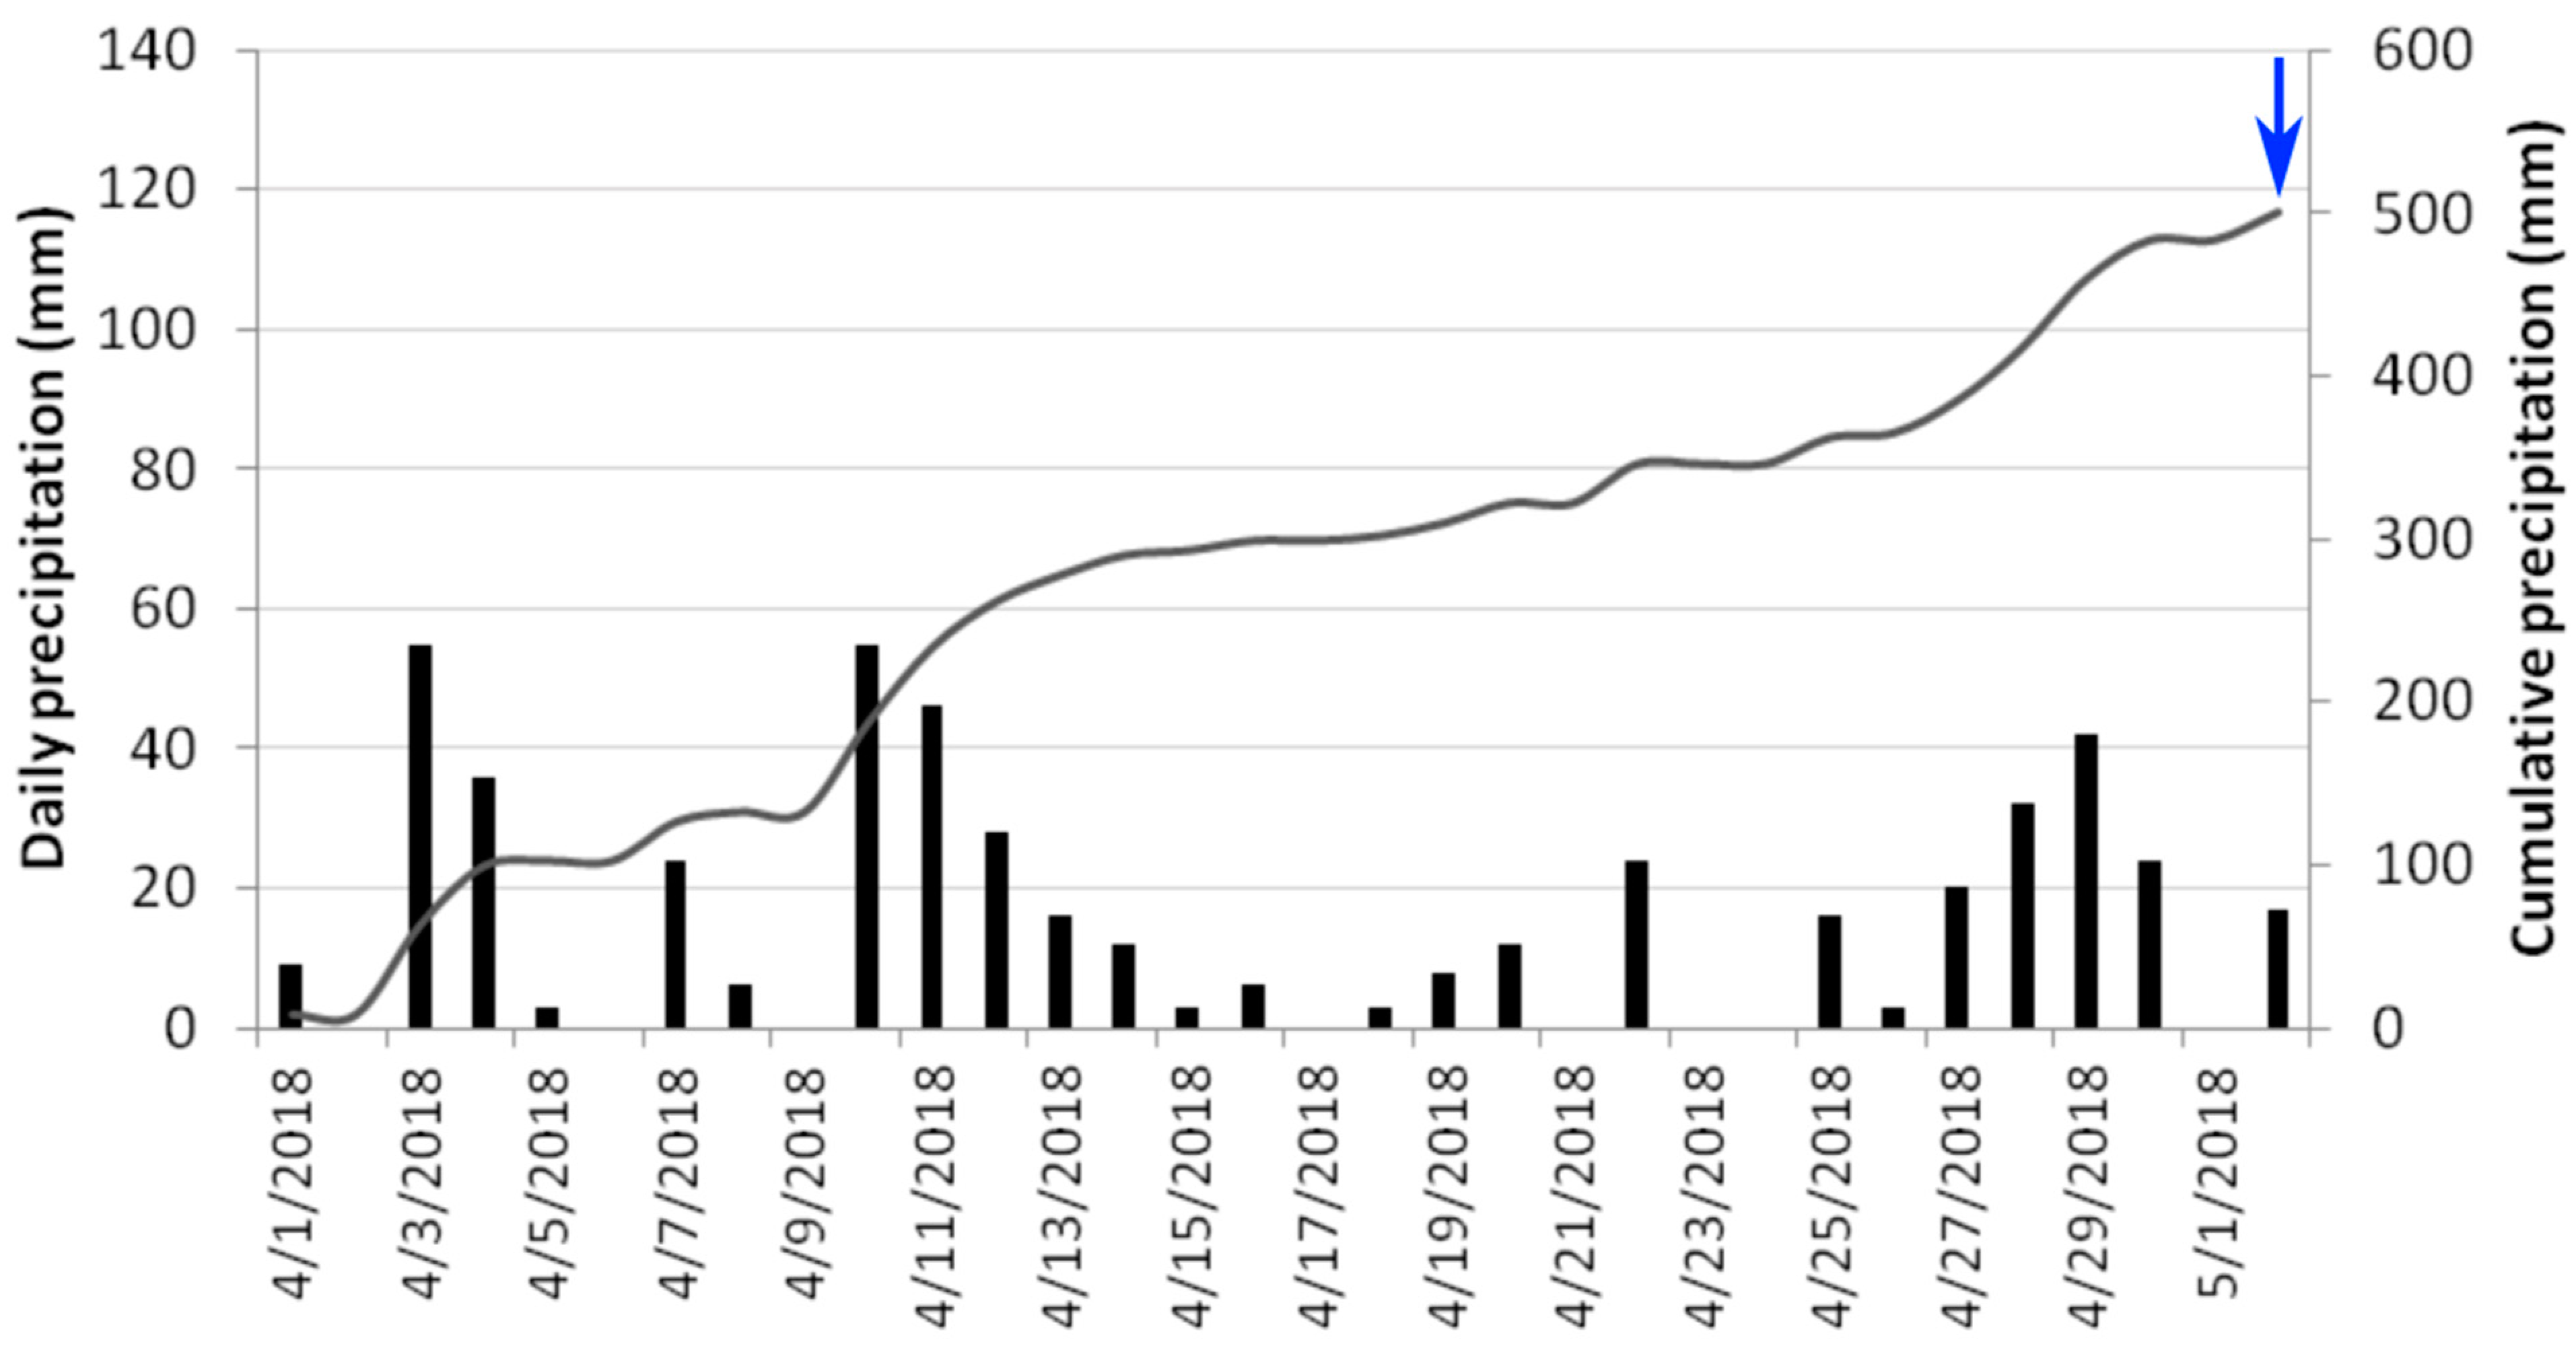
The study site is located along National Road NR16 at Kabaya, Ngororero district, where a road cut slope was subjected to a landslide on 2 May 2018 (Figure 3). The landslide occurred during a wet period, characterized by a cumulative rainfall of 500 mm in one month. A daily rainfall of 17 mm was registered on the same day of the landslide occurrence (Figure 4).
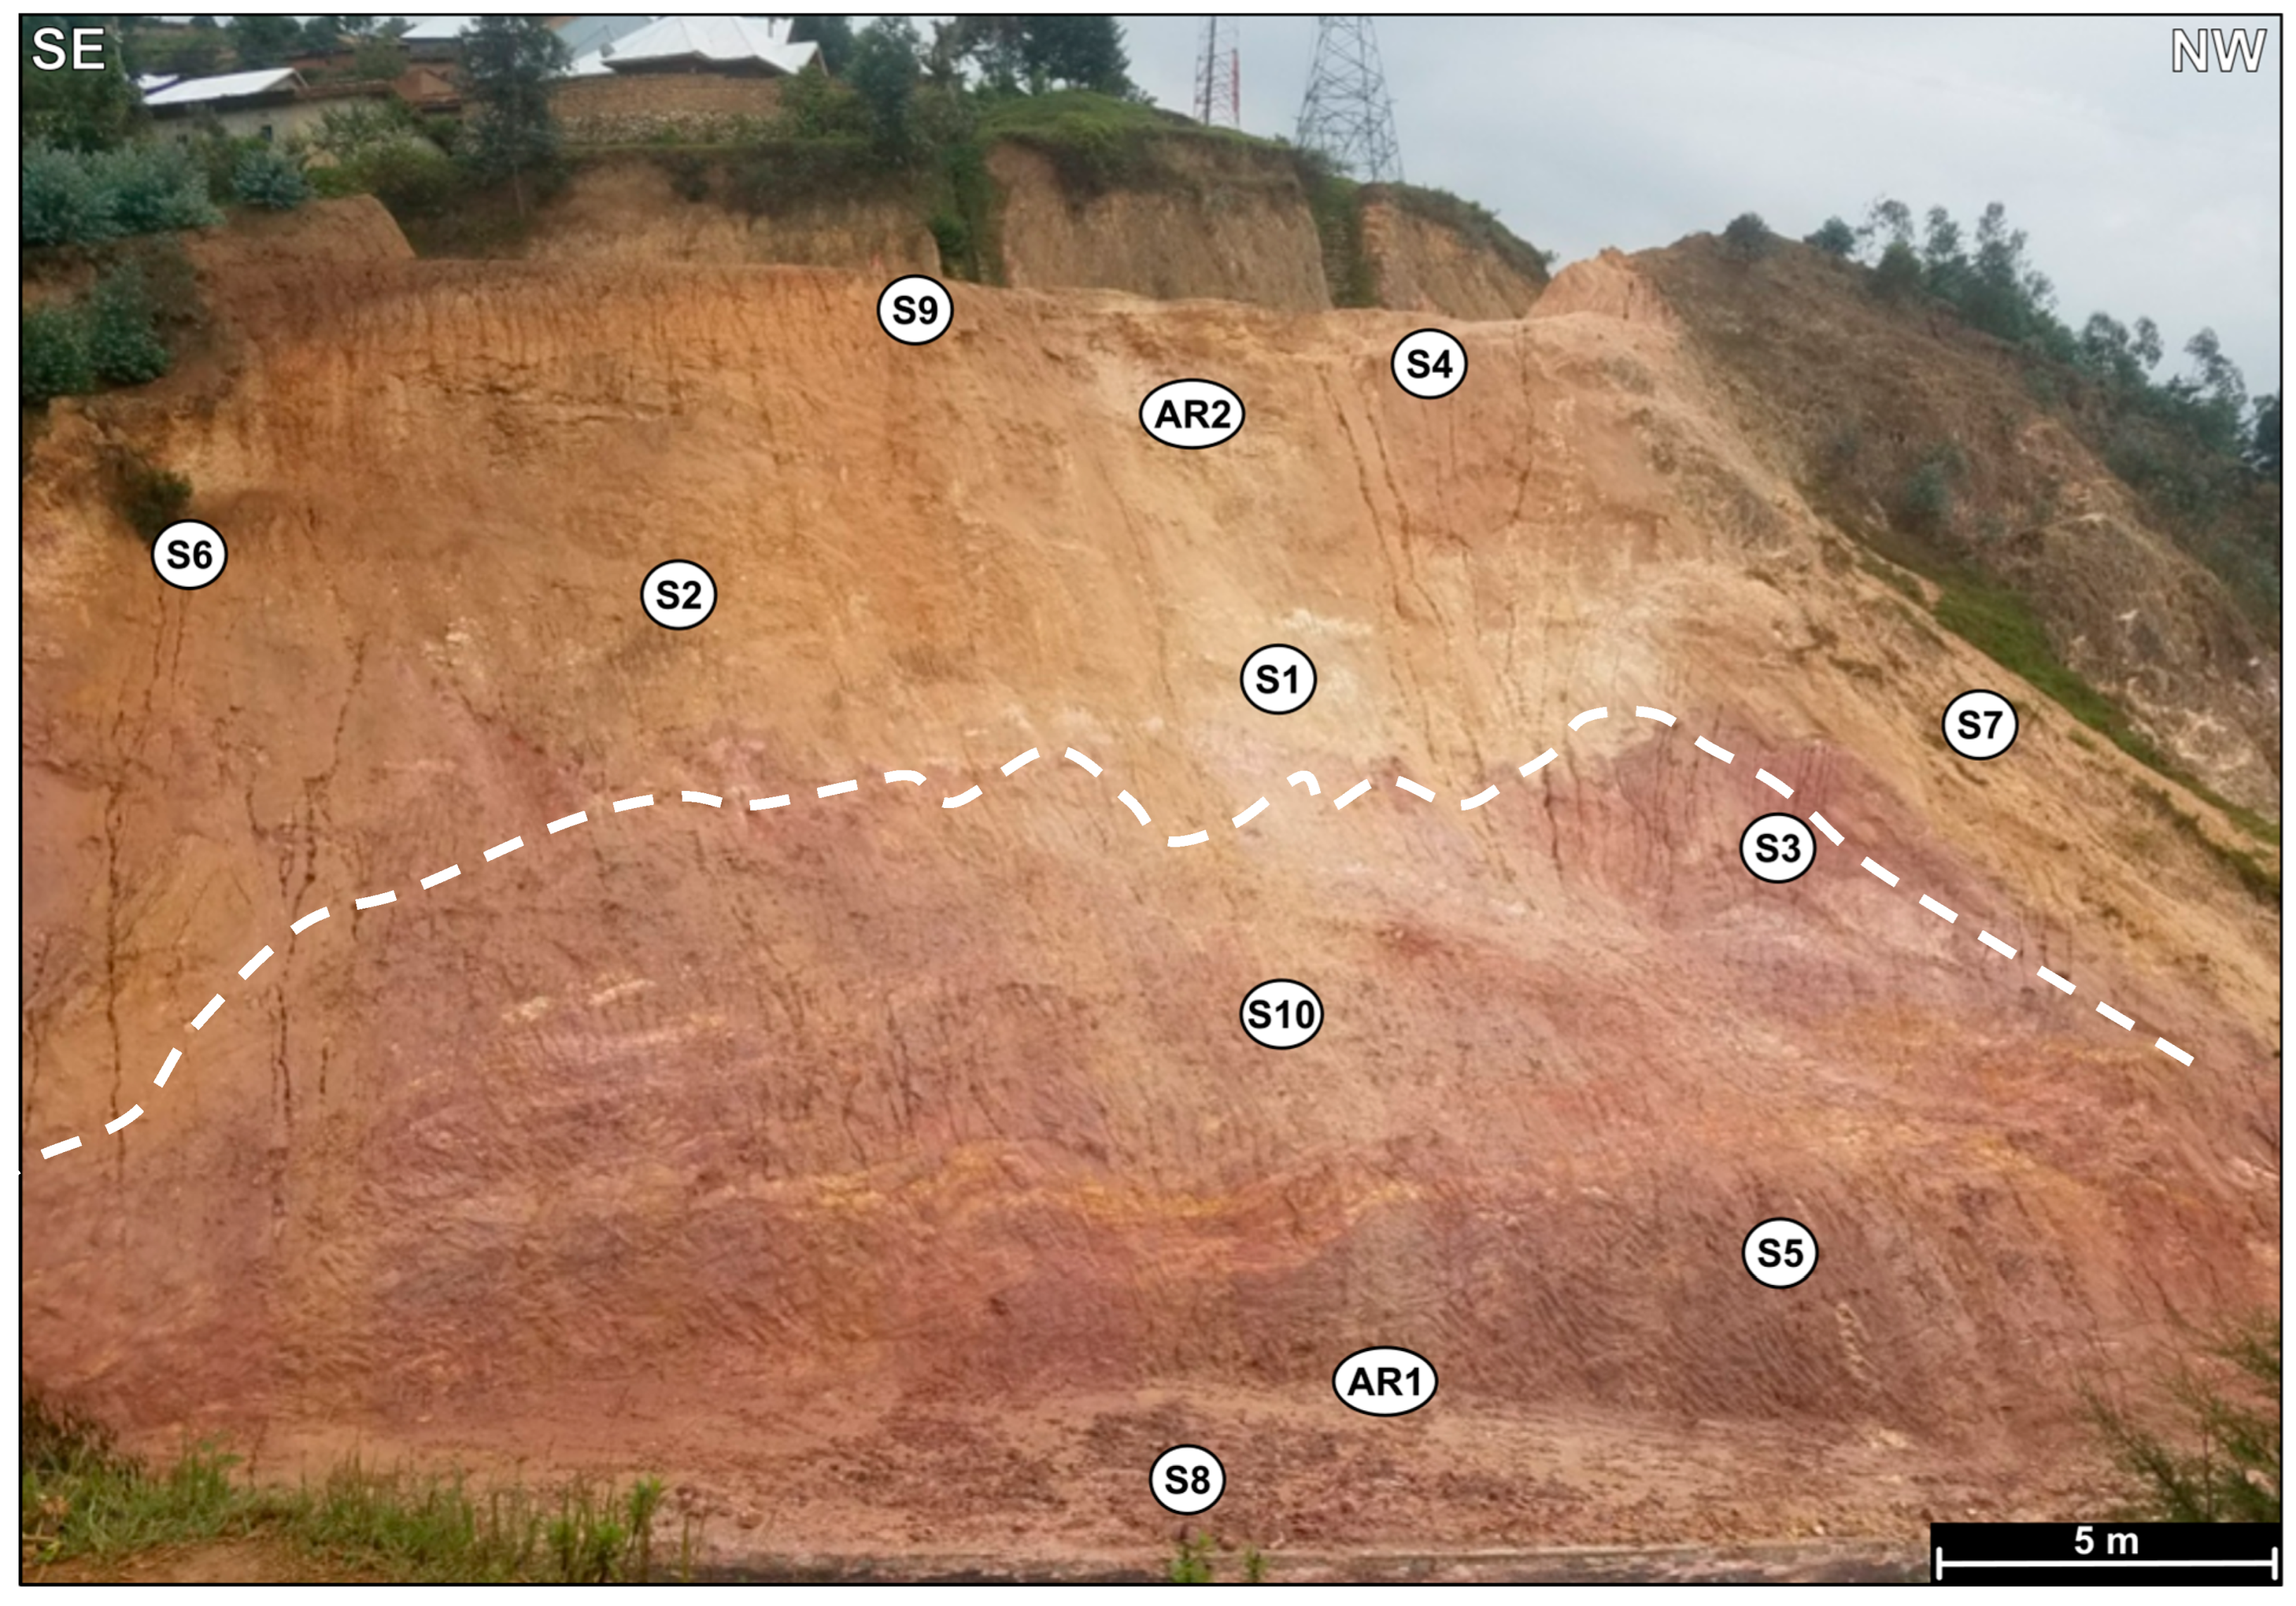
The slope is close to the top of a hill (2300 m a.s.l.) in an urbanized area, where many houses, power lines, other roads, and facilities are located. The site elevation is comprised between 2260 and 2285 m a.s.l., the total height of the road cut is 25 m, and the mean slope angle is 37°. The thickness of the soil involved in the landslide was from 2 to 6 m. The slope was covered by trees and shrubs before the collapse. Immediately after the landslide occurred, the underlying soft rocks appeared completely disintegrated into heterometric material with sizes spanning from boulders to fine sand, which blocked the road drainage system and obstructed the roadway (Figure 3b). Figure 5 shows how the slope appeared on 3 December 2018, i.e., some months after the landslide occurred. The shallow bumpy soil had been removed from the scarp and exposed the soft bedrock of the slope. The bedrock appears composed of whitish (above) and reddish (below) soil layers with some thin yellow stripes (Figure 5). By comparing Figure 3 and Figure 5, it is evident that the reddish soil layer was exposed at the toe of the road cut slope even before the collapse. Further rainfall runoff caused the formation of incised drainage pathways and gullies along the main slope (Figure 5). Figure 6 shows a sketch of the slope before failure, which has been determined based on a field survey. Figure 6 also reports the position and shape of the failure surface and the location of soil samples. It must be considered that the geometrical situation of the slope before failure was the result of a previous excavation of the natural slope due to the road construction. Therefore, it could be supposed that the original natural slope was composed of a shallow whitish soil layer and a deep reddish soil layer. After the road construction, the reddish layer appeared exposed at the slope toe, as reconstructed in Figure 6. For this reason, in the following, the whitish layer will be also called “shallow” and the reddish one will be assumed as “deep” by referring to the original “natural” situation. As will be explained, both whitish and reddish lateritic soils involved in the landslide were classified as sandy silt, derived by weathering of the parent bedrock. The lateritic soils in this site normally appear as cohesive soft rock in dry or partially saturated conditions, but they become completely de-structured when they are fully saturated.

3. Materials and Methods

In this section, all the experimental procedures, tests, and methodologies adopted in classifying and characterizing the geological materials involved in the studied landslide process are described. Used procedures include sieving, sedimentation, laser optical grain size analyses, the definition of Atterberg limits, microstructural characterization, micro-porosity quantification, SEM-EDS chemical analyses, swelling tests, and direct shear tests. The results and observations deduced from the laboratory tests will be reported in a further section.

3.1. Classification of Materials

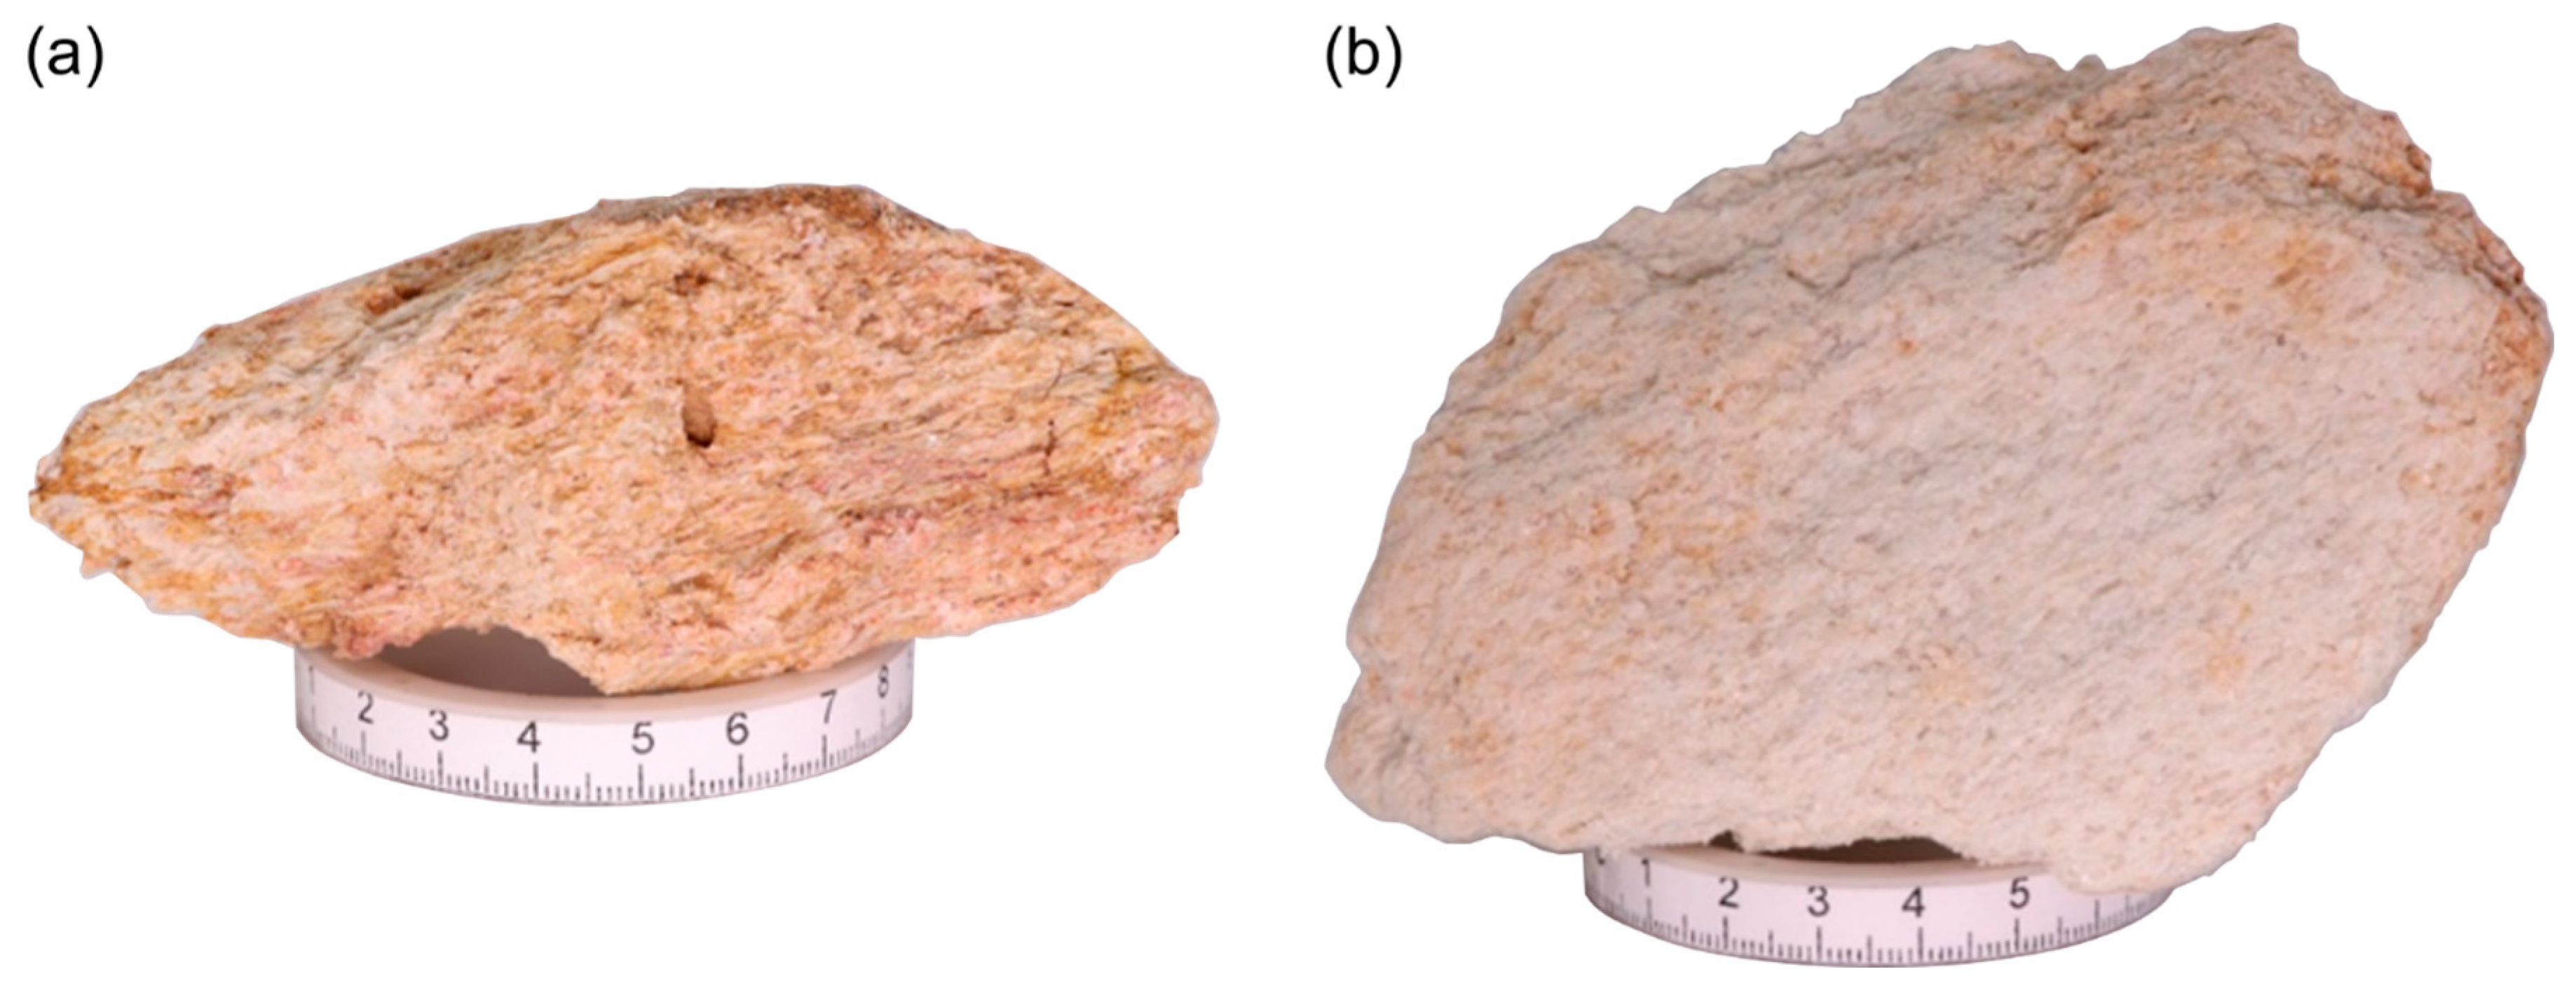
To obtain the geotechnical characterization of the soils involved in the landslide, a total of twelve soil samples were collected in different positions on the landslide scarp from the substrate that remained stable during the landslide (Figure 5). This material was considered representative of the soil that the landslide transported at the slope toe and that was lost. Ten of these samples (S1–S10) were completely disturbed, i.e., it was not possible to preserve their structure during in situ sampling, as the soil was suddenly disintegrated when subjected to the slightest pressure. Some samples were collected at 1 m of depth and were positioned at the top of the slope in the whitish layer. Instead, samples collected at 2 m were positioned in both the whitish (S1; S2) and reddish (S3; S5; S8; S10) layers, either in the center of the slope or near the slope toe (Figure 5). Two further samples, namely AR1 and AR2, were collected at 2 m and 1 m of depth, as representative of the reddish and the whitish layers, respectively. These two samples were almost undisturbed since they had the appearance of cohesive soft rocks in partially saturated conditions (Figure 7), and it was possible to collect them in “big” blocks. It should be noted that all the sampling points are located on the sliding surface for representativeness (Figure 5 and Figure 6). Samples S1–S10 were analyzed to obtain the geotechnical classification according to the USCS system based on standard laboratory tests, such as sieving [33] and sedimentation [34]. Specifically, the sieve analysis was performed to obtain the size distribution of the fine particles (coarser than 0.075 mm). The sedimentation analysis was only used for four samples, namely S1, S4, S7, and S10, to determine the grain size distribution curve of materials passing through sieve No. 200 (0.075 mm). As will be discussed (Section 3.4), the grain size distribution curves of the AR1 and AR2 samples have been obtained with a different analytical procedure.
The Atterberg limits were only obtained according to standard tests [35] for samples AR1 and AR2.

3.2. Microstructural Characterization

Microstructural and micro-textural characteristics of soft rocks involved in the studied landslide were evaluated with optical microscopy. AR1 and AR2 samples were impregnated with blue-dyed epoxy resin to emphasize both primary and secondary porosities of the rock and to harden the hand specimens. After resin impregnation, the samples were cut with a precision saw, and a total of 6 serial, 30 µm thick, thin sections were produced. Thin sections were polished with synthetic diamond powder to improve the transparency and facilitate mineral identification under an optical microscope. Rock-thin sections were scanned with a high-resolution Nikon SuperCoolScan 5000 scanner to describe the overall rock texture. Subsequently, thin sections were observed under a Zeiss Axioplan 2 optical, transmitted light, petrographic microscope, equipped with a Leica MC 170 HD high-resolution camera that is suitable to work on rock samples.

3.3. Mineralogical–Chemical Analysis via SEM

Detailed microstructural and chemical analyses were conducted on the AR1 and AR2 samples with a JEOL JSM 6400 Scanning Electron Microscope (SEM) attached to an Oxford-INCA X-ray Energy-Dispersive System (EDS) with an electric current of 15 kV and 240 nA. The diameter of the analytical EDS X-ray spots was 2 µm, much smaller than the crystal size of minerals composing the analyzed rocks (>1000 µm). The mineral composition was identified by comparing X-ray emission spectra with the provided datasets.

3.4. Laser Diffraction Granulometry Analysis

Grain size analysis through optical granulometry was performed on the AR1 and AR2 samples. Prior to the analysis, disaggregation of soft rocks was needed to reduce them to a granular, cohesionless material. Both rock specimens (sample mass of ~200 g) were inserted in tap water for ~one hour and manually stirred to facilitate disaggregation (see the procedure described by Pizzati et al. [36]). Disaggregated materials were inserted into an oven at a controlled temperature of 40 °C for three days to remove most of the moisture. After sample dehydration, a soft manual disaggregation was performed to remove all the remaining aggregates. The total mass of samples was split into smaller aliquots using Quantachrome Instruments macro- and micro-rifflers. The splitting procedure allowed us to gain smaller sample amounts (<1 g) while still preserving the original grain size classes of the total initial sample. All granulometric analyses were carried out with a Malvern Panalytical Mastersizer 3000 optical granulometer, operating at a grain size range from 10 nm to 3500 µm. The granulometer was equipped with a Hydro EV liquid-dispersion analysis modulus, and de-ionized water was used as a dispersant medium. The instrument calculated the grain size based on the Mie light diffraction theory [37], approximating non-spherical particles to perfect spheres with associated equivalent diameters. To extract reliable light scattering distributions, the Mie theory required the refractive and adsorption indexes of the analyzed material. In our samples, we adopted the optical parameters of crystalline quartz (refractive index of 1.54 and adsorption index of 0.1). Standard operating procedures were specifically set for both samples in order to perform reliable and reproducible analyses [38]. In particular, AR1 sample operating parameters included a sample mass of ~0.3 g, a stirrer speed of 2400 rpm, 50 measurements with a 10 s laser activation time, and ultrasonication at 10% for 10 min before the analysis. Conversely, for AR2, a sample mass of 0.7–0.8 g, a stirrer speed of 2200 rpm, 100 measurements with a 5 s laser activation time, and no ultrasonication were adopted.

3.5. Two-Dimensional Porosity Estimation

Porosity estimation was obtained from high-resolution petrographic photomicrographs taken under transmitted light microscopy on the AR1 and AR2 samples. A total of 75 photomicrographs were acquired to characterize the 2D porosity of different mineralogical phases composing the overall rock framework. All photomicrographs were acquired at 25× magnifications (picture area of 2352 × 1764 µm) and were imported into ImageJ version 1.53s, which is an open-source image analysis software [39]. Photomicrographs were calibrated and corrected to increase the image contrast-brightness and to remove background noise. Porosity was estimated by calculating the percentage of area composed of blue dye-filled voids with respect to the total photomicrograph area. Porosity calculation on the same mineralogical phase was performed on several photomicrographs to grant statistical robustness of data and to consider the variation of porosity distribution throughout the entire thin section.

3.6. Mechanical Characterization

To investigate the possible expansive behavior of the soil, the AR1 and AR2 samples have been subjected to swelling tests to determine the swelling pressure using the oedometer device and the constant volume method (Method C) based on [40].
The failure conditions of soils have been obtained by performing consolidated drained (CD) direct shear tests on the AR1 and AR2 samples based on British Standards [41]. The same laboratory tests have been recently performed by other researchers on lateritic soils from different geographical areas [42,43,44]. Direct shear tests were performed on saturated specimens, whose size was 60 mm × 60 mm × 30 mm, at a shear velocity of 0.01 mm/min. Three tests were performed on similar specimens at different normal stresses of 100, 200, and 300 kPa. The first shear test on each specimen allowed for obtaining the peak shear strength. The residual strength of the soil specimen was obtained by performing three cycles of direct shear tests on the same specimen (under the same normal stress). The shear box apparatus returned to its initial position every time it completed its travel. This process was repeated three times, i.e., until the residual shear stress remained constant at subsequent shearing stages. This procedure, although simplified, is known to be used as an alternative to the ring shear test. The objective of the shear tests was to study the shearing conditions in terms of effective stress and to determine the effective shear strength parameters of soils, related to the Mohr–Coulomb failure criterion, in both peak and residual conditions.

4. Results

4.1. Classification of the Lateritic Soil

The grain size distribution curves of ten samples (S1–S10) obtained through traditional tests and those obtained through laser diffraction granulometry analysis (AR1 and AR2) are all reported in Figure 8. It could be noticed that the percentage of fine particles (<0.075 mm) among all samples is between 20% (AR2) and 83% (AR1). The percentage of sand is between 17% (AR1) and 80% (AR2), while the percentage of gravel is nil. The percentage of clay is less than 6% for all samples (only 0.1% for AR2), except for AR1, with a percentage of 11%. The silt fraction is between a minimum of 19.9% (AR2) and a maximum of 72% (AR1). In particular, the laser granulometry analyses conducted on the AR1 and AR2 granular specimens show striking differences, with AR1 being finer with an average equivalent particle diameter of 53.4 µm, while AR2 has a mean diameter of 224 µm.
With regard to the Atterberg limits, LL = 31% and LL = 29% were obtained for the AR1 and AR2 samples, respectively. It was impossible to perform the standard tests to obtain the plastic limit for all the analyzed samples so that the soils could be classified as non-plastic. Table 1 summarizes the results of soil classification based on grain size distribution. Due to the percentage of sand, silt, and clay, and also the lack of plasticity, the specimens were classified as silty sand (SM) or sandy silt (ML) according to USCS.
Based on the grain size distribution, the empirical Equation (1) proposed by Puckett et al. [45] was adopted to estimate the saturated hydraulic conductivity (Ks) of the soils as follows:
K s = 4.36 · 10 5 e 0.1975 · C
where C is the percentage of clay content. The obtained values of Ks are reported in Table 2. The hydraulic conductivity of the reddish layer is one order of magnitude higher than the whitish layer. These relatively high values are typical of residual soils in their intact state and are due to their distinctive formation process [46].

4.2. Microstructural Features

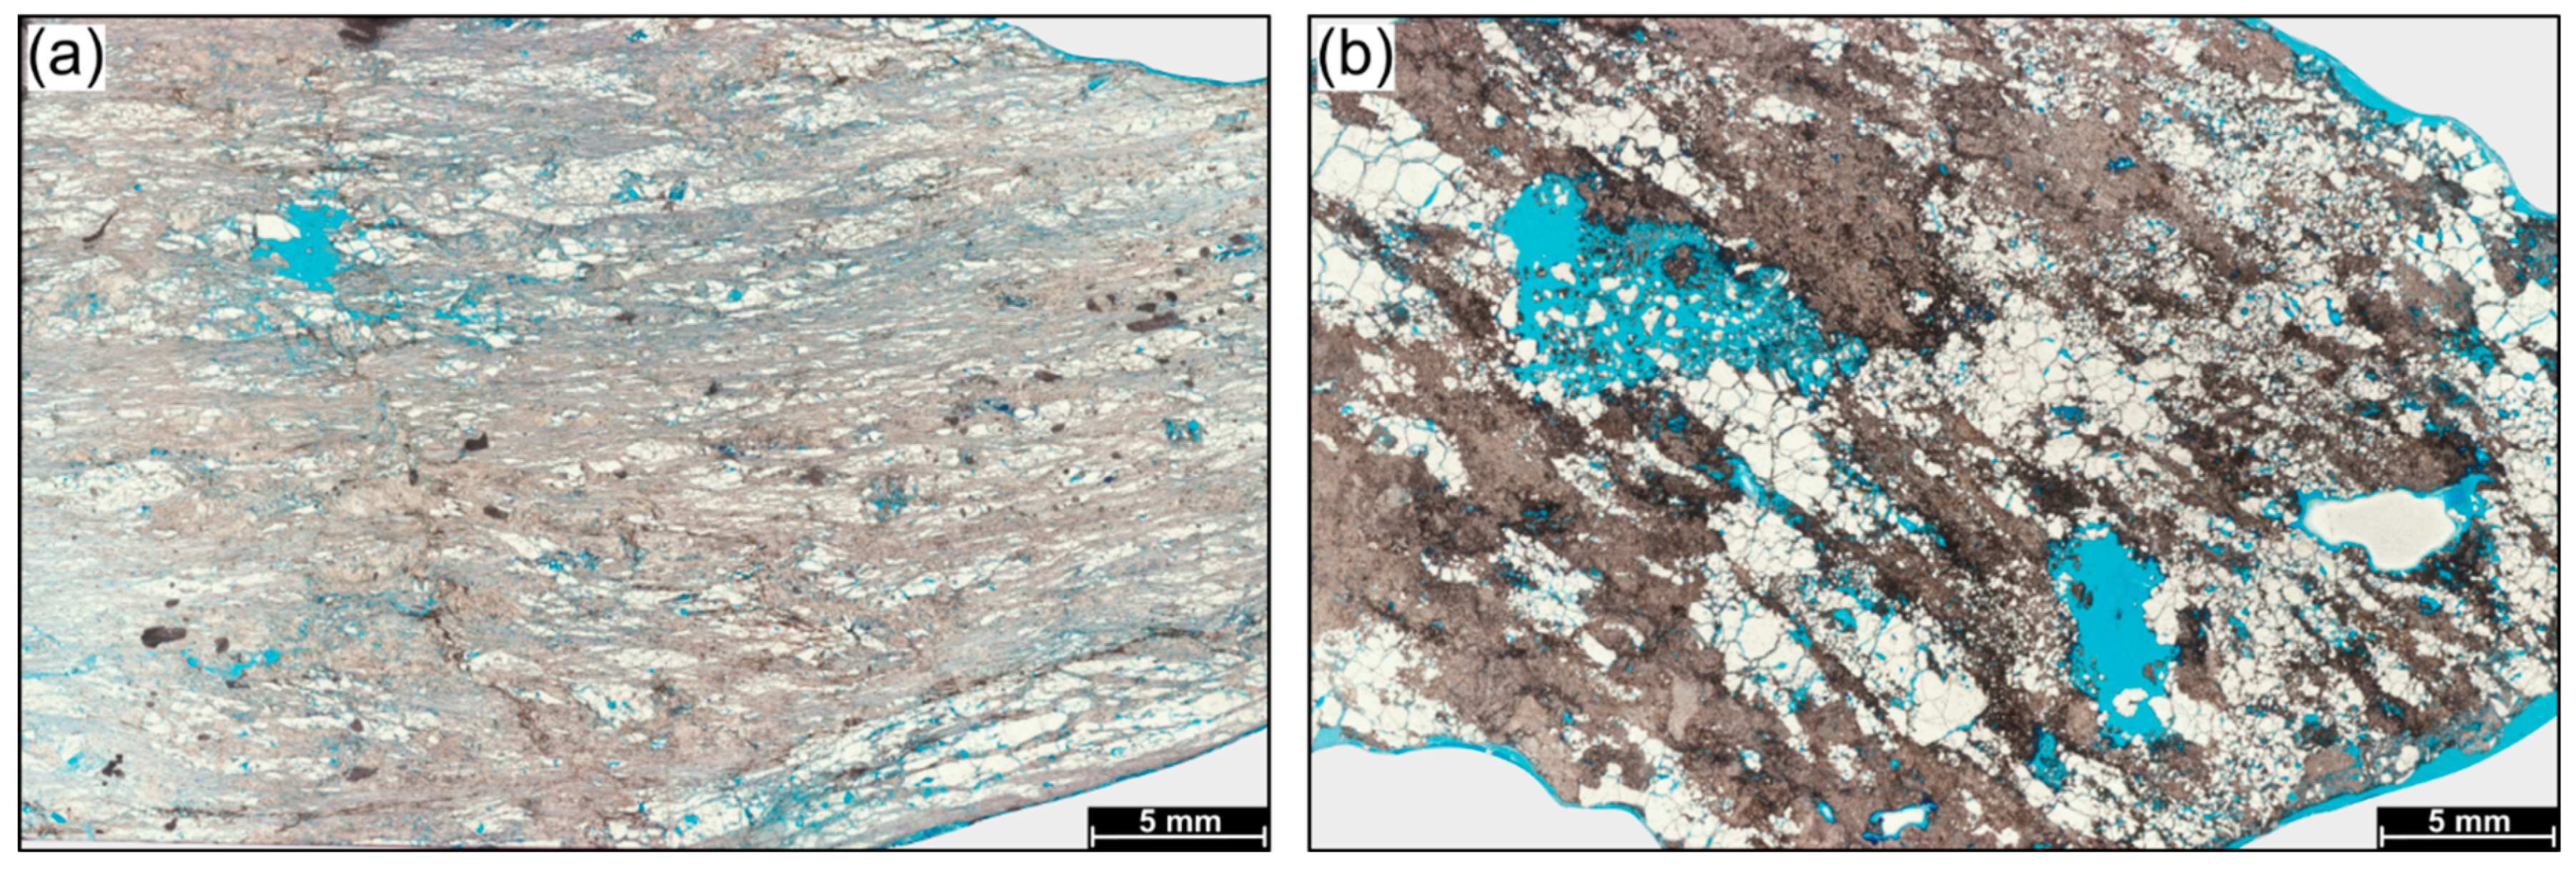
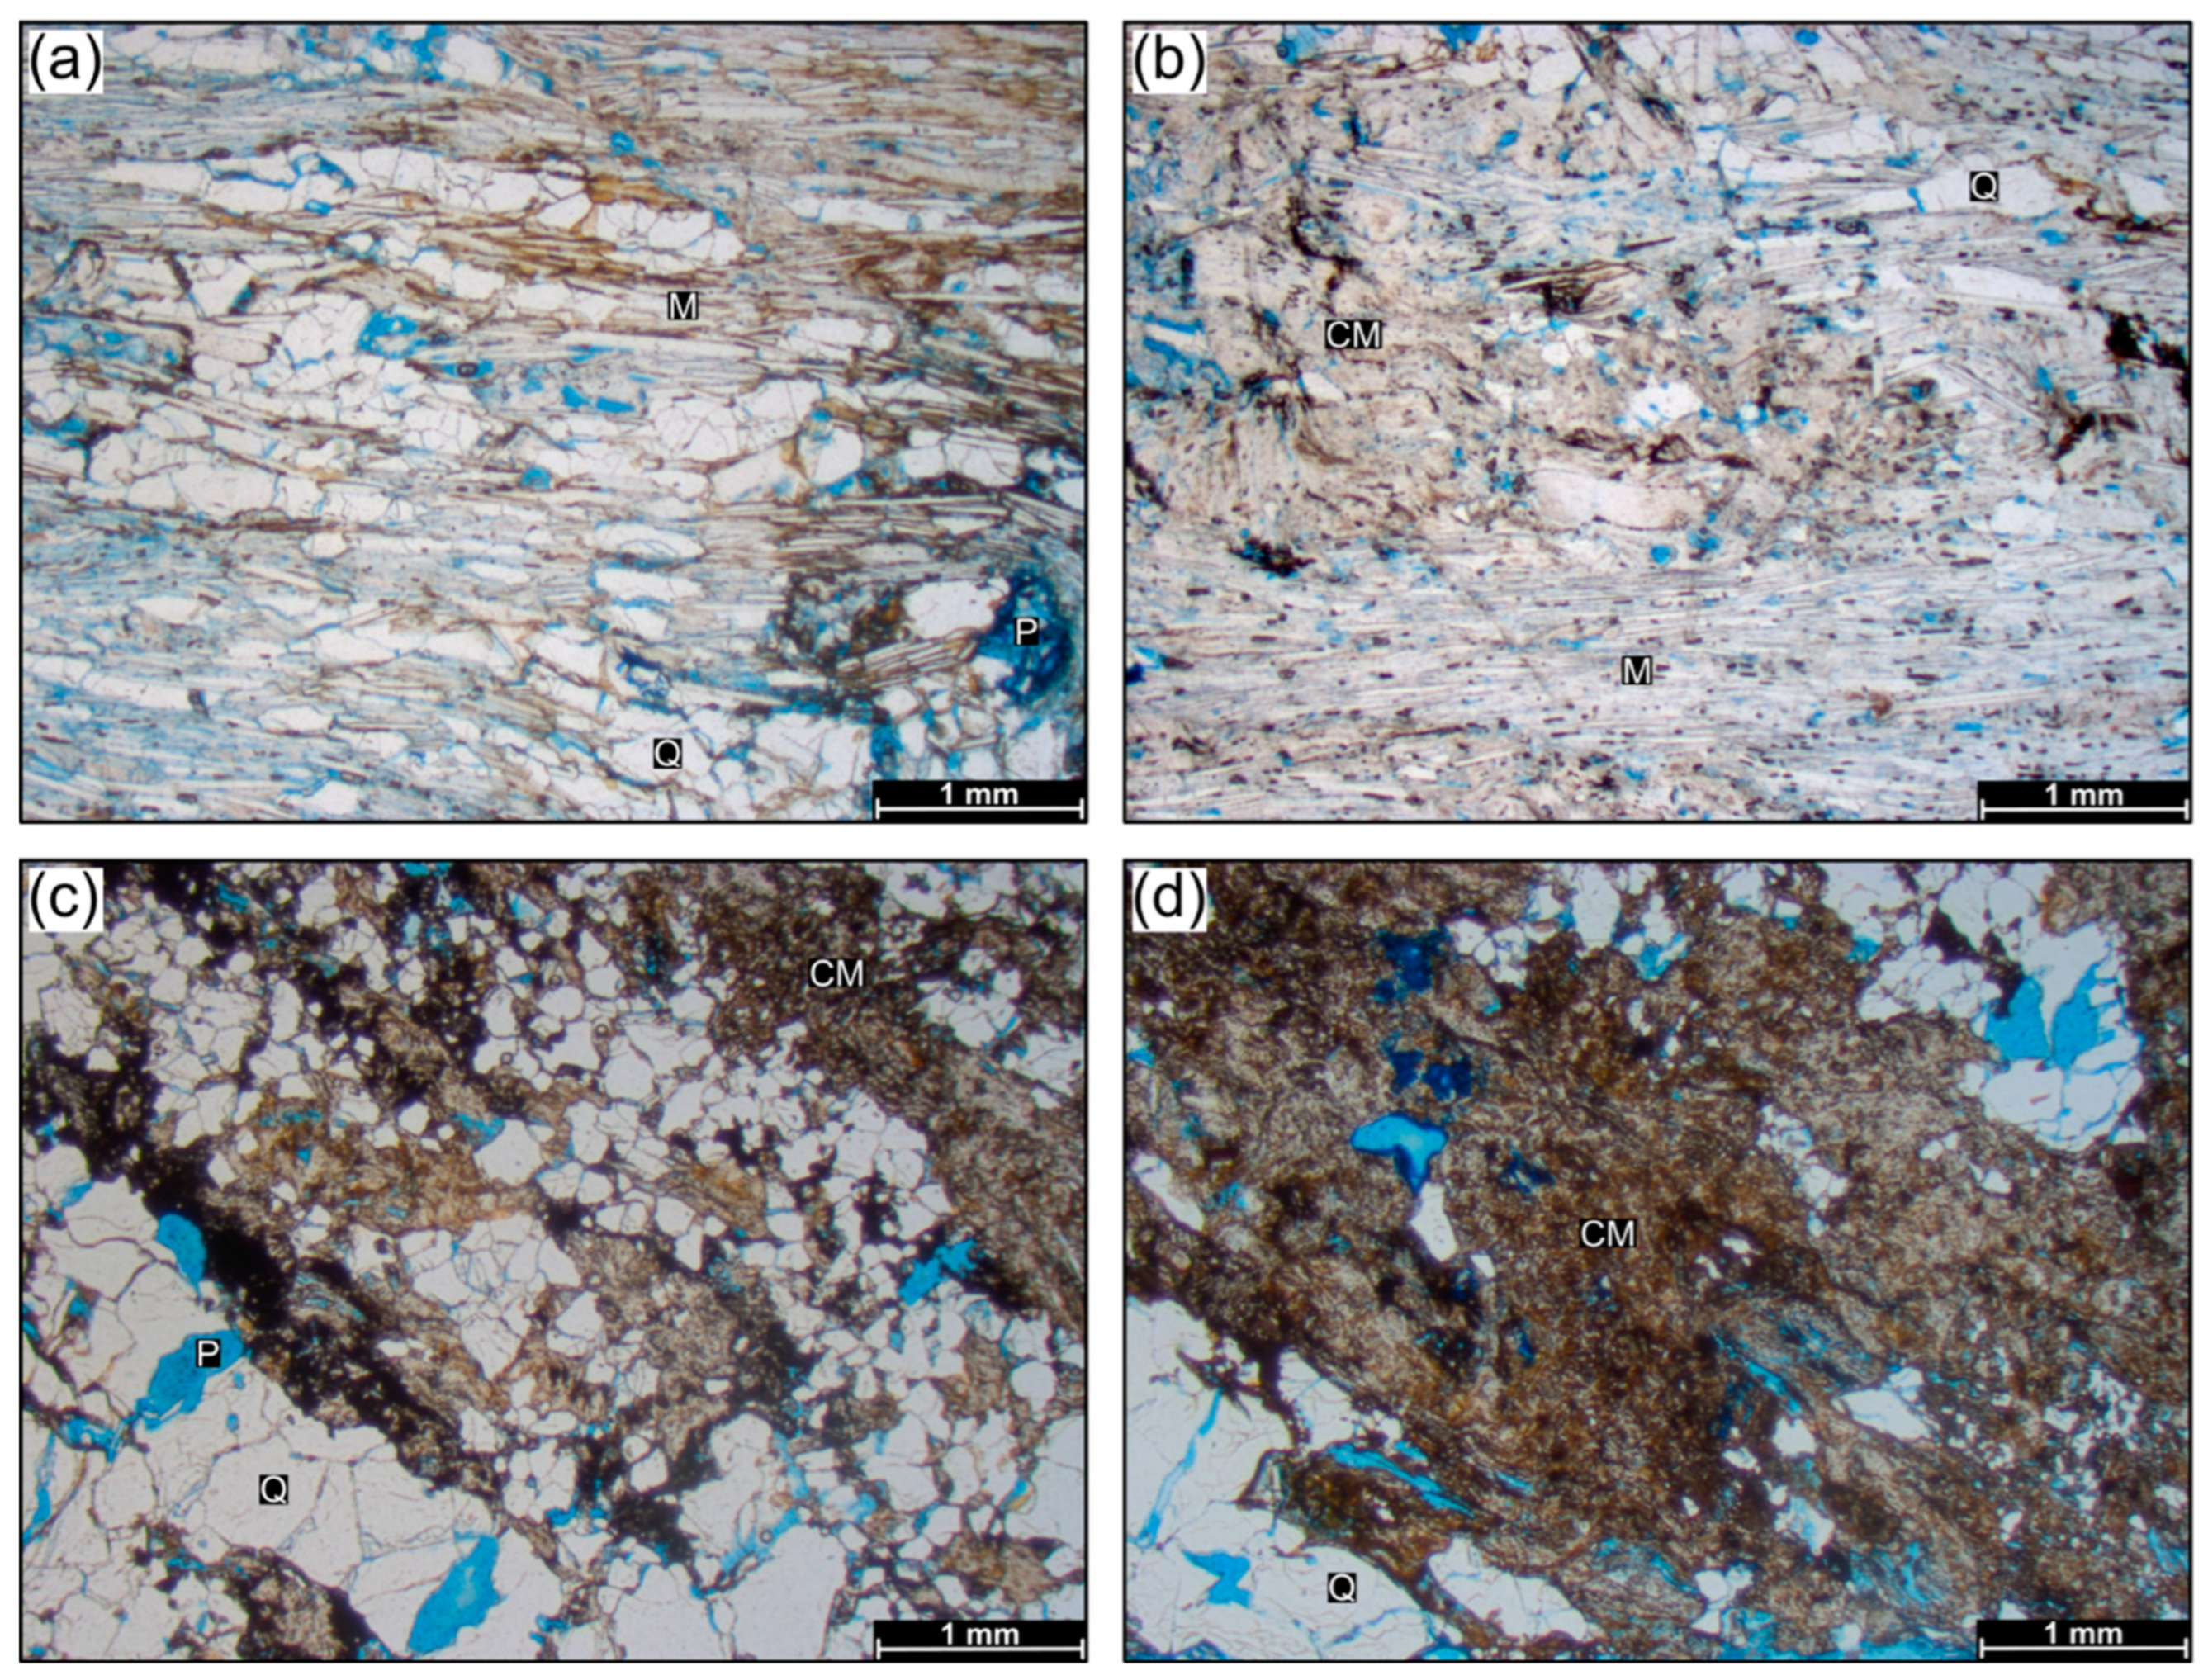
The AR1 and AR2 samples display similar overall micro-textural characteristics but different mineral compositions. Both samples are composed of alternated layers of quartz and clay minerals (Figure 9). The areal distribution of this peculiar mineral association defines a schistosity at the scale of the entire thin section, which suggests a metamorphic origin of the analyzed samples. The AR2 sample displays metamorphic layers of quartz with a crystal size of <1 mm and an extensive occurrence of muscovite mica with characteristic needle–platy shape crystals (Figure 10a,b). Quartz crystals are characterized by 120° boundaries, which are typically documented in the case of dynamically recrystallized metamorphic rocks. Dark brown clay minerals only occur locally in between muscovite layers but are restricted to isolated areas. Iron oxides sparsely occur in tiny patches within muscovite-rich layers. Conversely, AR1 is dominantly composed of quartz, with a crystal size of up to 1–2 mm with more than half of the thin section area occupied by dark brown clay minerals with traces of iron oxides–hydroxides (Figure 10c,d). The overall porosity of both samples is high, and it is mainly of secondary origin, related to the brittle reactivation of crystal boundaries.

4.3. Mineralogical–Chemical Determination

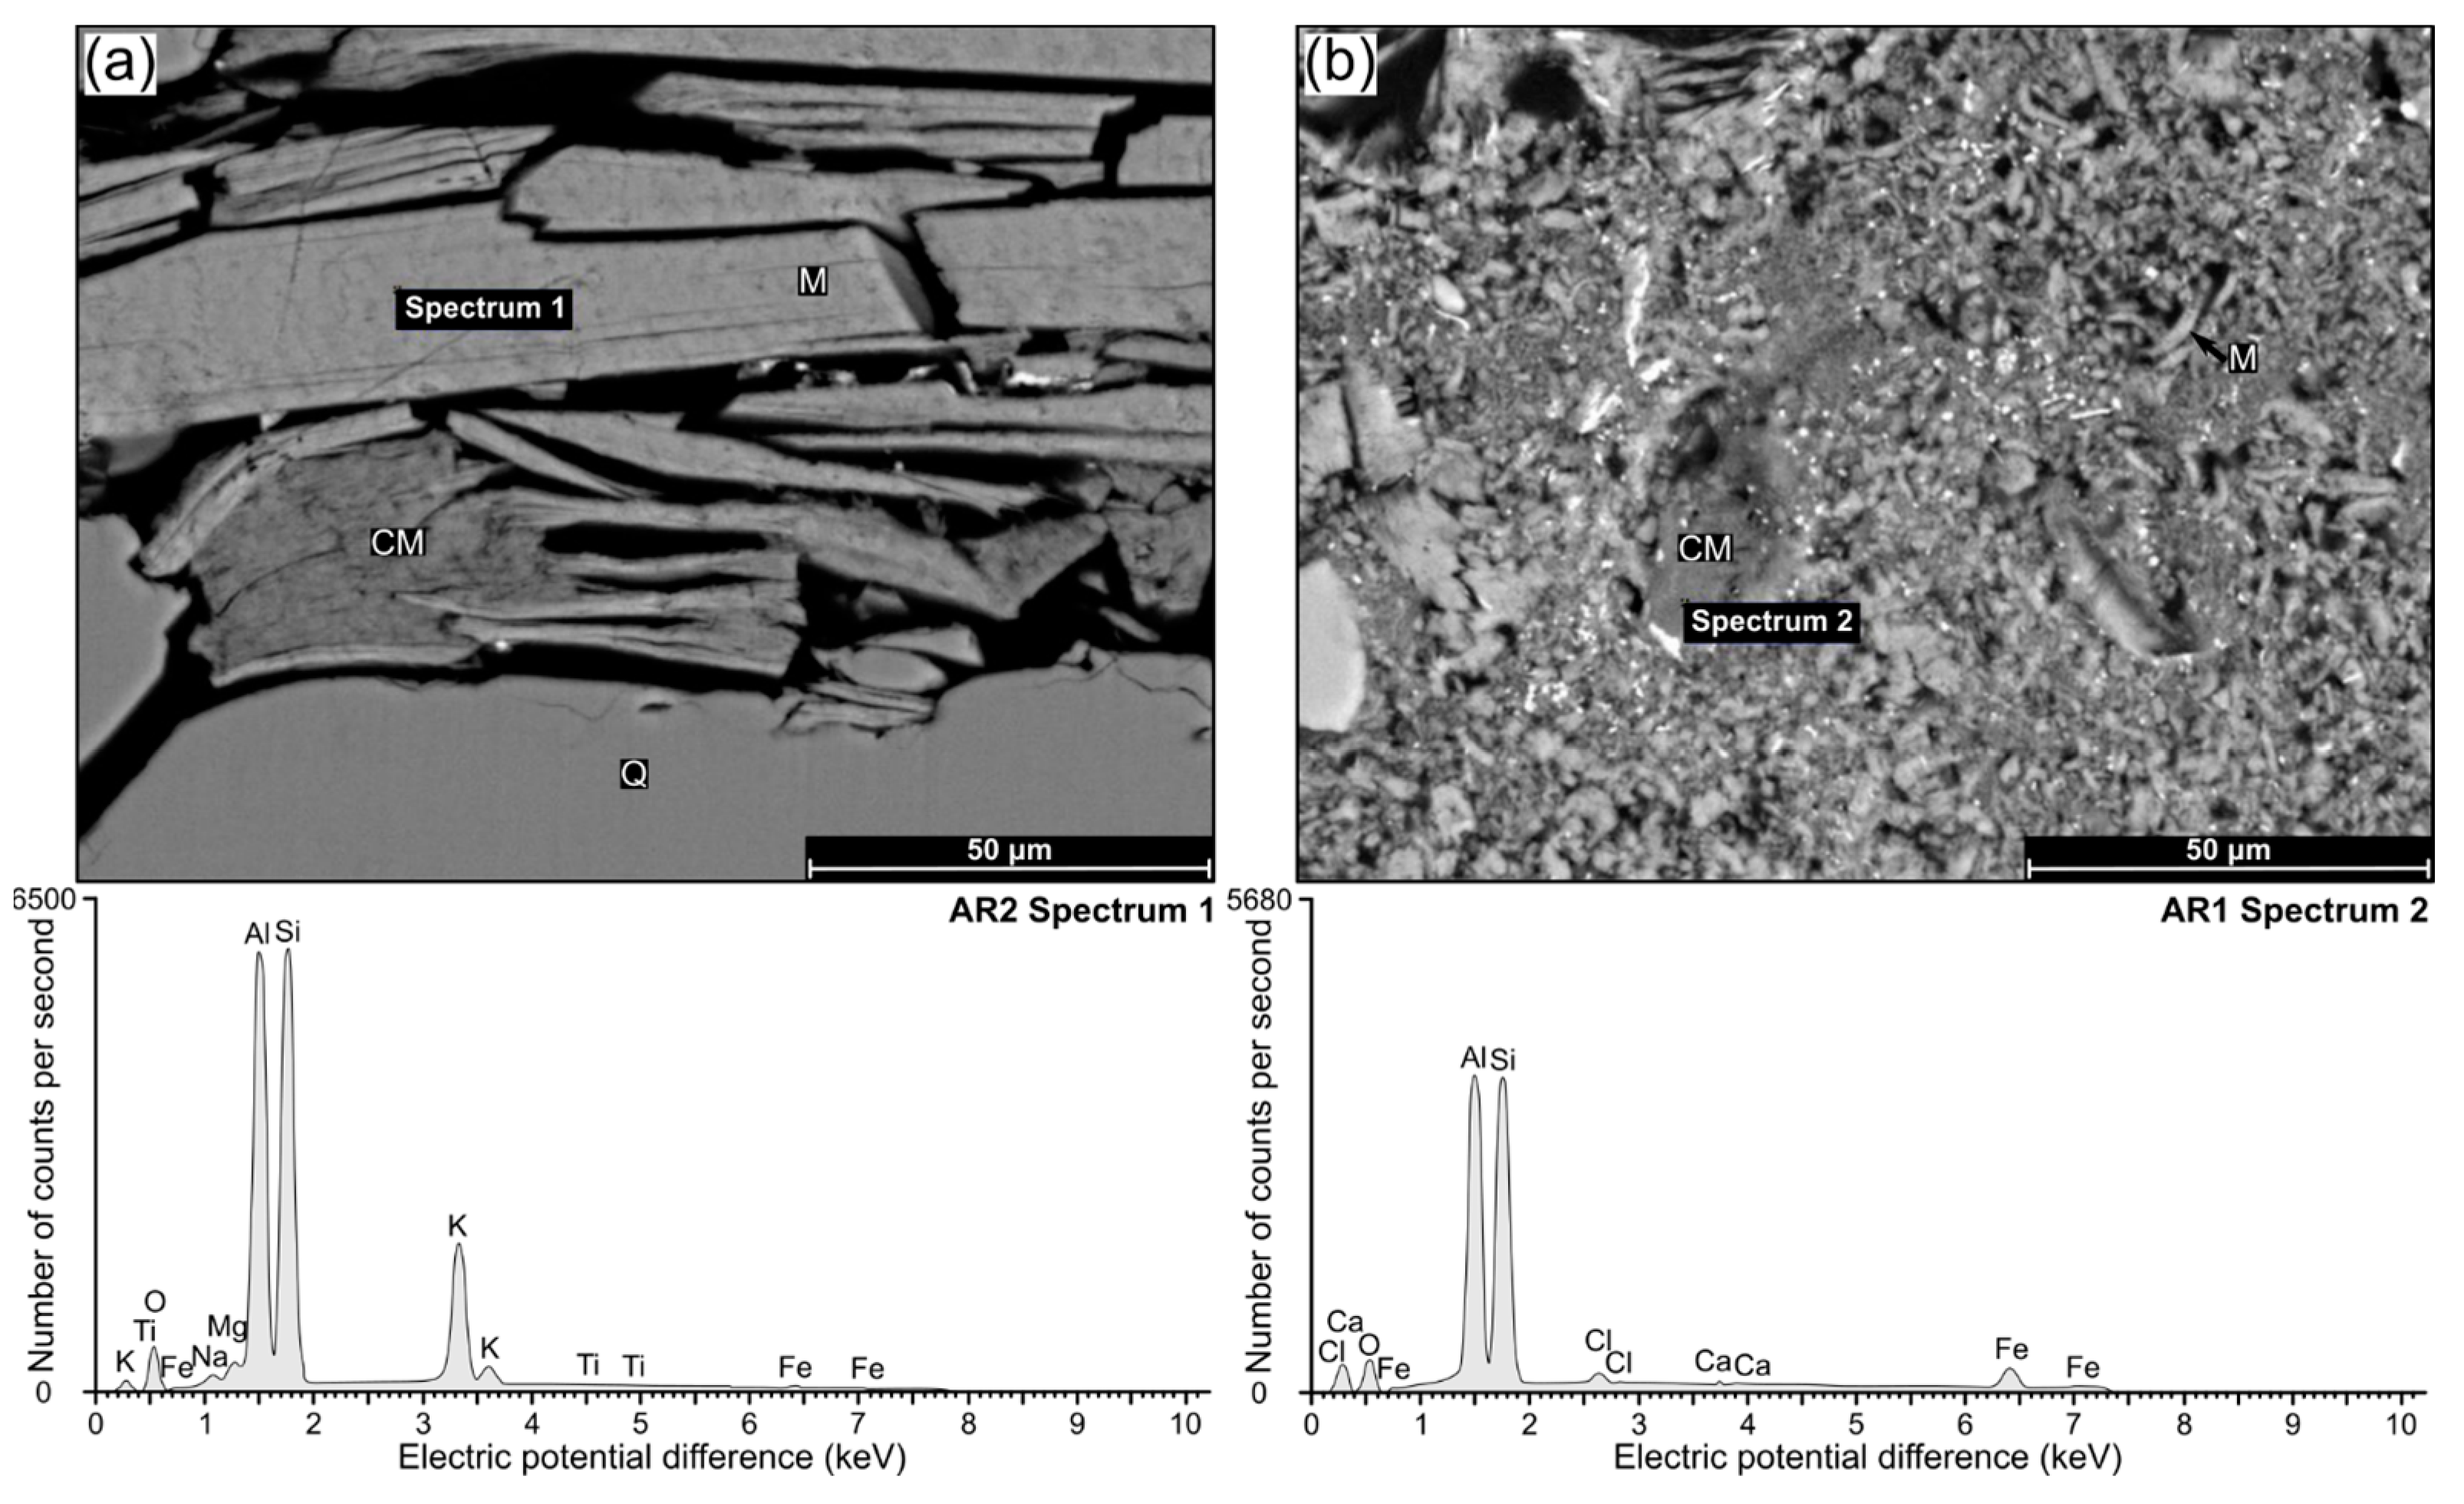
EDS punctual X-ray analyses confirmed the presence of extensive layers of muscovite mica (KAl2(AlSi3O10)(OH)2) in between quartz schistosity in the AR2 sample (Figure 11a). Conversely, in AR1, only small remaining fragments of muscovite crystals were found, and most of the clay minerals surrounding the quartz are composed of kaolinite, as confirmed by the emission spectrum (Al2(Si2O5)(OH)4) (Figure 11b). From the SEM observation in the AR1 and AR2 samples, it seems that kaolinite formed as the product of alteration of primary muscovite mica. This is also confirmed by the partial substitution of kaolinite at the expense of muscovite observed in discontinuous patches in the AR2 sample (Figure 11a).

4.4. Two-Dimensional Porosity

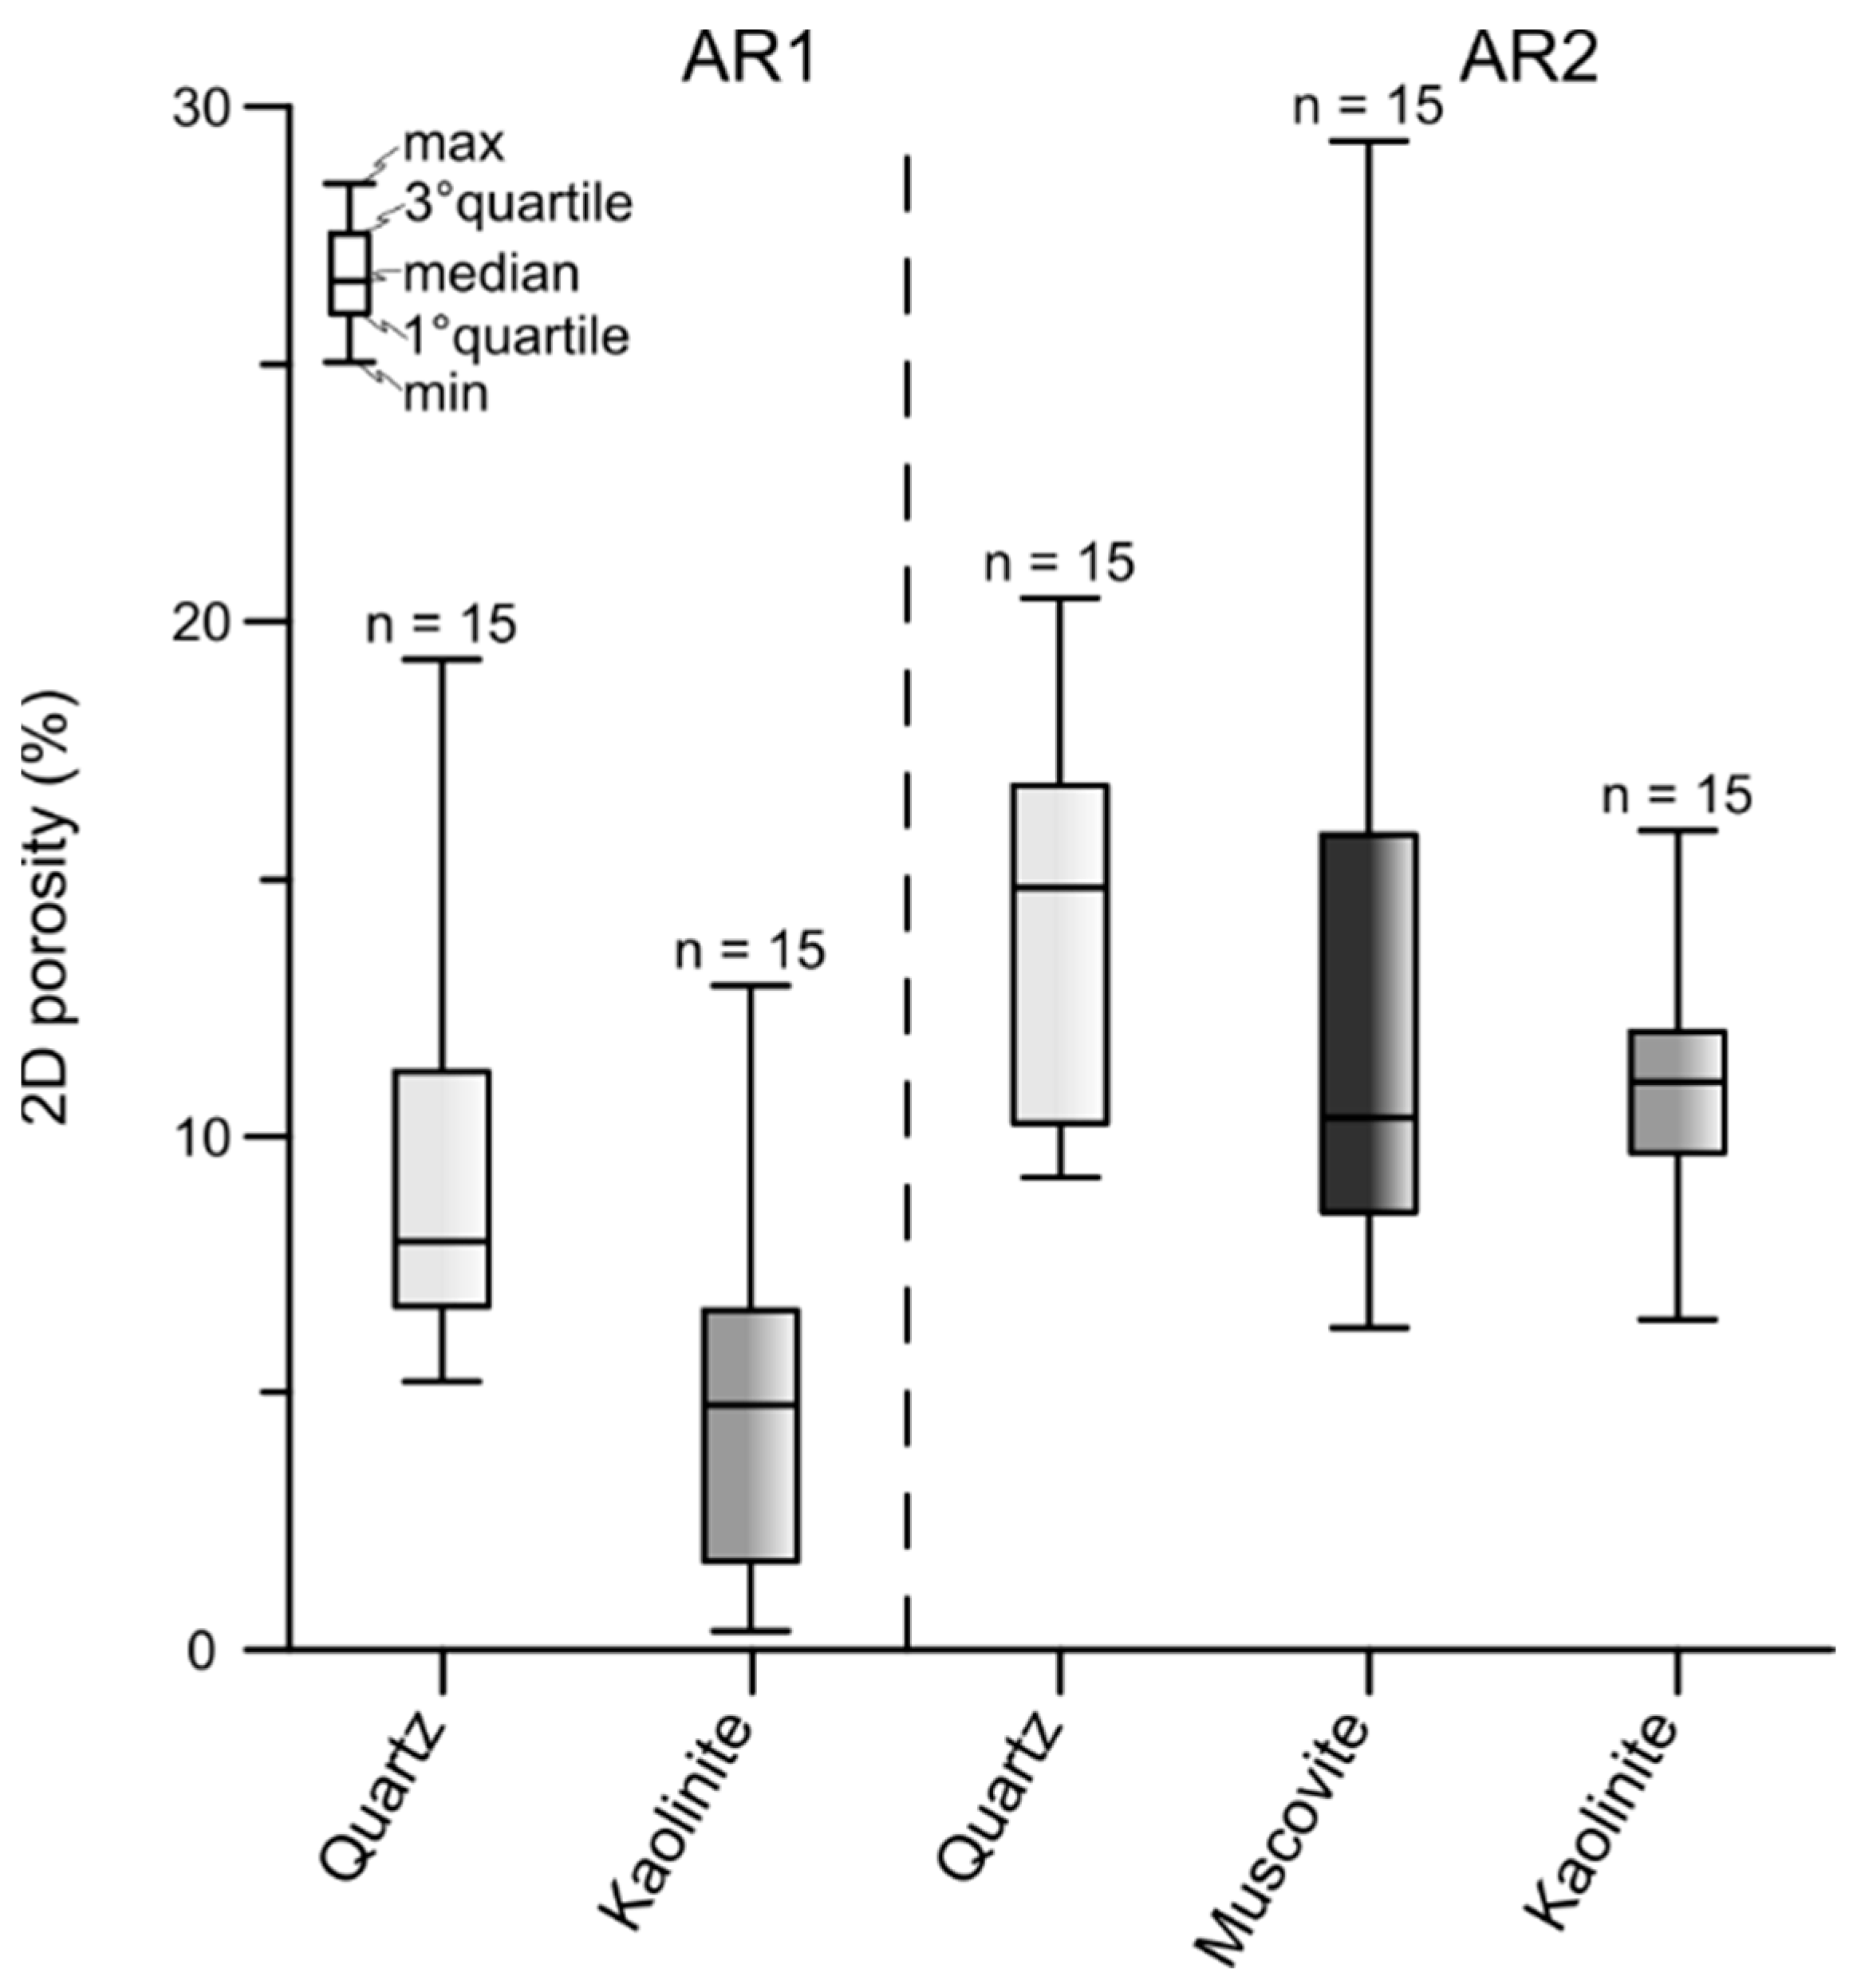
The AR1 sample, collected from the reddish deep layer, is characterized by a mean 2D porosity of quartz layers equal to 9.29%, while kaolinite composing most of the thin section area has a mean porosity of 5.01% (Figure 12). While porosity characterizing quartz is exclusively related to micro-fracturing along crystal boundaries, kaolinite displays both inter- and intra-crystalline micro-pores (Figure 12). The AR2 sample is characterized by a mean quartz porosity of 14.01%, while muscovite-dominated layers have an average porosity of 12.72%. Where present as isolated patches, kaolinite substituting muscovite shows a 2D porosity of 10.91% (Figure 12). Also, in this sample, quartz and muscovite porosity are related to the brittle reactivation of crystal boundaries, while kaolinite displays both inter- and intra-crystalline porosity. These findings on 2D porosity determined at a microscopic scale could be directly correlated to the values of the hydraulic permeability assessed by Equation (1) since the higher porosity of the whitish soil (AR2) corresponds to a higher value of hydraulic permeability.

4.5. Mechanical Properties

4.5.1. Swelling Tests

The AR1 and AR2 samples have been subjected to oedometer tests to determine the swelling pressure. Table 2 reports the characteristics of the soil samples, including the values of gravimetric water content and saturation degree before and after the swelling test.
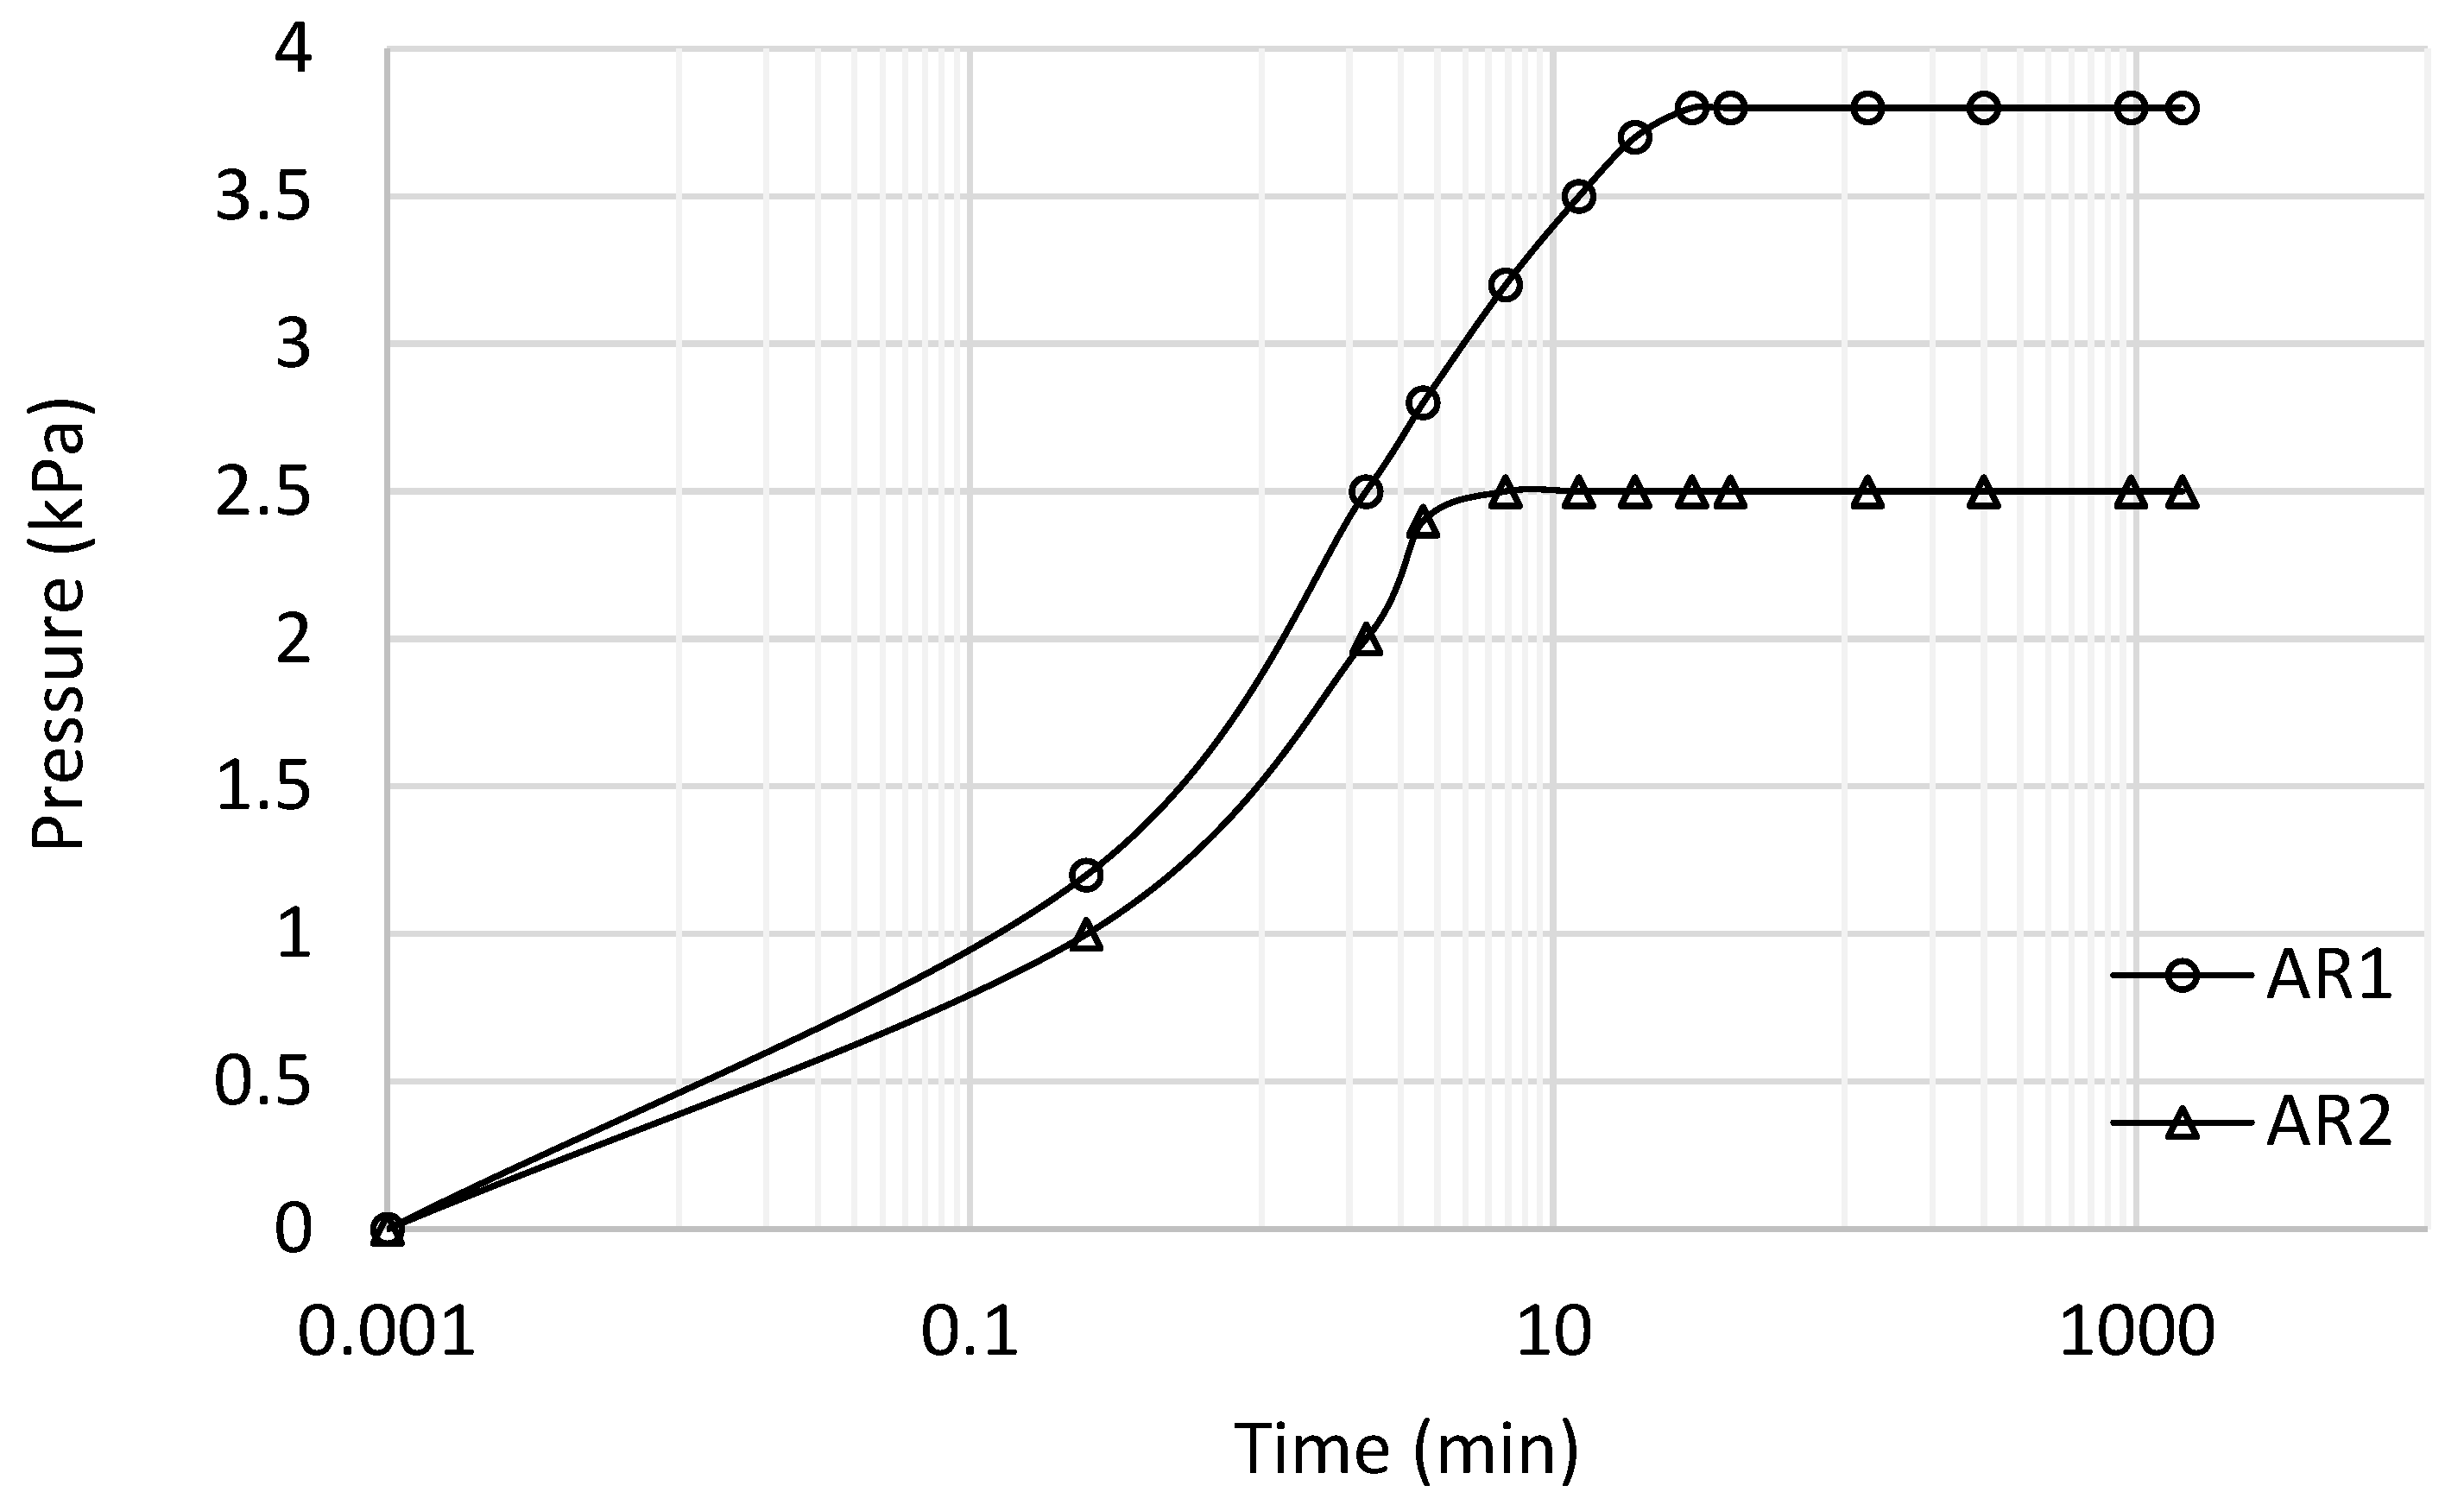
Figure 13 reports the experimental results of the swelling test. It is possible to notice how the maximum swelling pressure for the AR1 sample is 3.8 kPa and 2.5 kPa for the AR2 sample. Since the values of the swelling pressures are very low, it could be stated that both soil samples have very little swelling behavior, and this is due to the relatively low percentage of clay.

4.5.2. Direct Shear Tests

The mechanical characterization of soils involved in the landslide has been obtained by performing direct shear tests on two representative undisturbed samples, namely AR1 and AR2. The aim was to determine the Mohr–Coulomb shear strength parameters in both peak and residual conditions. Although the soil at the studied depths is mostly in unsaturated conditions, the partial saturation and the effect of suction have been neglected in this study, assuming that failure occurred when the soil was fully saturated due to rainfall infiltration, as will be shown in Section 4.5.3. Moreover, testing the saturated soil corresponded to the worst condition, and shear strength parameters could be interpreted in terms of effective stresses (drained conditions).
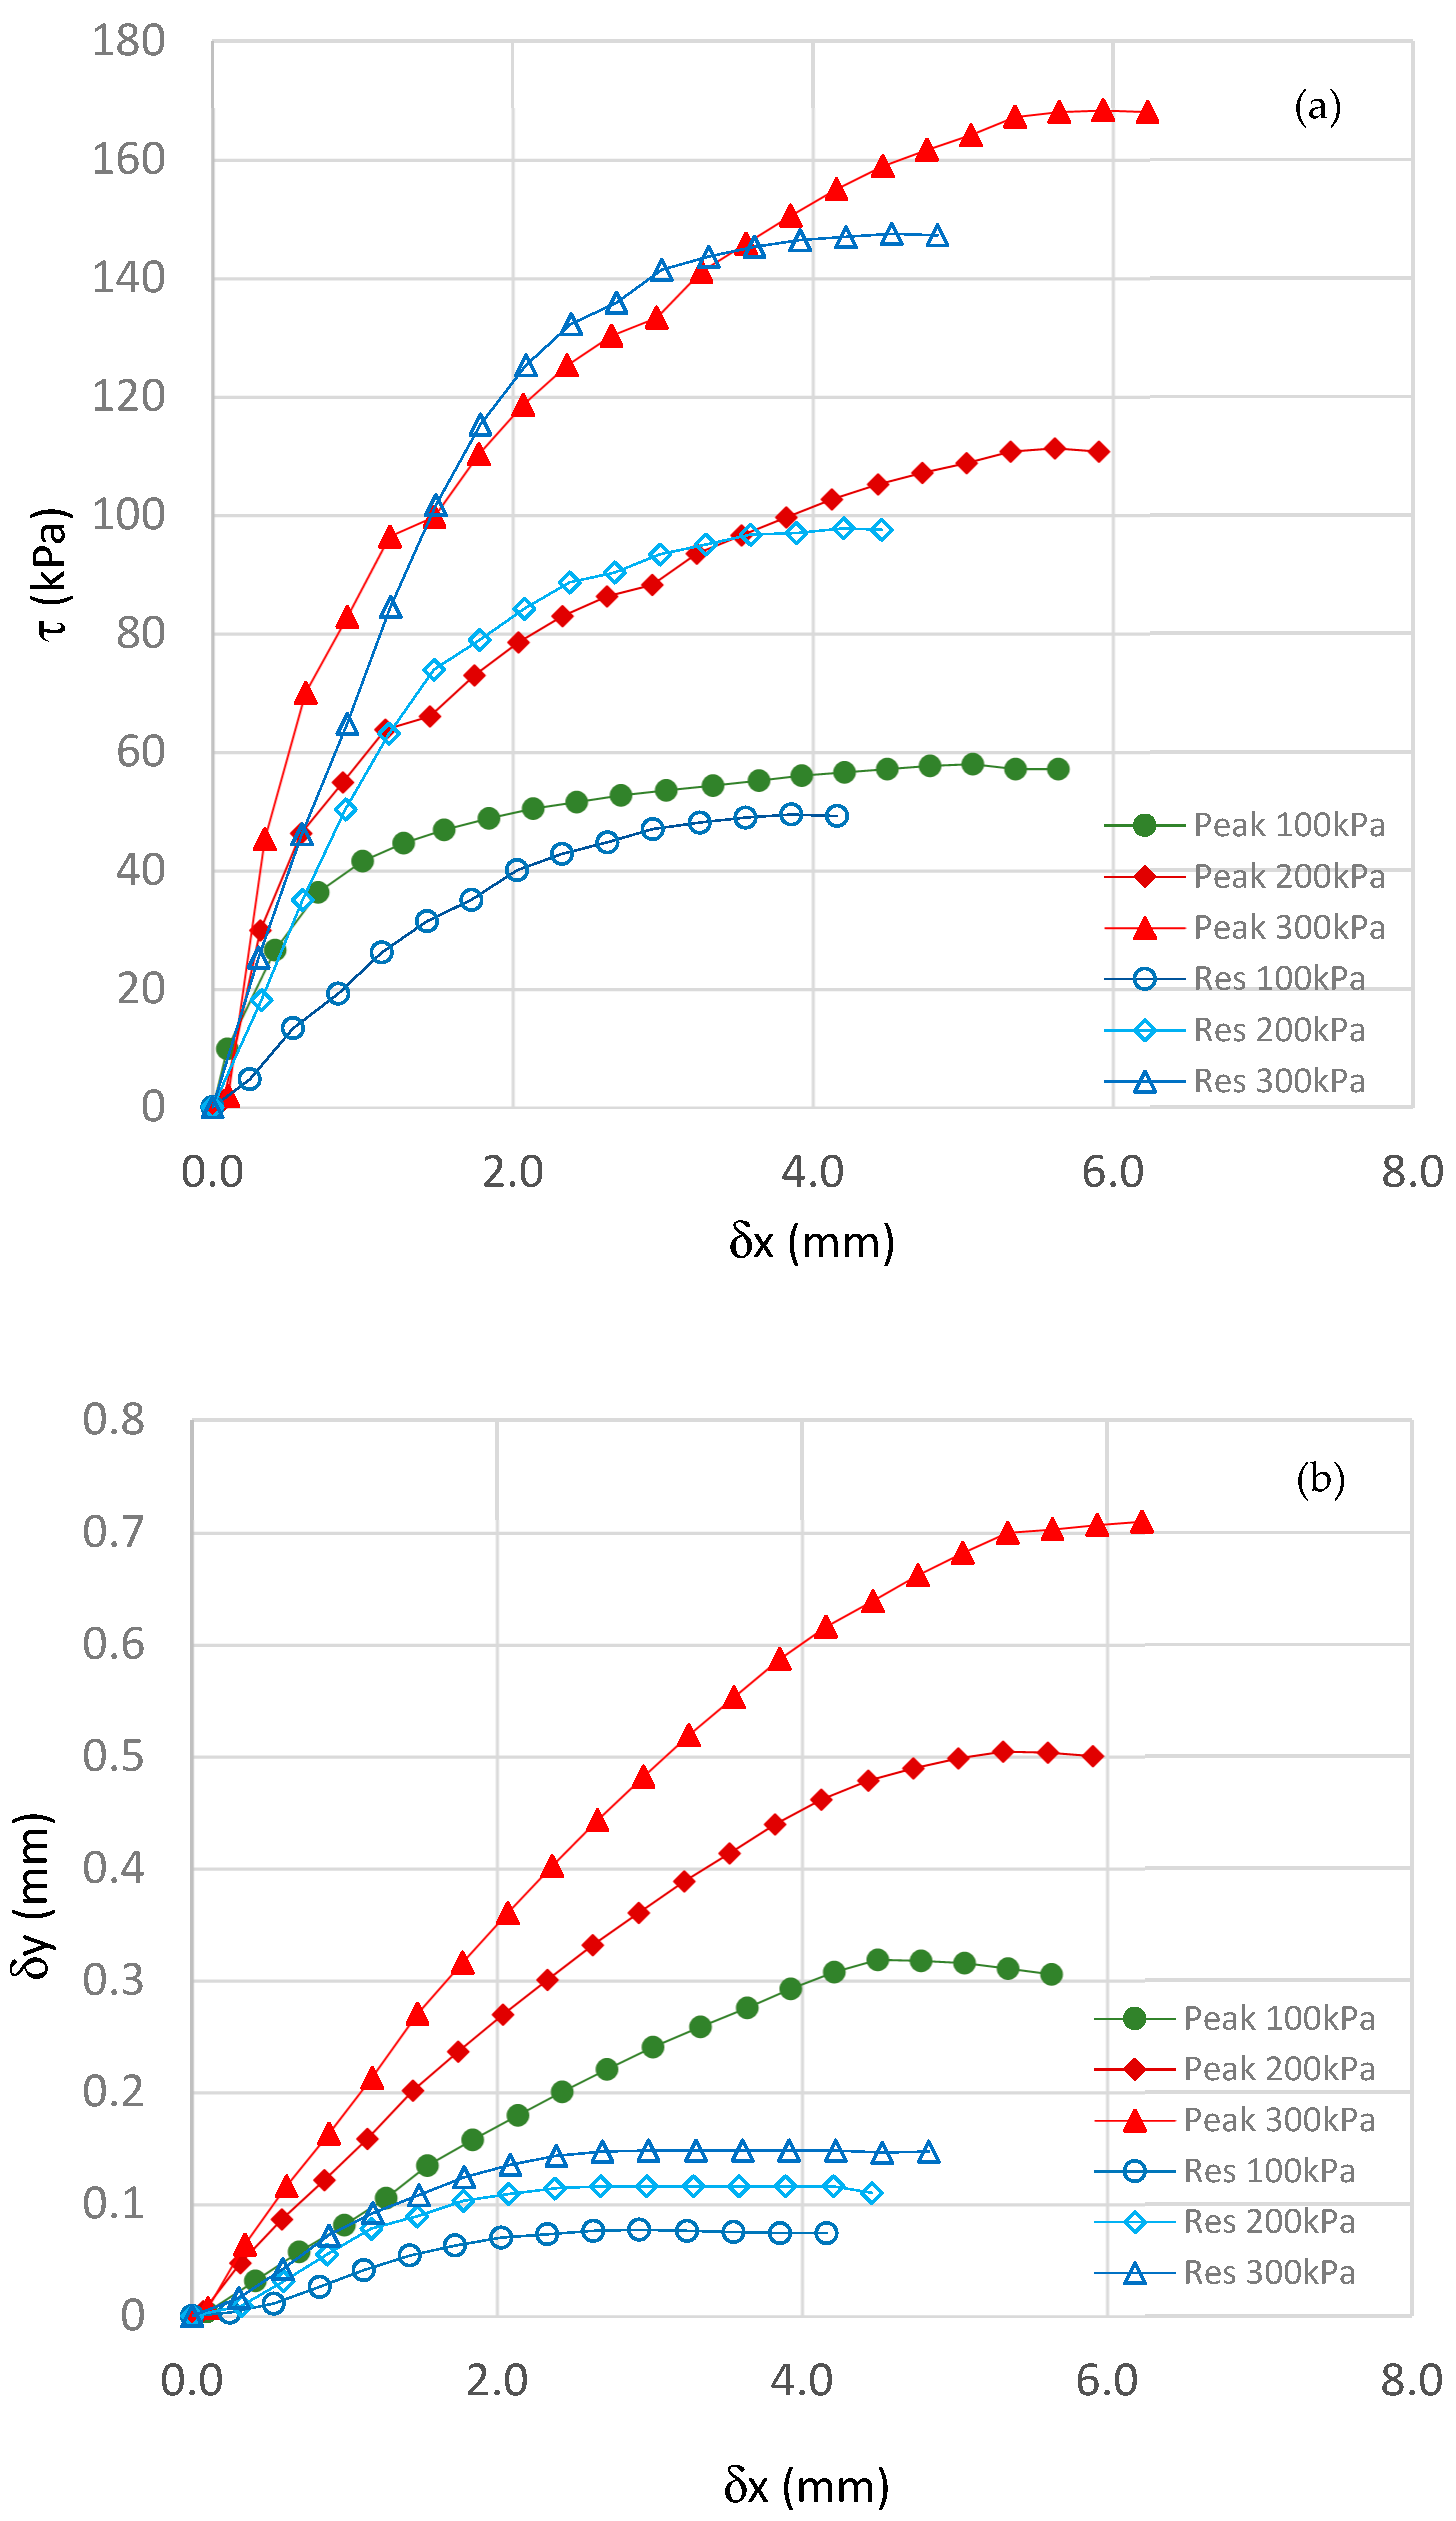
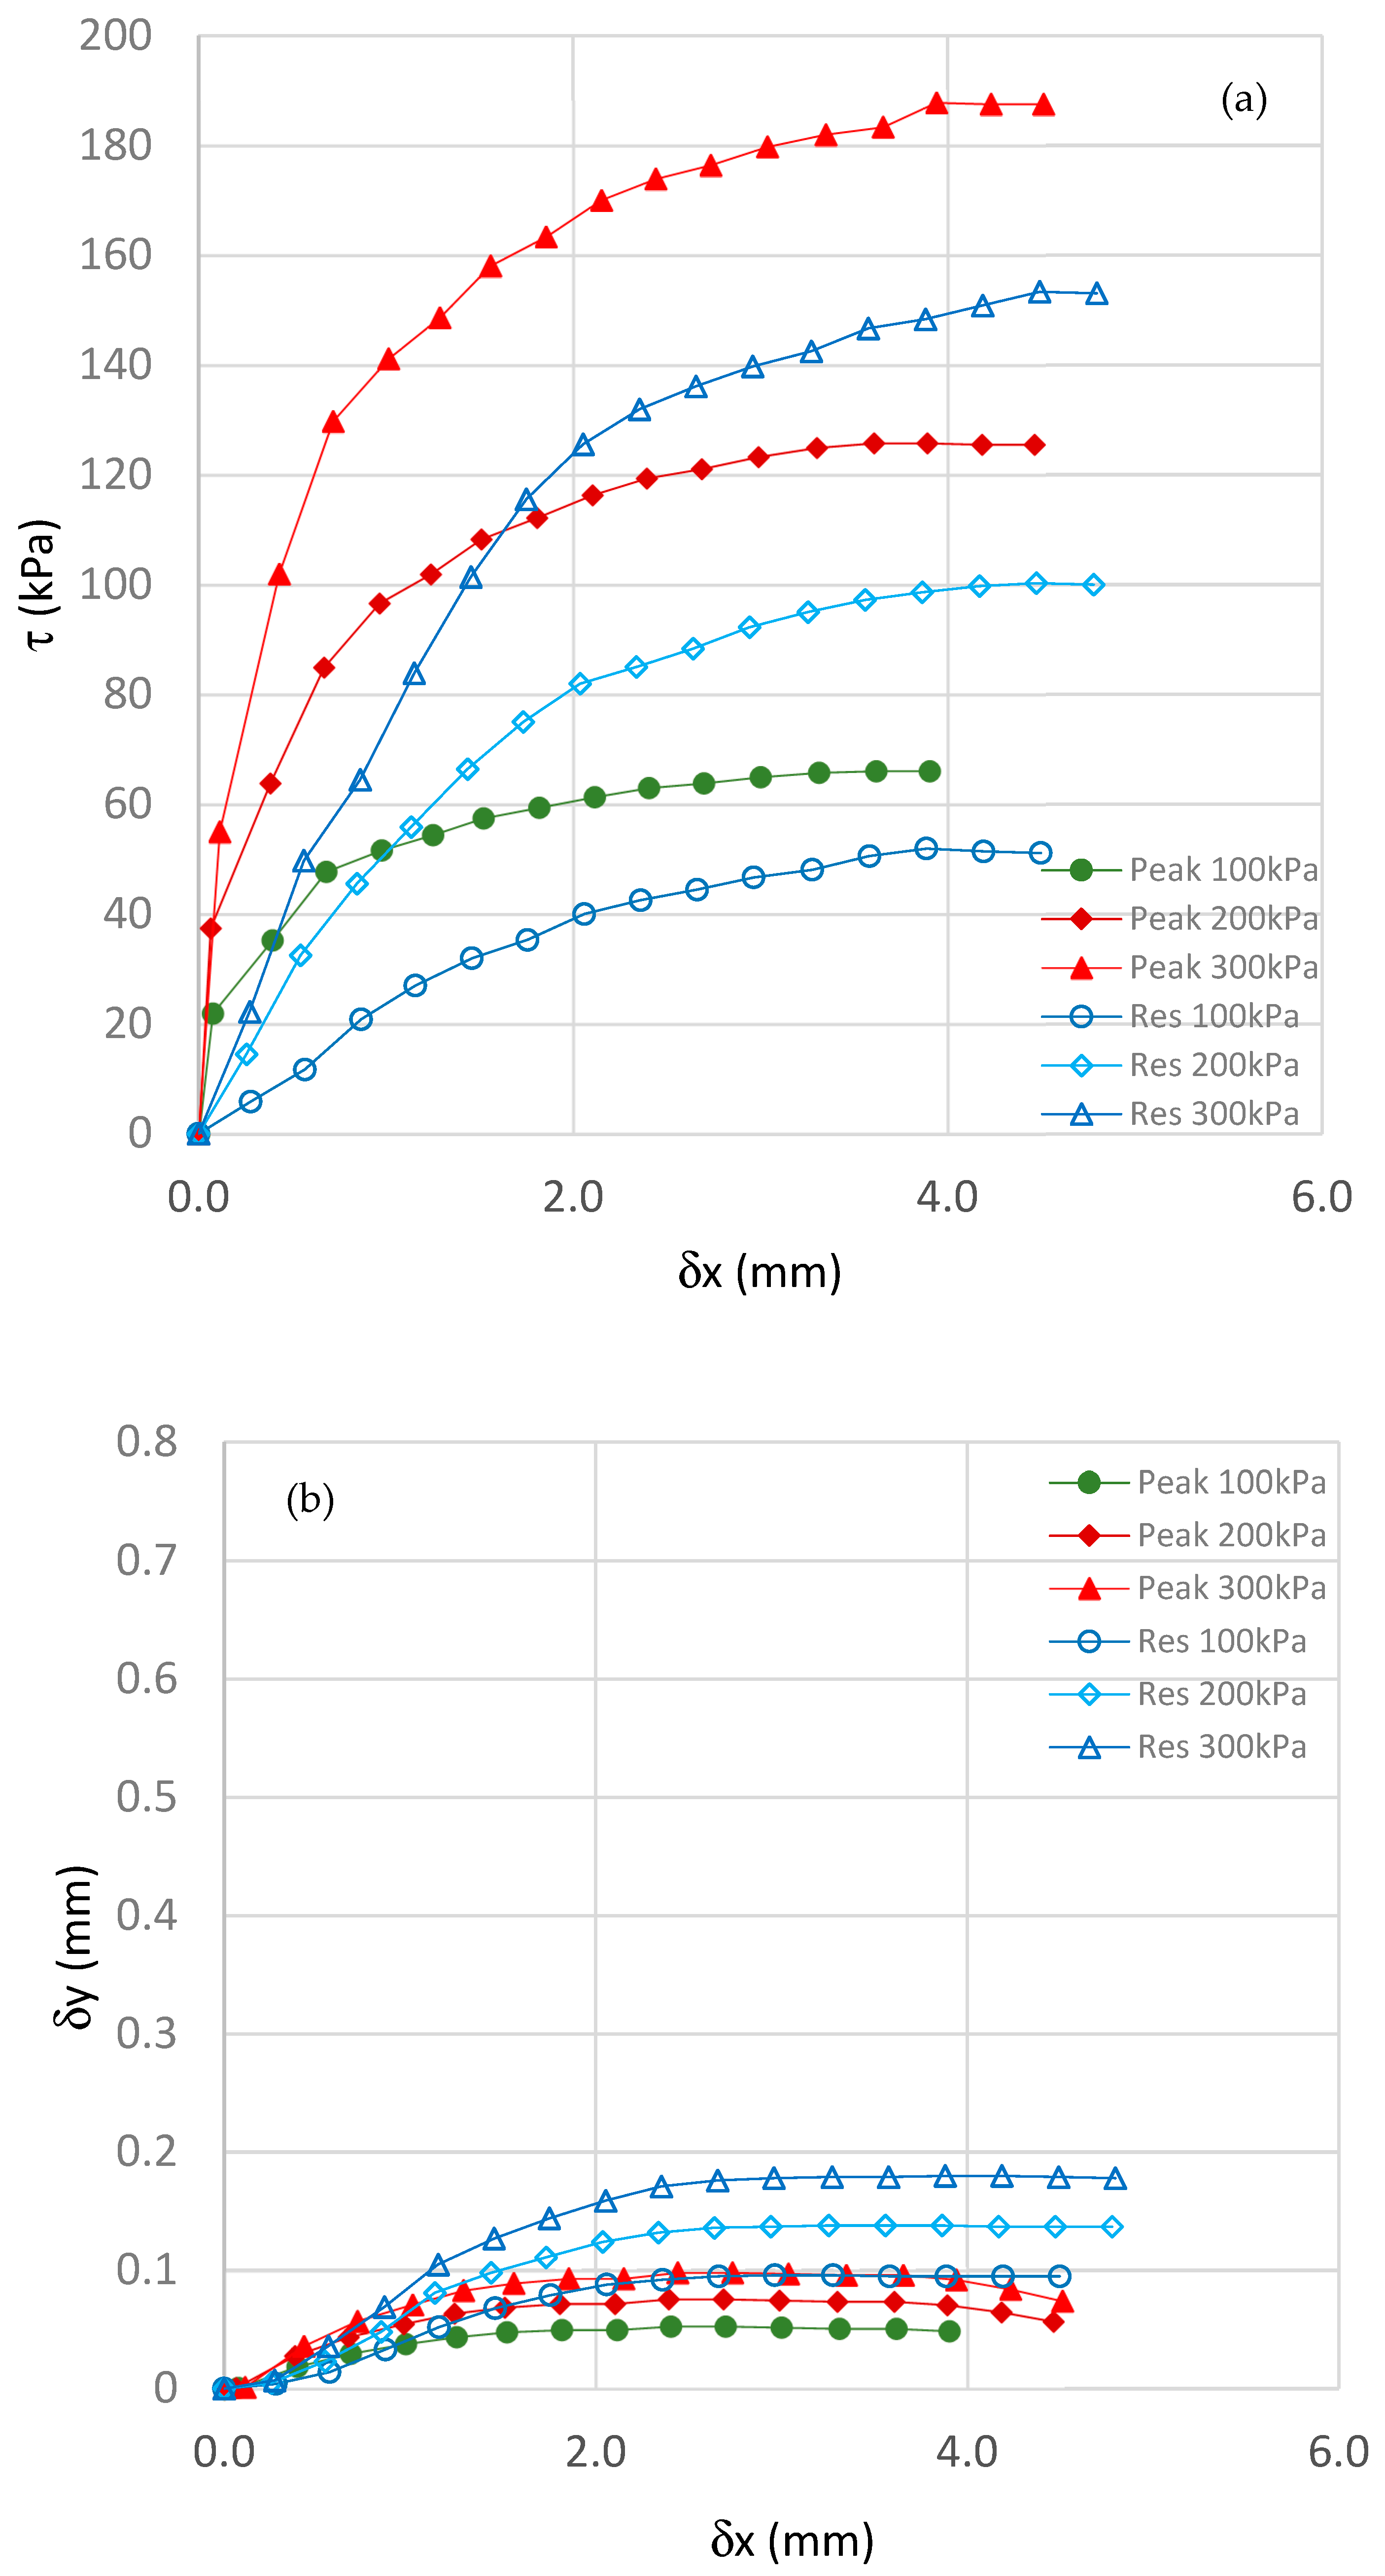
Figure 14 and Figure 15 show the experimental results at both peak and residual stress states for the AR1 and AR2 samples, respectively. The corresponding values of failure shear stress were plotted on the Mohr plane (Figure 16), and the final shear strength parameters are reported in Table 3. It can be observed that, due to their type and the relatively low percentage of clay, soils are characterized by a low effective cohesion at peak conditions, i.e., 4.7 kPa and 2.3 kPa for AR2 and AR1, respectively. Moreover, at the peak stress state, AR2 (whitish) is characterized by a shear strength angle of 31°, which is higher than 29°, i.e., the value that has been obtained for AR1 (reddish). Instead, at residual conditions, both samples are characterized by nil effective cohesion, and the residual shear strength angle is equal to 28° for both soils (Figure 16). The results appear consistent with those obtained by other authors on similar materials [42,43,44].

4.5.3. Slope Stability Analysis

A simplified slope stability analysis has been performed by the Morgenstern–Price limit equilibrium method using the code SLIDE-2 (Roscscience®, Toronto, ON, Canada). The shear strength input parameters are those corresponding to the peak conditions (cp′ and ϕp′). No water table has been assumed, as in the real situation, it is below the road level at a depth rather far from the failure mechanism. Figure 17 shows the results of the stability analysis. In particular, Figure 17 shows the failure surface with the minimum safety factor (0.8) and all the potential failure surfaces with a safety factor of less than one, i.e., the unstable condition. Although this is an oversimplified stability analysis, not least because it neglects the rain infiltration process, this result allows the following aspects to be highlighted:
  • Before failure, the slope was stable for a long time thanks to the partially saturated conditions, which guaranteed an additional shear strength contribution beyond the peak effective shear strength condition;
  • The slope became unstable when the soil became saturated due to rainfall, and the peak effective shear strength was attained;
  • It is very likely that the first part of the slope to experience instability was the slope toe, consisting of reddish soil, which shows the lowest safety factor, and the whitish soil followed;
  • The failure surfaces involving the top of the slope and the whitish soil are very similar to the field-observed situation (Figure 5).

5. Discussion

The main objective of this research was to investigate the combined effects of microstructural features, mineral composition, and macroscopic mechanical behavior on the failure conditions of lateritic soil subjected to slope instability in the study site of Kabaya (Rwanda). Similar approaches of combining micro- and macro-tests on rocks involved in landslides have been recently used in other contexts to better understand the triggering conditions of some landslides [47,48,49,50,51]. The methodology used in this case study highlighted several aspects that can be considered useful in dealing with similar cases. They can be summarized as follows:
  • The grain size distribution curves obtained using both traditional methods (i.e., sieving and sedimentation) and innovative methods (laser diffraction granulometry) are different, depending on the method used. In fact, curves obtained using laser diffraction granulometry represent a lower and upper limit compared to all other curves obtained using traditional methods (Figure 8). This shows a higher degree of detail in the laser diffraction analysis, which could not have been achieved by traditional techniques, as already observed by [52].
  • The microstructural observations of two different samples (AR1 and AR2) helped to reconstruct the geological history of the slope and to shed light on the predisposing causes of the failure. In particular, the analyses at the thin section scale suggest a metamorphic origin of the two lateritic soils (reddish soil and whitish soil, respectively), which can also be classified as soft rocks. In particular, both samples can be described as medium-grade metamorphic schists, with original paragenesis mainly composed of quartz and muscovite mica organized in sub-parallel compositional layers (Figure 9). Kaolinite developed as an alteration product at the expense of muscovite mica, and it is patchily distributed in the whitish soil and is pervasive in the reddish soil, almost entirely substituting the muscovite layers. The two-dimensional porosity of both soft rocks is high, and it is mainly related to the brittle reactivation of crystal boundaries and mineral substitution (Figure 12). It is likely that the original porosity of the unaltered pristine metamorphic rocks was rather low, as they form and deform at considerable depth and temperature conditions. The current high porosity and micro-texture could be related to the following aspects: (1) unloading undergone by the rocks following their exhumation and (2) alteration operated by the weathering processes. This is confirmed by the secondary porosity, which appears to be dominated by micro-fractures reactivating and exploiting original rock weaknesses, such as crystal boundaries (Figure 10a,c). The alteration by weathering was also responsible for the mineralogical change and substitution of muscovite to kaolinite (Figure 10a,b). This was facilitated by the lower stability of muscovite with respect to kaolinite under surficial temperature-pressure conditions. The alteration was likely eased by tropical temperatures and rainfall conditions experienced by the metamorphic rocks in the study site of Kabaya. Weathering processes were able to efficiently alter the pristine rocks due to the documented high porosity, facilitating the percolation of water from above. Quartz was not affected by chemical processes as it is more stable than phyllosilicates under surficial conditions. The chemical alteration was responsible also for physical changes in metamorphic rocks, with a significant shift in grain size and grain size distribution. Weathering produced a significant fining of grain size from 224 to 53.4 µm, with the sand-dominated initial sample becoming a silt-dominated one. It is possible to infer that the different degrees of alteration documented in the AR1 (reddish soil) and AR2 (whitish soil) samples are related to the different depths and positions with respect to the ground level in the original condition before the cut slope excavation. In particular, the whitish soil, which was positioned closer to the ground level, shows the most preserved mineralogical assemblage, while the reddish soil, which was the deeper layer before the construction of the cut slope, is the most altered. The difference in depth of the two soils, in the original condition before the cut slope excavation, could have played a significant role in driving the alteration, possibly due to the oscillation of a perched water table during wet and dry periods. In particular, the deeper reddish layer had experienced enduring water saturation conditions following heavy rainfall, while the whitish layer, closer to ground level, may have undergone unsaturated conditions for a longer period, with a consequent weaker alteration potential. This original situation was modified during the road cut slope excavation and weathering that affected the two layers in a different way, especially considering the exposure of the reddish soil at the slope toe after excavation. Although the geological history is rather far to be described in detail, it is clear that the combination of physical and chemical changes operated via weathering processes influenced the hydraulic and mechanical properties of the two soft rocks involved in the Kabaya landslide.
  • From a mechanical point of view, the reddish soil (AR1) shows a relatively higher swelling potential with respect to the whitish soil (AR2) (Figure 13) due to the relatively higher percentage of clay minerals. However, the swelling potential of both samples appears rather limited, and for this reason, it is unlikely that the slope failure mechanism was caused by the swelling behavior of the involved materials. With regard to the shearing behavior, it is worth considering that investigations by many authors in the past were focused on the effect of different water contents on the failure conditions of soft rocks involved in landslides (Fu et al., 2022 [50]; Falcão et al., 2023 [43]). In this research, only the worst condition, corresponding to the saturated material, has been considered. Moreover, only the saturated condition allowed us to interpret the shear strength parameters in terms of effective stresses. The obtained results show that the difference between peak and residual conditions for the reddish soil (AR1) is less pronounced than that observed for the whitish soil (AR2). As a consequence, the shear strength parameters of the reddish soil are weaker than those of the whitish soil for peak conditions; instead, shear strength parameters corresponding to residual conditions are the same for the two samples. It could be affirmed that the weaker failure conditions of the reddish soil could be correlated to the higher level of weathering and degradation with respect to the whitish soil, as observed at the microstructural scale. This is consistent with the slope stability analysis. In fact, the simplified slope stability analysis (Section 4.5.3) showed that the failure surface with the lowest safety factor develops in the reddish layer at the slope toe, whose failure condition is represented by the weakest AR1 sample.
  • With regard to the triggering mechanism of the landslide that occurred on 2 May 2018, it can be assumed that the rainfall infiltrated through both the whitish and the reddish layers, which were already wet due to the antecedent rainfalls. Although the slope was characterized by a relatively high steepness, it was stable during dry periods thanks to the shear strength contribution given by the matric suction connected to the partial saturation condition. This contribution was completely lost after rainfall infiltration. Due to the different hydraulic conductivity of the whitish and reddish soils, the water infiltrated relatively easily through the whitish layer down to the reddish layer at the top of the slope and rather slowly in the reddish layer at the slope toe. As observed in similar phenomena, although in different geological contexts [53], the infiltrated rainfall created saturated zones, resulting in the loss of shear strength of the partially saturated soil until reaching the fully saturated condition, and the slope became unstable. As demonstrated by the simplified slope stability analysis (Section 4.5.3), the slope became unstable when the soil became saturated, and the peak effective shear strength was attained. The slope toe, made of reddish soil, was the first part of the slope to experience instability due to both higher steepness and lower peak shear strength with respect to the top part, and the whitish soil followed.

6. Conclusions

This paper intends to show the advantage of integrating routine geotechnical tests at a macroscopic scale with microstructural analyses in explaining the background and past causes of some failure phenomena, which could only be partially interpreted based on the shear strength parameters. In the presented case study, both whitish and reddish soil layers involved in the landslide are characterized by very similar shear strength parameters. In fact, the difference in peak shear strength angle is only 2° and the difference in peak effective cohesion is only 2.4 kPa, with the whitish soil stronger than the reddish one. Instead, the residual shear strength parameters are the same. Actually, microscopic analyses show many differences between the two materials. In particular, the difference in quartz crystal size is up to 2 mm, the difference in quartz porosity is 4.72% and the difference in kaolinite porosity is 7.71%. The whitish soil has a higher microstructural porosity than the whitish one. Correspondingly, the whitish soil is characterized by a hydraulic conductivity that is one order of magnitude higher than the reddish one. Therefore, it becomes easier to explain the predisposing causes and the triggering mechanism of the landslide, considering the weak characteristics of the reddish layer at the microscopic scale. Moreover, from the microstructural point of view, it was observed that kaolinite developed as an alteration product at the expense of muscovite mica, and it was observed patchily distributed in the whitish soil, while it was pervasive in the reddish soil. It should be considered that the whitish soil and the reddish soil were the shallow and the deep layers, respectively, of the slope in the original condition before the cut slope excavation. Therefore, the soil was more affected by weathering in depth than in the shallow part of the slope, in its original geometry. The higher degree of weakness of the deeper soil layer was only partially confirmed by the observed failure conditions through the direct shear tests. Moreover, although the maximum swelling pressure of the reddish soil was higher than the whitish one, with a difference of only 2.4 kPa, both soils showed very little swelling behavior.
The disadvantage of the combined approach is the need for different competencies and the use of microscopic techniques that cannot always be considered routine, given their level of sophistication. A further limit of this research is that all tests were performed without considering in detail the specific effect of water, except in the worst condition of full saturation. More in-depth comparative experiments to illustrate the specific role of water will be conducted in the future.
The following main outcomes, which are useful in practical applications in the considered context, can be drawn from this study:
  • The example given here demonstrates that the whitish soil (which was the shallowest layer in the original natural slope condition) is less altered and less poor in mechanical properties than the reddish (deeper) layer, although both of them may appear to have the consistency of a soft rock and are both subjected to weathering;
  • Assuming the same slope geometry, same water content, and same boundary conditions, when a road cut slope involves only the shallow, less altered soil, it could be more stable than a cut slope involving the deeper and weaker soil layer;
  • Although, from the point of view of classification (see, for example, the grain size curve and USCS classification) and mechanical characterization, the two materials may appear similar, with very close geotechnical parameters, and microstructural and petrophysical analyses demonstrate different characteristics in terms of the microstructure and mineralogical composition;
  • The selective chemical alteration of similar rocks at different depths may induce significant mineralogical and petrophysical changes, promoting the nucleation of shallow sliding surfaces.
In the specific case study of the Kabaya landslide, the microstructural features and mineralogical composition of the two involved soils revealed their geological history and helped to understand the predisposing factors of the triggering mechanism, which is more than what could be assessed only through standard geotechnical tests. However, further investigations will be performed on the mechanical behavior of the soil, even in partially saturated conditions, using triaxial tests, and on the experimental evaluation of the hydraulic conductivity of different soil layers, to better modeling the triggering mechanism of the landslide.
These considerations lead to the suggestion of a careful and detailed analysis of the materials involved in landslide phenomena, especially for laterites or soft rocks, whether they are superficial or deep, as minimal differences at the macroscopic scale may indicate more important differences at the microscopic scale, with risky consequences in slope stability analysis and the design of support structures.

Author Contributions

Conceptualization: R.V. and M.P.; material preparation, data collection, and analysis: R.V., M.P. and J.M.; supervision: R.V.; writing—original draft: R.V. and M.P.; writing—review and editing: R.V., M.P. and J.M. All authors have read and agreed to the published version of the manuscript.

Funding

This work has benefited from the equipment and framework of the COMP-HUB and COMP-R Initiatives and was funded by the “Departments of Excellence” program of the Italian Ministry for University and Research (MIUR, 2018–2022 and MUR, 2023–2027).

Data Availability Statement

The datasets generated and analyzed during the current study are not publicly available but are available from the corresponding author upon reasonable request.

Acknowledgments

Andrea Comelli (University of Parma) is kindly thanked for having prepared thin sections from difficult samples. The authors would also like to thank the two anonymous reviewers for their valuable comments.

Conflicts of Interest

The authors declare no conflicts of interest.

References

  1. Froude, M.J.; Petley, D.N. Global fatal landslide occurrence from 2004 to 2016. Nat. Hazards Earth Syst. Sci. 2018, 18, 2161–2181. [Google Scholar] [CrossRef]
  2. Guzzetti, F.; Gariano, S.L.; Peruccacci, S.; Brunetti, M.T.; Marchesini, I.; Rossi, M.; Melillo, M. Geographical landslide early warning systems. Earth Sci. Rev. 2020, 200, 102973. [Google Scholar] [CrossRef]
  3. Du, Y.; Xie, M.; Jia, J. Stepped settlement: A possible mechanism for translational landslides. Catena 2020, 187, 104365. [Google Scholar] [CrossRef]
  4. Cao, H.; Ma, G.; Liu, P.; Qin, X.; Wu, C.; Lu, J. Multi-Factor Analysis on the Stability of High Slopes in Open-Pit Mines. Appl. Sci. 2023, 13, 5940. [Google Scholar] [CrossRef]
  5. Kirschbaum, D.; Kapnick, S.B.; Stanley, T.; Pascale, S. Changes in extreme precipitation and landslides over hogh mountains Asia. Geophys. Res. Lett. 2020, 47, 4. [Google Scholar] [CrossRef]
  6. Dewitte, O.; Dille, A.; Depicker, A.; Kubwimana, D.; Maki Mateso, J.C.; Bibentyo, T.M.; Uwihirwe, J.; Monsieurs, E. Constraining landslide timing in a data-scarce context: From recent to very old processes in the tropical environment of the North Tanganyika-Kivu Rift region. Landslides 2021, 18, 161–177. [Google Scholar] [CrossRef]
  7. Monsieurs, E.; Jacobs, L.; Michellier, C.; Basimike, J.; Bamulezi Ganza, G.; Kervyn, F.; Maki Mateso, J.C.; Mugaruka Bibentyo, T.; Kalikone Buzera, C.; Nahimana, L.; et al. Landslide inventory for hazard assessment in a data-poor context: A regional-scale approach in a tropical African environment. Landslides 2018, 15, 2195–2209. [Google Scholar] [CrossRef]
  8. Nobile, A.; Dille, A.; Monsieurs, E.; Basimike, J.; Mugaruka Bibentyo, T.; d’Oreye, N.; Kervyn, F.; Dewitte, O. Multi-temporal DInSAR to characterise landslide ground deformations in a tropical urban environment: Focus on Bukavu (DR Congo). Remote Sens. 2018, 10, 626. [Google Scholar] [CrossRef]
  9. Depicker, A.; Govers, G.; Jacobs, L.; Campforts, B.; Uwihirwe, J.; Dewitte, O. Interactions between deforestation, landscape rejuvenation, and shallow landslides in the North Tanganyika–Kivu rift region, Africa. Earth. Surf. Dynam. 2021, 9, 445–462. [Google Scholar] [CrossRef]
  10. Deijns, A.A.J.; Dewitte, O.; Thiery, W.; d’Oreye, N.; Malet, J.P.; Kervyn, F. Timing landslide and flash flood events from SAR satellite: A 1 new method illustrated in African cloud-covered tropical environments. Nat. Hazards Earth Syst. Sci. 2022, 22, 3679–3700. [Google Scholar] [CrossRef]
  11. Maki Mateso, J.C.; Bielders, C.; Monsieurs, E.; Depicker, A.; Smets, B.; Tambala, T.; Bagalwa Mateso, L.; Dewitte, O. Characteristics and causes of natural and human-induced landslides in a tropical mountainous region: The rift flank west of Lake Kivu (Democratic Republic of the Congo). Nat. Hazards Earth Syst. Sci. 2023, 23, 643–666. [Google Scholar] [CrossRef]
  12. Valentino, R.; Sobio, Y.; Mizero, J.; Safari, J.; Nsengiyumva, F. Unstable road cut slopes and design of retaining structures in the Rwandan context. Arab. J. Geosci. 2021, 14, 1405. [Google Scholar] [CrossRef]
  13. Nsengiyumva, J.B.; Luo, G.; Nahayo, L.; Huang, X.; Cai, P. Landslide Susceptibility Assessment Using Spatial Multi-Criteria Evaluation Model in Rwanda. Int. J. Environ. Res. Public Health 2018, 15, 243. [Google Scholar] [CrossRef] [PubMed]
  14. Nsengiyumva, J.B.; Luo, G.; Amanambu, A.C.; Mind’je, R.; Habiyaremye, G.; Karamage, F.; Ochege, F.U.; Mupenzi, C. Comparing probabilistic and statistical methods in landslide susceptibility modeling in Rwanda/Centre-Eastern Africa. Sci. Total Environ. 2019, 659, 1457–1472. [Google Scholar] [CrossRef] [PubMed]
  15. Nsengiyumva, J.B.; Valentino, R. Predicting landslide susceptibility and risks using GIS-based machine learning simulations, case of upper Nyabarongo catchment. Geomat. Nat. Hazards Risk 2020, 11, 1250–1277. [Google Scholar] [CrossRef]
  16. Kumar, V.; Chandrasekaran, S.S. Analysis of failure of high slope subjected to rainfall infiltration at Peringavu in Kerala, India. Eng. Fail. Anal. 2022, 138, 106423. [Google Scholar] [CrossRef]
  17. Du, Y.; Chen, C. Data Mining for Landslide Genetic Mechanism Analysis in the Yunnan Province of China. Geotech. Geol. Eng. 2022, 40, 5631–5642. [Google Scholar] [CrossRef]
  18. Singh, R.; Umrao, R.K.; Singh, T.N. Stability evaluation of road-cut slopes in the Lesser Himalaya of Uttarakhand, India: Conventional and numerical approaches. Bull. Eng. Geol. Environ. 2014, 73, 845–857. [Google Scholar] [CrossRef]
  19. Reuters. 2023. Available online: https://www.reuters.com/business/environment/rwanda-floods-kill-130-destroy-over-5000-houses-2023-05-04/ (accessed on 1 March 2024).
  20. Miščević, P.; Vlastelica, G. Impact of weathering on slope stability in soft rock mass. J. Rock Mech. Geotech. Eng. 2014, 6, 240–250. [Google Scholar] [CrossRef]
  21. Oyelami, C.; Van Rooy, J. A review of the use of lateritic soils in the construction/development of sustainable housing in Africa: A geological perspective. J. Afr. Earth. Sci. 2016, 119, 226–237. [Google Scholar] [CrossRef]
  22. Kaze, R.C.; Naghizadeh, A.; Tchadjie, L.; Adesina, A.; Yankwa Djobo, J.N.; Deutou Nemaleu, J.; Kamseu, E.; Melo, U.C.; Tayeh, B.A. Lateritic soils based geopolymer materials: A review. Constr. Build. Mater. 2022, 344, 128157. [Google Scholar] [CrossRef]
  23. Gonzalez de Vallejo, L.I.; Ferrer, M. Geological Engineering; CRC Press/Balkema: Leiden, The Netherlands, 2011. [Google Scholar]
  24. Sinha, S.; Basu, A. Influence of parent lithology on field appearances and engineering properties of indurated laterites under same geographical conditions. Eng. Geol. 2021, 295, 106413. [Google Scholar] [CrossRef]
  25. Olanipekun, E.O. Kinetics of leaching laterite. Int. J. Min. Process. 2000, 60, 9–14. [Google Scholar] [CrossRef]
  26. Mitchell, J.K.; Soga, K. Fundamentals of Soil Behavior, 3rd ed.; John Wiley & Sons: Hoboken, NJ, USA, 2005. [Google Scholar]
  27. Kasthurba, A.K.; Santhanam, M.; Mathews, M.S. Investigation of laterite stones for building purpose from Malabar region, Kerala state, SW India—Part 1: Field studies and profile characterisation. Constr. Build. Mater. 2007, 21, 73–82. [Google Scholar] [CrossRef]
  28. Gao, Q.F.; Yu, H.C.; Zeng, L.; Huang, Y.X. Characterization of water retention behavior of cracked compacted lateritic soil exposed to wet-dry cycles. Bull. Eng. Geol. Environ. 2023, 82, 61. [Google Scholar] [CrossRef]
  29. Kong, L.; Sayem, H.M.; Tian, H. Influence of drying-wetting cycles on soil-water characteristic curve of undisturbed granite residual soils and microstructure mechanism by nuclear magnetic resonance (NMR) spin-spin relaxation time (T2) relaxometry. Can. Geotech. J. 2018, 55, 208–216. [Google Scholar] [CrossRef]
  30. Bai, W.; Zhang, W.; Kong, L.; Fan, H.; Guo, A.; Xu, G. Effect of soaking time of dithionite–citrate–bicarbonate solution on strength and deformation characteristics of lateritic soil. J. Rock Mech. Geotech. Eng. 2023, 15, 3039–3049. [Google Scholar] [CrossRef]
  31. Carte Lithologique du Rwanda; Stanford Libraries: Stanford CA, USA, 1963.
  32. Schlüter, T. Geological Atlas of Africa; Springer: Berlin/Heidelberg, Germany, 2006; p. 272. [Google Scholar] [CrossRef]
  33. ASTM D6913-04:2009-e1; Standard Test Methods for Particle-Size Distribution (Gradation) of Soils Using Sieve Analysis. ASTM International: West Conshohocken, PA, USA, 2009.
  34. ASTM D7928-21e1; Standard Test Method for Particle-Size Distribution (Gradation) of Fine-Grained Soils Using the Sedimentation (Hydrometer) Analysis. ASTM International: West Conshohocken, PA, USA, 2021.
  35. ASTM D4318:2010; Standard Test Methods for Liquid Limit, Plastic Limit, and Plasticity Index of Soils. ASTM International: West Conshohocken, PA, USA, 2010.
  36. Pizzati, M.; Balsamo, F.; Storti, F.; Mozafari, M.; Iacumin, P.; Tinterri, R.; Swennen, R. From axial parallel to orthogonal groundwater flow during fold amplification: Insights from carbonate concretion development during the growth of the Quattro Castella Anticline, Northern Apennines, Italy. J. Geol. Soc. 2018, 175, 806–819. [Google Scholar] [CrossRef]
  37. Hergert, W.; Wriedt, T. The Mie Theory—Basics and Applications; Springer: Berlin/Heidelberg, Germany, 2012. [Google Scholar]
  38. Storti, F.; Balsamo, F. Particle size distributions by laser diffraction: Sensitivity of granular matter strength to analytical operating procedures. Solid Earth 2010, 1, 25–48. [Google Scholar] [CrossRef]
  39. Schneider, C.A.; Rasband, W.S.; Eliceiri, K.W. NIH Image to ImageJ: 25 years of image analysis. Nat. Methods 2012, 9, 671–675. [Google Scholar] [CrossRef]
  40. ASTM D4546-21; Standard Test Methods for One-Dimensional Swell or Collapse of Soils. ASTM International: West Conshohocken, PA, USA, 2021.
  41. British Standards BS 1377-7:1990; Methods of Test for Soils for Civil Engineering Purposes—Shear Strength Tests (Total Stress). British Standards Institution: London, UK, 1990.
  42. Li, Z.; Li, J.; Han, M.; Liu, L. Investigating the Shear Strength Characteristics of Slip Zone Soil Based on In-situ Multiple Shear Tests. KSCE J. Civ. Eng. 2023, 27, 3793–3807. [Google Scholar] [CrossRef]
  43. Falcão, P.R.; Baroni, M.; Masutti, G.C.; Rinaldo Pinheiro, J.B.; Fagundes, D.d.F. Assessment of the Impact of Inundation on the Strength of a Lateritic and Collapsible Soil. Geotech. Geol. Eng. 2023, 41, 4761–4773. [Google Scholar] [CrossRef]
  44. Onwo, E.S.; Emeh, C.; Igwe, O. Effect of Geochemical Composition of Lateritic Soils on their Geotechnical Properties. Indian Geotech. J. 2022, 52, 877–894. [Google Scholar] [CrossRef]
  45. Puckett, W.E.; Dane, J.H.; Hajek, B.F. Physical and mineralogical data to determine soil hydraulic properties. Soil Sci. Soc. Am. J. 1985, 49, 831–836. [Google Scholar] [CrossRef]
  46. Shi, W.; Lehane, B.M.; Gover, A.; Terzaghi, S. Characterisation of a lateritic soil using laboratory and in-situ tests. In Proceedings of the Fifth International Conference on Geotechnical and Geophysical Site Characterization (ISC’5), Gold Coast, Australia, 5–9 September 2016; Australian Geomechanics Society: Sydney, Australia, 2016. [Google Scholar]
  47. Sun, S.; Li, K.; Le, H.; Wei, G.; Liu, D.; Song, J.; Yu, Y. Study on the deterioration characteristics of greenschist under hydrochemical action and the disaster-causing mechanism in slope. Bull. Eng. Geol. Environ. 2022, 81, 315. [Google Scholar] [CrossRef]
  48. Sardana, S.; Sinha, R.K.; Verma, A.K.; Singh, T.N. Investigations into the freeze–thaw-induced alteration in microstructure and deteriorative responses of physico-mechanical properties of Himalayan rock. Bull. Eng. Geol. Environ. 2022, 81, 269. [Google Scholar] [CrossRef]
  49. Zhang, X.; Liu, X.; Chen, C.; Xu, Y.; Liu, H. Evolution of disintegration properties of granite residual soil with microstructure alteration due to wetting and drying cycles. Bull. Eng. Geol. Environ. 2022, 81, 93. [Google Scholar] [CrossRef]
  50. Fu, X.; Du, Y.; Sheng, Q.; Zhang, Z.; Huang, J. Influences of water on the microstructure and mechanical behavior of the Xigeda formation. Bull. Eng. Geol. Environ. 2022, 81, 72. [Google Scholar] [CrossRef]
  51. Cerri, R.I.; Rosolen, V.; Reis, F.A.G.V.; Pereira Filho, A.J.; Vemado, F.; do Carmo Giordano, L.; Marques Gabelini, B. The assessment of soil chemical, physical, and structural properties as landslide predisposing factors in the Serra do Mar mountain range (Caraguatatuba, Brazil). Bull. Eng. Geol. Environ. 2020, 79, 3307–3320. [Google Scholar] [CrossRef]
  52. Bittelli, M.; Pellegrini, S.; Olmi, R.; Andrenelli, M.C.; Simonetti, G.; Borrelli, E.; Morari, F. Experimental evidence of laser diffraction accuracy for particle size analysis. Geoderma 2022, 409, 115627. [Google Scholar] [CrossRef]
  53. Montrasio, L.; Valentino, R. Modelling rainfall-induced shallow landslides at different scales using SLIP—Part I, VI Italian Conference of Researchers in Geotechnical Engineering—Geotechnical Engineering in Multidisciplinary Research: From Microscale to Regional Scale, CNRIG2016. Procedia Eng. 2016, 158, 476–481. [Google Scholar] [CrossRef]
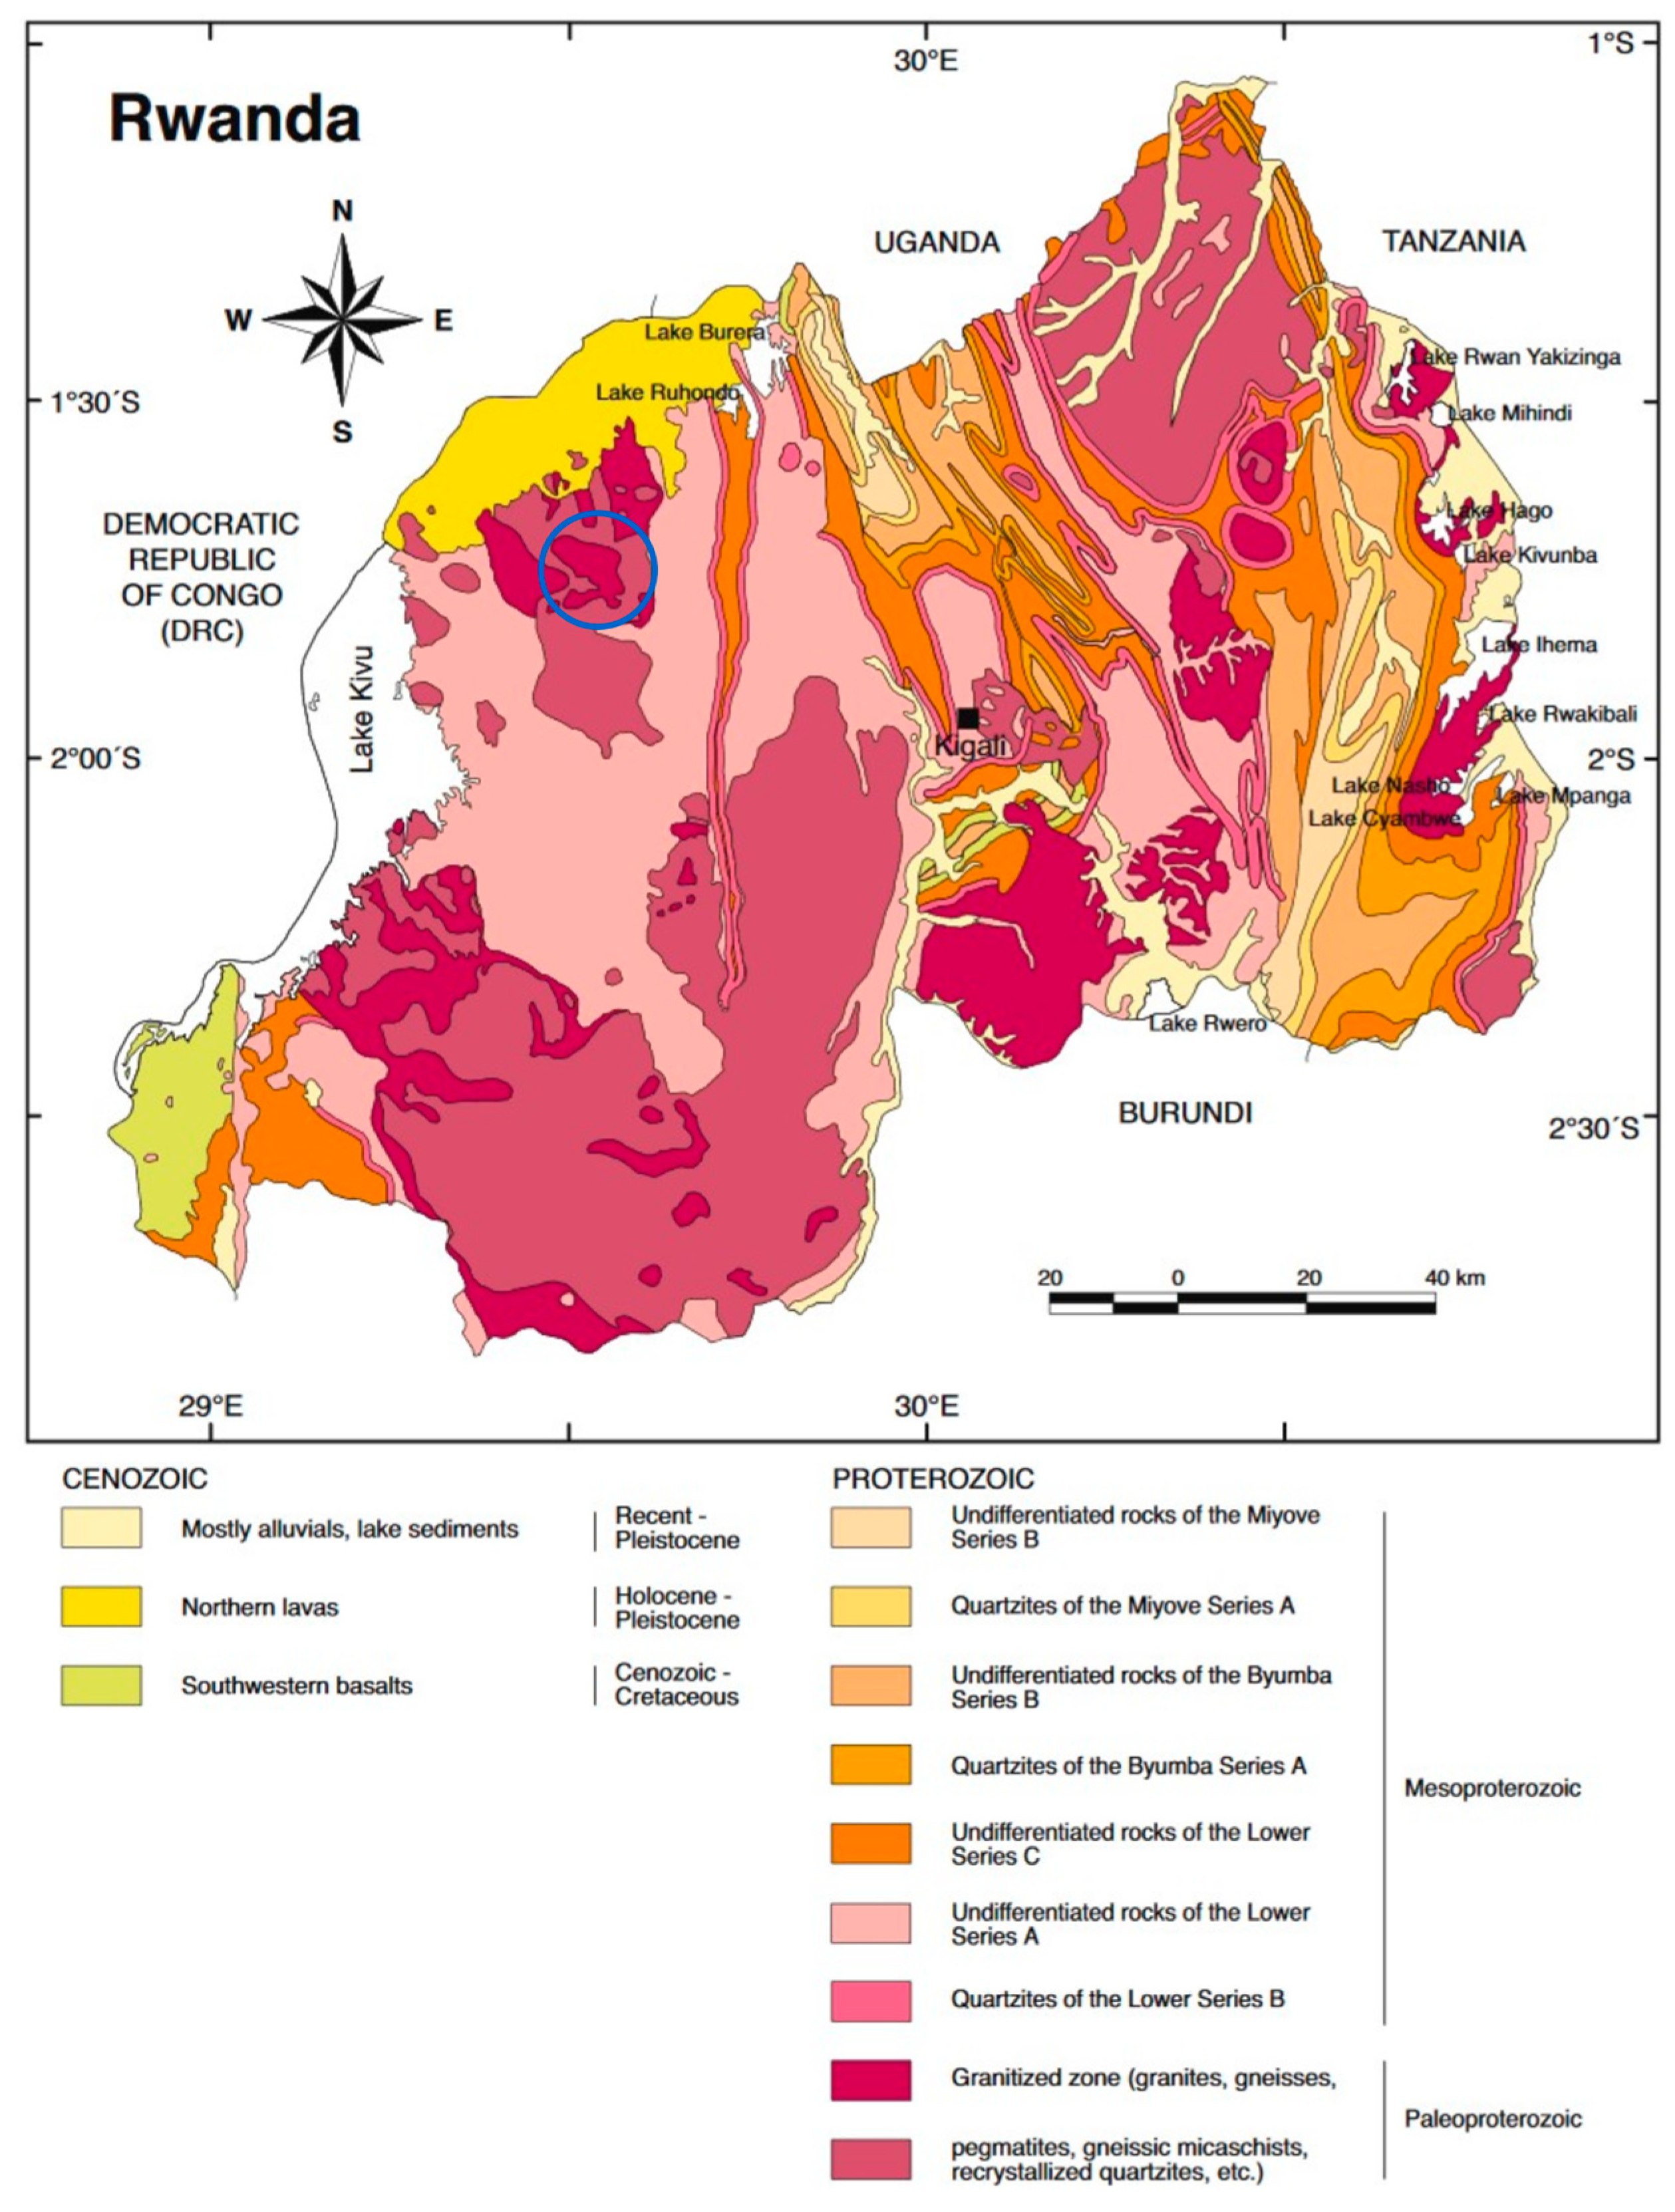
Figure 1. Geologic map of Rwanda (the test area is in the blue circle); geological atlas of Africa [32].
Geohazards 05 00029 g001
Figure 2. Detailed geological map of the study area. The dashed circle corresponds to the location of the Kabaya landslide [31].
Geohazards 05 00029 g002
Figure 3. Pictures of the studied landslide. (a) Detail of the slope along the road cut hosting the studied landslide. (b) Closure of the road due to the landslide.
Geohazards 05 00029 g003
Figure 4. Kabaya–Ngororero study site: daily and cumulative precipitation from 1 April 2018 to the date of the event (2 May 2018) based on rainfall data from the Kabaya weather station. The blue arrow indicates the day when the landslide occurred.
Geohazards 05 00029 g004
Figure 5. Scarp of the Kabaya road cut slope after the landslide occurred. The different labels refer to the several soil samples (see Table 1) at the position where they were collected along the slope. The white dashed line identifies the separation between the whitish (above) and reddish (below) soil layers.
Geohazards 05 00029 g005
Figure 6. Sketch of the slope before failure. The blue dashed line represents the failure surface.
Geohazards 05 00029 g006
Figure 7. Pictures of two samples employed to characterize the microstructural, petrophysical, and mineralogical composition of the rocks involved in the studied landslide. The sample position is shown in Figure 5. (a) AR1 sample (reddish layer). (b) AR2 sample (whitish layer).
Geohazards 05 00029 g007
Figure 8. Grain size distribution curves of the soil samples.
Geohazards 05 00029 g008
Figure 9. Thin section, high-resolution scan of the two representative samples. (a) AR2, least altered metamorphic schist. (b) AR1, most altered schist.
Geohazards 05 00029 g009
Figure 10. Micro-textural characteristics of the sampled soft rocks. (a) Metamorphic layering of quartz and muscovite mica in the AR2 sample. (b) Detail of muscovite layers with patchily distributed alteration clay minerals. (c) The AR1 sample with a sub-parallel layering of quartz and dark-brown clay minerals. (d) Detail of severe alteration with development of extensive area occupied by dark-brown clay minerals in the AR1 sample. Q, quartz; M, muscovite mica; CM, clay mineral; P, pore.
Geohazards 05 00029 g010
Figure 11. SEM-EDS X-ray analysis to determine the mineralogical composition of clay minerals. (a) Emission spectrum obtained from muscovite mica in the AR2 least-altered sample. (b) The emission spectrum gained from clay mineral identified to be kaolinite in the AR1 more-altered sample. Q, quartz; M, muscovite mica; CM, clay mineral; Al, aluminum; Ca, calcium; Cl, chlorine; Fe, iron; K, potassium; Mg, magnesium; Na, sodium; O, oxygen; Ti, titanium; Si, silicon.
Geohazards 05 00029 g011
Figure 12. Box–whisker interquartile plot of 2D porosity gained via the image analysis technique on thin sections (n = the number of analyzed photomicrographs).
Geohazards 05 00029 g012
Figure 13. Experimental results of the swelling tests.
Geohazards 05 00029 g013
Figure 14. Experimental results of direct shear tests on the AR1 soil sample (reddish): (a) shear stress vs. horizontal displacement; (b) vertical displacement vs. horizontal displacement.
Geohazards 05 00029 g014
Figure 15. Experimental results of direct shear tests on the AR2 soil sample (whitish): (a) shear stress vs. horizontal displacement; (b) vertical displacement vs. horizontal displacement.
Geohazards 05 00029 g015
Figure 16. Plot of the peak and residual shear stress against normal stress and related Mohr–Coulomb failure criterion.
Geohazards 05 00029 g016
Figure 17. Results of the slope stability analysis carried out using SLIDE-2 (Roscscience®) (Morgenstern–Price method): only potential failure surfaces with a safety factor of less than one are shown, while the minimum safety factor is 0.8.
Geohazards 05 00029 g017
Table 1. Soil classification.
Sample ID (Classification)Depth (m)LayerUSCS Classification
S4; S6; S7; S9; AR21.0WhitishSilty sand—SM
S1; S22.0WhitishSandy silt—ML
S3; S5; S8; S10; AR12.0ReddishSandy silt—ML
Table 2. Properties of the soil samples subjected to the swelling test.
Sample ID LayerDepth (m)γn (kN/m3)γs (kN/m3)wi
(%)
wf
(%)
n
(%)
e0
-
Sri
(%)
Srf
(%)
Ks
(m/s)
AR1Reddish 2.018.926.515.823.238.50.63681004.9 × 10−6
AR2Whitish1.019.526.513.920.235.50.55681004.3 × 10−5
γn: unit weight of natural soil; γs: unit weight of saturated soil; wi: initial gravimetric water content; wi: final gravimetric water content; n: porosity; e0: initial void ratio; Sri: initial degree of saturation; Srf: final degree of saturation; Ks: hydraulic conductivity.
Table 3. Shear strength parameters.
Sample ID Depth
(m)
cp
(kPa)
ϕp
(°)
cr
(kPa)
ϕr
(°)
AR12.02.329028
AR21.04.731028
Disclaimer/Publisher’s Note: The statements, opinions and data contained in all publications are solely those of the individual author(s) and contributor(s) and not of MDPI and/or the editor(s). MDPI and/or the editor(s) disclaim responsibility for any injury to people or property resulting from any ideas, methods, instructions or products referred to in the content.