Abstract
This study focuses on slope stability and geological hazard analyses at the Italian Paleolithic site of Grotta Paglicci. The site is characterized by a cave that contains rich archaeological and anthropological finds, spanning various Paleolithic periods, and includes faunal remains, lithic artifacts, human burials, ornaments, mobiliary art objects, and unique Paleolithic wall paintings. The study employs a multi-technique approach that includes topographic surveys carried out by the robotic total station and GNSS receivers, photogrammetric acquisitions with an unmanned aerial system, 3D SLAM-based LiDAR mapping, and an engineering geological survey. The collected data allowed for the creation of georeferenced 3D models that were utilized in rock slope stability analysis and modeling. The results of this comprehensive survey highlighted how the bedding and joint discontinuities influence rock stability in both the external and internal areas of the cave. The integrated use of SLAM-based LiDAR and photogrammetry has been proven to be an efficient and essential tool in the evaluation of the structural interactions between the external morphology and the cave, thus allowing the proposal of safety measures that will keep the site accessible for future activities.
1. Introduction
Natural caves, which are characterized by significant anthropological and geological heritage, are often affected by rock instabilities that compromise their access and human activities in safe conditions. Overcoming these limitations may require the employment of modern survey techniques that allow the assessment and mapping of geohazards.
Underground natural environments have typically complex structures that require investigation with the use of both multiple techniques and technologies. The most commonly utilized methods of spatial data acquisition in complex and extensive caverns are referred to as LiDAR (light detection and ranging) and digital photogrammetry. The application of solely ground-based LiDAR for spatial mapping is documented in several case studies, such as in the Las Caldas and Penade Candamo caves, in Spain [1], the Dachstein cave, in Austria [2], the Wonderwerk cave, in South Africa [3], the Parpello cave, in Spain [4], the Les Fraux cave, in France [5], the Pollera cave, in Italy [6], the Jenolan and Koonalda caves, in Australia [7], the Domica cave, in Slovakia [8], the Elvandi cave, in Ecuador [9], the Perhersk Lavra cave, in Ukraine [10], and the Grotta Giusti cave, in Italy [11]. Nevertheless, a major drawback of ground-based LiDAR applications is the prolonged time required for data acquisition, as described in [12] for the İnceğiz caves in Turkey.
Other examples of terrestrial laser scanning being applied to hypogeal cavities with an additional geological aim include the Santa Barbara cave, in Italy [13], the Orgnac’s cave, in France [14,15], the Märchenhöhle cave, in Austria [16], the Pastora cave, in Spain [17], the caves of the Ardèche-Chartreuse-Vercors-Bauges Département regional parks in France [18], the Algar do Penico cave, in Portugal [19], and the Grotta A cave, in Italy [20].
Examples of studies that include rock instability analyses are represented by the Sant’Angelo in Criptis cave, in Italy [21], the El Mirador volcanic cave, in Ecuador [22], the Coccio cave, in Italy [23], the Badajo cave, in Spain [24], and the Saint Michael cave, in Italy [25]. In these case studies, 3D cave models were obtained using either LiDAR [21], digital photogrammetry [22,24], or both methodologies [23,25].
Most of the latter cited works employ traditional methods of rock slope stability analysis, such as the kinematic and dynamic methods based on rock mass characterization. Few papers include finer analyses such as numerical modeling [22,24].
Nowadays, LiDAR systems, such as the SLAM-based system (simultaneous localization and mapping), may allow greater coverage and speed, greater availability of data in remote or inaccessible areas, versatility regarding terrain, efficient data collection, and rapid data processing [26,27,28,29,30]. This acquisition approach overcomes the major drawbacks typical of ground-based terrestrial laser scanning, which are due to longer acquisition times and, in complex and extensive morphologies, the presence of several station points, which are required to avoid shadow areas.
Moreover, in terms of spatial data acquisition, sometimes an additional survey, which includes not only the cave but also the external surrounding areas, can be necessary. This can be performed with similar ground-based technologies or UAS-based (unmanned aerial system) equipment.
In view of these premises, a multi-technique approach was adopted in this work to study the whole geological hazard of Grotta Paglicci, including both the external and the inner hypogeal system.
Grotta Paglicci is a Paleolithic cave located in the municipality of Rignano Garganico (Foggia, Italy; Figure 1). Ongoing archaeological and paleoanthropological research at this site has been conducted for over fifty years by the University of Siena, in collaboration with the local heritage office (Soprintendenza Archeologica, Belle Arti e Paesaggio of the Provinces of Barletta-Andria-Trani-Foggia). Moreover, Grotta Paglicci has never been studied from an engineering geological perspective, and stability analysis has not been performed until now. The actual cave consists of four main chambers (Figure 2). In particular, the Atrium contains an important 12-meter-thick anthropogenic deposit that represents one of the most complete Upper Paleolithic stratigraphic sequences in Europe. Notable findings include lithic artifacts, faunal remains, Gravettian burials, isolated human remains, ornamental objects, and portable art. Furthermore, wall paintings, presumably attributable to the Gravettian period, were also discovered in the innermost chamber of the cave (Chamber 3 in Figure 2).
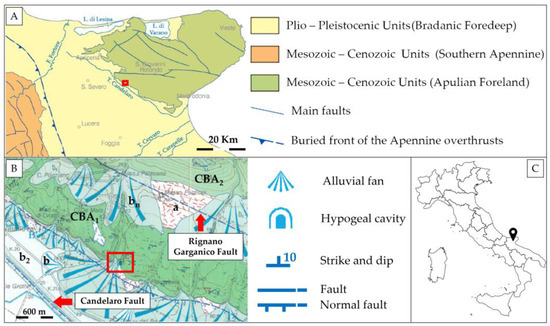
Figure 1.
Tectonic scheme of the study area, modified from [31]: in (A), the red box indicates the position of Grotta Paglicci. Geological map of the study area (B) with 25-meter contour line intervals; the letters in (B) indicate: a—slope cover deposit, b—present alluvial deposit, b2—eluvial–colluvial deposit, bn—terrace alluvial deposit, CBA1—Monte Calvo del Gargano member, CBA2—Borgo Celano member. The inset map, (C), shows the location of Grotta Paglicci in the Gargano Promontory.
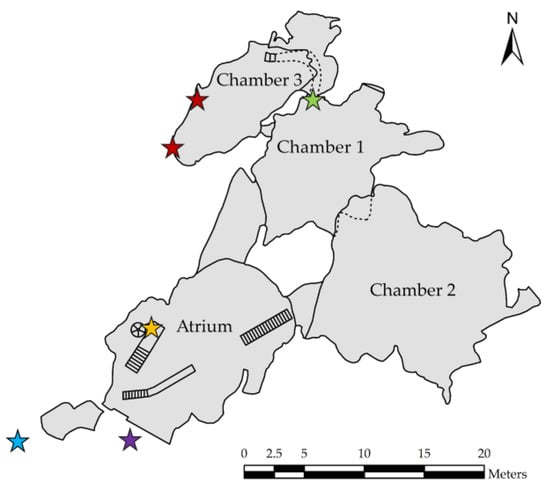
Figure 2.
Cave system of Grotta Paglicci. The archaeological and anthropological findings are indicated by colored stars: the yellow star marks the 12-meter-thick stratigraphy (Middle and Upper Paleolithic sequence); the red star marks the wall paintings (Upper Paleolithic); the blue star marks the external rock shelter (Lower/Middle Paleolithic); the purple star marks the Upper Paleolithic sequence outside the present-day entrance; the green star marks the Upper Paleolithic deposit.
The adopted multi-technique approach consisted of: (i) a topo-cartographic survey, carried out using RTS (robotic total station) and GNSS (global navigation satellite system) receivers, aimed at data georeferencing; (ii) a spatial data acquisition executed by UAS-photogrammetry for the external zones, and by SLAM-based laser scanning for the cave system.
Spatial data was integrated with information on rock discontinuities collected during the engineering-geological survey, aimed at characterizing all the joint systems and the rock mass. Moreover, a kinematic stability analysis was carried out for the slope. Finally, 2D finite element method (FEM) numerical modeling enabled us to define the distribution of principal stresses and displacements along several cross-sections.
Since the area, given its anthropological significance, is intended to be opened for future scientific campaigns, the obtained results, due to their high detail and comprehensiveness, are being used to plan future remediation efforts for site safety. In fact, the results concerning kinematic mechanisms and slope stability are fundamental for the main purpose of preventing and mitigating possible hazardous events. These actions will not only secure the safety conditions for personnel involved in future research but also preserve the site in the long term.
The remediation project, which will comprise the installation of support and reinforcement and the monitoring system, is not thoroughly discussed in the present manuscript, but how our findings led to the actual project’s technical proposal will be explained in the discussion in Section 6.
2. Geological Setting
The study area is located at the border between two main geodynamic–structural domains (Figure 1A): the eastern Apulian Foreland, represented by the Gargano Promontory, and the western Bradanic Foredeep basin, known as the Tavoliere delle Puglie [31].
Limestones are the dominant lithology in the area, and their rocky layers exhibit thickness variations ranging from 30 to 200 cm and dip toward the south, varying from horizontal to 50–60 degrees [31]. This lithology belongs to the “Monte Calvo del Gargano” member (CBA1 in Figure 1B), which dates to the Callovian–Valanginian stages (165.3 ± 1.1 Ma−132.6 Ma) [32,33]. This member forms part of the “Calcari di Bari” succession, which is Upper Jurassic–Lower Cretaceous in age (201.4 ± 0.2−66.0 Ma).
The Grotta Paglicci study area has a complex structural history that is characterized by the presence of ancient strike-slip faults such as the Rignano Garganico Fault and the Candelaro Fault (Figure 1B). These faults have experienced reactivation with extensional or trans-extensional kinematics and are presently partially buried by Quaternary deposits, contributing to the formation of steep escarpments along the southern and southwestern edges of the Gargano Promontory [31].
The predominant morphogenetic process in the Gargano Promontory is karstification, which varies in distribution and shape depending on lithology, structural characteristics, and tectonic evolution [34,35]. Within the study area, there are two primary karst hypogeal cavities: Grotta Paglicci and the easternmost, and least documented, Grotta dei Pilastri, which are interconnected by a relatively small cavity or tunnel. Above this connecting tunnel, a shallow sinkhole is evident on the surface, resulting from a possible collapse of the tunnel roof. Presently, this connecting cavity remains inaccessible and is covered by collapse debris, which includes blocks of varying sizes and fine material. Furthermore, within Chamber 2 of Grotta Paglicci (Figure 2), observations revealed that joints have allowed limited water inflows and enabled the root systems of the surface vegetation to reach the underground space.
3. Anthropological and Archaeological Setting
The importance of Grotta Paglicci as an archaeological site was detected for the first time in 1955 by Professor Raffaello Battaglia (University of Padova); preliminary fieldworks, directed by the Natural History Museum of Verona, in 1961 and 1963 brought to light a Paleolithic deposit. From the seventies onward, Grotta Paglicci was studied by the University of Siena, always in collaboration with the local heritage office [36]. The site is composed of the present-day cave and a rock shelter that was part of the same underground system before the collapse of the ceiling (Figure 2). The importance of the site lies in the long stratigraphic sequence found both in the cave and in the rock shelter; indeed, the deposit covers a time span that embraces middle Paleolithic phases and an Upper Paleolithic sequence. It represents one of the most complete deposits in Europe and it can be considered as a reference for the Mediterranean area [37]. A 12-meter-thick stratigraphy was found in the Atrium (the yellow star in Figure 2). Its bottom, referable to an ancient phase of the middle Paleolithic, partially correlates with the deposit of the rock shelter (the blue star in Figure 2) [38]. The Upper Paleolithic sequence spans from the Marginally Backed Bladelets Aurignacian (about 40,000 years before the present (BP)) to the Final Epigravettian, dated to about 13,000 years BP. In the aforementioned chronological time span, the sequence covers all the Upper Paleolithic phases known in southern Italy. Archaeological layers yielded a large number of faunal remains, lithic artifacts, human remains (among which two complete Gravettian burials), portable art objects, and a portion of a wall painting that had collapsed from the vault [39,40,41,42,43,44,45,46,47,48,49,50]. In addition, one of the earliest pieces of evidence of flour production [51] and the only evidence of Paleolithic dogs found in Italy to date (the yellow star in Figure 2) [52] were discovered. Some layers of this sequence can be correlated with a thinner deposit located just outside the present-day cave entrance (the purple star in Figure 2) [53] and with another stratigraphy found in the inner part of the hypogean system between Chambers 1 and 3 (the green star in Figure 2) [54]. The layers are generally well-anthropized, except in some contexts, both in Atrium and Chamber 1, where evidence of hyena dens was detected (the yellow and green stars in Figure 2) [53,54,55]. Moreover, some Upper Paleolithic parietal paintings (the only example discovered in Italy to date) are still preserved in the inner part of Chamber 3 (the red stars in Figure 2) [56,57].
4. Materials and Methods
To fully characterize the morphologies of both the cave and the external surrounding areas, an integrated approach including topographic, UAS photogrammetric, and SLAM-based LiDAR surveys was adopted. Moreover, for the analysis of the rock slope’s stability, a kinematic stability study and 2D FEM numerical modeling were carried out, and analysis was also based on results from the in situ engineering–geological survey.
4.1. Topographic Survey
The topographic survey, conducted utilizing a LeicaTM GS15 dual-frequency geodetic GNSS (global navigation satellite system) receiver and a LeicaTM Nova MS50 robotic total station, was carried out to georeference the data and make them measurable. To reach this goal, the coordinates of various types of targets were measured, in particular (i) black/white targets for RTS scanning, (ii) yellow/black targets for the UAS photogrammetric survey, and (iii) circular-shaped optical targets for SLAM-based LiDAR scanning (Figure 3).
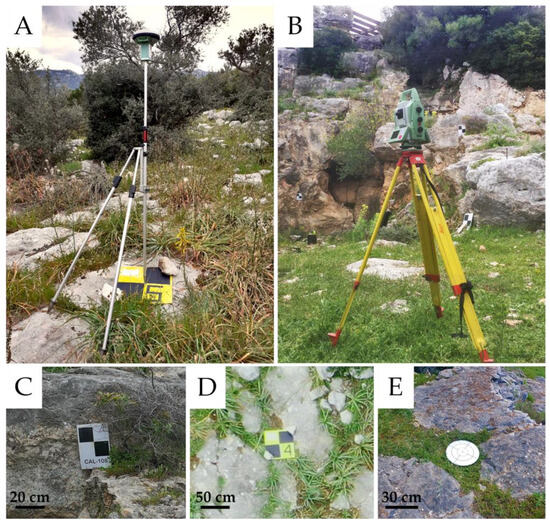
Figure 3.
Stages of the GNSS survey (A); the RTS survey (B); an example of a black/white target for RTS scanning (C); a yellow/black target for the UAS photogrammetric survey (D); a circular-shaped optical target for SLAM-based LiDAR scanning (E).
The coordinates of the targets located on the ground were measured using the GNSS receiver operating in NRTK (network real-time kinematic) mode. Measurements were executed, with acquisition times ranging from 20 s to a few minutes, to achieve positional accuracy values of about ±1 cm for planimetry and about ±1.2 cm for altimetry. The correction service used in NRTK is the HxGNTM Smartnet, while LeicaTM Infinity software (Version 3.4.2) [58] was used to visualize and validate, in the laboratory, the measured points. Using the Convergo application and related geodetic grids, the points’ elevation was transferred from the WGS84 ellipsoid to sea level. The GNSS data also allowed us to georeference the RTS survey, including points placed on the rock walls and in inaccessible areas. The relative accuracy of points measured by the RTS, considering that prisms were not utilized, can be estimated within the range of 5–8 mm.
The survey led to a total set of 30 measured targets that were then used to georeference the outputs obtained from the other techniques in the chosen reference system (i.e., ETRF2000/UTM33N).
4.2. UAS Photogrammetric Survey
The photogrammetric survey was performed using a DJITM Mavic2 Pro drone equipped with a Hasselblad L1D-20C, with a 1-inch sensor and 20-megapixel resolution, combined with a 10.26 mm lens. The study area was surveyed by a total of 3 different flights: the first one was executed in automatic mode, with nadiral shooting, using UgCS software (Version 4.18) [59] for flight planning. Two additional flights were carried out in manual mode, with the direction of photo acquisition almost orthogonal to the rock slopes, and the camera tilting from 45° to 65°. In this way, it was possible to obtain complete coverage of the external part of the study area from optimal points of view.
A total of 550 images were acquired in an area of 1.9 ha, with a ground spatial resolution of about 1 cm. The flights were planned to ensure sufficient overlap and sidelap between successive images (i.e., 75%). The photos were externally aligned thanks to a series of ground control points (GCPs) surveyed by the GNSS survey. GCPs related to the nadiral shots were materialized using 12 artificial yellow/black targets (Figure 3A,D). Among them, 9 were used as GCPs and 3 as check points (CP). In addition, 14 points were measured by the RTS on the vertical rock walls (Figure 3B,C): 11 were used as GCPs and 3 were used as CPs. The software used in the UAS photogrammetric data processing is Agisoft MetashapeTM (Version 2.0.2) [60], which exploits structure-from-motion and multi-view stereo techniques to align the frames—using a bundle block adjustment—and create a 3D dense point cloud.
4.3. SLAM-Based LiDAR Survey
The survey of the internal morphology of Grotta Paglicci, conducted by employing the SLAM-based LiDAR mapping technique, was aimed at rebuilding the geometries of the cave. The system used is an Emesent™ Hovermap ST model, which is able to create a 3D dense point cloud that is useful in simultaneously locating, mapping, and navigating within the enclosed chambers, thanks to an inertial navigation system and without the aid of GNSS.
This LiDAR system was set in double-return mode, with an acquisition speed of up to 600,000 points/s, in order to potentially guarantee high levels of ground detail. This technology characteristic proved to be very effective for the surveying of Grotta Paglicci, which is characterized by large internal chambers with a total approximate length of 60 m, confined spaces, corridors, ups and downs, and numerous shaded areas.
For the internal survey of the entire cave, a total of 3 runs were executed. The co-registration of the 3D dense point clouds was performed using the iterative closest point (ICP) algorithms within TrimbleTM Realworks software (Version 12.4) [61].
In addition, the Emesent™ Hovermap ST was equipped with an action camera that recorded videos simultaneously with the runs’ acquisition; this was particularly useful for the attribution of RGB colors to the interior point cloud of the cave. To ensure adequate lighting conditions during the laser scanning acquisitions, the cave chambers were fully illuminated using LED lamps (Figure 4).
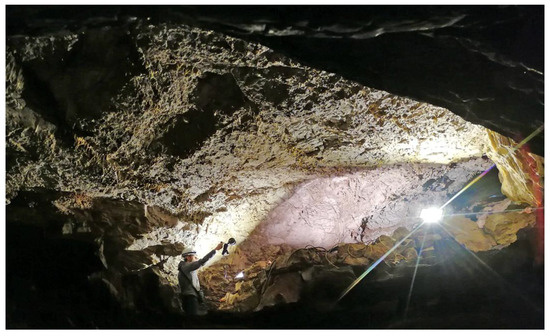
Figure 4.
Stages of the SLAM-based LiDAR survey at Grotta Paglicci.
4.4. Engineering–Geological Survey and Rock Mass Classification
The engineering–geological survey was carried out in the rock outcrops close to the entrance of the Grotta Paglicci, considering accessible and safe areas (Figure 5), both inside and outside the cave, which were considered important for characterizing the joints and bedding and to classify the rock mass. The collected data refer to the limestones of the “Monte Calvo del Gargano” member and includes discontinuities orientation, spacing, persistence, aperture, the type and thickness of infilling, roughness (using Barton’s comb and JRC—joint roughness coefficient—classes), weathering, humidity, and indirect uniaxial compressive strength (using Schmidt’s hammer-rebound R-value or sclerometer).
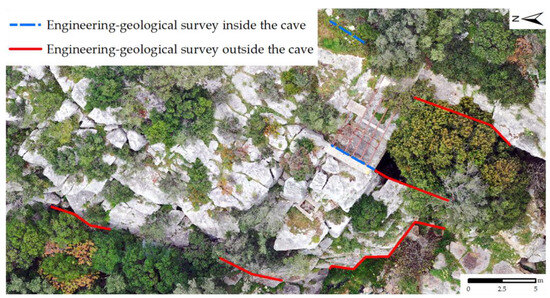
Figure 5.
Traces of scan lines showing where the engineering–geological surveys were conducted.
In the selection of survey sites, in addition to areas of logistical and anthropological interest for future excavation and analyses, different slope orientations were also considered in such a way as to be later adopted to assess their stability.
Due to the external morphology of the area, which is characterized by high and stepped vertical and sub-vertical rock walls, in addition to the presence of vegetation and unstable blocks, it was decided to conduct additional surveys by photointerpreting georeferenced photos and 3D data from the UAS photogrammetry and laser scanning analyses. The photointerpretation, carried out with CloudCompare software (Version 2) [62], included the measurement of discontinuity orientation (Figure 6), spacing, and persistence.
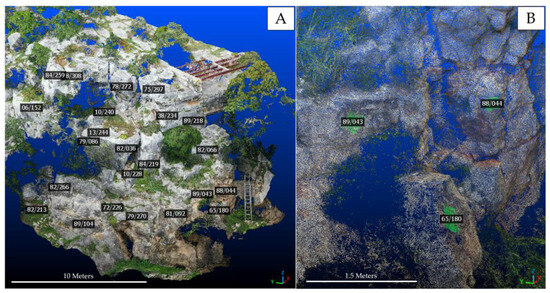
Figure 6.
Example of various discontinuity orientations as measured on the slope, shown in terms of dip and dip direction, with a right-hand rule (A). Detail of the 3D dense point cloud, with the planes for joint orientation measurement highlighted in green (B).
All the collected data were processed and were used to identify the main discontinuity systems and to characterize the rock mass according to the rock mass rating or RMR method [63], the Q-slope method [64], and the slope mass rating or SMR method [65].
These empirical rock engineering methods are commonly utilized for the definition of rock mass characteristics, the choice of appropriate support and reinforcement, and the performance assessment of natural or man-made slopes.
The RMR method allows the characterization of the rock mass and, from the empirical formulas proposed in [63] when laboratory tests are not available, to derive the rock mass friction angle (φ), cohesion (c), and deformation modulus (E). Moreover, the data gained from the RMR method represent a fundamental input for the failure criterion adopted in numerical modeling (see Section 4.5.2).
The SMR method is specifically designed to assess the stability of rock slopes, focusing on parameters relevant to their stability, including slope height, slope angle, orientation and the persistence of discontinuities, the presence of water, and rock mass strength.
The Q-Slope method also considers the environmental and geological conditions that can affect slopes over a long period of time and allows the identification of the slope limit dip angle for stability. In addition, it is possible to derive the required and acceptable slope dip angles equal to a 1%, 15%, 30%, and 50% probability of failure (PoF).
In view of their peculiarities, the reason behind the choice of utilizing all these three methods resides in the purpose of comprehensively characterizing the slope stability of Grotta Paglicci.
4.5. Rock Slope Stability Analysis
In order to assess the slope stability, we chose to apply two methods: kinematic stability analysis, a conventional and traditional analytical method, and 2D FEM numerical modeling.
Kinematic stability analysis focuses on geometric criteria, friction angle, and possible failure mechanisms, while 2D FEM modeling considers the stress and deformation behavior of the slope under various loading conditions. When analyzing slope stability, FEM analysis is widely utilized to investigate continuous rock masses that are affected by discontinuities [66,67].
4.5.1. Kinematic Stability Analysis
The kinematic stability analysis is based on the Markland test [68], which represents a stereographic technique used to analyze the possibility of failure in rocky slopes due to the following kinematic mechanisms: planar sliding, wedge sliding, and direct, oblique, and flexural toppling [69].
The analysis was carried out using RocScienceTM Inc. Dips software (Version 8.022) [70], which is based on the methods of Goodman [71] and Hudson and Harrison [72]. This software allows one to analyze and visualize orientation-based geological data and to perform kinematic stability analysis, which considers the slope orientation and the discontinuities’ attitude and properties (i.e., friction angle).
The data collected by the engineering–geological in-situ survey, and the photo interpreted with the 3D dense point cloud, provided an optimal database for the statistical kinematic stability analysis, which included the rock mass friction angle and the different slopes. This choice was made while considering the average slopes’ natural orientation and their location in proximity to pivotal areas such as the entrance of Grotta Paglicci and the external rock shelter (Figure 2). The selected natural slopes were also utilized in the SMR method calculations.
4.5.2. Numerical Modeling
The geotechnical modeling of Grotta Paglicci was carried out utilizing RS2TM software (Version 11.019) [73], in addition to the results of the kinematic stability analysis, in order to compute the rock mass principal stresses, probable displacements, strength factors, and strains. In this case study, the rock mass can be considered as a slightly jointed rock mass, with three main joint systems plus the bedding. Generally, in the past, it was always preferable to utilize discrete element methods for these discontinuous rock masses’ media, but recently, it has proved effective to utilize FEM numerical modeling as an equivalent method [67].
The co-registration between the external and internal 3D point clouds of the cave allowed the evaluation of the morphological characteristics needed for the selection of the cross-sections applied in the numerical modeling. The cross-sections were created with CloudCompare freeware software, using the 3D point cloud. After the production of the relative photoplanes, cross-sections were digitized in CAD environment and, subsequently, imported into RS2™ software (Version 11.019) [73] in DXF format. The geometric features, derived from the topographic and geological data, were processed along the AA’, BB’, and CC’ cross-sections, the traces of which are shown in red in Figure 7. Their orientation is not related to the slopes considered in the SMR calculations and kinematic stability analysis but was chosen to analyze the stability conditions along pivotal directions inside the cave.
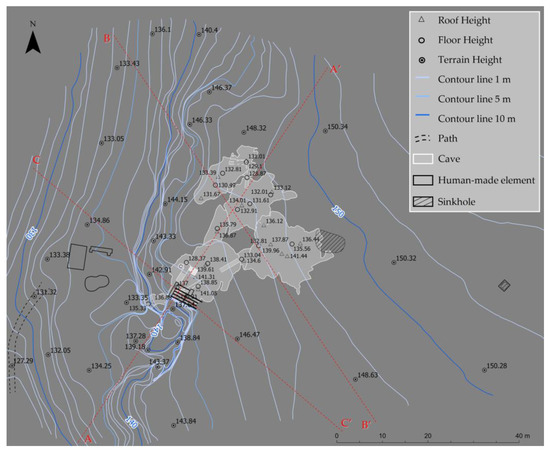
Figure 7.
New topographic map of the study area from the processing of photogrammetric and SLAM-based LiDAR mapping techniques. Red letters and dotted lines represent the cross-sections used in the 2D numerical modeling.
The 2D modeling process involved several stages: firstly, a control point grid was created, based on the acquired topographic data. This control point grid was then used to create a surface mesh representing the cave’s general shape. The mesh was subsequently subdivided into smaller elements in order to increase the accuracy in correspondence with the areas of greatest interest. Once the mesh was created, the appropriate geotechnical parameters, including the strength of the rock material, the internal friction angle, and the material cohesion, were applied to represent the geological features of the cave. Assigning geotechnical properties to a 2D numerical model is necessary to accurately determine how the material deforms, how it resists shear stresses, and how it interacts with water and other materials, reflecting real-world conditions as closely as possible. Furthermore, it is crucial for obtaining reliable predictions of slope stability, deformation, and failure mechanisms.
All the parameters that were assigned to the model material are summarized in Table 1. The values related to unit weight (MN/m3), Poisson’s ratio, and tensile strength were obtained by consulting previous local technical documentation involving the same lithology [74,75]. Meanwhile, the values for cohesion (c), friction angle (φ), and Young’s modulus (E) were derived from theoretical calculations proposed by the authors of [63]. The remaining data concerning material behavior, porosity value, and static water mode were chosen based on conditions observed during the engineering–geological survey. It must be mentioned that the models are entirely included within the limestones of the “Monte Calvo del Gargano” member. Throughout the numerical simulations, the RS2TM software (Version 11.019) [73] calculated the behavior of the slope under different conditions, such as structural loading, ground movements, and simply the self-weight of the materials. Since there were no direct measurements of in situ stress conditions, the analysis was carried out considering only the intrinsic characteristics of the material and the discontinuities involved, thus relying exclusively on the material’s self-weight (i.e., body force only, as shown in Table 1).

Table 1.
Engineering–geological characteristics of the modeled rock material.
Figure 8, Figure 9 and Figure 10 show the geotechnical models created with RS2™ software (Version 11.019) [73] using the geometric information derived from the AA’, BB’, and CC’ sections, respectively.
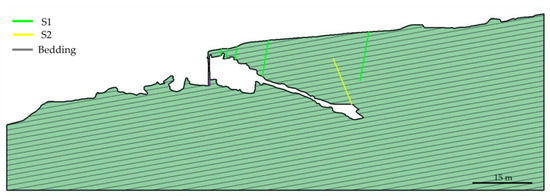
Figure 8.
Geotechnical AA’ cross-section; the green and yellow lines represent the main identified joints, while the gray lines indicate the limestone bedding.
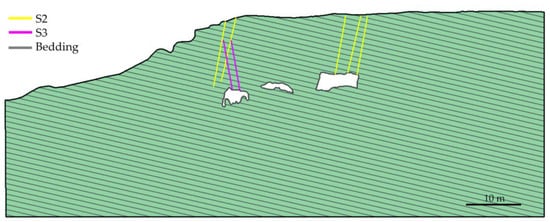
Figure 9.
Geotechnical BB’ cross-section; the yellow and magenta lines represent the main identified joints, while the gray lines indicate the limestone bedding.

Figure 10.
Geotechnical CC’ cross-section; the yellow and magenta lines represent the main identified joints, while the gray lines indicate the limestone bedding.
The created models include the main discontinuities and their orientation, spacing, and persistence, as computed by combining data from the traditional field survey with the interpretation of geomatic data. The latter is derived from both UAS photogrammetry and SLAM-based laser scanning and refers to both external areas and internal cave chambers. The Barton–Bandis failure criterion [76], which has been widely utilized and extensively studied and validated for various rock types and geological conditions, was chosen for the present slope stability analysis. The selected failure criterion permits the characterization of the discontinuities’ shear strength, based on parameters such as the JRC, which is directly derived from the engineering–geological survey. In addition, the joint wall compressive strength (JCS), the residual friction angle, and the normal and shear stiffnesses were, respectively, derived using empirical formulas from [77,78,79].
The required engineering–geological characteristics assigned to the discontinuities are summarized in Table 2.

Table 2.
Engineering–geological characteristics of the discontinuity systems.
The FEM analysis for the models created along the three cross-sections was performed according to a certain number of iterations and a maximum tolerance value up to convergence.
5. Results
5.1. SLAM-Based Point Cloud Coregistration and Georeferencing
Figure 11 shows the nadiral view of the georeferenced 3D point cloud obtained from the coregistration of the three SLAM-based LiDAR surveys. The orange dots (EMn in Figure 11) represent the location of the 4 GCPs (the circular-shaped optical target in Figure 3E) used to georeference the entire survey in the ETRF2000/UTM33N absolute system. The georeferencing accuracy was estimated at about 6 cm.
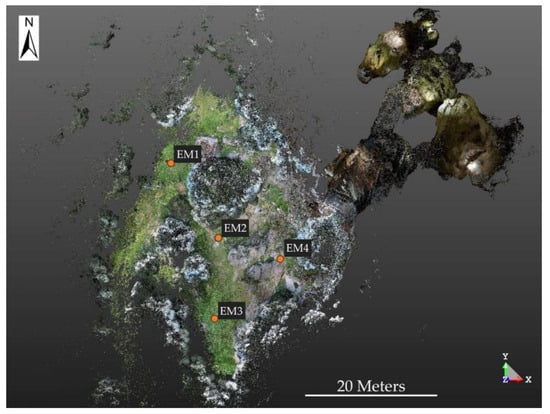
Figure 11.
Nadiral view of the georeferenced 3D point cloud obtained from the entire SLAM-based LiDAR survey. The orange dots (EMn) represent the location of the GCPs used for point cloud georeferencing.
5.2. UAS Photogrammetric Data Processing
Structure-from-motion and multi-view stereo algorithms allowed the alignment of the images through the identification of 1.99 million recognizable tie points. The root mean square error (RMSE) obtained in the process of exterior orientation was about 2.9 cm for GCPs and 1.9 cm for CPs. The final 3D dense point cloud comprises 170 million points that were interpolated to generate a continuous model in raster format (i.e., a digital dense elevation model—DDEM) with a spatial resolution of 1.8 cm/pixel. Based on the DDEM, the images were ortho-corrected and mosaiced (in both the frontal and nadiral views) at a ground sampling distance (GSD) of 1 cm/pixel (Figure 12).
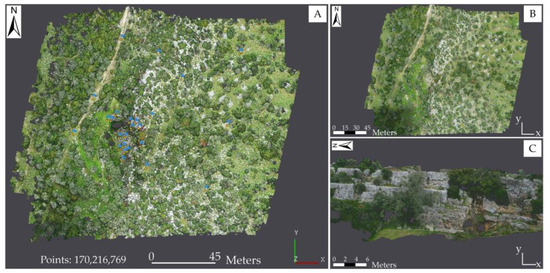
Figure 12.
Nadiral view of the georeferenced 3D dense point cloud (A); the blue flags represent the location of GCPs used for the images’ exterior orientation. Nadiral orthophotomosaic (B); detail of the frontal orthophotomosaic (C).
5.3. Engineering–Geological Data
The study is characterized by the presence of various discontinuities with highly variable orientations. The information from traditional engineering–geological surveys, integrated with that from geomatic data photointerpretation, permitted the characterization of the rock mass thanks to the abundance of deterministically measured discontinuities (i.e., 364) uniformly distributed across the entire study area, even at different elevations from the ground. The high number of measured data has enabled the identification of the primary discontinuity systems, as shown by the stereographic representation in Figure 13.
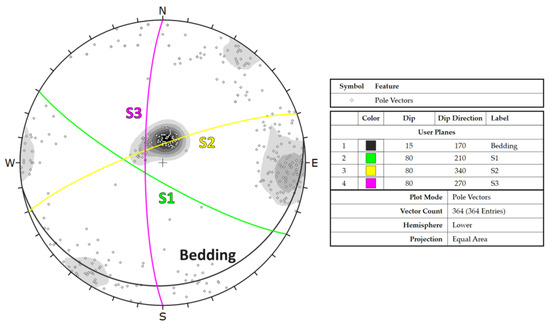
Figure 13.
Stereogram of the discontinuities measured during the in situ engineering–geological survey and by the photointerpretation of geomatic data within CloudCompare software (Version 2) [62]. Data are shown in terms of dip and dip direction, with a right-hand rule, using the Schmidt equal-area method (lower hemisphere). Gray shades represent different density concentrations.
Figure 14 displays the map of the main joints, categorized by systems, as interpreted from the geomatic data (i.e., 3D dense point cloud, DDEM, and orthophotomosaics).
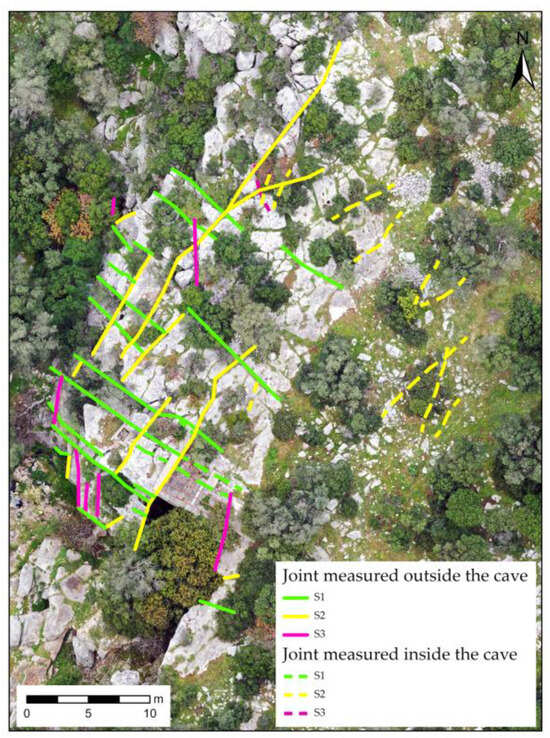
Figure 14.
Map of the joints as interpreted from the geomatic data.
Table 3 lists the engineering–geological parameters, organized according to the various discontinuity systems.

Table 3.
Engineering–geological parameters of the identified discontinuity systems.
5.4. Rock Mass Classification
5.4.1. Rock Mass Rating Method
Following the method proposed by [63] and explained in Section 4.4, a value of the basic rock mass rating (RMRb) equal to 67 was calculated for the rock mass under study. This value indicates good quality (i.e., “Class II”). An indicative estimate of the shear strength parameters was provided by the formulas reported in [63], which include the rock mass friction angle (φ), cohesion (c), and Young’s modulus (E). The calculated values for this case study are presented in Table 4.

Table 4.
Shear strength parameters and the deformation modulus (E), calculated according to [63].
5.4.2. Q-Slope Method
The empirical assessment of the rock mass conditions was also conducted by calculating the Q-slope value, as proposed by [64] and explained in Section 4.4, which resulted in a value equal to 0.81. Considering an average dip of 80° for the external slope, when applying the graph shown in Figure 15, the slope results in unstable conditions and is, therefore, prone to possible failure. Moreover, Table 5 presents the results obtained from the application of the empirical formulas, as proposed by [64], to estimate the required slope dip angle of the outside topography in the absence of stabilization measures, accepting a certain probability of failure (PoF) equal to 1%, 15%, 30%, and 50%, respectively.
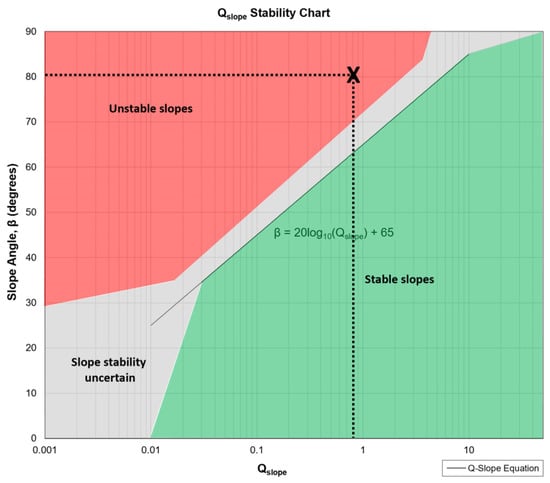
Figure 15.
Stability chart of the Q-slope method (modified from [64]); the black cross indicates the critical stability conditions for an average slope angle of 80°.

Table 5.
Slope dip angle values needed to accept a PoF of 1%, 15%, 30%, and 50%, respectively.
5.4.3. Slope Mass Rating Method
The application of the slope mass rating method proposed by [65] has allowed the additional characterization of the rock mass by considering the geometric relationships between the observed discontinuities and the natural slopes. The analysis of the rock mass quality was verified by considering planar, toppling, and wedge failure phenomena. In Table 6, the average orientations of the discontinuity systems (Sn), plus the selected natural slopes (Vn), which are shown in Figure 16A, are reported.

Table 6.
Average values of the dip direction and dip of discontinuity systems and slopes used to verify the possible criticalities.
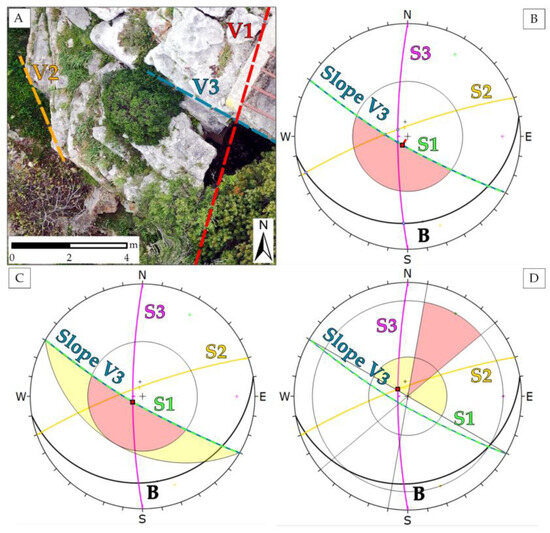
Figure 16.
Nadiral orthophotomosaic showing the orientations of the three slopes, V1, V2, and V3, in Table 6, considered for the application of the SMR method (A). Examples of the kinematic stability analysis executed on slope V3 through a stereographic projection (Wulff equal-angle method—lower hemisphere): planar sliding (B), wedge sliding (C), and direct and oblique toppling (D). S1, S2 and S3 indicate the different discontinuity systems as shown in Table 6.
Table 7 shows the SMR results for the three analyzed slopes. The minimum SMR value for planar failure is 57, which corresponds to a “Class III” rock mass of normal quality, which is partially stable, showing sliding along planes or wedges and requiring systematic interventions. The minimum SMR value for toppling is 82 which corresponds to a “Class I” rock mass of very good quality, completely stable, with no instability phenomena, and with no need for stabilization interventions. The SMR values, when analyzing the wedge failure, are generally “good” (Class II) and, in one case, “very good” (Class I), indicating overall stability and no need for stabilization interventions. However, in the case of the intersection between joint systems S1 and S2 (on slope V1), as well as between S1 and S3 (on slopes V1 and V2), the SMR values show a sudden decrease to 22 and 32, respectively. These SMR values correspond to a “Class IV” rock mass of poor quality with instability phenomena along the wedges, which requires extensive remedial measurements.

Table 7.
Results of the SMR method application with reference to the three analyzed slopes, V1, V2, and V3, as shown in Table 6.
5.5. Rock Slope Stability Analysis
5.5.1. Statistical Kinematic Stability Analysis
The statistical kinematic stability analysis was based on the discontinuity systems and slopes presented in Table 6 and Figure 16A. The value of the friction angle was set to 38° accordingly, with the results shown in Table 4 and confirmed by the available literature for the study area [74]. In Table 8, which summarizes the results obtained from the statistical kinematic stability analysis, wedge sliding and toppling (both direct and oblique) come out as the predominant possible failure mechanisms. Planar sliding only occurs in the case of slope V3, and it is related to the discontinuity system S1, which acts as the sliding surface. A flexural toppling phenomenon has not been observed, although it is usually considered to be fairly probable with this kind of geological setting. Figure 16B–D shows examples of the kinematic stability analysis executed on slope V3 through stereographic projections for planar sliding, wedge sliding, and direct and oblique toppling, respectively.

Table 8.
Results from the statistical kinematic stability analysis executed along slopes V1, V2, and V3, as shown in Table 6.
5.5.2. Numerical Modeling
The cross-sections obtained by processing the topographic and geological data, enriched by assigning geotechnical properties to the rock material and discontinuities (i.e., joints and bedding), allowed the creation of geotechnical models that provided a detailed virtual representation of the Grotta Paglicci site. The obtained results allowed for an evaluation of rock mass behavior, providing insights about the localization of stresses along the considered cross-sections. The trend of the field differential stress σ1–σ3 around the cave is shown in Figure 17, Figure 18 and Figure 19. This value is crucial to understanding the behavior and the structural response of a geotechnical model since it allows us to calculate both the shear and tensile stresses in the presence of jointed rocks and cavities.
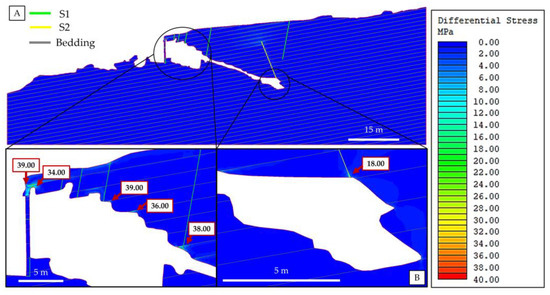
Figure 17.
Differential stresses resulting from the geotechnical modeling along the AA’ cross-section (A). Details of the obtained differential stress values (B).
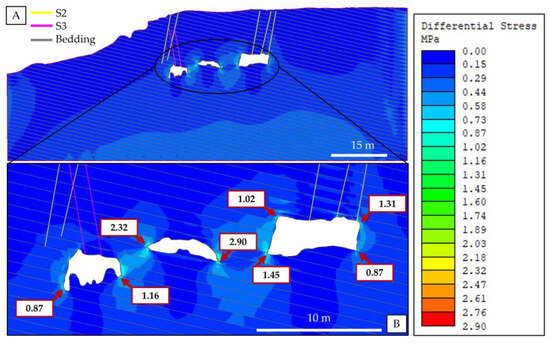
Figure 18.
Differential stresses resulting from the geotechnical modeling along the BB’ cross-section (A). Detail of the obtained differential stress values (B).
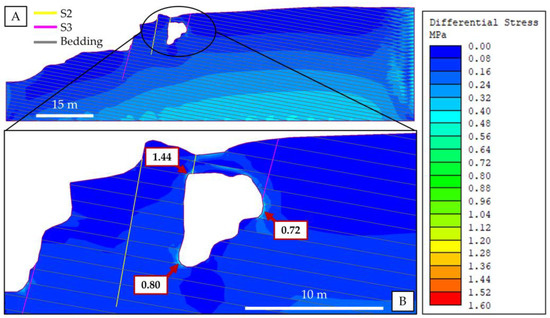
Figure 19.
Differential stresses resulting from the geotechnical modeling along the CC’ cross-section (A). Detail of the obtained differential stress values (B).
Regarding the AA’ cross-section (Figure 17), the highest values of differential stress reach up to 39 MPa and are primarily localized at the intersection between the bedding, joints, and cave surface. Specifically, the range of maximum values varies from approximately 18 to 39 MPa.
Values of differential stresses along the BB’ cross-section (Figure 18) result much lower than those shown in Figure 17, with maximum values of 1.31 MPa in areas where the S2 joint system intersects the cave surface. In this case, the differential stress ranges from a minimum of 0.87 to a maximum of 2.90 MPa at the edges of the cave chambers.
Similar values can be observed along cross-section CC’ (Figure 19), where the recorded maximum values of differential stress range from a minimum of 0.72 MPa to a maximum of 1.44 MPa.
In Figure 20, the total displacement values, indicated by the red colors, stand at approximately 5 cm and are located in the roof connecting the Atrium and Chamber 1, where the S1 discontinuity intersects with the limestone bedding, creating potentially unstable geometries. This critical condition was not encountered along cross-sections BB’ and CC’, which present values of lower than one millimeter; Figure 21, as an example, shows the displacements along cross-section CC’.
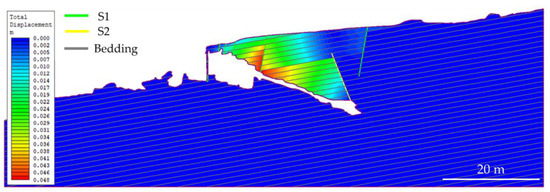
Figure 20.
Displacement values resulting from geotechnical modeling along cross-section AA’.

Figure 21.
Displacement values resulting from geotechnical modeling along cross-section CC’.
6. Discussion
The integration of several geomatic techniques, together with data from a traditional engineering–geological survey, allowed the production of a large number of results, which are pivotal for the site’s geological characterization and the identification of critically hazardous conditions in relation to slope stability. Furthermore, the combined use of UAS photogrammetry and SLAM-based laser scanning proved to be efficient in terms of data accuracy and completeness. In previous papers, as reported in [12,13,14,15,16,17,18,19,20,80], the use of ground-based LiDAR has proven to be very reliable but also, simultaneously, time-consuming in terms of data acquisition and processing. With the advent of SLAM technology, which can be used manually or integrated into UASs or ground robots, laser scanning has undergone further improvements in terms of the number of acquired points, acquisition time, and completeness [26,27,28,29,30].
In the present case study, the use of UASs and ground robotic equipment could not be used within the cave, due to its complexity (tortuous and narrow connections between the various chambers and the presence of speleothems). Conversely, the use of portable SLAM-based LiDAR permitted us to map the four chambers of Grotta Paglicci with an optimal level of resolution with spatial accuracy—thanks also to a thorough topographic survey—and in a relatively short acquisition time (less than one hour).
The RMSEs obtained from the adopted methodologies demonstrate the success of the alignment and georeferencing of the 3D dense point clouds created by UAS photogrammetry and laser scanning. The possibility of having a merged global model has provided an optimal tool, not only to map the visible joints, both internal and external, but also to verify their correspondence in terms of persistence. This aspect should be considered as one of the main features of this case study from a stability analysis and stress computation perspective. Indeed, thanks to the moderate thickness of the cave vault, it was possible to model the effective length of discontinuities, leading to a reliable numerical analysis.
The engineering–geological characterization indicates a rock mass of good quality, but critical issues can occur when the slope dips exceed 60°. These slopes, combined with unfavorable discontinuity attitudes, can lead to possible block and wedge failures and overall stability issues on various slope orientations. These results aligned with field observations, where residual sliding planes and various blocks from past gravitational events were identified at the bottom of the rocky walls. Since the presented methods of rock mass classification are empirical, they were also supported by statistical kinematic stability analysis, executed along three natural rock slopes of average dips. The results of such stability analyses indicate wedge sliding and direct and oblique toppling as the predominant mechanisms, while planar sliding is only possible along slope V3, which appears to be the most strongly affected by critical phenomena. The interactions among the dip direction of this slope, the S1 discontinuity system, and bedding facilitate several possible failing mechanisms. In the case of wedge sliding, S1–S2 and S1–S3 are the most common joint intersections creating instabilities, although there is not a predominant combination in the case of direct and oblique toppling. The outcome of the present analysis shows how all the slopes contouring the external area of Grotta Paglicci are prone to kinematic instabilities; therefore, deeper dynamic slope stability studies are in progress to define the most vulnerable walls and to plan further actions of reinforcement and support.
Numerical modeling allowed for a detailed study of the cave’s stability and its underground structures. A fundamental aspect addressed through numerical modeling is the assessment of solutions to prevent potential cave-ins or damage to the rock formations inside the cave. Similar research in underground environments [22,81] has proved that the utilization of 2D numerical modeling is a highly effective tool for assessing structural stability and proposing adequate conservation strategies.
Numerical analysis has allowed for the identification of areas where critical issues or failures may occur and could lead to episodes of instability. To critically assess the obtained differential stress values, the method described in [82] can be used; it allows the calculation of the threshold value of the differential stress responsible for the creation of new failures in a slightly fractured rock mass.
The rock mass of Grotta Paglicci can be considered slightly fractured, as confirmed by its rating value (an RMRb equal to 67, Class II, and good quality) and the scarce number of joints intersecting the modeled cross-sections. Moreover, since the uniaxial compressive strength of the limestone belonging to the “Monte Calvo del Gargano member” has an average value of 37 MPa [75], the rock mass may exhibit criticalities in areas where the differential stress exceeds a value of 12.12 MPa according to Equation (1), as proposed by [83,84]:
The differential stresses shown in Figure 18 and Figure 19 indicate very low values (i.e., lower than 3 MPa), while Figure 17 indicates that the highest values reach up to 39 MPa in the Atrium. Referring to the information provided in [85], if the differential stress is less than four times the tensile strength of the rock, extensional failure may occur. Conversely, if the differential stress is more than four times the tensile strength of the rock, shear failure may occur. The characteristic tensile strength of calcareous rocks, as deduced from various laboratory tests conducted on intact rock specimens, generally falls within the range of 1–10 MPa, with values typically ranging around 5 ± 2 MPa [77,86,87,88,89,90]. According to the information provided in [85], the threshold value to discriminate the different types of failure is equal to 28 MPa. When considering 12.12 MPa as the failure threshold, as presented in Equation (1), it can be concluded that shear failure may occur when σ1 − σ3 > 28 MPa, while extensional failure may occur when σ1 − σ3 < 28 MPa. The results shown in Figure 17 indicate some zones with possible shear failures that, up to now, have not occurred, probably due to the presence of undetermined rock bridges along the joints. Meanwhile, Figure 18 and Figure 19 indicate only the possible extensional failures that have a low probability of occurring, due to their very low differential stress values.
In general, the stress distribution in various chambers shows how the forces are located on their side walls, resulting in low stress values in the roof. This stress distribution can be explained by comparing the geometrical structure of the hypogeal chamber to a dome: this tridimensional geometry discharges the vertical lithostatic weight, similarly to a horseshoe tunnel’s geometry, along the lateral walls [91,92]. Nevertheless, the high stress values shown in Figure 17 are not confirmed in Figure 18 and Figure 19, where the cross-sections have been built approximately orthogonal to the AA’. The high stress values shown in the AA’ cross-section, especially at the entrance of the cave (i.e., 39 MPa in Figure 17), can probably be explained by the fact that the left lateral wall of the Atrium dome has a thickness that is insufficient to distribute the stresses developed by the roof material’s weight. This hypothesis could be confirmed by calibrating the model stresses through the execution of in situ measurements, as described in [82].
The evaluation of displacements along the various sections has provided information about potential criticalities at the transition between the Atrium and Chamber 1. Specifically, after analyzing the results in section AA’, it is evident that possible instability phenomena can develop at the interaction between the S1 joint system, the bedding, and the cave roof (Figure 20). This critical result is confirmed by the kinematic stability analysis, which indicates the possibility of planar sliding at the intersection between the S1 joint system and slope V3. The analyzed situation, indeed, satisfies both the conditions for the occurrence of planar sliding: namely, the daylight of the joint on the slope and the dip exceeding the friction angle [68]. Thanks to this type of analysis and depending on the type of failure that may develop, it was possible to identify those zones where it will be necessary to install safety measures to avoid risks for the personnel present on site for various activities (e.g., archaeological, anthropological, and geological investigations, and maintenance).
A specific project regarding these safety measures has already been proposed to the dedicated agencies, following the technical recommendations suggested by our findings. In particular, the cross-sections deriving from the topographic data and 3D models were utilized to measure the vertical wall thickness, in order to evaluate the maximum depth for the threaded rod that should be installed on the external multi-step slope. The engineering–geological data and the resulting kinematic stability analysis led to the definition of areas prone to hazardous instabilities in which the only solution is scaling the rock mass. In addition, an in situ monitoring system will be installed, powered by a solar panel, which will comprise electrical crackmeters and inclinometers with live remote alert systems.
7. Conclusions
In the ever-evolving field of geospatial data acquisition and 3D modeling, to meet the growing demand for accuracy, speed, and versatility in mapping and surveying, experts are increasingly turning to a multi-technique survey approach. This cutting-edge strategy, as used in this work, leverages the synergies of two powerful technologies: UAS photogrammetry and SLAM-based LiDAR mapping. Each of these techniques offers unique strengths and capabilities, and, when combined, they create a comprehensive tool that can tackle a wide range of surveying and mapping challenges. This holistic approach enables specialists to streamline workflows, enabling, simultaneously, a high level of data accuracy, detail, and reduced fieldwork time and costs.
The comprehensive geomatic multi-technique approach conducted at Grotta Paglicci has significantly advanced our understanding of the complex morphology of the area and it has provided essential data for a thorough engineering–geological site characterization. By leveraging the adopted methodologies, this study achieved a detailed site characterization, unveiling crucial insights into slope stability and potential geological hazards in a challenging cave environment, and overcame the limitations posed by narrow passageways and the presence of speleothems. Merging the external and internal 3D point clouds enabled a holistic view of the cave system, offering a unique perspective on its geological and engineering–geological characteristics and joint persistence.
This study’s significance lies in its blend of innovation and traditional methods, marrying advanced technology with empirical insights. The resulting comprehensive slope stability analysis not only elucidates the cave’s current state but also lays the foundation for future conservation endeavors.
By integrating state-of-the-art tools, this research enriches our understanding of Grotta Paglicci’s geological complexities. It establishes a robust framework for heritage preservation that can be replicated in other similar caves or natural shelters.
Additionally, the present multi-technique approach can be used for both static and multitemporal surveys and can also be applied in large artificial underground caves, while achieving an optimal balance between the required survey precision and accuracy, the volume of data to be processed over large areas, and the effectiveness of stress and displacement monitoring.
In conclusion, the presented study exemplifies the power of technological integration, demonstrating the synergy between the traditional approach and contemporary advancements. As we navigate the delicate balance between preservation and exploration, this research can be used to bring to the fore sustainable conservation practices in the realm of archaeological and natural heritage.
Author Contributions
R.S. is the project coordinator of geological activities for the University of Siena; F.B. supervised the activity on behalf of the Research Unit of Prehistory and Anthropology (University of Siena); A.R. (Annamaria Ronchitelli), F.B., S.R., and R.S. organized and coordinated the project activities with the owners of the Masseria Paglicci, the Superintendence of Archaeology, Fine Arts, and Landscape (Provinces of Barletta-Andria-Trani and Foggia), and the “Studio Cotecchia & Associati”; R.S., M.I., and D.S. carried out the UAV surveys; R.S., M.I., and D.S. carried out topographic surveys through GNSS and TS; R.S., M.I., A.R. (Andrea Rindinella), D.S., and A.E. performed the topographic data processing; R.S., L.B., and V.D.L. carried out the engineering–geology surveys; R.S., L.B., V.D.L., and A.E. performed statistical kinematic stability analysis; R.S., L.B., V.D.L., and A.E. performed the 2D numerical modeling. All authors have read and agreed to the published version of the manuscript.
Funding
A.E. contributed to this publication while attending the Ph.D. program Ph.D. in Space Science and Technology at the University of Trento, Cycle XXXIX, with the support of a scholarship financed by the Ministerial Decree no. 118 of 2nd March 2023, based on the NRRP—funded by the European Union—NextGenerationEU—Mission 4 “Education and Research”, Component 1 “Enhancement of the offer of educational services: from nurseries to universities”—Investment 4.1 “Extension of the number of research doctorates and innovative doctorates for public administration and cultural heritage”—CUP E66E23000110001.
Data Availability Statement
The data that support the findings of this study are available from the corresponding author upon reasonable request.
Acknowledgments
We would like to thank the owners of the Masseria Paglicci, who, in collaboration with the Superintendence of Archaeology, Fine Arts, and Landscape (Provinces of Barletta-Andria-Trani and Foggia) and the “Studio Cotecchia & Associati” are working to make this paleoanthropological site accessible for future research. We also want to acknowledge Spektra s.r.l., in the persons of Agrati D. and Lapini M., for helping us with the SLAM-based LiDAR acquisition.
Conflicts of Interest
The authors declare no conflicts of interest.
References
- González-Aguilera, D.; Fernández, L.; Lahoz, J.G.; Herrero, J.S.; Corchón, M.S.; Garcia, E. Recording and modeling paleolithic caves through laser scanning. In Proceedings of the IEEE International Conference on Advanced Geographic Information Systems & Web Services, Cancun, Mexico, 1–7 February 2009; pp. 19–26. [Google Scholar] [CrossRef]
- Buchroithner, M.F.; Gaisecker, T. Terrestrial laser scanning for the visualization of a complex dome in an extreme alpine cave system. Photogramm. Fernerkund. Geoinf. 2009, 4, 329–339. [Google Scholar] [CrossRef] [PubMed]
- Rüther, H.; Chazan, M.; Schroeder, R.; Neeser, R.; Held, C.; Walker, S.J.; Matmon, A.; Horwitz, L.K. Laser scanning for conservation and research of African cultural heritage sites: The case study of Wonderwerk Cave, South Africa. J. Archaeol. Sci. 2009, 36, 1847–1856. [Google Scholar] [CrossRef]
- Lerma, J.L.; Navarro, S.; Cabrelles, M.; Villaverde, V. Terrestrial laser scanning and close range photogrammetry for 3d archaeological documentation: The Upper Palaeolithic Cave of Parpalló as a case study. J. Archaeol. Sci. 2010, 37, 499–507. [Google Scholar] [CrossRef]
- Grussenmeyer, P.; Albane, B.; Moisan, E.; Guillemin, S.; Carozza, L.; Bourrillon, R.; Petrognani, S. 3D multi-scale scanning of the archaeological cave “Les Fraux” in Dordogne (France). In Lecture Notes in Computer Science, Proceedings of 4th International Conference EuroMed—Progress in Cultural Heritage Preservation, Lemessos, Cyprus, 29 October–3 November 2012; Ioannides, M., Fritsch, D., Leissner, J., Davies, R., Remondino, F., Caffo, R., Eds.; Springer: Berlin/Heidelberg, Germany, 2012; Volume 7616, pp. 388–395. [Google Scholar] [CrossRef]
- Cosso, T.; Ferrando, I.; Orlando, A. Surveying and mapping a cave using 3D laser scanner: The open challenge with free and open source software. ISPRS Int. Arch. Photogramm. Remote Sens. Spat. Inf. Sci. 2014, XL-5, 181–186. [Google Scholar] [CrossRef][Green Version]
- Zlot, R.; Bosse, M. Three-dimensional mobile mapping of caves. J. Cave Karst Stud. 2014, 76, 191–206. [Google Scholar] [CrossRef]
- Gallay, M.; Kaňuk, J.; Hochmuth, Z.; Meneely, J.; Hofierka, J.; Sedlák, V. Large-scale and high-resolution 3D cave mapping by terrestrial laser scanning: A case study of the Domica Cave, Slovakia. Int. J. Speleol. 2015, 44, 277–291. [Google Scholar] [CrossRef]
- Basantes, J.; Godoy, L.; Carvajal, T.; Castro, R.; Toulkeridis, T.; Fuertes, W.; Aguilar, W.; Tierra, A.; Padilla, O.; Mato, F.; et al. Capture and processing of geospatial data with laser scanner system for 3D modeling and virtual reality of Amazonian Caves. In Proceedings of the 2017 IEEE Second Ecuador Technical Chapters Meeting (ETCM), Salinas, Ecuador, 16–20 October 2017; pp. 1–5. [Google Scholar] [CrossRef]
- Shults, R.; Bilous, M.; Kovtun, V. Monitoring and preservation of the Kyiv Pechersk Lavra Caves. ISPRS Int. Arch. Photogramm. Remote Sens. Spat. Inf. Sci. 2019, XLII-2/W11, 1053–1058. [Google Scholar] [CrossRef]
- Nocerino, E.; Menna, F.; Farella, E.M.; Remondino, F. 3D virtualization of an underground semi-submerged cave system. ISPRS Int. Arch. Photogramm. Remote Sens. Spat. Inf. Sci. 2019, XLII-2/W15, 857–864. [Google Scholar] [CrossRef][Green Version]
- Büyüksalih, G.; Kan, T.; Özkan, G.E.; Meriç, M.; Isın, L.; Kersten, T.P. Preserving the knowledge of the past through virtual visits: From 3D laser scanning to virtual reality visualisation at the Istanbul Çatalca İnceğiz Caves. PFG–J. Photogramm. Remote Sens. Geoinf. Sci. 2020, 88, 133–146. [Google Scholar] [CrossRef]
- Canavese, E.P.; Forti, P.; Naseddu, A.; Ottelli, L.; Tedeschi, R. Laser scanning technology for the hypogean survey: The case of Santa Barbara karst system (Sardinia, Italy). Acta Carsologica 2011, 40, 65–77. [Google Scholar] [CrossRef]
- Hajri, S.; Sadier, B.; Jaillet, S.; Ployon, E.; Boche, E.; Chakroun, A.; Saulnier, G.-M.; Delannoy, J.-J. Analyse spatiale et morphologique d’une forêt de stalagmites par modélisation 3D dans le Réseau d’Orgnac (Ardèche, France). Karstologia Rev. Karstol. Spéléologie Phys. 2009, 53, 1–14. [Google Scholar] [CrossRef]
- Jaillet, S.; Sadier, B.; Souhail, H.; Ployon, E.; Delannoy, J. Une analyse 3D de l’endokarst: Applications lasergrammétriques sur l’Aven d’Orgnac (Ardèche, France). Geomorphol. Relief Process. Environ. 2011, 17, 379–394. [Google Scholar] [CrossRef]
- Roncat, A.; Dublyansky, Y.; Spötl, C.; Dorninger, P. Full-3D surveying of caves: A case study of Märchenhöhle (Austria). In Proceedings of the IAMG Conference 2011, Salzburg, Austria, 5–9 September 2011; Available online: https://publik.tuwien.ac.at/files/PubDat_199966.pdf (accessed on 26 October 2023).
- García Puchol, O.; McClure, S.B.; Blasco Senabre, J.; Cotino Villa, F.; Porcelli, V. Increasing contextual information by merging existing archaeological data with state of the art laser scanning in the prehistoric funerary deposit of Pastora Cave, Eastern Spain. J. Archaeol. Sci. 2013, 40, 1593–1601. [Google Scholar] [CrossRef]
- Hoblea, F.; Delannoy, J.-J.; Jaillet, S.; Ployon, E.; Sadier, B. Digital tools for managing and promoting Karst geosites in Southeast France. Geoheritage 2014, 6, 113–127. [Google Scholar] [CrossRef]
- Silvestre, I.; Rodrigues, J.; Figueiredo, M.; Veiga-Pires, C. High-resolution digital 3D models of Algar Do Penico Chamber: Limitations, challenges, and potential. Int. J. Speleol. 2015, 44, 25–35. [Google Scholar] [CrossRef]
- Fabbri, S.; Sauro, F.; Santagata, T.; Rossi, G.; De Waele, J. High-resolution 3-D mapping using terrestrial laser scanning as a tool for geomorphological and speleogenetical studies in caves: An Example from the Lessini Mountains (North Italy). Geomorphology 2017, 280, 16–29. [Google Scholar] [CrossRef]
- Garavelli, A.; Andriani, G.F.; Fioretti, G.; Iurilli, V.; Marsico, A.; Pinto, D. The “Sant’Angelo in Criptis” Cave Church in Santeramo in Colle (Apulia, South Italy): A Multidisciplinary Study for the Evaluation of Conservation State and Stability Assessment. Geosciences 2021, 11, 382. [Google Scholar] [CrossRef]
- Rodríguez, G.; Mulas, M.; Loaiza, S.; Del Pilar Villalta Echeverria, M.; Yanez Vinueza, A.A.; Larreta, E.; Jordá Bordehore, L. Stability Analysis of the Volcanic Cave El Mirador (Galápagos Islands, Ecuador) Combining Numerical, Empirical and Remote Techniques. Remote Sens. 2023, 15, 732. [Google Scholar] [CrossRef]
- Cardia, S.; Palma, B.; Langella, F.; Pagano, M.; Parise, M. Alternative Methods for Semi-Automatic Clusterization and Extraction of Discontinuity Sets from 3D Point Clouds. Earth Sci. Inf. 2023, 16, 2895–2914. [Google Scholar] [CrossRef]
- Benrabah, A.; Senent Domínguez, S.; Jorda Bordehore, L.; Alvares Alonzo, D.; Diez Herrero, A.; de Andrés Herrero, M. Preliminary Assessment of Badajo Cave (Segovia, Spain) Stability Using Empirical, Numerical and Remote Techniques. In IOP Conference Series: Earth and Environmental Science, Proceedings of the XXIII Conference of PhD Students and Young Scientists “Interdisciplinary Topics in Mining, Geology and Geomatics”, Wrocław, Poland, 13–15 June 2023; IOP Publishing Ltd.: Bristol, UK, 2024; Volume 1295, p. 012011. [Google Scholar] [CrossRef]
- Cardia, S.; Langella, F.; Pagano, M.; Palma, B.; Sabato, L.; Tropeano, M.; Parise, M. 3D Digital Analysis for Geo-Structural Monitoring and Virtual Documentation of the Saint Michael Cave in Minervino Murge, Bari (Italy). Digit. Appl. Archaeol. Cult. Herit. 2024, 32, e00308. [Google Scholar] [CrossRef]
- La Scalea, R.; Rodrigues, M.; Osorio, D.P.; Lima, C.M.; Souza, R.D.; Alves, H.; Branco, K.C. Opportunities for autonomous UAV in harsh environments. In Proceedings of the 16th International Symposium on Wireless Communication Systems (ISWCS), Oulu, Finland, 27–30 August 2019; pp. 227–232. [Google Scholar] [CrossRef]
- Petracek, P.; Kratky, V.; Petrlik, M.; Baca, T.; Kratochvil, R.; Saska, M. Large-Scale Exploration of Cave Environments by Unmanned Aerial Vehicles. IEEE Robot. Autom. Lett. 2021, 6, 7596–7603. [Google Scholar] [CrossRef]
- Blank, J.G.; Morrell, B.; Bouman, A.; Touma, T.; Ginting, M.F.; Patterson, C.; Aghamohammadi, A. BRAILLE-CoSTAR Teams Autonomous Mapping and Characterization of Terrestrial Lava Caves Using Quadruped Robots: Preparing for a Mission to a Planetary Cave. In Workshop on Terrestrial Analogs for Planetary Exploration, Proceedings of the USGS Astrogeology Science Center, Virtual, 16–18 June 2021; USRA: LPI Contributions; p. 8122. Available online: https://www.hou.usra.edu/meetings/terrestrialanalogs2021/pdf/8122.pdf (accessed on 26 October 2023).
- Giordan, D.; Godone, D.; Baldo, M.; Piras, M.; Grasso, N.; Raffaella, Z. Survey solutions for 3D acquisition and representation of artificial and natural caves. Appl. Sci. 2021, 11, 6482. [Google Scholar] [CrossRef]
- Grasso, N.; Dabove, P.; Piras, M. The use of SLAM and UAV technology in geological field for monitoring: The case study of the Bossea cave. ISPRS Int. Arch. Photogramm. Remote Sens. Spat. Inf. Sci. 2023, XLVIII-2/W3-2023, 73–79. [Google Scholar] [CrossRef]
- Moretti, M.; Pieri, P.; Ricchetti, G.; Spalluto, L.; Festa, V.; Maggiore, M.; Maiorano, P.; Piccarreta, G.; Ronchitelli, A.; Walsh, N. Note Illustrative della Carta Geologica d’Italia alla Scala 1:50.000 Foglio 396 San Severo; LAC: Firenze, Italy, 2011. (In Italian) [Google Scholar]
- Spalluto, L. La Piattaforma Apula nel Gargano Centro-Occidentale: Organizzazione Stratigrafica ed Assetto Della Successione Mesozoica di Piattaforma Interna. Ph.D. Thesis, Università degli Studi di Bari, Bari, Italy, 2004; p. 173. [Google Scholar]
- Spalluto, L.; Pieri, P.; Ricchetti, G. Inner platform carbonate fades of the Gargano Promontory: Implications for paleoenviroments and correlation with the coeval succession of the Murge area (Southern Italy, Puglia). Boll. Soc. Geol. Ital. 2005, 124, 675–690. (In Italian) [Google Scholar]
- Cotecchia, V.; Magri, G. Idrogeologia del Gargano. Geologia Applicata e Idrogeologia; CNR-ISPRA: Bari, Italy, 1966; Volume 1, pp. 1–86. (In Italian) [Google Scholar]
- Cotecchia, V. Le Acque Sotterranee e l’Intrusione Marina in Puglia: Dalla Ricerca all’’Emergenza nella Salvaguardia della Risorsa, (Periodici Tecnici) Memorie Descrittive della CARTA Geologica d’Italia; SGN-ISPRA: Ispra, Italy, 2014; Volume 92, pp. 15–660. ISBN 978-88-9311-003-7. (In Italian) [Google Scholar]
- Palma di Cesnola, A. Il sito. In Paglicci. l’Aurignaziano e il Gravettiano Antico; Palma di Cesnola, A., Ed.; Claudio Grenzi Editore: Foggia, Italy, 2004; pp. 13–14. [Google Scholar]
- Palma di Cesnola, A. La sequenza stratigrafica della Grotta. In Paglicci. l’Aurignaziano e il Gravettiano Antico; Palma di Cesnola, A., Ed.; Claudio Grenzi Editore: Foggia, Italy, 2004; pp. 21–25. [Google Scholar]
- Crezzini, J.; Boscato, P.; Ricci, S.; Ronchitelli, A.; Spagnolo, V.; Boschin, F. A spotted hyaena den in the Middle Palaeolithic of Grotta Paglicci (Gargano promontory, Apulia, Southern Italy). Archaeol. Anthropol. Sci. 2016, 8, 227–240. [Google Scholar] [CrossRef]
- Arrighi, S.; Borgia, V.; D’errico, F.; Ronchitelli, A. I ciottoli decorati di Paglicci: Raffigurazioni e utilizzo. Riv. Sci. Preist. 2008, 58, 39–58. [Google Scholar]
- Arrighi, S.; Borgia, V.; Guasparri, G.; Ricci, S.; Scala, A.; Ronchitelli, A. Grotta Paglicci (Rignano Garganico, Foggia): Analisi sulle materie coloranti. Preist. Alp. 2012, 46, 91–92. [Google Scholar]
- Borgia, V.; Boschin, F.; Ronchitelli, A. Bone and antler working at Grotta Paglicci (Rignano Garganico, Foggia, southern Italy). Quat. Int. 2016, 403, 23–39. [Google Scholar] [CrossRef]
- Dominici, C.; Stani, C.; Rossini, M.; Vaccari, L. SRFTIR microscopy for the study of residues on Palaeolithic stone tools: Looking for a methodological protocol. J. Phys. Conf. Ser. 2022, 2204, 012050. [Google Scholar] [CrossRef]
- Dominici, C.; Stani, C.; Bonanni, V.; Rossini, M.; Božičević Mihalić, I.; Provatas, G.; Fazinić, S.; Boschin, F.; Gianoncelli, A.; Vaccari, L. Combining SR-FTIR, SRLEXRF and PIXE microscopies for residue analysis on Palaeolithic stone artefacts. Eur. Phys. J. Plus 2023, 138, 742. [Google Scholar] [CrossRef]
- Mezzena, F.; Palma di Cesnola, A. Nuove manifestazioni d’arte epigravettiana della Grotta Paglicci nel Gargano. In Atti della XXVIII Riunione Scientifica IIPP: L’Arte in Italia dal Paleolitico all’Età del Bronzo; IIPP: Firenze, Italy, 1992; pp. 272–292. [Google Scholar]
- Mezzena, F.; Palma di Cesnola, A. L’arte mobiliare di Grotta Paglicci: Nuove acquisizioni. Riv. Sci. Preist. 2004, 54, 291–320. [Google Scholar]
- Palma di Cesnola, A. Le Paleolithique Superieur en Italie; Editions Jérôme Millon: Grenoble, France, 2001; p. 482. ISBN 2841370992. [Google Scholar]
- Palma di Cesnola, A. L’Aurignacien et le Gravettien ancien de la grotte Paglicci au Mont Gargano. l’Anthr 2006, 110, 355–370. [Google Scholar] [CrossRef]
- Ricci, S.; Capecchi, G.; Boschin, F.; Arrighi, S.; Ronchitelli, A.; Condemi, S. Toothpick use among Epigravettian humans from grotta Paglicci (Italy). Int. J. Osteoarchaeol. 2016, 26, 281–289. [Google Scholar] [CrossRef]
- Ronchitelli, A.; Mugnaini, S.; Arrighi, S.; Atrei, A.; Capecchi, G.; Giamello, M.; Longo, L.; Marchettini, N.; Viti, C.; Moroni, A. When technology joins symbolic behaviour: The Gravettian burials at grotta Paglicci (Rignano Garganico–Foggia–Southern Italy). Quat. Int. 2015, 359, 423–441. [Google Scholar] [CrossRef]
- Rossini, M.; Falcucci, A.; Dominici, C.; Ronchitelli, A.; Tomasso, A.; Boschin, F. Analytical potential of 2D shape analysis to study Epigravettian lithic assemblages. In Proceedings of the 2022 IMEKO TC-4 International Conference on Metrology for Archaeology and Cultural Heritage MetroArchaeo, Cosenza, Italy, 19–21 October 2022; pp. 52–56. [Google Scholar] [CrossRef]
- Mariotti Lippi, M.; Foggi, B.; Aranguren, B.; Ronchitelli, A.; Revedin, A. Multistep food plant processing at Grotta Paglicci (Southern Italy) around 32,600 cal B.P. Proc. Natl. Acad. Sci. USA 2015, 112, 12075–12080. [Google Scholar] [CrossRef] [PubMed]
- Boschin, F.; Bernardini, F.; Pilli, E.; Vai, S.; Zanolli, C.; Tagliacozzo, A.; Fico, R.; Fedi, M.; Corny, J.; Dreossi, D.; et al. The first evidence for Late Pleistocene dogs in Italy. Sci. Rep. 2020, 10, 13313. [Google Scholar] [CrossRef] [PubMed]
- Boscato, P.; Palma di Cesnola, A. L’industria e la fauna del livello 1A dell’area esterna di Paglicci (Promontorio del Gargano). In Proceedings of the 25° Convegno sulla Preistoria e Storia della Daunia, San Severo, Italy, 3–5 December 2005; Gravina, A., Ed.; pp. 3–15. [Google Scholar]
- Boscato, P.; Palma di Cesnola, A. Nuovi ritrovamenti di Epigravettiano antico “iniziale” a Grotta Paglicci (Rignano Garganico, Foggia) In Studi sul Paleolitico, Mesolitico e Neolitico del Bacino dell’Adriatico in Ricordo di Antonio M. Radmilli; Biagi, P., Ed.; Società per la Preistoria e Protostoria della Regione Friuli-Venezia Giulia: Trieste, Italy, 2000; pp. 45–60. [Google Scholar]
- Boschin, F.; Boscato, P.; Berto, C.; Crezzini, J.; Ronchitelli, A. The palaeoecological meaning of macromammal remains from archaeological sites exemplified by the case study of Grotta Paglicci (Upper Palaeolithic, southern Italy). Quat. Res. 2018, 90, 470–482. [Google Scholar] [CrossRef]
- Zorzi, F. Palaeolithic discoveries in the grotta Paglicci. Antiquity 1964, 38, 38–44. [Google Scholar] [CrossRef]
- Arrighi, S.; Borgia, V.; D’Errico, F.; Ricci, S.; Ronchitelli, A. Manifestazioni d’arte inedite e analisi tecnologica dell’arte mobiliare di Grotta Paglicci (Rignano Garganico e Foggia). Preist. Alp. 2012, 46, 49–58. [Google Scholar]
- Leica Geosystems AG. Leica InfinityTM, Version 3.4.2; Leica Geosystems AG—Part of Hexagon. 2021. Available online: https://leica-geosystems.com/products/gnss-systems/software/leica-infinity (accessed on 29 October 2023).
- SPH Engineering. UgCSTM Professional Desktop Drone Flight Planning Software, Version 4.18; Latvia. 2023. Available online: https://www.sphengineering.com/support (accessed on 29 October 2023).
- Agisoft LLC. Agisoft Metashape ProfessionalTM, Version 2.0.2; Agisoft LLC: St. Petersburg, Russia, 2023. Available online: https://www.agisoft.com/ (accessed on 29 October 2023).
- Trimble Inc. Trimble RealworksTM, Version 12.4; Trimble Inc.: Westminster, CA, USA, 2023. Available online: https://geospatial.trimble.com/en/products/software/office-software (accessed on 29 October 2023).
- CloudCompare, Version 2; 2021. Available online: http://www.cloudcompare.org/ (accessed on 29 October 2023).
- Bieniawski, Z.T. Engineering Rock Mass Classification; John Wiley and Sons: New York, USA, 1989; p. 251. [Google Scholar]
- Bar, N.; Barton, N. The Q-Slope Method for Rock Slope Engineering. Rock Mech. Rock Eng. 2017, 50, 3307–3322. [Google Scholar] [CrossRef]
- Romana, M. New adjustment ratings for application of Bieniawski classification to slopes. In Proceedings of the International Symposium on the Role of Rock Mechanics in Excavations for Mining and Civil Works. International Society of Rock Mechanics, Zacatecas, Mexico, 2–4 September 1985; pp. 49–53. [Google Scholar]
- Sari, M. Stability Analysis of Cut Slopes Using Empirical, Kinematical, Numerical and Limit Equilibrium Methods: Case of Old Jeddah–Mecca Road (Saudi Arabia). Environ. Earth Sci. 2019, 78, 621. [Google Scholar] [CrossRef]
- Sari, M. Secondary Toppling Failure Analysis and Optimal Support Design for Ignimbrites in the Ihlara Valley (Cappadocia, Turkey) by Finite Element Method (FEM). Geotech. Geol. Eng. 2021, 39, 5135–5160. [Google Scholar] [CrossRef]
- Markland, J.T. A useful technique for estimating the stability of rock slopes when the rigid wedge slide type of failure is expected. In Interdepartmental Rock Mechanics Project; Imperial College of Science and Technology: London, UK, 1972; Volume 19, p. 10. [Google Scholar]
- Hoek, E.; Bray, J.W. Rock Slope Engineering, Revised, 3rd ed.; The Institution of Mining and Metallurgy: London, UK, 1981; pp. 257–270. [Google Scholar]
- Rocscience DipsTM: Graphical and Statistical Analysis of Orientation Data, Version 8.022. Available online: https://www.rocscience.com/software/dips (accessed on 26 October 2023).
- Goodman, R.E. Application of Rock Mechanics to Rock Slope Engineering. In Introduction to Rock Mechanics; John Wiley: Toronto, ON, Canada, 1980; pp. 254–287. [Google Scholar]
- Hudson, J.A.; Harrison, J.P. Engineering Rock Mechanics: An Introduction to the Principles; Pergamon Press: London, UK, 1997; pp. 307–325. [Google Scholar]
- Rocscience RS2TM: 2D Finite Element Analysis, Version 11.019. Available online: https://www.rocscience.com/software/rs2 (accessed on 26 October 2023).
- Geogar. Relazione Geologica Progetto delle Opere di Mitigazione del Rischio Idrogeologico del Centro Abitato con Consolidamento di Via Giro Esterno Est 2015, p. 36. Available online: https://www.comune.rignanogarganico.fg.it/po/attachment_news.php?id=156 (accessed on 26 October 2023). (In Italian).
- Italferr (Gruppo Ferrovie dello Stato Italiane). Relazione Geotecnica e di calcolo Rilevati- Riassetto Nodo di Bari 2015; p. 85. Available online: https://va.mite.gov.it/File/Documento/235833 (accessed on 26 October 2023). (In Italian)
- Barton, N.R.; Bandis, S.C. Review of predictive capabilities of JRC-JCS model in engineering practice. In Rock Joints, Proceedings of the International Symposium on Rock Joints, Loen, Norway, 7–8 June 1990; Barton, N., Stephansson, O., Eds.; Balkema: Rotterdam, The Netherlands, 1990; pp. 603–610. [Google Scholar] [CrossRef]
- Miller, R.P. English Classes and Index Properties for Intact Rock. Ph.D. Thesis, University of Illinois, Urbana, IL, USA, 1965. [Google Scholar]
- Barton, N.; Choubey, V. The Shear Strength of Rock Joints in Theory and Practice. Rock Mech. 1977, 10, 1–54. [Google Scholar] [CrossRef]
- Barton, N.R. Review of a new shear strength criterion for rock joints. Eng. Geol. 1973, 7, 287–332. [Google Scholar] [CrossRef]
- Salvini, R.; Riccucci, S.; Gullì, D.; Giovannini, R.; Vanneschi, C.; Francioni, M. Geological Application of UAV Photogrammetry and Terrestrial Laser Scanning in Marble Quarrying (Apuan Alps, Italy). In Engineering Geology for Society and Territory, Proceedings of the IAEG XII Congress, Turin, Italy, 15–19 September 2014; Lollino, G., Manconi, A., Guzzetti, F., Culshaw, M., Bobrowsky, P., Luino, F., Eds.; Springer: Cham, Switzerland, 2014; Volume 5, pp. 979–983. [Google Scholar] [CrossRef]
- Geniş, M.; Çolak, B. Stability Assessment of the Gökgöl Karstic Cave (Zonguldak, Turkey) by Analytical and Numerical Methods. Rock Mech. Rock Eng. 2015, 48, 2383–2403. [Google Scholar] [CrossRef]
- Salvini, R.; Ermini, A.; De Lucia, V.; Beltramone, L.; Silvestri, D.; Rindinella, A.; Guido, S.; Marchetti, D.; Gullì, D. Stress–Strain Investigation of the Rock Mass Based on Overcoring with CSIRO HI Cell Test and Numerical Modeling: A Case Study from an Italian Underground Marble Quarry. Geosciences 2022, 12, 441. [Google Scholar] [CrossRef]
- Hoek, E.; Brown, E.T. Underground Excavations in Rock; The Institution of Mining and Metallurgy: London, UK, 1980; p. 527. [Google Scholar]
- Martin, C.D.; Kaiser, P.K.; McCreath, D.R. Hoek-Brown parameters for predicting the depth of brittle failure around tunnels. Can. Geotech. J. 1999, 36, 136–151. [Google Scholar] [CrossRef]
- Cosgrove, J. The Role of Structural Geology in Reservoir Characterization. Geol. Soc. Lond. Spec. Publ. 1998, 127, 1–13. [Google Scholar] [CrossRef]
- Szechy, K. The Art of Tunnelling; Akademiai Kiado: Budapest, Hungary, 1966; p. 76. [Google Scholar]
- Farmer, I. Engineering Properties of Rocks; E. & F.N. Spon: London, UK, 1968; p. 57. [Google Scholar]
- Hardy, H.R.; Jayaraman, N.I. An investigation of methods for determination of the tensile strength of rock. In Proceedings of the 2nd Congress of the International Society for Rock Mechanics, Belgrade, Serbia, 21–26 September 1970; Volume 3, pp. 85–92. [Google Scholar]
- Ippolito, F.; Nicotera, P.; Lucini, P.; Civita, M.; De Riso, R. Geologia Tecnica per Ingegneri e Geologi; ISEDI: Milano, Italia, 1975; p. 449. [Google Scholar]
- Paronuzzi, P.; Serafini, W. Back-analysis of the flexural failure of a cantilevered rock slab: The Val Cellina rockfall (Friuli, 26/01/1999). Geoing. Ambient. Mineraria 2008, 124, 23–38. [Google Scholar]
- Sakellariou, M. Topics of Analytical and Computational Methods in Tunnel Engineering. In Tunnel Engineering—Selected Topics; IntechOpen Limited: London, UK, 2020; pp. 1–27. [Google Scholar] [CrossRef]
- Oreste, P.; Oggeri, C.; Canali, F.; Scolari, M. Numerical Modeling and Back-Analysis Approach on a Monitored Underground Cavern for the Extraction of Marble for Ornamental Uses. Appl. Sci. 2023, 13, 12893. [Google Scholar] [CrossRef]
Disclaimer/Publisher’s Note: The statements, opinions and data contained in all publications are solely those of the individual author(s) and contributor(s) and not of MDPI and/or the editor(s). MDPI and/or the editor(s) disclaim responsibility for any injury to people or property resulting from any ideas, methods, instructions or products referred to in the content. |
© 2024 by the authors. Licensee MDPI, Basel, Switzerland. This article is an open access article distributed under the terms and conditions of the Creative Commons Attribution (CC BY) license (https://creativecommons.org/licenses/by/4.0/).