Article

Examining the Relationship between Rainfall, Runoff, and Turbidity during the Rainy Season in Western Japan

by
Mohamad Basel Al Sawaf
1,*,
Kiyosi Kawanisi
2 and
Masoud Bahreinimotlagh
3
1
Kitami Institute of Technology, Hokkaido 090-8507, Japan
2
Department of Civil and Environmental Engineering, Graduate School of Advanced Sciences and Engineering, Hiroshima University, 1-4-1 Kagamiyama, Higashi-Hiroshima 739-8527, Japan
3
Water Resources Institute, Tehran 1658954381, Iran
*
Author to whom correspondence should be addressed.
GeoHazards 2024, 5(1), 176-191; https://doi.org/10.3390/geohazards5010009
Submission received: 27 December 2023 / Revised: 8 February 2024 / Accepted: 10 February 2024 / Published: 18 February 2024

Abstract

:
Given the changing climate, understanding the recent variability in large-scale rainfall patterns is a crucial task in order to better understand the underlying hydrological processes that occur within a watershed. This study aims to investigate how rainfall events in western Japan have changed due to climate change and how these changes have affected runoff–turbidity dynamics during the rainy season. To address the research objectives, we analyzed two decades of precipitation records in the Gōno River watershed and examined the associated runoff–turbidity dynamics during floods using turbidity–discharge (T-Q) loops, quantified using an enhanced hysteresis index. Our findings revealed a kind of intense rainfall event occurring every 3 to 4 years. Additionally, spatial pentad analysis showed varying intensities of accumulated precipitation, indicating that extreme rainfall is not confined to a specific spatial zone. Regarding turbidity–discharge behavior, we found that clockwise hysteresis patterns were caused by sediment sources from near-channel areas, while anticlockwise patterns were caused by soil erosion from nearby areas. Another notable finding was that turbidity peaks during floods may represent the earlier (or later) arrival of turbid water from distant upstream sources due to intense precipitation. One of the key challenges in quantifying hysteresis patterns is that there is no agreed-upon definition for how to determine the start and end of a flood event. This can lead to bias in the quantification of these patterns.

1. Introduction

Heavy precipitation, induced by climate change, stands as one of the most concerning environmental issues of the current time. The recently witnessed events of precipitations are described as having new and complex patterns and can trigger devastating natural events like mudflows, landslides, and floods, wreaking havoc on communities and their livelihoods [1,2,3]. The scientific literature reveal that extreme precipitation events are becoming increasingly severe across the globe [1,4,5]. East Asia, in particular, has borne the brunt of this trend, experiencing a pronounced rise in rainfall, leading to large-scale floods with intricate and unpredictable patterns [6,7,8]. Looking ahead, hydrological projections for East Asia reveal an unsettling reality; river flows are projected to increase dramatically by the turn of the century, driven by the relentless rise in precipitation [9,10].
Similar to its neighbors, Japan experiences the “Baiu”, a seasonal monsoon phenomenon fueled by the collision of warm, humid air with a stationary front. This event, also known as “Mei-yu” in China and “Changma” in Korea, brings heavy rainfall which is vital for the region [11,12]. However, recent years have witnessed an alarming trend: these rains are becoming increasingly torrential, triggering devastating mudflows and landslides. Therefore, investigating the variability of these events is crucial in understanding the escalating flood risks and ensuring the safety of communities. By unlocking the secrets of the “Baiu”, we can develop more effective mitigation strategies and safeguard East Asia’s future in the face of a changing climate.
In addition, soil erosion caused by heavy seasonal rains leads to an alarming rise in sedimentation, posing a serious threat to water quality and marine life in western Japan [13]. The mudflows and landslides triggered by these downpours are one of the major challenges that is currently faced in the western region of Japan [14,15,16].
In the literature, it has been revealed that many empirical and physical models can be used to compute soil erosion and estimate catchment sediment yield [17,18,19,20,21,22]. However, readers should be cautioned that model results are not always guaranteed, since models entail frequent calibration [13,23]. Furthermore, models demand data obtained at sparse spatiotemporal scales which are difficult to maintain. Accordingly, direct stream monitoring represents another effective tool offering a comprehensive knowledge of drainage basin processes. In this regard, one of the most straightforward approaches to acquire information about underlying geomorphic processes happening within and over a basin scale is to examine the behavior of suspended sediment concentration (SSC) in accordance with river discharge (Q). Furthermore, the interpretation of suspended sediment concentration and river discharge (SSC–Q)-generated loops (i.e., SSCQ hysteresis) offers a great opportunity to disclose the reasons—related to the source of soil erosion and some related dynamics—behind these relations and to interpret the hidden geomorphic processes occurring at watershed scales [24,25].
Nonetheless, continuous measurements of SSC cannot be performed easily, particularly during life-threatening weather and flood conditions. Instead, the continuous measurement of stream turbidity (T) is widely conducted and accepted as an alternative approach to measuring SSC, since turbidity can be considered as a proxy for estimating the SSC in rivers and streams by calibrating the empirical relationships between the measured SSC and turbidity [26,27]. Numerous studies have investigated the characteristics and dynamics of turbidity–rainfall and turbidity–discharge (T-Q) dynamics and proved the applicability of using turbidity records as an alternative to SSC sampling [28,29,30,31]. Investigating the hysteretic behavior of SSC–Q using turbidity as a proxy for SSC can be viewed practically from two sides: first, turbidity measuring is cheaper compared to performing sediment sampling at a river site followed by laboratory-based analytical protocols; second, turbidity measurements can be carried out continuously and, hence, the lag time between the peak of SSC (alternatively, the peak of turbidity) versus the peak of the corresponding river discharge can be detected more precisely. Moreover, the temporal association between SSC and Q can be sensed accurately.
Nevertheless, the interpretation of sediment–discharge (alternatively turbidity–discharge) loops and sediment–rainfall (alternatively turbidity–rainfall) loops remains a captivating challenge, influenced by two key factors [32]. The first factor revolves around the lag time between peak turbidity and peak discharge, shaping the direction and form (clockwise or anticlockwise) of the generated loop. This lag time sheds light on the timing and source of sediment movement within the basin, whereas the second factor focuses on quantifying the hysteretic shape itself, which holds clues to various underlying phenomena [33].
The purpose of this study is to examine the variability of rainfall events in Japan over the last two decades and investigate the dynamics of runoff–turbidity. This study aims to answer the following research questions: (1) How have rainfall patterns changed in western Japan over the last two decades, given that this region is frequently affected by heavy precipitation? (2) What are the primary relationships between runoff and turbidity?
The contributions of this study are significant in several ways. Firstly, it examines the variation of extreme precipitation patterns using pentad analysis over the last two decades, which adds value to the existing literature. Secondly, it employs one of the current important hysteresis indices that is used to quantify the sediment–discharge relationship. Lastly, the study aims to improve this index to be more informative and promising from our perspectives.

2. Study Area and Records

2.1. Study Area

This study focuses on the upstream region of the Gōno River, located in Miyoshi City, Hiroshima, Japan (Figure 1). As depicted in Figure 1a, the Gōno River originates from the mountainous terrain of Kitahiroshima City, Hiroshima Prefecture. After flowing northeastward, it joins its three tributaries—Kannose, Saijō, and Basen—at the center of Miyoshi City. From there, it continues in a northward direction, crossing the border into Shimane Prefecture before taking a westward turn and pouring into the Sea of Japan.
The river at the studied site is classified as a mountain stream. A shallow gravel bed defines its course, stretching for 194 km and draining a catchment area of 3900 km2. The Köppen climate classification categorizes the river’s watershed as Cfa, signifying a humid subtropical climate. Forest dominates the landscape, covering around 92% of the watershed according to the Ministry of Land, Infrastructure, and Transport (MLIT). Agriculture occupies 7%, while residential areas make up a mere 1%. The geological makeup reveals a predominance of rhyolite in the main catchment, while granite intrusions characterize the mountainous regions. Quercus serrata forests blanket a significant portion of the mountains, while oak forests grace the middle and lower reaches. Additionally, bamboo forests have been strategically planted along the riverbanks in the middle and lower reaches, serving as a non-structural measure for flood protection [7,34].
Basically, during the East Asian monsoon season, massive amounts of precipitation downpour from early June to late July, followed by heavy floods, which can be triggered by tropical cyclones from September to November.
Figure 1a presents the river watershed and the constructed rainfall gauging stations over the river catchment. Alternatively, Figure 1b presents the study area that was chosen to monitor the turbidity and runoff dynamics. The selection of this site was inspired by the following motives: first, the strategic position of this section, with it being located at the downstream part which receives direct contributions from the Saijo and Basen rivers (i.e., the primary tributaries of the Gōno River); second, the presence of the Ozekiyama Station, which contains considerable records of the river discharge and turbidity compared to the other stations along the stream channel.

2.2. Hydrological Records

In this study, rainfall data from the established gauging stations over the entire studied catchment (Figure 1a) were obtained to investigate the spatiotemporal variation of the rainfall during the study period. On the other hand, water turbidity records (T) from Ozekiyama Station were collected to be analyzed with the river discharge (Q) records that were obtained from the same station (i.e., Ozekiyama Station).
Table 1 presents an illustration of the data used in this study. As can be seen, the complied data contain long-term records of rainfall and discharge; nonetheless, the turbidity records released by the online database were available only from 2007 to 2010. Alternatively, our laboratory conducted two measurement campaigns for turbidity at Ozekiyama station, aiming to observe the dynamics of turbidity and discharge during the rainy seasons. The first one was carried out from 2015/06/01 to 2015/07/31, whereas the second one was performed from 2016/06/01 to 2016/07/31. For the data provided by the MLIT observatory stations, it should be noted that, if a station exhibited a long period of data discontinuity, the station records were excluded from further analysis; however, if the missing period was very short (a few hours of missing data), linear interpolation was performed.

3. Methods

3.1. Pentad Precipitation Analysis

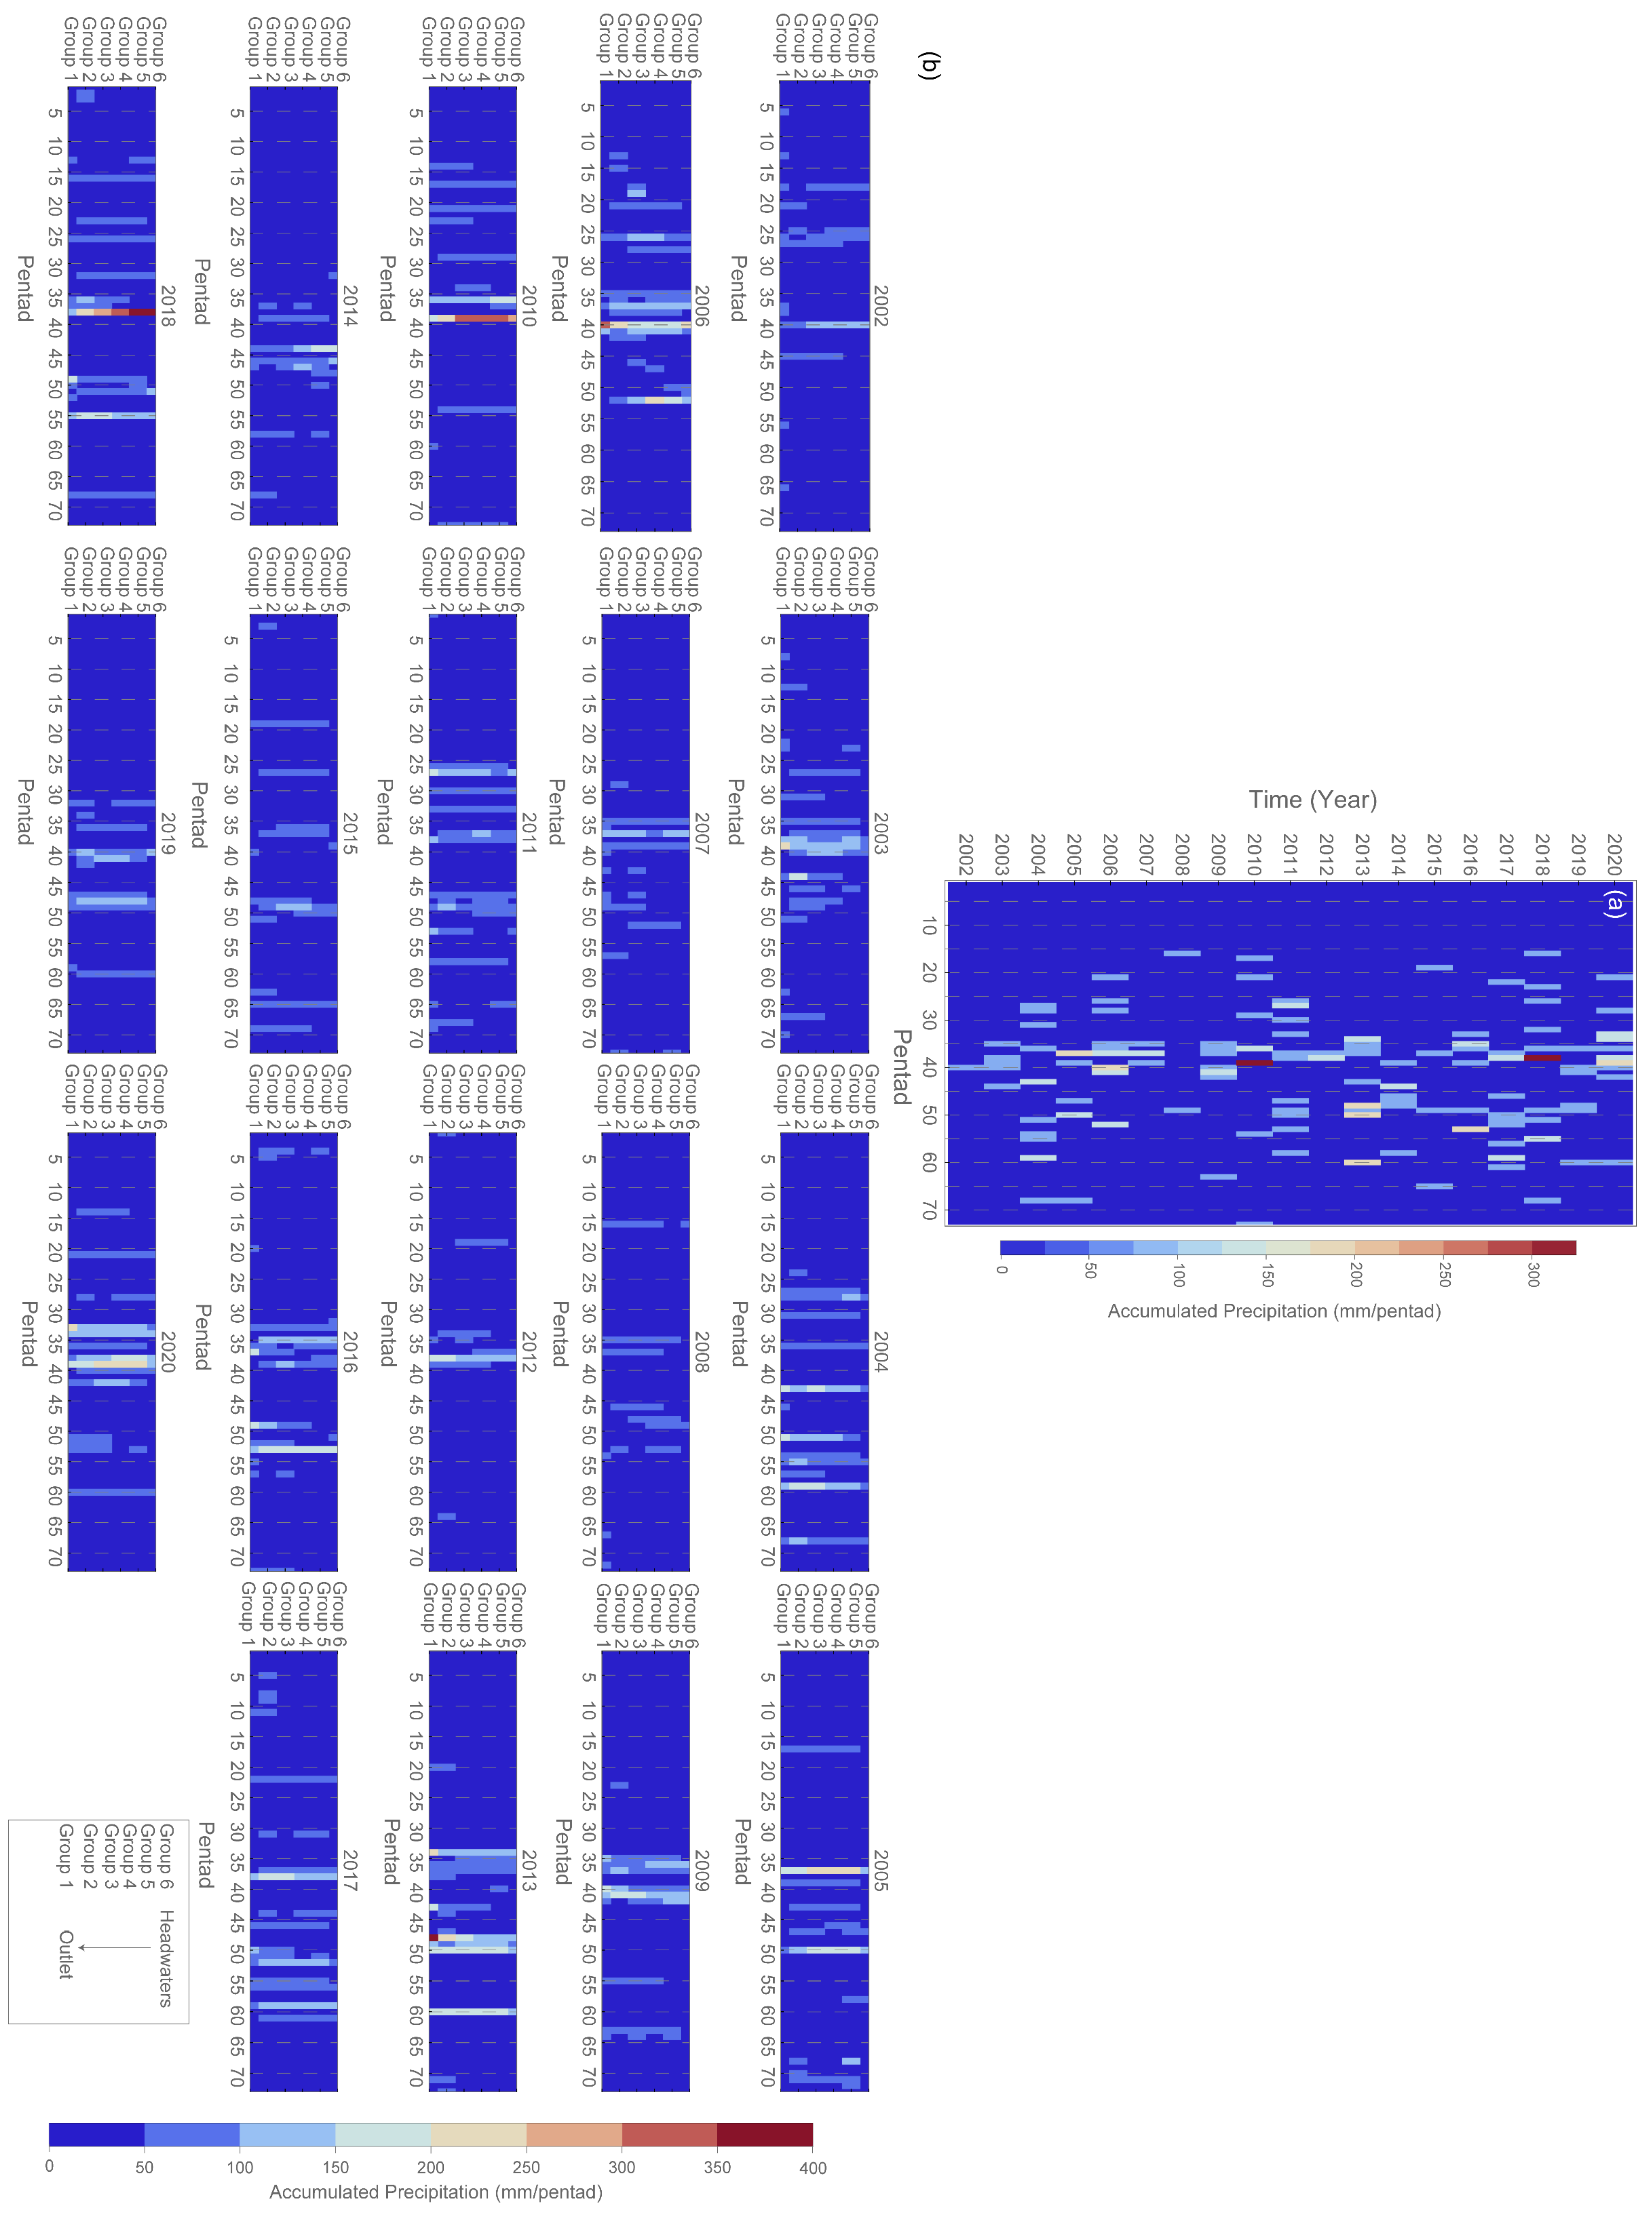
In order to investigate the inter and intra-annual variation of the massive rainfall events over the entire basin, we employed a pentad analysis. In other words, this approach involves dividing annual rainfall data into pentads. Pentad analysis refers to the study and analysis of rainfall data over a period of five consecutive days, known as a pentad. This time scale is often used in regions with distinct wet and dry seasons, or where rainfall patterns exhibit significant variability within a month [35]. The analysis begins at each individual rain gauge station, where annual rainfall data are aggregated into pentads. This initial step provides a localized perspective on rainfall patterns within the watershed. The second step is to average the corresponding pentad values across all stations. This step allows us to generate a composite picture of rainfall intensity, revealing the overall rainfall patterns across the entire region. Finally, we translate these numerical data into a visual representation by plotting the averaged pentad values. This plot serves as a powerful tool, clearly illustrating the inter and intra-annual variations of heavy rainfall events.
On the other hand, to investigate the spatiotemporal variation in the heavy rainfall records over the studied watershed, rain observatory stations over the entire catchment were aggregated into six main groups according to their positions from the outlet of the basin headwaters. In the same manner, at each rain station, annual rainfall data were grouped into pentads; then, the mean pentad value for each group of stations was computed. Finally, the averaged pentad values for each group per year were presented in plots to reveal the spatio-temporal variation of heavy rainfall events.

3.2. Rainfall–Runoff Response Analysis

To gain a holistic understanding of the rainfall–runoff processes in comparison to the turbidity behavior during flood events, a statistical analysis using the rainfall input as a forcing factor on suspended sediment dynamics and river discharge was performed. That is to say, the hourly antecedent precipitation index (APIh) was computed as an indexing measure of the moisture content stored within the watershed prior to a storm event and then compared with the turbidity records to find the lag times between the peak of APIh versus turbidity (T). In other words, this analysis process provides crucial insights into the time it takes for accumulated precipitation to translate into increased sediment transport within the river system. The APIh can be calculated according to the following equation:
A P I h = k P h 1 + P h
where k is an empirical decay constant specific to the watershed (typically ranging from 0.85 to 0.98), which was set to 0.9 for the current study. Ph denotes the hourly precipitation value.
In addition, the river flow records (Q) were compared with the turbidity records to find the lag times between the discharge and turbidity.

3.3. Quantification of Discharge Turbidity Hysteresis Patterns

To understand how turbidity responded rapidly to the changing river flow during a flood, we plotted the association between turbidity and the measured flow (T-Q) and analyzed the generated hysteresis loop for clues about sediment sources. Examining hysteresis patterns is important for elucidating the dynamic turbidity response to streamflow and moisture storage changes during flood events.
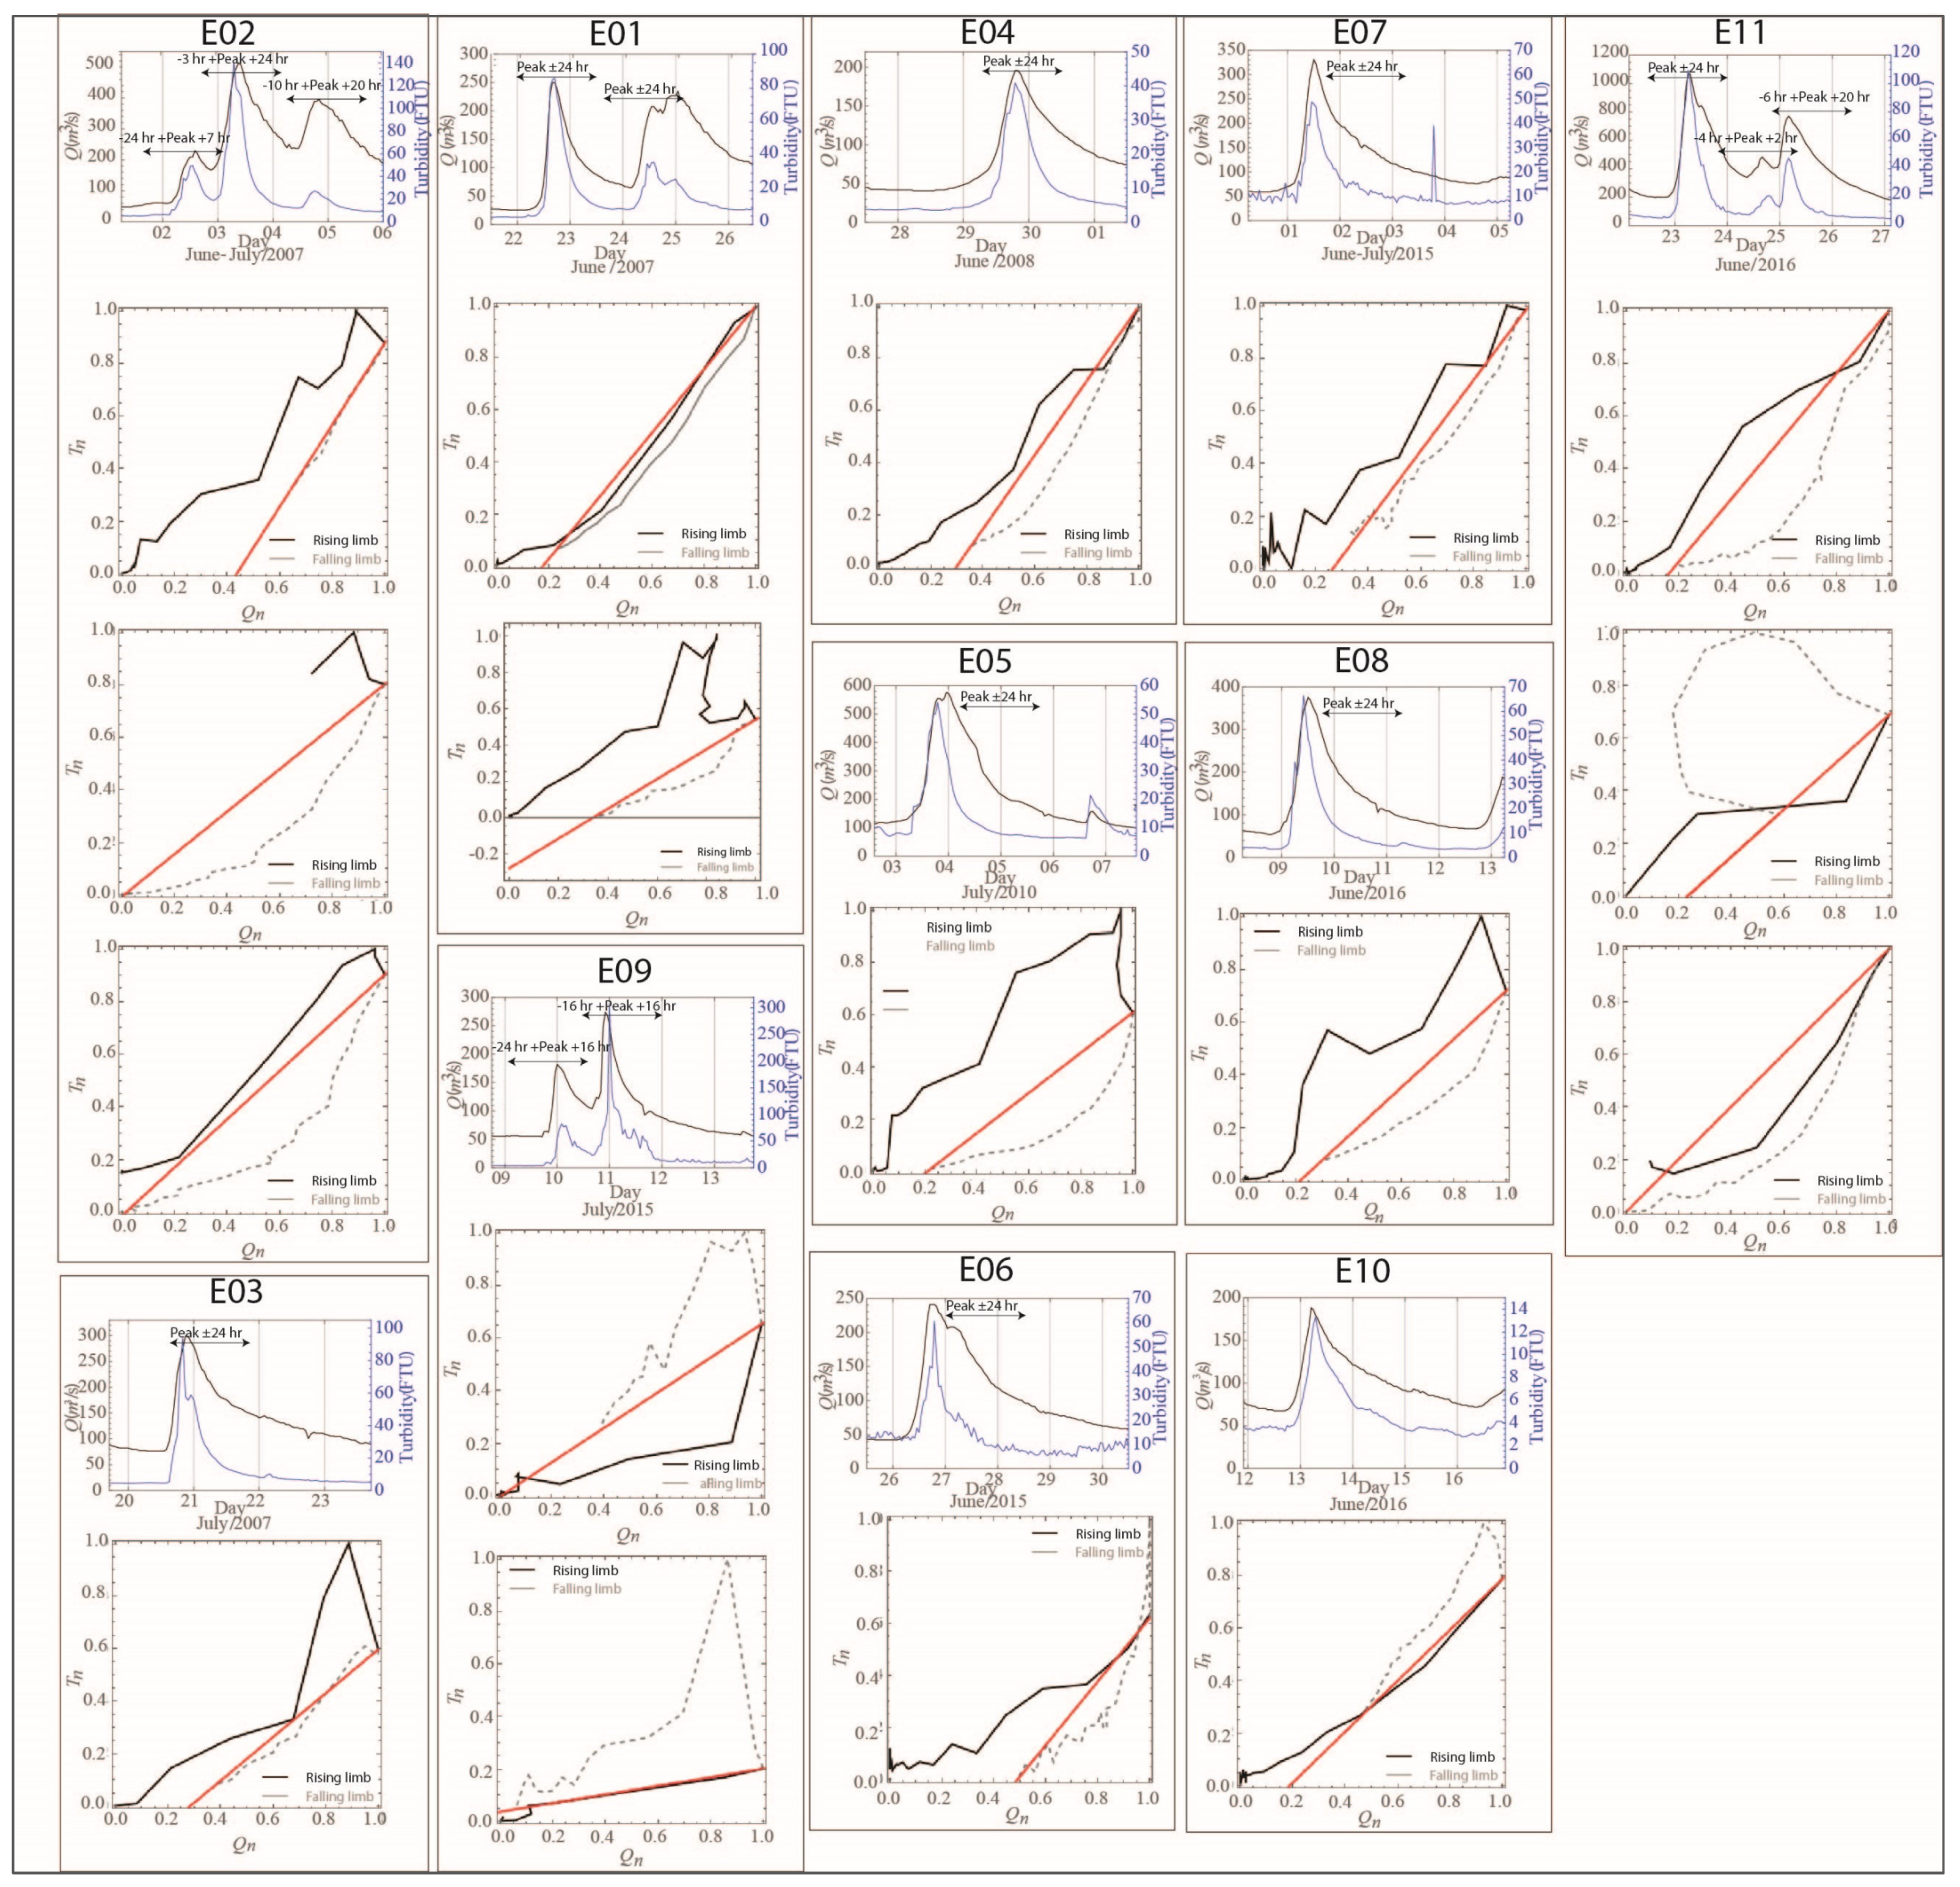
In this study, several flood events were examined. Each studied event was selected on the basis that its first peak comes after 24 consecutive hours of baseflow; if no other peak was observed within the next 24 h, then the event was defined as a single peak event. However, if another peak was observed within the next 24 h from the first peak, it was categorized as a double peak event. Similarly, if another peak was observed within the next 24 hours from the second peak, it was described as a triple peak event.
To quantify the generated hysteresis loops, we adopted the hysteresis index (HI), introduced by [32], which was estimated for (T-Q) loops. The computation of the hysteresis index can be summarized as follows (Figure 2a). First, for each studied event, the hourly records of stream turbidity and discharge were normalized as follows:
T n ( i ) = T i T m i n T m a x T m i n
Q n ( i ) = Q i Q m i n Q m a x Q m i n
where Tmax and Qmax are the maximum values of the turbidity and discharge during a specific event, respectively. Similarly, Tmin and Qmin refer to the minimum values of the turbidity and discharge during the same event, respectively. In addition, Tn (i) and Qn (i) denote the normalized values of the turbidity and discharge at a time i, respectively. After normalizing the events, each hysteresis loop was then divided into the rising and falling of the hydrograph by drawing a straight line (SL) starting from the Qmax and ending at the last normalized turbidity reading. After that, we found and measured the maximum rectangular distance Drise from the rising limb curve to SL. In the same manner, we found and measured the maximum rectangular distance Dfall from the falling limb curve to SL. Finally, the hysteresis index can be computed using Equation (4). Hysteresis index computation, according to this method, is outlined in Figure 2a.
H I = D r i s e + D f a l l
In addition to the index estimated by Equation (4), we refined the hysteresis index by adjusting the aforementioned method. That is to say, we repeated the same steps described previously with one key modification which lies in the estimation of the Drise and Dfall. To illustrate, Drise and Dfall in the aforementioned approach were computed using the maximum rectangular distance from SL to the rising and falling limb curves, respectively. In this modified approach, Drise was estimated by finding the projection of each point of the rising limb on SL and then taking the mean distances of all projected lines. In the same manner, Dfall was computed by finding the projection of each point of the falling limb on SL and then taking the mean distances of the projected lines (Figure 2b). Finally, the hysteresis index was found using Equation (4). The key importance of this modification lies in offering a better evaluation and assessment of the generated shape rather than considering only the extreme values (i.e., maximum) of the distances to the rising and falling limbs.

4. Results and Discussion

4.1. Pentad Precipitation Plots

The annual and intra-annual variation in the rainfall records over the entire watershed, as determined using the pentad precipitation analysis, are revealed in Figure 3a. Apparently, an insignificant amount of accumulated precipitation can be noticed during winters, i.e., pentads No. 72 and 73 and No. 1–16. On the other hand, substantial periods of rainy pentads can be clearly observed during summers (pentads No. 35–53), followed by autumn seasons (pentads No. 54–71), respectively. In general, during summers, most of the massive rainfall events were concentrated within pentads No. 35–42; the average accumulated precipitation per pentad can be estimated as 34.5 mm/pentad. In general, massive rainfall events take place during the Baiu front, which becomes stationary over most of Japan as a result of the dynamical balance between the cold northern pressure system and the warm Pacific pressure system. The collision of these two pressure systems enhances the atmospheric instability over the Japanese islands [36].
Importantly, it can be noticed in Figure 3a that two pentads marked the highest values of accumulated precipitation during the studied period: in 2018 and 2010, with 323 and 280 mm/pentad, respectively. Alternatively, the remaining years of the study scored a maximum pentad value roughly equal to 140 mm/pentad, suggesting that the precipitation events that occurred in 2010 and 2018 showed an increasing value that can be estimated as approximately ~200%. In 2010, an extremely moist air flowed from the south toward a stagnant seasonal rain front near the Japan mainland, and the front became more active, causing heavy rains from western to eastern Japan from July 10th to 16th. In 2018, however, the heavy rains induced by the synchronization of the Baiu front with the Typhoon No. 7 from July 3rd to July 8th caused tremendous damage to the areas in western Japan [15]. These rainy events are projected to increase more in the future, leading to an increment in river flow [7,10].
Among the years of the study, it can be realized that 2002 can be classified as the year with the least amount of precipitation (Figure 3a), followed by 2008, 2012, and 2015, respectively.
Figure 3b offers a detailed picture of the spatiotemporal variations of the precipitations over the studied period. First, it can be seen that the Gōno River is characterized by a flashy rainfall system, with massive rainfall events mainly concentrated between pentads No. 32-50 and with fluctuated complex (unsimilar) patterns over the studied period. Apparently, the annual events of 2006, 2010, 2013, 2018, and 2020 depicted the highest rainfall intensities, and exhibited a kind of periodicity of 3~4 years. Remarkably, the estimated pentads for each group of stations exhibited various intensities of accumulated precipitation, suggesting that there is no specific spatial feature of extreme rainfall, and massive precipitation may happen at different spatial scales.

4.2. Storage–Turbidity and Flow–Turbidity Events

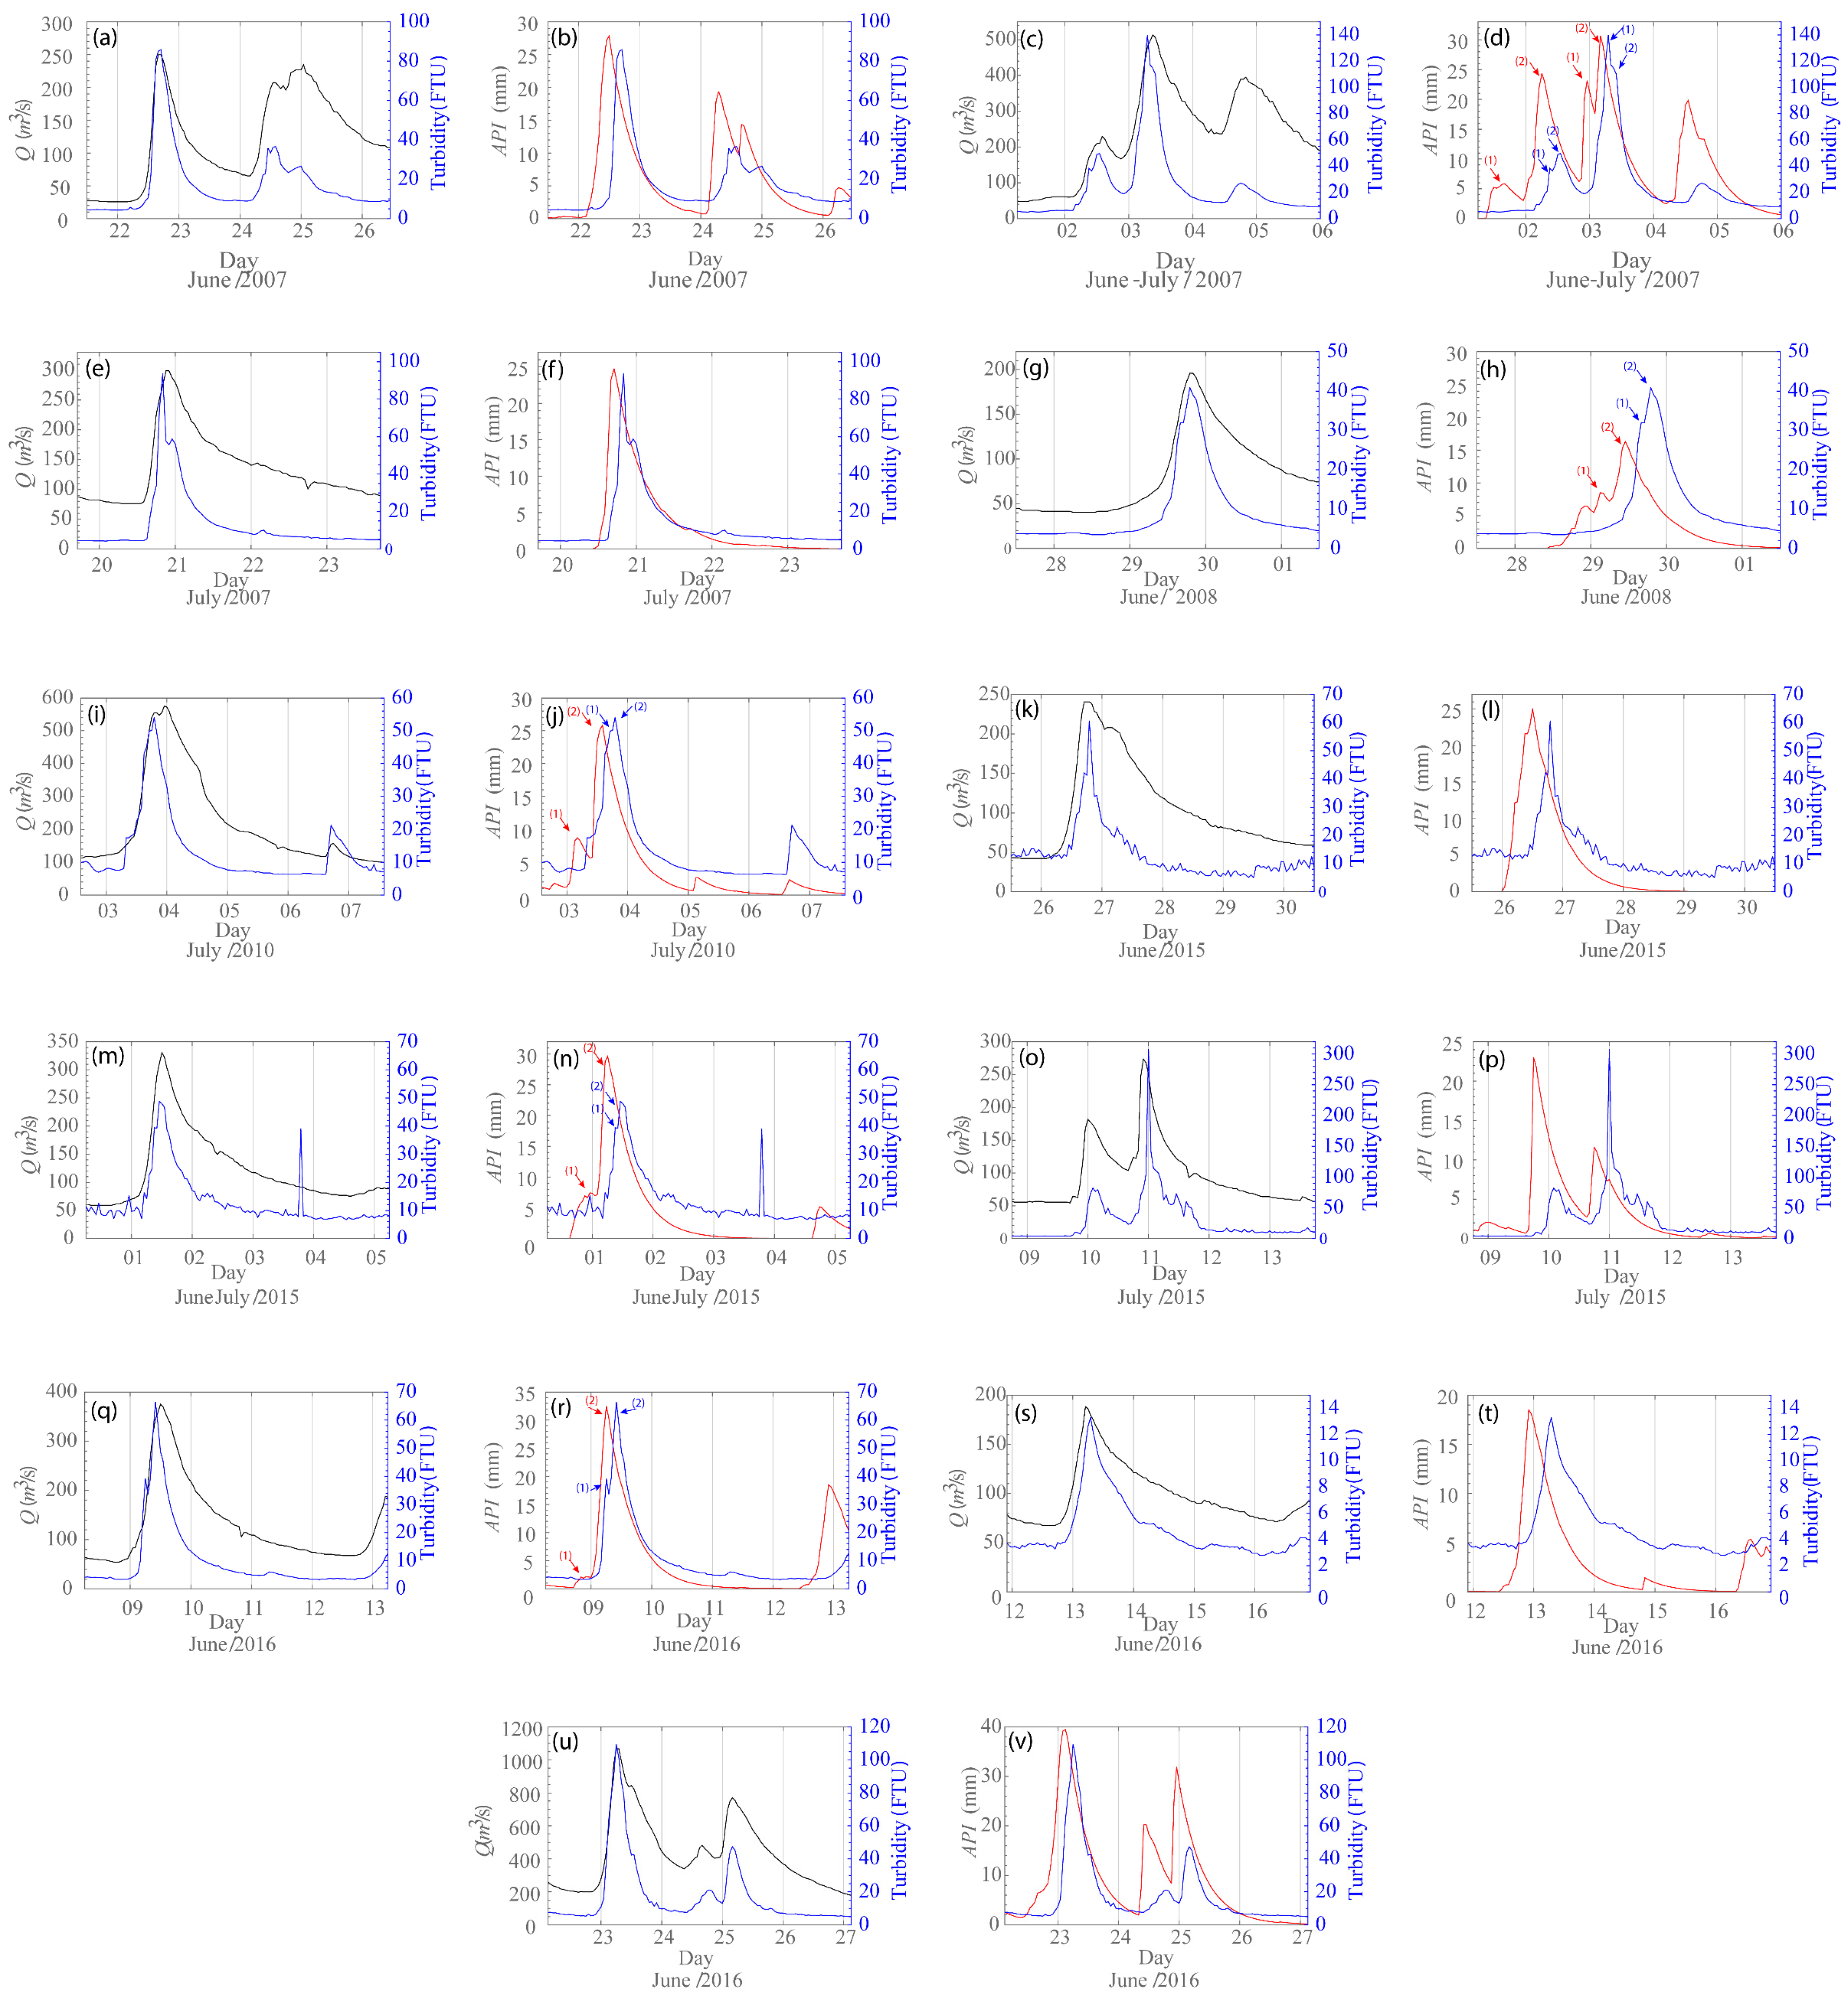
The relationship between the rainfall and runoff is nonlinear; thus, to comprehensively understand the underlying hydrodynamics that occur within a basin, investigating several related variables is essential to disclosing these features. Several flood events were investigated in this study and plotted in Figure 4. As previously mentioned in Section 3.3, these were categorized into (i) single peak events, (ii) double peak events, and (iii) triple peak events. Investigating these events according to the aforementioned category is vital, as flood peaks vary and have no specific peak pattern during heavy rainfall events. It is vital to mention that the annual mean flowrate in the investigated region (i.e., Ozekiyama Station) was estimated as 70 m3/s [14]; therefore, all selected studied events were greater than the annual mean flowrate.
As can be seen in Figure 4, the river flow peaks during the studied events ranged between 180 and 1100 m3/s. Turbidity peaks, on the other hand, ranged between 18 and 290 FTU. In addition to the river flow, the turbidity records were also compared to the API index to offer an image of the connection between the turbidity and the moisture stored within a catchment during the occurrence of floods.
Generally, the lag time between the API peak and the river flow peak was approximately ~6.5 h. Furthermore, the lag time between the API peak and the turbidity peak was approximately ~6 h. Certainly, it can be noticed in Table 2 that the lag time between the peak of turbidity and the peak of API, as well as the lag time between the peak of flow and the peak of API varied considerably. This can be justified by the fact that the API was estimated using the average rainfall records from the rain-gauging stations located upstream of the observation site (i.e., Ozekiyama station); hence, the lag time varied due to the spatial variation of the precipitation.
More impressive still, a striking behavior in turbidity, such as “bursts” or “local peaks”, can be detected in some events, as indicated by arrows in Figure 4d,h,j,n,r. These local peaks are more often found in the rising period of a turbidity event and can be linked to the earliest peak of the API records, as indicated by arrows in Figure 4. These local peaks may represent an earlier (or later) arrival of turbid waters from nearby distant sources at an upstream section as a result of intense precipitation. In this regard, Lawler et al. (2006) investigated the turbidity hydrodynamics during spring storm events in an urban headwater river system in the UK and reported comparable behavior.
Importantly, it can be seen in Figure 4 that the peak of turbidity and the peak of discharge happen asynchronously. Accordingly, investigating the relationship between discharge and turbidity discloses the hysteretic patterns embedded between these two variables, hence reflecting the changes in the river channel scouring and deposition during the studied flood events.
In this study, information on the lag time between the peak of the turbidity and river flow during all flood events varied notably, as can be seen in Table 2 and Figure 5. That is to say, in some events, the turbidity peak preceded the flow peak, forming a positive clockwise hysteresis (i.e., periods indicated by + sign in Table 2, column No. 8), while other events showed a negative anticlockwise hysteresis when the flow peak arrived earlier than the turbidity peak (i.e., periods indicated by − sign in Table 2, column No. 8). In this work, some of the studied events showed that the turbidity peak arrived before or just with the discharge peak, which means a clockwise hysteresis pattern that could be explained by sediment sources from near channel areas [37,38]. The observed anticlockwise patterns could be justified by two main reasons: (i) flood waves traveling quicker than the average flow velocity or sediment waves flowing slower than the discharge wave and (ii) soil erodibility from the nearby areas.
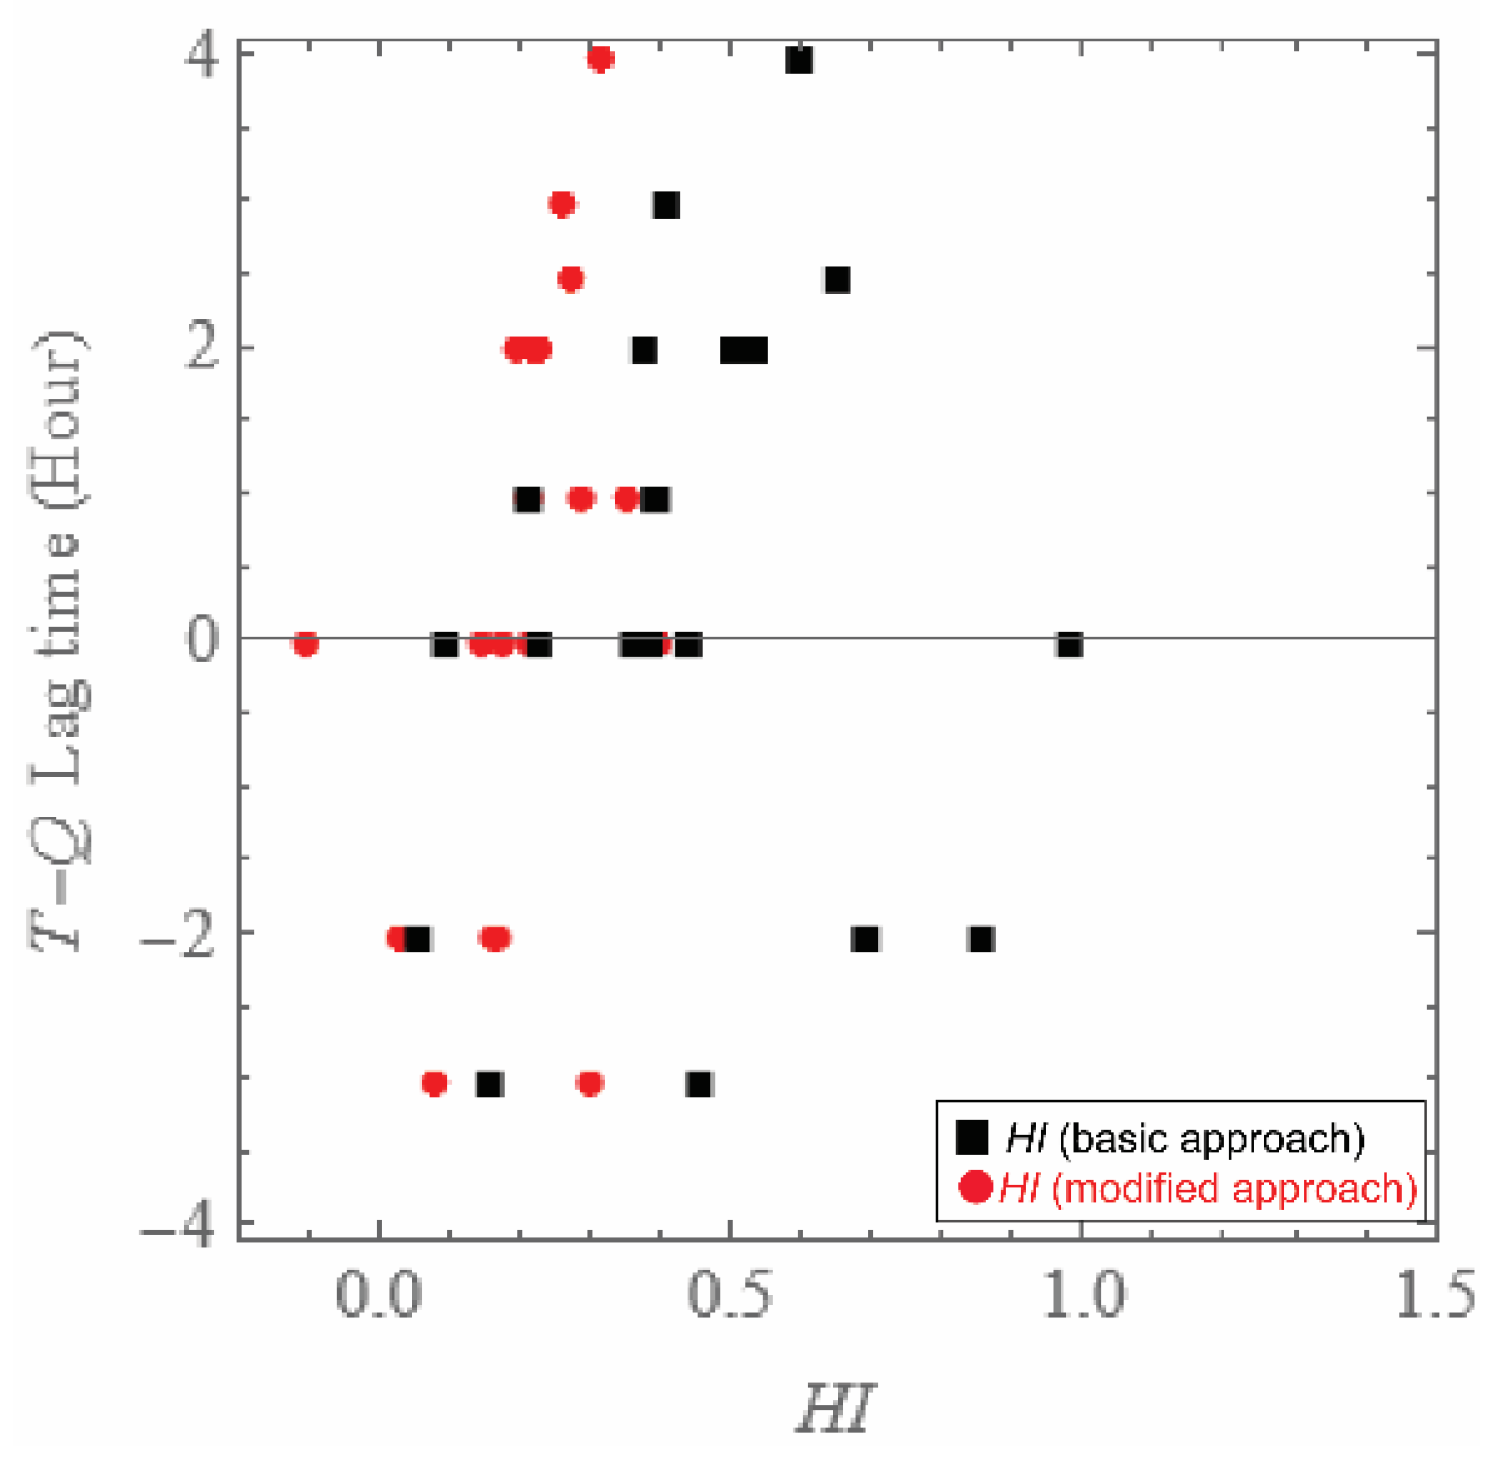
The results of the hysteresis index computed for each event are given in Table 2. Obviously, the HI results evaluated by means of the modified index showed a reduction compared to the HI results computed using the basic index. In this regard, it should be mentioned that the basic idea behind the development of various hysteresis indices was to provide a tool to quantify the magnitude and direction of the formed hysteresis shape based on its size or “fatness” [39,40]. The index devised by the authors of [32] is straightforward; moreover, the normalization process of the considered dependents (i.e., T-Q) enables direct comparisons of HI values among different events. However, it should be stated that the presence of the sub-measures of the hysteresis index within the rising and falling limb (i.e., Drise and Dfall) has two sides. On the one hand, it enhances the interpretation ability of the index. On the other hand, the main limitation is that the HI value is a function of the two extreme values, i.e., the maximum rising point and the maximum falling point, which may lead to bias in the case of abnormal sediment (turbidity) measurement. As a result, taking the average value of all observed Drise and Dfall would be more reasonable in the estimation process. Furthermore, Figure 6 presents the extent of correlation between the estimated HI and the lag time. It should be acknowledged that no specific correlation can be visually detected between the HI and the lag time; the Pearson correlation, however, estimated using the modified index (~0.39), was greater than that estimated using the basic index (~0.14). The main challenge in this context is that there is no accepted definition of how to determine the start and the end of a flood event and, thus, the accurate estimation of Drise and Dfall may lead to a bias in the computation process. Although it seems that the modified HI seems to be promising, the basic limitation of this modification resides in the burden of estimating several Drise and Dfall in the case of a large number of discharge–turbidity measurements, as can be seen in Figure 2b. In the case of this study, we performed our computations by developing a humble coding script. However, complex events must be evaluated carefully.
Identifying different types of hysteretic SSC-Q patterns through pattern classification is crucial for accurately understanding sediment dynamics. Past studies performed either a qualitative and/or quantitative assessment, i.e., using hysteresis indices [41]. For example, several indices have been proposed to objectively classify hysteretic loop patterns and behaviors [32,39,40,42]. Some of these metrics aimed to summarize the entire SSC-Q relationship into a single value, allowing for the easier inference of sediment dynamics without the need for explicit classification [41]. Nonetheless, these indices, although convenient, can mask key differences between events with the same HI value. Therefore, additional metrics like loop area or direction are crucial to retaining the information lost during data compression, ensuring a more accurate understanding of event sediment dynamics [42,43]. In this regard, it should be stressed that the choice of hysteresis index will depend on the specific goals of the study and the characteristics of the data, such as (i) comparing the degree of hysteresis between different rivers or events or (ii) identifying factors that influence hysteresis, such as sediment availability, channel morphology, and flow regime.
In general, a higher HI value indicates a greater degree of hysteresis, which can be caused by a variety of factors, such as limited sediment availability, changes in flow velocity, or bank erosion. Thus, investigating the hidden relations of discharge–sediment hysteresis is still required for understanding how rivers transport sediment and for managing river systems; additionally, it can help in predicting how changes in land use or climate will affect sediment transport in rivers.

5. Conclusions

Recent years have witnessed an alarming increase in the frequency and intensity of massive rainfall events across western Japan. Understanding the underlying hydrological processes triggered by these immense downpours is crucial for mitigating their impact and ensuring the sustainable future of the region. Accordingly, our study set out to achieve two key objectives. First, an examination of the changeability in the rainfall events in western Japan. In this regard, we employed a pentad analysis to examine the variability of precipitation patterns within the Gōno River basin and to investigate potential shifts and trends in rainfall intensity and frequency. Meanwhile, the second objective was to investigate the complex interaction between runoff and turbidity. In this case, we explored the dynamic relationship between river discharge and turbidity by utilizing an improved hysteresis index to quantify the observed patterns.
The findings showed that the annual events of 2006, 2010, 2013, 2018, and 2020 scored the highest rainfall intensities, and revealed a kind of periodicity of 3~4 years. Moreover, spatial pentads analysis presented several intensities of accumulated precipitation, suggesting that massive precipitation may happen at different spatial scales. Regarding the turbidity–discharge patterns, clockwise and anticlockwise hysteresis patterns were found. Interestingly, a distinct behavior of turbidity during floods, such as “bursts” or “local peaks”, was detected and may represent an earlier (or later) arrival of turbid waters from nearby distant sources at an upstream section as a result of an intense precipitation. One of the basic challenges in the quantification of hysteresis loops is that there is no universally accepted definition of how to determine the start and the end of a flood event, which may lead to bias in the quantification of these patterns.

Author Contributions

M.B.A.S.: Conceptualization, methodology, data curation, writing original draft preparation, discussion, and funding acquisition; K.K.: Reviewing and discussion; M.B.: Observation and discussion. All authors have read and agreed to the published version of the manuscript.

Funding

This study was funded by JSPS KAKENHI grant number JP21K14253.

Data Availability Statement

Rainfall, river flow and turbidity records can be accessed from the MLIT River System Database.

Conflicts of Interest

The authors declare that they have no conflicts of interest.

References

  1. Das, S.; Kamruzzaman, M.; Islam, A.R.M.T. Assessment of characteristic changes of regional estimation of extreme rainfall under climate change: A case study in a tropical monsoon region with the climate projections from CMIP6 model. J. Hydrol. 2022, 610, 128002. [Google Scholar] [CrossRef]
  2. Gariano, S.L.; Guzzetti, F. Landslides in a changing climate. Earth-Sci. Rev. 2016, 162, 227–252. [Google Scholar] [CrossRef]
  3. Uchimura, T.; Towhata, I.; Wang, L.; Nishie, S.; Yamaguchi, H.; Seko, I.; Qiao, J. Precaution and early warning of surface failure of slopes using tilt sensors. Soils Found. 2015, 55, 1086–1099. [Google Scholar] [CrossRef]
  4. Yamamoto, M. Effects of sea surface temperature anomalies on heavy rainfall in Tsushima Strait in late July 2020. Atmos. Res. 2022, 278, 106336. [Google Scholar] [CrossRef]
  5. Robinson, J.D.; Vahedifard, F.; Aghakouchak, A. Rainfall-triggered slope instabilities under a changing climate: Comparative study using historical and projected precipitation extremes. Can. Geotech. J. 2017, 54, 117–127. [Google Scholar] [CrossRef]
  6. Iqbal, Z.; Shahid, S.; Ahmed, K.; Ismail, T.; Ziarh, G.F.; Chung, E.S.; Wang, X. Evaluation of CMIP6 GCM rainfall in mainland Southeast Asia. Atmos. Res. 2021, 254, 105525. [Google Scholar] [CrossRef]
  7. Al Sawaf, M.B.; Kawanisi, K.; Xiao, C. Characterizing annual flood patterns variation using information and complexity indices. Sci. Total Environ. 2021, 806, 151382. [Google Scholar] [CrossRef]
  8. Xu, Y.; Su, C.; Huang, Z.; Yang, C.; Yang, Y. Research on the protection of expansive soil slopes under heavy rainfall by anchor-reinforced vegetation systems. Geotext. Geomembr. 2022, 50, 1147–1158. [Google Scholar] [CrossRef]
  9. Sato, Y.; Kojiri, T.; Michihiro, Y.; Suzuki, Y.; Nakakita, E. Estimates of Climate Change Impact on River Discharge in Japan Based on a Super-High-Resolution Climate Model. Terr. Atmos. Ocean. Sci. 2012, 23, 527. [Google Scholar] [CrossRef]
  10. Higashino, M.; Stefan, H.G. Variability and change of precipitation and flood discharge in a Japanese river basin. J. Hydrol. Reg. Stud. 2019, 21, 68–79. [Google Scholar] [CrossRef]
  11. Ohba, M.; Kadokura, S.; Yoshida, Y.; Nohara, D.; Toyoda, Y. Anomalous Weather Patterns in Relation to Heavy Precipitation Events in Japan during the Baiu Season. J. Hydrometeorol. 2015, 16, 688–701. [Google Scholar] [CrossRef]
  12. Om, K.-C.; Ren, G.; Li, S.; Kang-Chol, O. Climatological characteristics and long-term variation of rainy season and torrential rain over DPR Korea. Weather Clim. Extrem. 2018, 22, 48–58. [Google Scholar] [CrossRef]
  13. Ram, A.R.; Terry, J.P. Stream turbidity responses to storm events in a pristine rainforest watershed on the Coral Coast of southern Fiji. Int. J. Sediment Res. 2016, 31, 279–290. [Google Scholar] [CrossRef]
  14. Al Sawaf, M.B.; Kawanisi, K. Assessment of mountain river streamflow patterns and flood events using information and complexity measures. J. Hydrol. 2020, 590, 125508. [Google Scholar] [CrossRef]
  15. Hashimoto, R.; Tsuchida, T.; Moriwaki, T.; Kano, S. Hiroshima Prefecture geo-disasters due to Western Japan Torrential rainfall in July 2018. Soils Found. 2020, 60, 283–299. [Google Scholar] [CrossRef]
  16. Tsuchida, T.; Kano, S.; Nakagawa, S.; Kaibori, M.; Nakai, S.; Kitayama, N. Landslide and mudflow disaster in disposal site of surplus soil at Higashi-Hiroshima due to heavy rainfall in 2009. Soils Found. 2014, 54, 621–638. [Google Scholar] [CrossRef]
  17. Michalek, A.; Zarnaghsh, A.; Husic, A. Modeling linkages between erosion and connectivity in an urbanizing landscape. Sci. Total Environ. 2021, 764, 144255. [Google Scholar] [CrossRef]
  18. Heckmann, T.; Cavalli, M.; Cerdan, O.; Foerster, S.; Javaux, M.; Lode, E.; Smetanová, A.; Vericat, D.; Brardinoni, F. Indices of sediment connectivity: Opportunities, challenges and limitations. Earth-Sci. Rev. 2018, 187, 77–108. [Google Scholar] [CrossRef]
  19. de Vente, J.; Poesen, J. Predicting soil erosion and sediment yield at the basin scale: Scale issues and semi-quantitative models. Earth-Sci. Rev. 2005, 71, 95–125. [Google Scholar] [CrossRef]
  20. Das, A.; Remesan, R.; Chakraborty, S.; Kumar Gupta, A. Investigation of human-induced land use dynamics in a representative catchment on the Chota Nagpur Plateau, India: A spatiotemporal application of soil erosion modeling with connectivity index studies. Catena 2022, 217, 106524. [Google Scholar] [CrossRef]
  21. Wu, J.; Nunes, J.P.; Baartman, J.E.M.; Faúndez Urbina, C.A. Testing the impacts of wildfire on hydrological and sediment response using the OpenLISEM model. Part 1: Calibration and evaluation for a burned Mediterranean forest catchment. Catena 2021, 207, 105658. [Google Scholar] [CrossRef]
  22. Ewen, J.; Parkin, G.; O’Connell, P.E. SHETRAN: Distributed River Basin Flow and Transport Modeling System. J. Hydrol. Eng. 2000, 5, 250–258. [Google Scholar] [CrossRef]
  23. de Vente, J.; Poesen, J.; Verstraeten, G.; Govers, G.; Vanmaercke, M.; Van Rompaey, A.; Arabkhedri, M.; Boix-Fayos, C. Predicting soil erosion and sediment yield at regional scales: Where do we stand? Earth-Sci. Rev. 2013, 127, 16–29. [Google Scholar] [CrossRef]
  24. Williams, G.P. Sediment concentration versus water discharge during single hydrologic events in rivers. J. Hydrol. 1989, 111, 89–106. [Google Scholar] [CrossRef]
  25. Hudson, P.F. Event sequence and sediment exhaustion in the lower Panuco Basin, Mexico. Catena 2003, 52, 57–76. [Google Scholar] [CrossRef]
  26. Al Sawaf, M.B.; Kawanisi, K. Novel high-frequency acoustic monitoring of streamflow-turbidity dynamics in a gravel-bed river during artificial dam flush. Catena 2019, 172, 738–752. [Google Scholar] [CrossRef]
  27. Göransson, G.; Larson, M.; Bendz, D. Variation in turbidity with precipitation and flow in a regulated river system–river Göta Älv, SW Sweden. Hydrol. Earth Syst. Sci. 2013, 17, 2529–2542. [Google Scholar] [CrossRef]
  28. Andrade, V.S.; Gutierrez, M.F.; Regaldo, L.; Paira, A.R.; Repetti, M.R.; Gagneten, A.M. Influence of rainfall and seasonal crop practices on nutrient and pesticide runoff from soybean dominated agricultural areas in Pampean streams, Argentina. Sci. Total Environ. 2021, 788, 147676. [Google Scholar] [CrossRef] [PubMed]
  29. Ochiai, S.; Kashiwaya, K. Measurement of suspended sediment for model experiments using general-purpose optical sensors. Catena 2010, 83, 1–6. [Google Scholar] [CrossRef]
  30. Slaets, J.I.F.; Schmitter, P.; Hilger, T.; Lamers, M.; Piepho, H.-P.; Vien, T.D.; Cadisch, G. A turbidity-based method to continuously monitor sediment, carbon and nitrogen flows in mountainous watersheds. J. Hydrol. 2014, 513, 45–57. [Google Scholar] [CrossRef]
  31. Solano-Rivera, V.; Geris, J.; Granados-Bolaños, S.; Brenes-Cambronero, L.; Artavia-Rodríguez, G.; Sánchez-Murillo, R.; Birkel, C. Exploring extreme rainfall impacts on flow and turbidity dynamics in a steep, pristine and tropical volcanic catchment. Catena 2019, 182, 104118. [Google Scholar] [CrossRef]
  32. Aich, V.; Zimmermann, A.; Elsenbeer, H. Quantification and interpretation of suspended-sediment discharge hysteresis patterns: How much data do we need? Catena 2014, 122, 120–129. [Google Scholar]
  33. Smith, H.G.; Dragovich, D. Interpreting sediment delivery processes using suspended sediment-discharge hysteresis patterns from nested upland catchments, south-eastern Australia. Hydrol. Process. 2009, 23, 2415–2426. [Google Scholar] [CrossRef]
  34. MLIT 2007 Gono River System and Its Watershed. (In Japanese). Available online: https://www.mlit.go.jp/river/shinngikai_blog/shaseishin/kasenbunkakai/shouiinkai/kihonhoushin/070810/pdf/ref1-1.pdf (accessed on 1 December 2023).
  35. Gramzow, R.H.; Henry, W.K. The Rainy Pentads of Central America. J. Appl. Meteorol. 1972, 11, 637–642. [Google Scholar] [CrossRef]
  36. Nishiyama, K.; Endo, S.; Jinno, K.; Bertacchi Uvo, C.; Olsson, J.; Berndtsson, R. Identification of typical synoptic patterns causing heavy rainfall in the rainy season in Japan by a Self-Organizing Map. Atmos. Res. 2007, 83, 185–200. [Google Scholar] [CrossRef]
  37. Malutta, S.; Kobiyama, M.; Chaffe, P.L.B.; Bonumá, N.B. Hysteresis analysis to quantify and qualify the sediment dynamics: State of the art. Water Sci. Technol. 2020, 81, 2471–2487. [Google Scholar] [CrossRef] [PubMed]
  38. Asselman, N.E.M. Suspended sediment dynamics in a large drainage basin: The River Rhine. Hydrol. Process. 1999, 13, 1437–1450. [Google Scholar] [CrossRef]
  39. Lawler, D.M.; Petts, G.E.; Foster, I.D.L.; Harper, S. Turbidity dynamics during spring storm events in an urban headwater river system: The Upper Tame, West Midlands, UK. Sci. Total Environ. 2006, 360, 109–126. [Google Scholar] [CrossRef] [PubMed]
  40. Langlois, J.L.; Johnson, D.W.; Mehuys, G.R. Suspended sediment dynamics associated with snowmelt runoff in a small mountain stream of Lake Tahoe (Nevada). Hydrol. Process. 2005, 19, 3569–3580. [Google Scholar] [CrossRef]
  41. Hamshaw, S.D.; Dewoolkar, M.M.; Schroth, A.W.; Wemple, B.C.; Rizzo, D.M. A New Machine-Learning Approach for Classifying Hysteresis in Suspended-Sediment Discharge Relationships Using High-Frequency Monitoring Data. Water Resour. Res. 2018, 54, 4040–4058. [Google Scholar] [CrossRef]
  42. Zuecco, G.; Penna, D.; Borga, M.; van Meerveld, H.J. A versatile index to characterize hysteresis between hydrological variables at the runoff event timescale. Hydrol. Process. 2016, 30, 1449–1466. [Google Scholar] [CrossRef]
  43. Geawhari, M.; Huff, L.; Mhammdi, N.; Trakadas, A.; Ammar, A. Spatial-temporal distribution of salinity and temperature in the Oued Loukkos estuary, Morocco: Using vertical salinity gradient for estuary classification. Springerplus 2014, 3, 643. [Google Scholar] [CrossRef]
Figure 1. (a) Location of the studied watershed; (b) aerial map revealing the location of the study area.
Geohazards 05 00009 g001
Figure 2. Illustration for the estimation of hysteresis index using (a) the basic approach and (b) the modified approach.
Geohazards 05 00009 g002
Figure 3. (a) Annual accumulated precipitation per pentad for the entire watershed and (b) accumulated precipitation per pentad for each group of rain gauging stations per year studied.
Geohazards 05 00009 g003
Figure 4. Comparison between the river flow and turbidity and storage records with the turbidity records.
Geohazards 05 00009 g004
Figure 5. T-Q patterns for the studied events classified as single peak, double peak, and triple peak events.
Geohazards 05 00009 g005
Figure 6. Association between the hysteresis index (HI) and the T-Q lag time using the basic hysteresis index (black) and the modified approach (red).
Geohazards 05 00009 g006
Table 1. Summary of the acquired records used in this study.
DatasetStation Name(s)Available PeriodDataset Source
Hourly rainfall
(mm/h)
Shijihara, Ōasa, Kurome, Kōbo, Hiwa, Saijō, Tsuna, Tōhara, Nishino, Kamiryōke, Honji, Midori, Otsuki, Izuha, Itaki, Kamiyasuda, Sōryō, Haizuka, Haji, Shōbara, Funo, Kisa, Takamiya, Yoshida, Ida, Asuna, Miyoshi, Otsu, Kawamoto, Gōtsu2002~2020MLIT observatory station
Hourly discharge
(m3/s)
Ozekiyama2002~2020MLIT observatory station
Hourly turbidity
(FTU)
Ozekiyama2007, 2008, and 2010MLIT observatory station,
2015/06~2015/07 and 2016/06~2016/07Hiroshima University
Table 2. Statistics and characteristics of the studied flood events over the study period.
Event CodeEventPeak OrderAPIMaxTMaxQMaxTMaxAPIMax*QMaxAPIMax**QMaxTMax***DriseDfallHIDriseDfallHI
T-Q (Basic Index)T-Q (Modified Index)
E012007/06/21~2007/06/261st peak06/22/12:0006/22/17:0006/22/17:005500.140.090.230.10.040.15
2nd peak06/24/07:0006/24/11:0006/24/13:3046.52.50.530.120.650.220.050.27
E022007/07/01~2007/07/061st peak07/02/06:0007/02/13:0007/02/14:007810.380.020.390.280.010.29
2nd peak07/02/23:0007/03/07:0007/03/09:0081020.240.30.530.120.110.23
3rd peak07/04/13:0007/04/18:0007/04/20:005720.140.240.380.080.120.2
E032007/07/20~2007/07/23Single07/20/17:0007/20/21:0007/20/21:004400.380.060.440.160.010.18
E042008/06/26~2008/06/30Single06/29/11:0006/29/19:0006/29/19:008800.250.110.360.160.060.21
E052010/07/02~2010/07/07Single07/03/14:0007/03/19:0007/03/23:005940.4410.190.60.20.110.31
E062015/06/25~2015/06/30Single06/26/12:0006/26/18:0006/26/19:006710.45−0.240.210.310.040.35
E072015/06/30~2015/07/05Single07/01/06:0007/01/11:0007/01/12:005610.10.080.390.180.030.21
E082015/07/09~2015/07/13Single07/09/18:0007/10/02:0007/10/00:0086−20.310.380.690.020.140.16
E092015/07/08~2015/07/131st peak07/10/18:0007/11/00:0007/10/22:0064−20.030.820.860.020.150.17
2nd peak06/09/06:0006/09/10:0006/09/12:004620.360.140.50.150.070.22
E102016/06/08~2016/06/13Single06/12/22:0006/13/07:0006/13/05:0097−2−0.150.20.06−0.070.10.03
E112016/06/22~2016/06/271st peak06/23/03:0006/23/06:0006/23/06:003300.150.240.380.10.120.22
2nd peak06/24/11:0006/24/19:0006/24/16:0085−3−0.20.660.46−0.090.390.3
3rd peak06/24/23:0006/25/04:0006/25/04:00550−0.170.270.090.03−0.14−0.1
TMaxAPIMax*: The difference in time between the peak of turbidity and the peak of the APIh, QMaxAPIMax**: The difference in time between the peak of discharge and the peak of the API, TMaxQMax***: The difference in time between the peak of turbidity and the peak of the discharge.
Disclaimer/Publisher’s Note: The statements, opinions and data contained in all publications are solely those of the individual author(s) and contributor(s) and not of MDPI and/or the editor(s). MDPI and/or the editor(s) disclaim responsibility for any injury to people or property resulting from any ideas, methods, instructions or products referred to in the content.