Abstract
This study investigated erosion during infiltration and overflow events and considered different grain sizes and hydraulic conductivity properties; four experimental cases were conducted under saturated conditions. The importance of understanding flow regimes during overflow experiments including their distinct flow characteristics, shear stresses, and erosion mechanisms in assessing the potential for levee failure are discussed. The failure mechanism of levee slopes during infiltration experiments involves progressive collapse due to piping followed by increased liquefaction and loss of shear stress, with the failure progression dependent on the permeability of the foundation material and shear strength. The infiltration experiments illustrate that the rate of failure varied based on the permeability of the foundation material. In the case of IO-E7-F5, where the levee had No. 7 sand in the embankment and No. 5 sand in the foundation (lower permeability), the failure was slower and limited. It took around 90 min for 65% of the downstream slope to fail, allowing more time for response measures. On the other hand, in the case of IO-E8-F4, with No. 8 sand in the embankment and No. 4 sand in the foundation (higher hydraulic conductivity), the failure was rapid and extensive. The whole downstream slope failed within just 18 min, and the collapse extended to 75% of the levee crest. These findings emphasize the need for proactive measures to strengthen vulnerable sections of levees and reduce the risk of extensive failure.
1. Introduction
River levees play a vital role in global flood protection efforts by acting as crucial barriers against increasingly frequent and intense extreme weather events, safeguarding lives, infrastructure, and valuable land from the devastating impacts of flooding [1,2]. Additionally, river levees play a critical role in enhancing climate resilience by adapting to changing hydrological patterns, safeguarding urban and agricultural areas, and promoting economic stability [3,4]. In 2010, several countries including Pakistan, India, China, Colombia, and Australia, faced devastating floods with significant impacts. China experienced the highest estimated annual damage of USD 51 billion caused by river floods [5,6]. Pakistan suffered from monsoonal flooding, resulting in a high number of immediate fatalities, totaling two thousand. These events highlight the recurring nature and severity of large-scale floods, underscoring the urgent need for effective flood management and preparedness measures [7,8]. Natural disasters such as typhoons, heavy rains, and floods have caused severe damage to Japan’s infrastructure, including its river embankment systems, resulting in levee failures and widespread flooding [9,10]. The rising risk of river embankment failure due to increased storm rainfall has become a significant concern for safeguarding communities and infrastructure from flooding [11].
Levee failures on permeable foundation ground during floods can be attributed to two primary factors: overtopping and seepage-induced erosion of the foundation ground [12]. Overtopping happens when floodwaters surpass the height of the levee, while seepage-induced piping is characterized by the formation of erosion channels within the foundation ground due to the flow of water [13]. These channels weaken the levee structure, eventually leading to failure. An illustrative example of seepage-induced failure is the 2012 Northern Kyushu Heavy Rain event in the Yabe River, where the levee failure occurred without overtopping and seepage-induced piping played a significant impact in the failure [14]. The heavy rains in western Japan in July 2018 also caused widespread devastation to riverine infrastructure, including Okayama Prefecture, resulting in numerous fatalities and significant damage [15]. The mentioned examples highlight the susceptibility of Japan’s river embankment systems to extreme weather events, emphasizing the importance of enhanced design and management approaches to mitigate the risk of failure [16,17]. There are several factors that cause the collapse of an embankment system during a flood event. These comprise overtopping, seepage, or piping of the levee body and settlement or displacement of the foundation [18,19]. Roughly 34% of dam collapses occur due to overtopping, 30% are attributed to foundation defects, and approximately 28% are caused by piping [20]. Similar statistics were reported but with a higher percentage attributed to piping failure [21].
Physical models have been extensively utilized to investigate the breaching process of dikes caused by flow overtopping. Through washout tests, it was determined that the rate of washout was affected by the grain size of the materials, with larger sizes resulting in lower washout rates with a focus on the erosion development of dams because of overtopping and a formula has been proposed to estimate the discharge through a breach based on breach volume [22]. They identified key factors impacting the erosion process, including fill material, dam configuration, placement of impervious elements, and reservoir capacity. Laboratory experiments and case studies have indicated notable differences in the erosion mechanism of noncohesive and cohesive earthen dikes during overflow [23]. For noncohesive embankments, progressive surface erosion involving dispersed particle transport is the typical mode, while cohesive embankments experience headcut erosion with the development and displacement of a vertical or near vertical drop on the bed [24]. Erosion commonly initiates at the downstream gradient and progresses upward, causing a reduction in the width of the embankment top. In cases of surface erosion, the lower slope may undergo changes in its profile, including flattening, steepening, and erosion parallel to the slope, depending on the characteristics of the soil [25]. Apart from overtopping and piping, another factor that can contribute to levee failures is concentrated leak erosion. This type of erosion is caused by the presence of pre-existing channels, cavities, or holes, which can occur due to natural degradation processes of the materials or the activity of wild animals. It is important to consider these additional mechanisms of levee failure to ensure a comprehensive understanding of the potential risks [26,27,28,29]. Among the proactive measures to strengthen vulnerable sections of levees, the implementation of a comprehensive monitoring system can play a crucial role in identifying and controlling erosion mechanisms before failure occurs. Various monitoring techniques, such as piezometers, thermal sensors, and remote sensing, along with specific and advanced experiments, are available today to assess the health and stability of earthen levees [30,31,32]. By integrating these monitoring methods, authorities can obtain real-time data and valuable insights into the condition of levees, allowing for timely and effective interventions to mitigate potential risks and prevent catastrophic failures.
Seepage or infiltration can be the initial stage of piping or internal erosion phenomenon. It provides the necessary moisture and hydraulic conditions for piping to occur [33]. Collapse due to internal seepage takes place when seepage forces cause the removal of fine particles, creating a channel between the upstream and downstream slopes of an embankment. If not controlled, this can lead to the erosion of larger sediment particles, resulting in the development of a pipe that carries enough water. The pipe gradually expands due to material removal at the walls, primarily driven by shear forces, until the levee body collapses. Once the failure happens, the breaching behavior shifts to overtopping, including downward erosion and widening of the breach [34]. The primary types of damage to river levees caused by seepage are slip failure and piping failure. Slip failure occurs when the phreatic surface within the embankment rises due to factors like rainfall or river water infiltration. Piping failure, on the other hand, results in a rise in pore water pressure within the foundation ground or embankment, leading to high exit gradients or uplift of low-permeability soil layers [35]. Proper management and control of seepage are crucial to minimize the risk of piping and subsequent structural failure. Therefore, it is crucial to understand the characteristics and behavior of these processes to assess the risk of failure accurately.
Therefore, the purpose of this study was to analyze the mechanisms and behaviors of erosion in river embankments during overflow and infiltration flow simultaneously with a focus on the hydraulic conductivity and moisture state of the levee and foundation materials. A thorough investigation into the erosion process in levees was modeled here and focused on the interplay between overflow and infiltration flow as well as the impact of foundation properties such as the moisture state (saturation or unsaturation condition) and hydraulic conductivity. Previous studies have often overlooked these crucial factors, warranting further research in this area. In this study, we investigated how erosion occurs, initiates, and propagates, and how long an embankment can resist water before breaking down. The consideration of warning time prior to a breach is crucial for evacuation plans and assessing the consequences of embankment failures, as it relates to the rate of erosion progression and can impact design decisions and resource allocation. Overall, this study contributes to the understanding of the mechanisms and behaviors of erosion in river embankments, which is essential for assessing the risk of failure accurately and designing effective and resilient levee systems.
2. Materials and Methodology
2.1. Flume Characteristics and Scaling of the Model
The experiments were conducted at Saitama University in Japan, using an open channel flume with one side made of glass. The flume was characterized by a length of 6.25 m, a width of 0.5 m, and a depth of 1.2 m, with a completely flatbed slope. The experimental arrangement is illustrated in Figure 1a. The water in the flume channel and pipes was circulated using an electric pump from underground storage tanks.
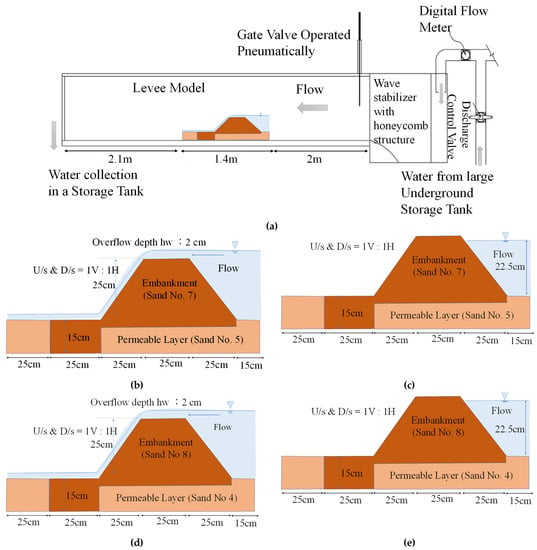
Figure 1.
Schematic detail of experimental setup inside the channel. (a) A side view of experimental flume with embankment model; (b) cross section of embankment model in O-E7-F5 overflow condition; (c) cross section of embankment model in IO-E7-F5 infiltration and overflow condition; (d) cross section of embankment model in O-E8-F4 overflow condition; (e) cross section of embankment model in IO-E8-F4 infiltration and overflow condition.
2.2. Flow Conditions
The flow conditions in this study aimed to simulate medium flood or low tsunami conditions. The overtopping depth on the levees was established at 0.02 m, which corresponds to 0.4 m in the test specimen using the model scale (1/20), ensuring similarity in the Froude number. The inflow discharge (Q) for overtopping was maintained at 2.27 × 10⁻³ m3/s, as measured by a digital flow meter. This discharge rate was carefully controlled to achieve a consistent overflow depth of 0.02 m in two experiments, namely O-E7-F5 and O-E8-F4, both of which were conducted under overflow conditions as shown in Figure 1b,d. In two infiltration experiments (IO-E7-F5 and IO-E8-F4, as shown in Figure 1c,e and as listed in Table 1), the depth of water on the upstream side of the levee was maintained at a constant depth of 0.225 m by closing the discharge control valve, while the water pump remained operational for approximately two hours. This setup was implemented to investigate the influence of infiltration resulting from the presence of a permeable layer. This condition was based on previous research that studied the effects of different water levels on levee stability [36].

Table 1.
Experimental cases of infiltration and overflow erosion tests.
2.3. Embankment Material and Soil Characteristics
In this study, model levees made of Mikawa silica sand were utilized for overflow and infiltration experiments. These model levees had an elevation of 0.4 m, a crest thickness of 0.25 m, and back slopes with a ratio of 1:1. To consider the impact of scouring at the toe of the downstream slope, the model levees were built with a foundation thickness of 0.15 m. The materials used for the levee body and foundation were changed from No. 7 to No. 8 sand and No. 5 to No. 4 sand, respectively. The grain size distributions of the different sands are shown in Figure 2a. In addition to overflow experiments, infiltration experiments were conducted to investigate the influence of permeable layers beneath the levee structure. To ensure embankment strength, soil samples were collected from specific locations on the downstream and upstream slopes of each embankment model as shown in Figure 2b and their dry mass was determined; Figure 2c,d shows the embankment after preparation. Various parameters such as compaction degree, dry density, water content, hydraulic conductivity, mean grain size, and optimum water content were examined and are listed in Table 2.
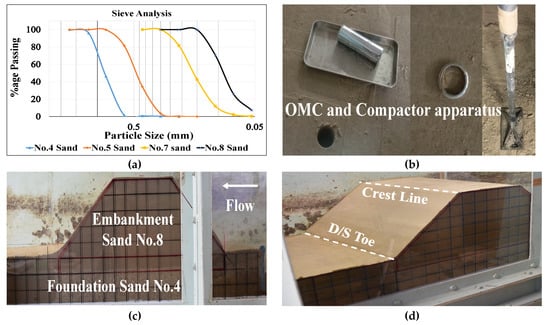
Figure 2.
The Levee model preparation: (a) sieve size distribution of embankment material, (b) degree of compaction and optimum water content check during embankment levee model preparation. The levee model in the flume: (c) side view, (d) top view.

Table 2.
Material properties used in infiltration and overflow tests.
2.4. Embankment Model Construction
A 1/20 scale model was used in the experiment, where the dimensions of the model levee corresponded to an average height of 5 m for a real levee in Japan. The geometry of the levee and the depth of overtopping were key factors influencing erosion initiation and propagation. The embankment models were constructed using Mikawa silica sands, following a 5 cm thick layer and a compaction process. The initial embankment models were constructed with an oversized geometry and then trimmed down to the dimensions specified in Figure 1b–e. Discharge and flow conditions were described earlier. During the erosion process, which lasted less than 2.5 min in overflow cases and more than two hours in infiltration cases, visual inspection, video recording, and high-speed camera techniques were used to monitor the dike and water surface configurations. The resulting data were analyzed and are presented in Section 3.
3. Results
3.1. Overflow Experiments
The study conducted overflow experiments to examine the impact of levee erosion under different foundation properties and hydraulic conductivities. A comprehensive description is provided below.
3.1.1. Overflow Erosion Process in O-E7-F5 (Case I) and O-E8-F4 (Case III)
Overflow events due to levee damage during current experiments can be classified into four stages as shown in Figure 3a–d. Erosion surface profiles at various elapsed times are shown in Figure 4a,b. In the initial stage of the overflow experiments, the levee crest was fixed at a height of 0.25 m and the overflow depth was maintained at 2 cm by controlling the discharge at 2.27 × 10⁻³ m3/s. The erosion started with scouring at the downstream toe of the levee crest, while no degradation or erosion was observed on the upstream area of the levee. The downstream erosion was small, and the initiation of the levee crest was smooth with a small arc surface headcut observed downstream of the levee crest. During the second phase, the erosion rate experienced a sharp surge as a substantial volume of water surged over the crest of the dike at a significant speed. The erosion on the levee surface happened in the form of sediment transport, and the overflow discharge reached its maximum within 30 s after overflow. The shear failure happened downstream of the levee crest for large flow rates, and the water surface profiles remained aligned to the scoured levee surfaces due to the sandy material behavior. The erosion progressed smoothly downstream, and a submerged hydraulic jump was observed. During the third phase, the overtopping discharge remained constant, but the erosion rate increased due to the formation of nape flow and larger headcuts. The erosion occurred in the form of shear blocks with a sudden drop from the levee surface. This stage took up two-thirds of the total overflowing event duration, and the rate of deterioration was influenced by both the quantity of water flowing over the levee crest and the resistance offered by the levee material. As a result, the surface of the levee assumed an S-shaped form and moved toward the upstream slope. In the fourth and final stage, the crest was completely eroded, resulting in a critical situation due to the head difference between upstream and downstream slope and sudden discharge rate increase due to upstream slope failure. The foundation material also eroded due to its low hydraulic conductivity. The water surface profiles were non-parallel with the surface erosion, and the maximum erosion occurred in this stage. When the upstream slope was eroded, the erosion rate decreased due to a reduced difference in head between the upstream and downstream slopes. Overall, the four stages of erosion in the overflow experiments showed the gradual progression of erosion, with each stage demonstrating a different type of erosion mechanism and erosion rate. The third and fourth stages were particularly critical due to the formation of nape flow, larger headcuts, and a sudden discharge rate increase leading to significant erosion of the dike crest and foundation material. The overall levee erosion behavior was the same in both overflow cases.
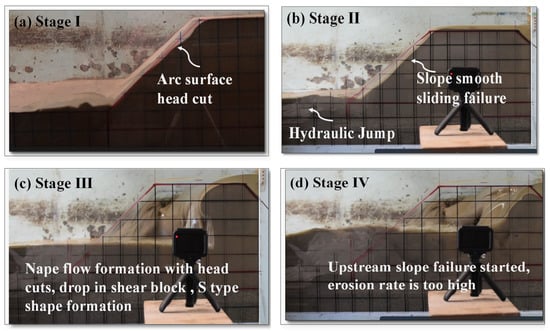
Figure 3.
Overflow erosion process in O-E7-F5 and O-E8-F4. (a) Stage I, arc surface headcut formation. (b) Stage II, smooth erosion of downstream slope and submerged hydraulic jump formation. (c) Stage III, nape flow formation and S shape failure. (d) Stage IV, upstream slope failure and high erosion rate.
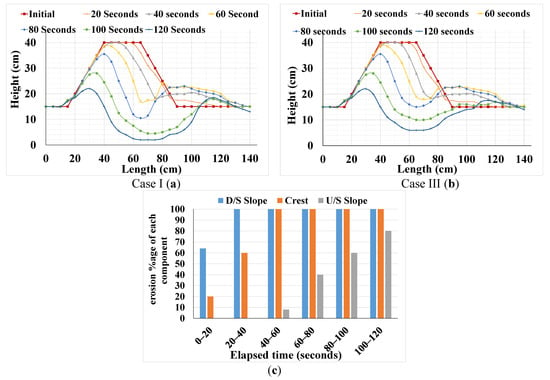
Figure 4.
Levee component erosion and surface profiles at various elapsed times. (a) Erosion profiles for overflow O-E7-F5; (b) for overflow O-E8-F4. (c) Levee components (downstream slope, crest, and upstream slope) erosion percentage vs. elapsed time in O-E7-F5 and O-E8-F4.
3.1.2. Degradation (Percentage Erosion) of Levee Components over Time during Overflow
When a levee overflows, its components are subjected to erosion at different rates. The rate of erosion is influenced by the stage of damage and several other parameters such as the downstream gradient of the levee, the inflow rate, and the configuration of the levee. To investigate this phenomenon further, the current study studied two overflow cases with different compositions of the levee body and foundation. The relationship between the percentage of levee component erosion and the elapsed time for both cases was plotted in a graph which is presented in Figure 4c. It was observed that during the initial stage of damage, the erosion percentage of the levee components gradually increased, with primarily 100% erosion of the downstream slope along with a small amount of the levee crest in about 30 s. Subsequently, during the second stage, the downstream slope already eroded, and levee crest erosion continued at a constant rate for 60 s. During the third stage of damage, which lasted until 90 s, the rate of degradation rapidly increased, with complete erosion of the downstream slope and crest failure propagating to the upstream slope. This stage was followed by the final stage of deterioration, where the deterioration became slower as all three components of the levee had already eroded. Interestingly, the percentage of erosion for both overflow cases was found to be almost the same, with only slight differences observed. This phenomenon can be attributed to the minor difference in embankment materials, specifically the properties of Mikawa Sand No. 7 and No. 8.
3.2. Infiltration Experiments
The study included infiltration experiments to examine the effects of different hydraulic conductivities and foundation properties on levee erosion, with a detailed description provided below.
3.2.1. Seepage Erosion Process in IO-E7-F5 (Case II)
The seepage erosion process is shown in Figure 5a–f. The pictures depict top and side views at different time intervals for the destruction process, with lines indicating gridlines and the initial position of the levee slopes. Similarly, in Figure 6a,b, levee surface profiles showed erosion mechanisms at various elapsed times. The discharge was kept constant for both cases, and the water took about 10 min to reach a height of 0.225 m on the embankment. When the water reached the desired height, the stopwatch was started, and all times correspond to that point. In this case, a leak was seen near the bottom of the slope after 9 min and 20 s, which occurred about 9 min and 10 s later than in Case IV, reflecting the length of the high permeability region in the foundation. After that, the slope became muddy, and the bottom began to collapse uniformly at about 17 min. Water appeared on the whole downstream toe in the form of a sand boil, and cracks started propagating from the toe of the downstream slope to the top in a uniform pattern as shown in Figure 5. At 16 min and 45 s, a uniform crack on the whole downstream toe occurred, and a slip failure started. After that, slip failures progressed one after another toward the crest, with the maximum slope failure observed during the first 25 min. After that, the slope failure gradually slowed down. About 55 to 60% of the slope failed in about 70 min. After that, only 5% of the slope failure occurred within 90 min, after which a sort of equilibrium was observed, and no further slope failure was observed due to the lower head difference between the upstream and downstream slopes; the experiment was continued until almost no deformation of the levee body was observed. When the muddy material from the levee accumulates near the bottom of the slope, the collapse slows down or even stops as in the present case. After about 110 min, the crest overflowed and levee failure occurred in about one minute.
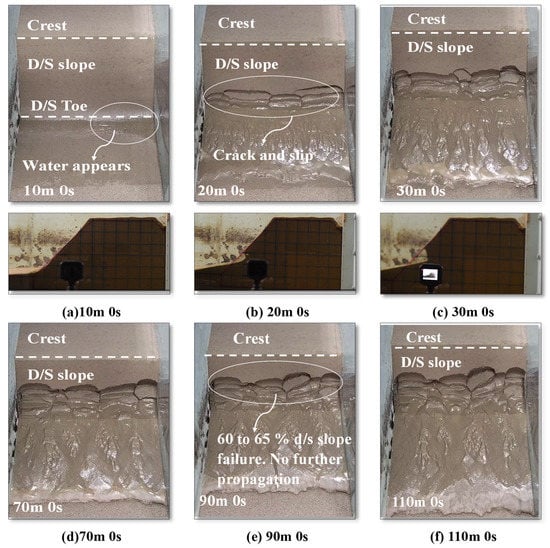
Figure 5.
Erosion process in IO-E7-F5; top and side views at different elapsed times (m for minutes, s for seconds).
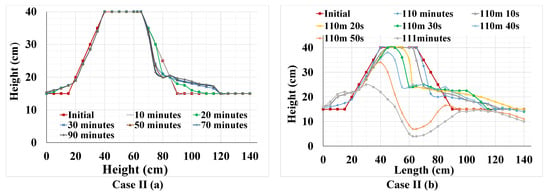
Figure 6.
Levee surface profiles at various elapsed times: (a) for infiltration case IO-E7-F5; (b) for overflow after 110 min.
3.2.2. Seepage Erosion Process in IO-E8-F4 (Case IV)
The seepage erosion process for Case IV is shown in Figure 7a–f and the erosion profiles at different elapsed times are shown in Figure 8a,b. A leak appeared at the bottom of the slope just 10 s after the start of the experiment. The high hydraulic conductivity of the sand in the foundation made it more permeable, and it became saturated when the water level reached the upstream slope at 0.225 m. This leakage occurred about 9 min and 10 s earlier than in Case II. Due to leakage in the embankment’s foundation, the slope became muddy, and a sand boil appeared. After that, a shear crack occurred on the slope at 5 min and 56 s, which became larger until 10 min and 55 s when a slip failure occurred. The slip failures progressed one after another toward the crest, and by 18 min, the whole downstream slope failure was observed. After 18 min, the cracks reached the crest area. Until 30 min, about 30% of the crest failed, after which the crest erosion slowed down and progressed slowly until 90 min when about 70% of the crest was ruptured. After 90 min, there was again some sort of equilibrium, and no further erosion occurred. At about 110 min, the crest was overtopped, and levee failure occurred in just 35 s. Overall, the sand in the foundation’s high hydraulic conductivity played a significant role in the seepage erosion process, causing the slope to become muddy and eventually leading to the levee’s failure.
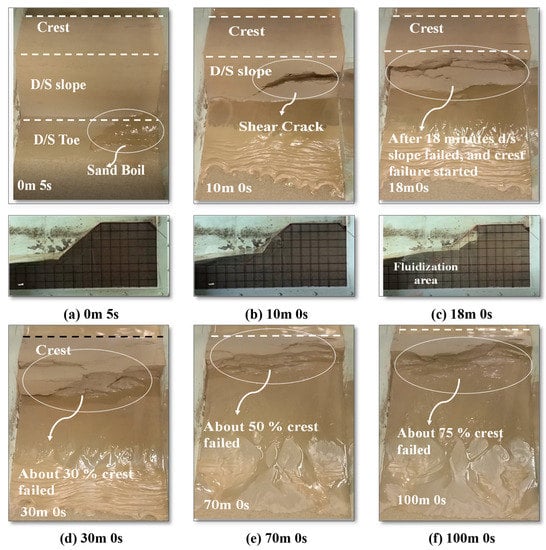
Figure 7.
Erosion process in IO-E8-F4; top and sides views at different elapsed times (m for minutes, s for seconds).
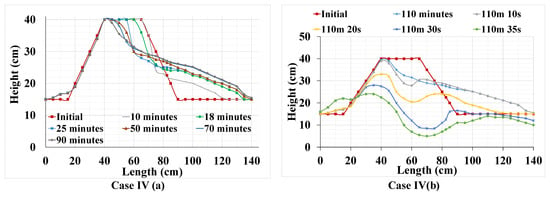
Figure 8.
Levee surface profiles at various elapsed times: (a) for infiltration case IO-E8-F4 (b), for overflow after 110 min.
3.2.3. Degradation (Percentage Erosion) of Levee Components over Time during Infiltration Followed by Overflow
The degradation of levee components during infiltration events can have a significant impact on the safety and functionality of these structures. To better understand this process, experiments were conducted to investigate the relationship between the percentage of levee component erosion and the elapsed time for both infiltration cases. The results are presented in Figure 9a,b as a graphical representation. Interestingly, there were notable differences observed between the two cases. Specifically, in Case II, the percentage of erosion of levee components was found to be relatively small, with only downstream slope failure accounting for 65% of the total damage. This suggests that the rate of erosion was relatively slow, likely due to the lower permeability of the foundation materials in this case. On the other hand, Case IV exhibited a more severe erosion pattern, with the downstream slope failure progressing rapidly up to 70% of levee crest failure. This could be attributed to the higher permeability of the foundation sand in this case, which enabled the water to infiltrate more easily and quickly, resulting in a more rapid erosion process.
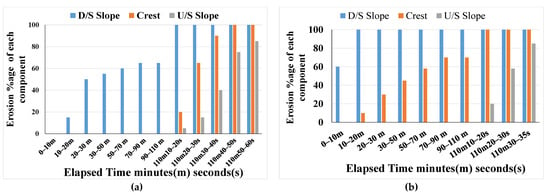
Figure 9.
Levee components erosion percentage vs. elapsed time in (a) IO-E7-F5 and (b) IO-E8-F4.
It is important to note that, in both cases, there was no further erosion observed after 90 min of elapsed time. This indicates that the hydraulic gradient had reached a point where the phreatic line had penetrated the foundation materials up to the failure point, resulting in a cessation of the erosion process. Overall, these findings suggest that the permeability of the foundation materials can have a sufficient impact on the deterioration process of levee components during overflow events.
4. Discussion
4.1. Flow Characteristics and Erosion Mechanism Followed during Levee Overflow Experiments
The erosion process of levees during overflow can be categorized into four stages as shown in Figure 10: subcritical flow on the upstream crown, critical flow on the levee crown, supercritical flow on the downstream slope, and subcritical flow on the tailwater. These flow regimes exhibit different characteristics and shear stresses, leading to varying erosion rates. The study by Chinnarasri et al. [37] supports these findings, with minor differences observed in stage III. Understanding these flow structures is crucial for assessing levee erosion and failure during overtopping events. In the subcritical flow zone on the upstream levee crest, the water stresses are relatively lower, and the flow velocities and energy slope are minor. This results in low shear stress, which leads to less scouring in this region. At the beginning of the overflow event, the flow velocity and scouring are also relatively low. The critical depth is located at the center of the levee crest, and swift scouring initiates at the downstream boundary of the crest because of elevated shear forces. In the supercritical flow region along the sharp slope of the levee surface downstream, the flow velocities experience a significant increase due to the steep energy gradient. This creates very large shear forces, consequently causing substantial scouring. Additionally, a hydraulic jump occurs near the toe of the levee, creating turbulent flow and mixing of water and sediment. As the jet submerges beneath the tailwater surface, a submerged hydraulic jump is formed on the downstream surface of the levee. On the other hand, in the subcritical flow area of the downstream toe of the levee, the hydraulic stresses are relatively low, and the energy gradient is low, resulting in small flow velocities. The low shear stress, despite the possibility of large flow depth, also results in a smaller erosion rate in this region.
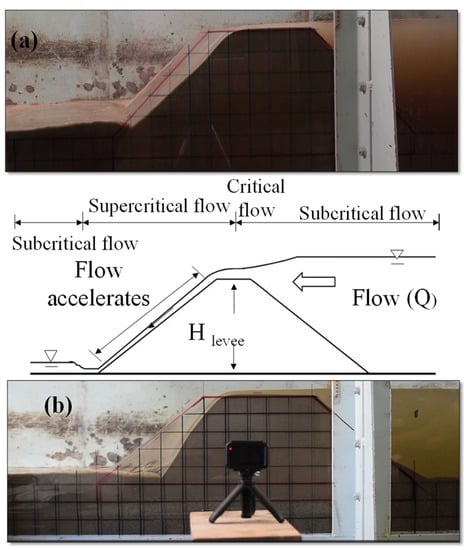
Figure 10.
Flow characteristics during levee overflow: (a) O-E7-F5 and (b) O-E8-F4.
4.2. Levee Failure Mechanism in Model Experiments during Infiltration
The infiltration experiments examined the erosion of levee components and the occurrence of slope failures considering the seepage of water from the upstream slope. The progressive collapse pattern initiating from the downstream slope due to sand boiling was followed and can be roughly classified into two stages as described in Figure 11a. In stage I, progressive collapse due to narrowly defined piping occurred and in stage II, an increase in liquefaction area and loss of effective shear stress occurred. Stage I occurs when there is a ground structure with extremely different permeability or hydraulic conductivity, which is followed by stage II when there is no extreme difference in permeability between the foundation ground and the embankment due to the collapse of the slope. In stage II, a large upward hydrodynamic gradient occurred near the toe of the slope, causing the foundation ground to liquefy, and the eroded area gradually expanded toward the river surface. A higher difference in permeability ratio between infiltration cases resulted in an increased degree of collapse. As infiltration progressed, the embankment slope became fluid-like due to the decreased shear resistance of the embankment material. However, the accumulation of muddy levee material near the slope toe slowed down and eventually stopped the collapse. This occurred because the sandy material making up the embankment body experienced a decrease in shear strength under the influence of a high hydraulic gradient, leading to slip failure. This was the whole mechanism followed by all cases in the current study. The findings from Saito et al. [38], combined with the experiments conducted by Orense et al. [36] using various materials, provide support for the results. Additionally, subsequent studies have also emphasized the significance of further research in this area. Jia et al. [39] highlighted the significance of material permeability during prolonged high water events, emphasizing its role in facilitating seepage through the foundation. The hydraulic conductivity of levee and foundation materials significantly influenced the behavior of the system addressed by Van Beek et al. [40].

Figure 11.
Erosion or collapse mechanism and permeability chart. (a) Stage I and Stage II collapse pattern during infiltration experiments IO-E7-F5 and IO-E8-F4. (b) Hydraulic conductivities vs. different grain sizes.
The failure pattern differs depending on the soil properties such as hydraulic conductivity and shear strength of the embankment body.
4.3. Role of Hydraulic Conductivity in Failure Progression
The extent of collapse was influenced by the permeability ratio difference with higher ratios leading to increased degrees of failure (e.g., kE/kF = 10 for IO-E7-F5 and kE/kF = 400 for IO-E8-F4). The failure progressed more slowly in Case II (IO-E7-F5), with only 60% of the downstream slope failing in about 70 min, while in Case IV (IO-E8-F4), the failure progressed more rapidly, with the whole downstream slope failing in just 18 min, and about 70% of the crest being ruptured by 90 min. This difference in the progress of failure can be attributed to the difference in the permeability of the sand in the foundation; the hydraulic conductivity with respect to mean grain size is shown in Figure 11b. In Case II, the foundation had a lower permeability, which resulted in a slower failure progression, whereas in Case IV, the higher permeability of the sand in the foundation led to a more rapid failure progression. Furthermore, the failure progression in Case IV was more rapid and extensive compared to Case II. Notably, the failure in Case IV extended beyond the downstream slope and affected the crest. This can be ascribed to the greater hydraulic conductivity of the sand in the foundation, which allowed water to flow more quickly through the soil, resulting in a more significant and rapid failure. Additionally, the higher permeability of the sand in the foundation in Case IV also led to a more rapid saturation line, or phreatic line, compared to Case II. This further contributed to the faster failure progression in Case IV.
5. Conclusions
In conclusion, this study investigated levee erosion during overflow and infiltration flow, with a focus on how the hydraulic conductivity and moisture condition of the levee and foundation materials affects erosion resistance. The following key findings emerged from the study.
- Levee erosion during overflow events involves four stages with varying flow characteristics and shear stresses, influencing erosion rates. Understanding the different flow regions on levees is crucial for assessing erosion risks and preventing failure. Identifying areas prone to rapid erosion such as the downstream edge of the crest and supercritical flow region allows for targeted reinforcement. Similarly, recognizing regions with minimal erosion like the upstream crest and subcritical flow region of the downstream toe helps prioritize maintenance efforts. This knowledge enhances the design and management of levee systems, improving their effectiveness in protecting against floods and minimizing the risk of catastrophic failure.
- During infiltration experiments, the failure mechanism of levee slopes involves progressive collapse due to piping, leading to increased liquefaction and loss of shear stress. The progression of failure is influenced by the permeability of the foundation material and shear strength. It was observed that the degree of collapse increases as the difference in permeability ratio becomes higher in the infiltration cases (e.g., kE/kF = 10 for IO-E7-F5 and kE/kF = 400 for IO-E8-F4). As infiltration progresses, the embankment slope undergoes a collapse and becomes fluid-like due to the decreasing shear strength of the embankment material, but the accumulation of muddy levee material near the slope toe slows down and eventually halts the collapse. This is because the sandy material (Mikawa Sand No. 7 and No. 8) comprising the embankment body experiences a decrease in shear strength under the influence of a high hydraulic gradient, leading to slip failure.
- The study found that the failure progression in Case II (IO-E7-F5) was slower due to the lower permeability of the sand in the foundation, resulting in a delayed and limited failure of the downstream slope (only 60 to 65% of downstream slope failure in about 90 min), which allows for more time to implement response and mitigation measures. In contrast, Case IV(IO-E8-F4) exhibited a more rapid and extensive failure, attributed to the greater hydraulic conductivity of the sand in the foundation (100% downstream slope in first 18 min and 70 to 75% crest failure in about 70 min), allowing for quicker water flow and a more significant impact on the downstream slope and the crest. These findings highlight the importance of taking proactive measures to strengthen vulnerable sections of the levee and minimize the risk of extensive failure.
This study serves as a foundation for future numerical simulations on infiltration and piping studies. Our study on levee erosion using a scaled-down model (1:20) provides valuable insights into failure mechanisms and proactive measures, enhancing levee resilience and risk reduction strategies. For future studies, conducting comparative analyses between scaled-down models and full-scale scenarios could further validate the findings and broaden the understanding of levee behavior under different conditions. Additional investigation is needed to investigate the effects of other factors, such as flow rate and sediment characteristics, on levee erosion during overflow and infiltration flow.
Author Contributions
Conceptualization, L.A. and N.T.; methodology, L.A. and N.T.; validation, N.T.; formal analysis, N.T.; investigation, resources and data curation, L.A. and N.T.; writing—original draft preparation, L.A.; writing—review and editing, N.T.; visualization, L.A.; supervision, N.T.; project administration, N.T. All authors have read and agreed to the published version of the manuscript.
Funding
This research received no external funding.
Institutional Review Board Statement
Not applicable.
Informed Consent Statement
Not applicable.
Data Availability Statement
The data presented in this study are available upon request from the corresponding author.
Acknowledgments
The corresponding author is thankful to the (MEXT) Government of Japan and Saitama University for providing the opportunity to conduct this research. The authors also acknowledge the anonymous reviewers for their valuable comments to improve this manuscript.
Conflicts of Interest
The authors declare no conflict of interest.
References
- Ohtsuki, K.; Itsukushima, R.; Sato, T. Feasibility of Traditional Open Levee System for River Flood Mitigation in Japan. Water 2022, 14, 1343. [Google Scholar] [CrossRef]
- Kundzewicz, Z.W.; Kanae, S.; Seneviratne, S.I.; Handmer, J.; Nicholls, N.; Peduzzi, P.; Mechler, R.; Bouwer, L.M.; Arnell, N.; Mach, K. Flood risk and climate change: Global and regional perspectives. Hydrol. Sci. J. 2014, 59, 1–28. [Google Scholar] [CrossRef]
- Xu, Y.J.; Lam, N.S.-N.; Liu, K.-b. Assessing Resilience and Sustainability of the Mississippi River Delta as a Coupled Natural-Human System. Water 2018, 10, 1317. [Google Scholar] [CrossRef]
- Kundzewicz, Z.W.; Graczyk, D.; Maurer, T.; Pińskwar, I.; Radziejewski, M.; Svensson, C.; Szwed, M. Trend detection in river flow series: 1. Annual maximum flow/Détection de tendance dans des séries de débit fluvial: 1. Débit maximum annuel. Hydrol. Sci. J. 2005, 50, 810. [Google Scholar] [CrossRef]
- Wilby, R.L.; Keenan, R. Adapting to flood risk under climate change. Prog. Phys. Geogr. 2012, 36, 348–378. [Google Scholar] [CrossRef]
- Sajjad, A.; Lu, J.; Aslam, R.W.; Ahmad, M. Flood Disaster Mapping Using Geospatial Techniques: A Case Study of the 2022 Pakistan Floods. Environ. Sci. Proc. 2023, 25, 78. [Google Scholar] [CrossRef]
- Taye, M.T.; Ntegeka, V.; Ogiramoi, N.; Willems, P. Assessment of climate change impact on hydrological extremes in two source regions of the Nile River Basin. Hydrol. Earth Syst. Sci. 2011, 15, 209–222. [Google Scholar] [CrossRef]
- Batista, L.F.D.R.; Ribeiro Neto, A. Conceptual and Analytical Framework as Flood Risk Mapping Subsidy. GeoHazards 2022, 3, 395–411. [Google Scholar] [CrossRef]
- Ohtsuka, S.; Sato, Y.; Yoshikawa, T.; Sugii, T.; Kodaka, T.; Maeda, K. Levee damage and revetment erosion by the 2019 Typhoon Hagibis in the Chikuma River, Japan. Soils Found. 2021, 61, 1172–1188. [Google Scholar] [CrossRef]
- Vallés, P.; Echeverribar, I.; Mairal, J.; Martínez-Aranda, S.; Fernández-Pato, J.; García-Navarro, P. 2D Numerical Simulation of Floods in Ebro River and Analysis of Boundary Conditions to Model the Mequinenza Reservoir Dam. GeoHazards 2023, 4, 136–156. [Google Scholar] [CrossRef]
- Auliagisni, W.; Wilkinson, S.; Elkharboutly, M. Learning from Floods-How a Community Develops Future Resilience. Water 2022, 14, 3238. [Google Scholar] [CrossRef]
- Milana, J.P.; Geisler, P. Forensic Geology Applied to Decipher the Landslide Dam Collapse and Outburst Flood of the Santa Cruz River (12 November 2005), San Juan, Argentina. GeoHazards 2022, 3, 252–276. [Google Scholar] [CrossRef]
- Zhang, J.; Li, Y.; Xuan, G.; Wang, X.; Li, J. Overtopping breaching of cohesive homogeneous earth dam with different cohesive strength. Sci. China Ser. E Technol. Sci. 2009, 52, 3024–3029. [Google Scholar] [CrossRef]
- Takizawa, A.; Horikoshi, K.; Takahashi, A. Physical modelling of backward erosion piping in layered levee foundation. In Proceedings of the 9th International Conference on Scour and Erosion, Taipei, Taiwan, 5–8 November 2018; pp. 33–38. [Google Scholar]
- Mori, S.; Ono, K. Landslide disasters in Ehime Prefecture resulting from the July 2018 heavy rain event in Japan. Soils Found. 2019, 59, 2396–2409. [Google Scholar] [CrossRef]
- Krishnan, S.; Lin, J.; Simanjuntak, J.; Hooimeijer, F.; Bricker, J.; Daniel, M.; Yoshida, Y. Interdisciplinary Design of Vital Infrastructure to Reduce Flood Risk in Tokyo’s Edogawa Ward. Geosciences 2019, 9, 357. [Google Scholar] [CrossRef]
- Nakagawa, H.; Mizutani, H.; Kawaike, K. Recent Flood Disasters Caused by River Embankment Failure in Japan and Numerical Modelling of Embankment Failure. In Proceedings of the 14th International Symposium on River Sedimentation, Chengdu, China, 16–19 September 2019. [Google Scholar]
- Serre, D.; Peyras, L.; Tourment, R.; Diab, Y. Levee performance assessment methods integrated in a GIS to support planning maintenance actions. J. Infrastruct. Syst. 2008, 14, 201–213. [Google Scholar] [CrossRef]
- Sills, G.; Vroman, N.; Wahl, R.; Schwanz, N. Overview of New Orleans levee failures: Lessons learned and their impact on national levee design and assessment. J. Geotech. Geoenviron. Eng. 2008, 134, 556–565. [Google Scholar] [CrossRef]
- Costa, J.E. Floods from Dam Failures; US Geological Survey: Reston, VA, USA, 1985; Volume 85, No. 560.
- Foster, M.; Fell, R.; Spannagle, M. The statistics of embankment dam failures and accidents. Can. Geotech. J. 2000, 37, 1000–1024. [Google Scholar] [CrossRef]
- Simmler, H.; Samet, L. Dam failure from overtopping studied on a hydraulic model. In Proceedings of the ICOLD, Fourteenth Congress, Rio de Janeiro, Brazil, 3–7 May 1982; Volume 1, pp. 427–445. [Google Scholar]
- ASCE/EWRI Task Committee on Dam/Levee Breaching. Earthen embankment breaching. J. Hydraul. Eng. 2011, 137, 1549–1564. [Google Scholar] [CrossRef]
- Hanson, G.; Cook, K.; Hunt, S. Physical modeling of overtopping erosion and breach formation of cohesive embankments. Trans. ASAE 2005, 48, 1783–1794. [Google Scholar] [CrossRef]
- Powledge, G.R.; Ralston, D.C.; Miller, P.; Chen, Y.H.; Clopper, P.E.; Temple, D. Mechanics of overflow erosion on embankments. I: Research activities. J. Hydraul. Eng. 1989, 115, 1040–1055. [Google Scholar] [CrossRef]
- Nocilla, A.; Bassi, A.; Rosso, A.; Turla, G.; Zimbardo, M. Flowable Mixtures of Treated Soils for Repairing Damage Caused by Burrowing Animals. Minerals 2023, 13, 738. [Google Scholar] [CrossRef]
- Ceccato, F.; Malvestio, S.; Simonini, P. Effect of Animal Burrows on the Vulnerability of Levees to Concentrated Erosion. Water 2022, 14, 2777. [Google Scholar] [CrossRef]
- Orlandini, S.; Moretti, G.; Albertson, J.D. Evidence of an emerging levee failure mechanism causing disastrous floods in Italy. Water Resour. Res. 2015, 51, 7995–8011. [Google Scholar] [CrossRef]
- Vacondio, R.; Aureli, F.; Ferrari, A.; Mignosa, P.; Dal Palu, A. Simulation of the January 2014 flood on the Secchia River using a fast and high-resolution 2D parallel shallow-water numerical scheme. Nat. Hazards 2016, 80, 103–125. [Google Scholar] [CrossRef]
- Sjödahl, P.; Johansson, S. Experiences from internal erosion detection and seepage monitoring based on temperature measurements on Swedish embankment dams. In Proceedings of the 34th International Conference on Software Engineering, Paris, France, 2–9 June 2012. [Google Scholar]
- Refice, A.; Capolongo, D.; Chini, M.; D’Addabbo, A. Improving flood detection and monitoring through remote sensing. Water 2022, 14, 364. [Google Scholar] [CrossRef]
- Cesali, C.; Federico, V. Detection of Permeability Defects within Dams and Levees through Coupled Seepage and Heat Transport Analyses. In Internal Erosion in Earthdams, Dikes and Levees: Proceedings of EWG-IE 26th Annual Meeting 2018 26; Springer International Publishing: Berlin/Heidelberg, Germany, 2019; pp. 245–257. [Google Scholar]
- Kurakami, Y.; Nihei, Y.; Morita, M.; Futami, S.; Itakura, M. Effect of River Levee with Geosynthetic-Reinforced Soil against Overflow Erosion Infiltration. In Hydraulic Structures and Water System Management, Proceedings of the 6th IAHR International Symposium on Hydraulic Structures, Portland, OR, USA, 27–30 June 2016; Crookston, B., Tullis, B., Eds.; ISHS 2022: Leuven, Belgium, 2016; pp. 302–311. ISBN 978-1-884575-75-4. [Google Scholar] [CrossRef]
- Ponce, V.M. Documented Cases of Earth Dam Breaches; SDSU Civil Engineering Series, No. 82149; San Diego State University: San Diego, CA, USA, 1982. [Google Scholar]
- Honjo, Y.; Mori, H.; Ishihara, M.; Otake, Y. On the inspection of river levee safety in Japan by, M.L.I.T. In Geotechnical Safety and Risk V; IOS Press: Washington, DC, USA, 2015; pp. 873–878. [Google Scholar]
- Orense, R.P.; Shimoma, S.; Maeda, K.; Towhata, I. Instrumented model slope failure due to water seepage. J. Nat. Disaster Sci. 2004, 26, 15–26. [Google Scholar] [CrossRef]
- Chinnarasri, C.; Tingsanchali, T.; Weesakul, S.; Wongwises, S. Flow patterns and damage of dike overtopping. Int. J. Sediment Res. 2003, 18, 301–309. [Google Scholar]
- Saito, H.; Maeda, K.; Izumi, N.; Li, Z. Water leakpiping behaviors of river levees with different foundation ground properties under loading duration of high water level. Adv. River Eng. 2015, 21, 349–354. [Google Scholar]
- Jia, G.W.; Zhan, T.L.; Chen, Y.M.; Fredlund, D.G. Performance of a large-scale slope model subjected to rising and lowering water levels. Eng. Geol. 2009, 106, 92–103. [Google Scholar] [CrossRef]
- van Beek, V.M.; Knoeff, H.; Sellmeijer, H. Observations on the process of backward erosion piping in small-, medium-and full-scale experiments. Eur. J. Environ. Civ. Eng. 2011, 15, 1115–1137. [Google Scholar] [CrossRef]
Disclaimer/Publisher’s Note: The statements, opinions and data contained in all publications are solely those of the individual author(s) and contributor(s) and not of MDPI and/or the editor(s). MDPI and/or the editor(s) disclaim responsibility for any injury to people or property resulting from any ideas, methods, instructions or products referred to in the content. |
© 2023 by the authors. Licensee MDPI, Basel, Switzerland. This article is an open access article distributed under the terms and conditions of the Creative Commons Attribution (CC BY) license (https://creativecommons.org/licenses/by/4.0/).