
A Quantitative Approach to Assess Seismic Vulnerability of Touristic Accommodations: Case Study in Montreal, Canada


Abstract
:1. Introduction
2. Materials and Methods
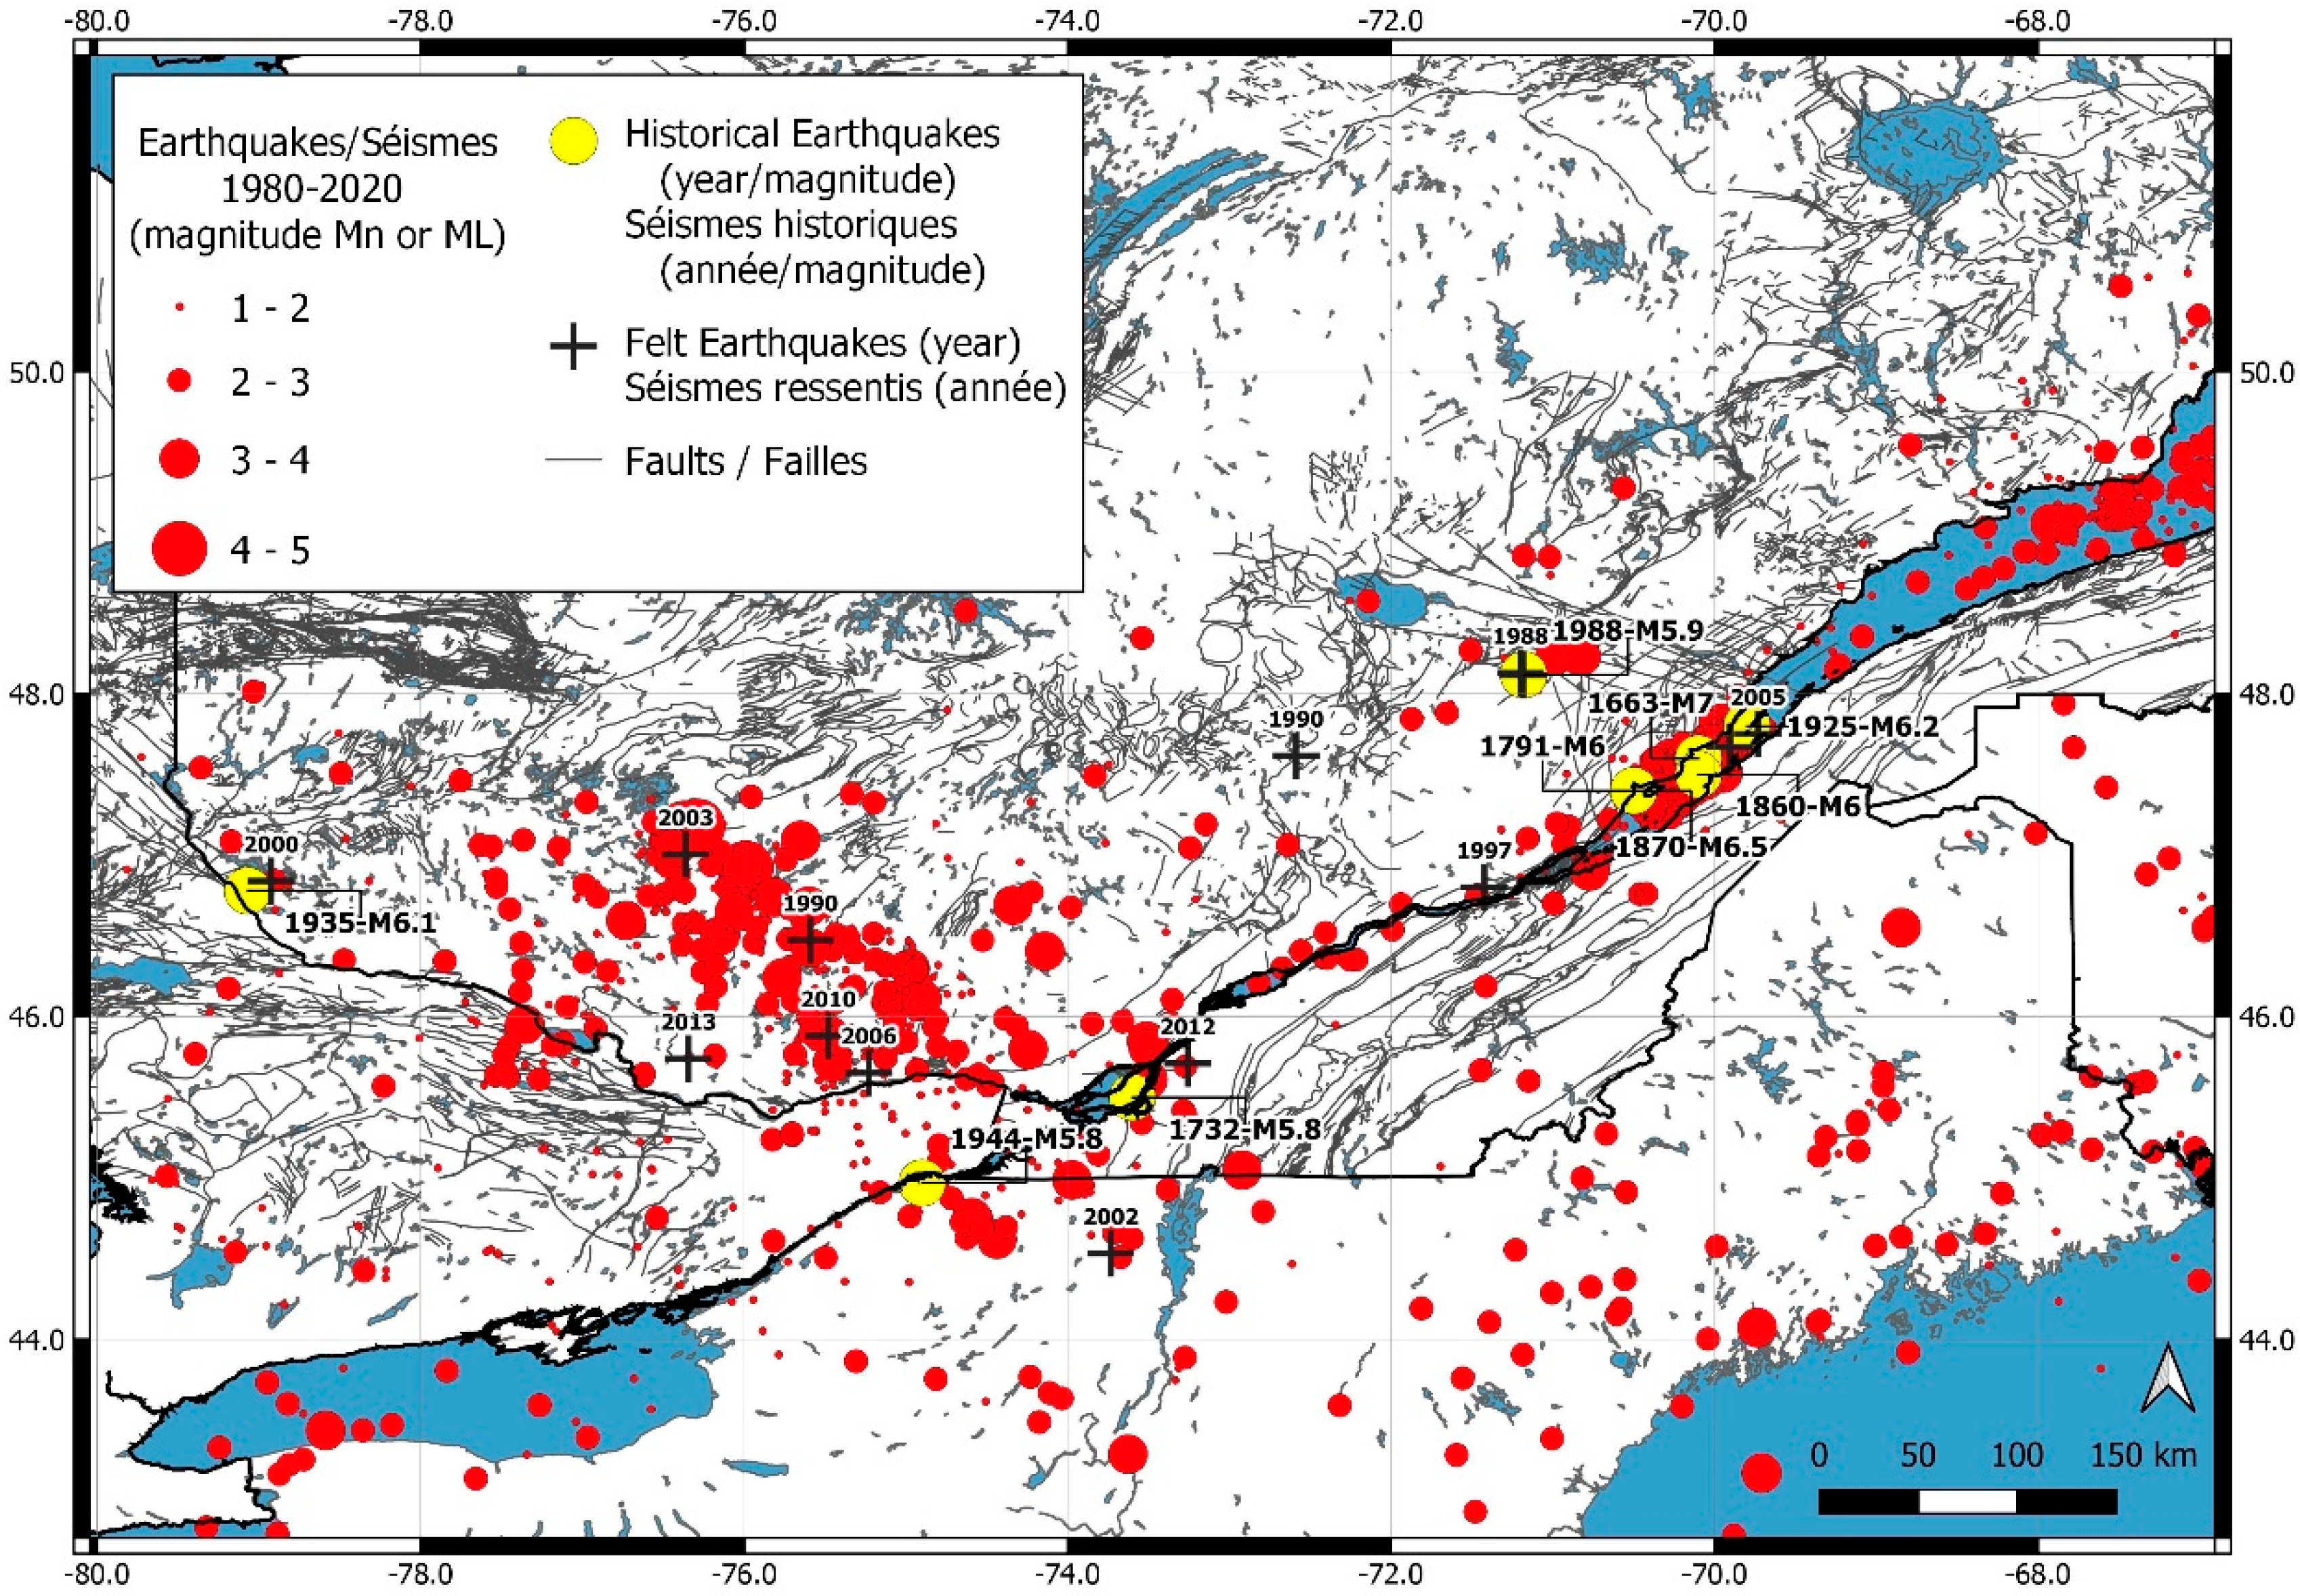
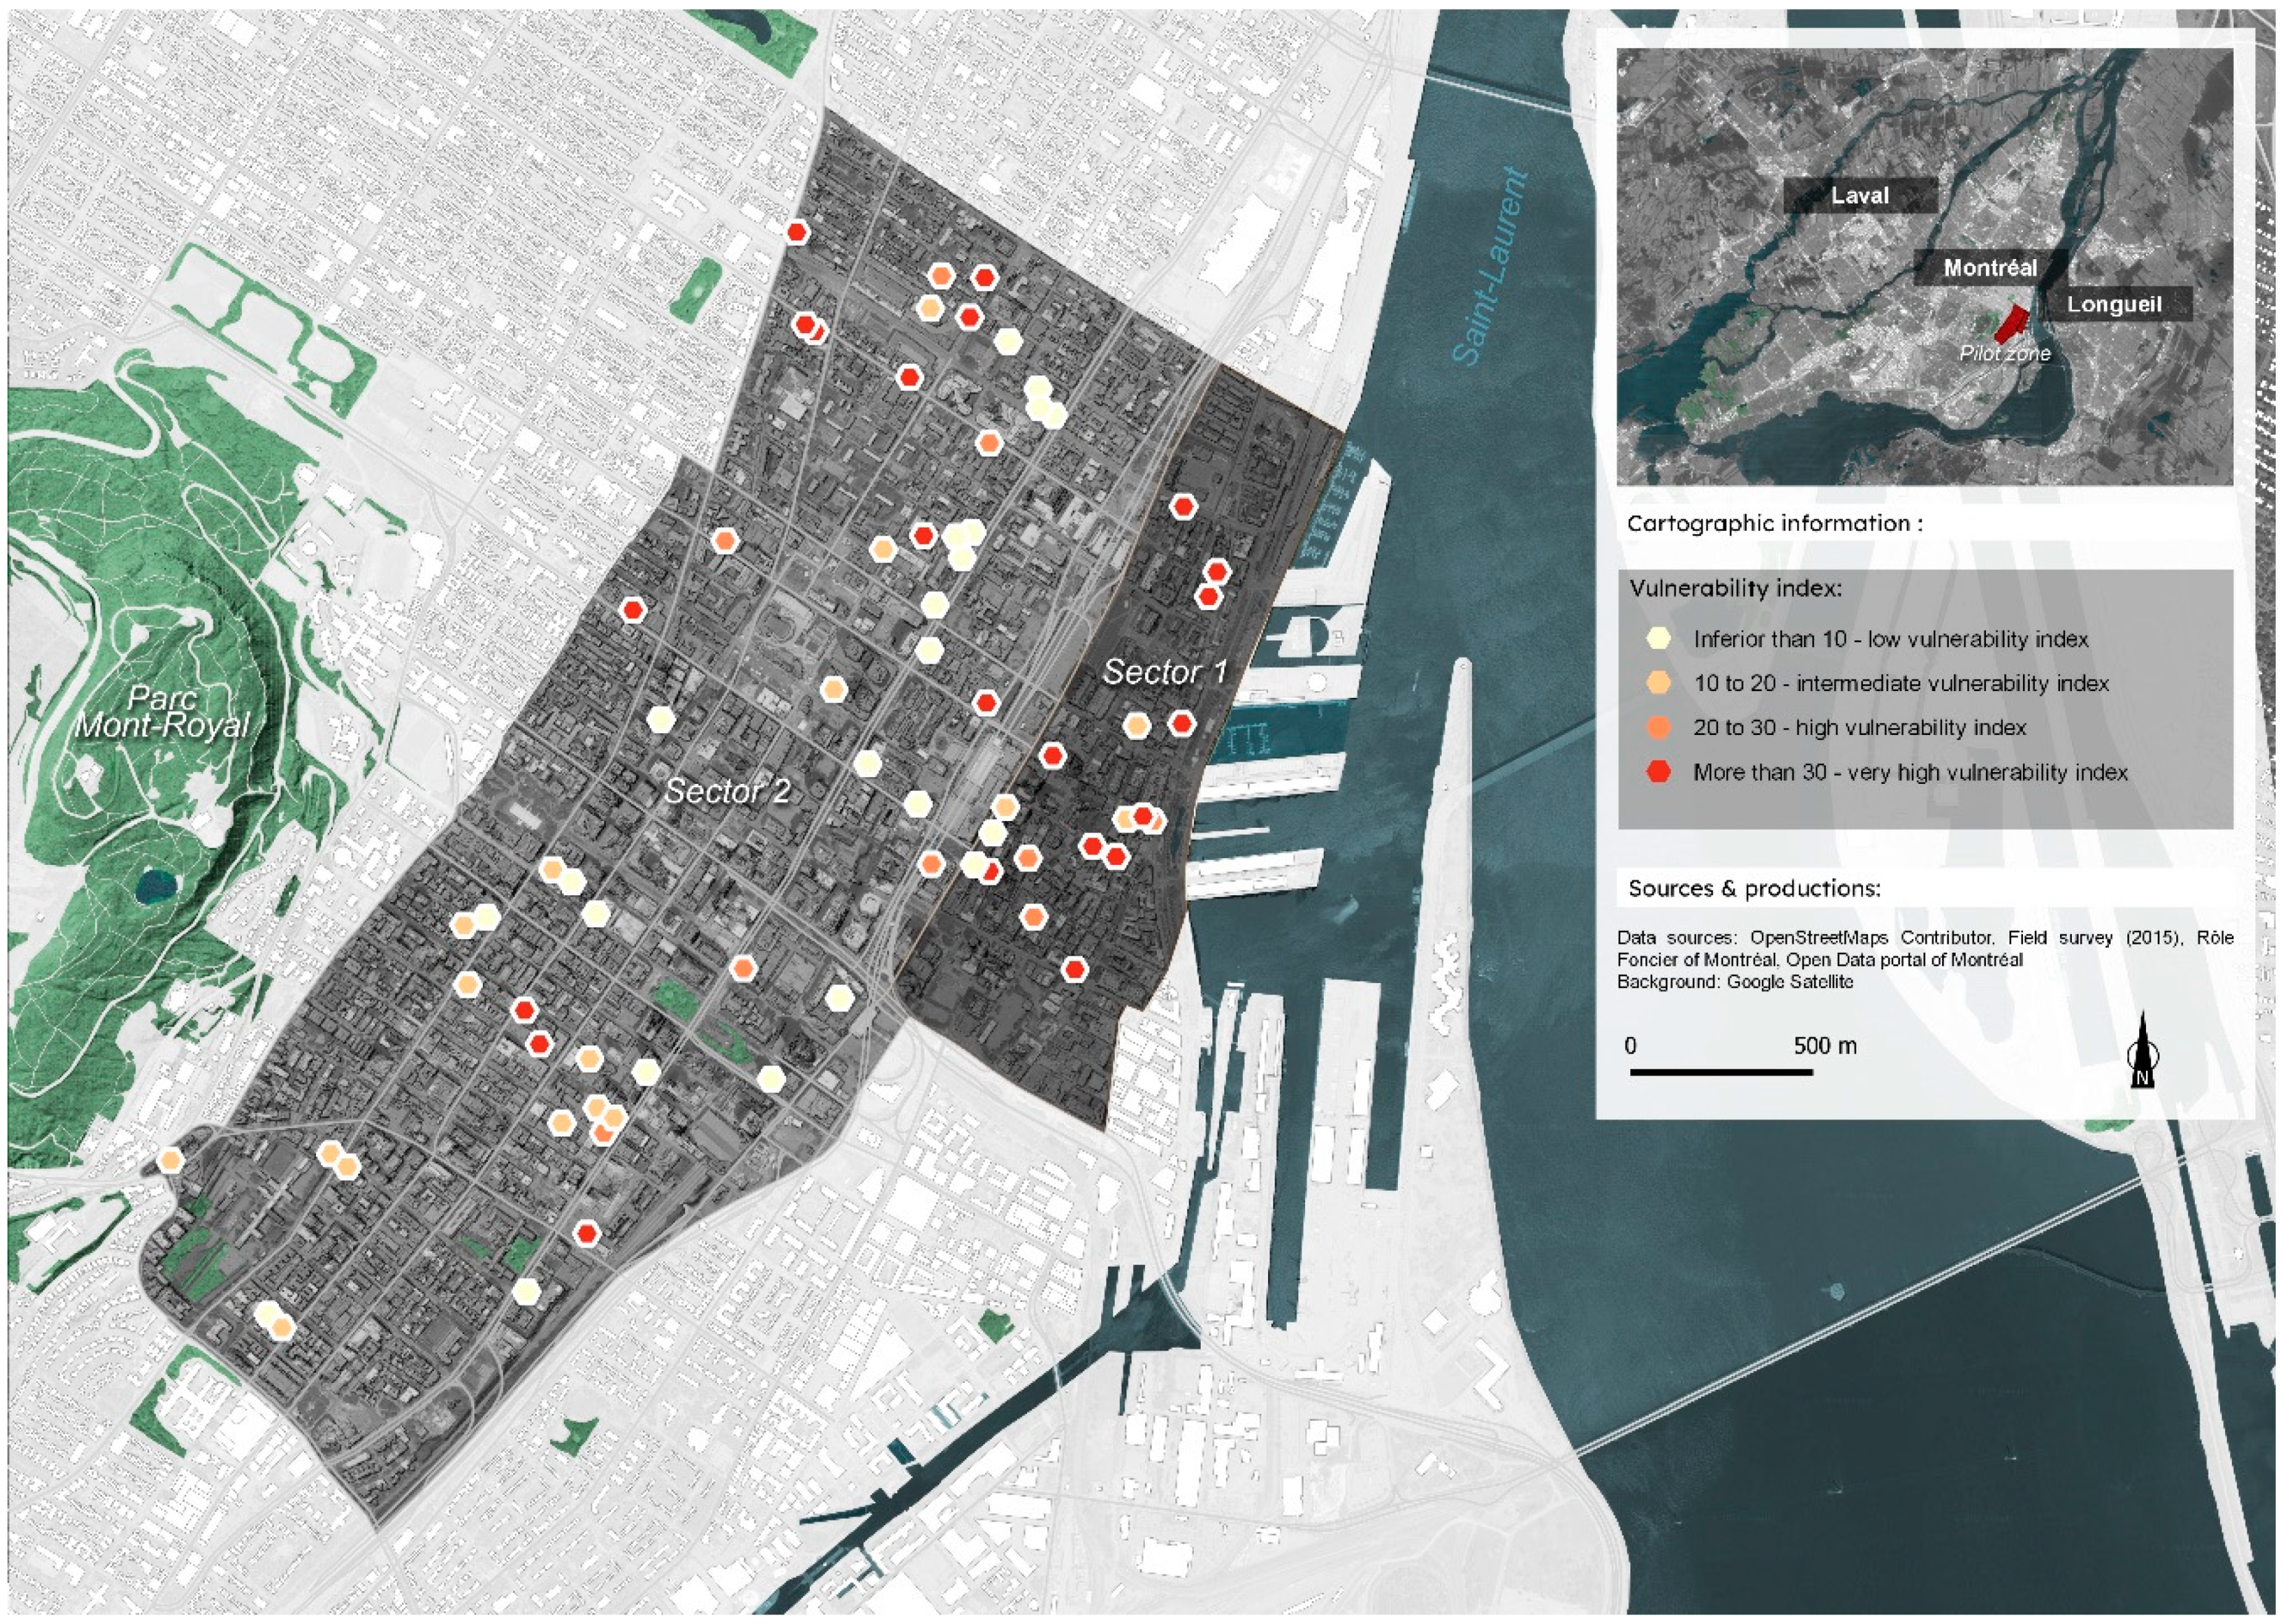
2.1. The Pilot Study Zone
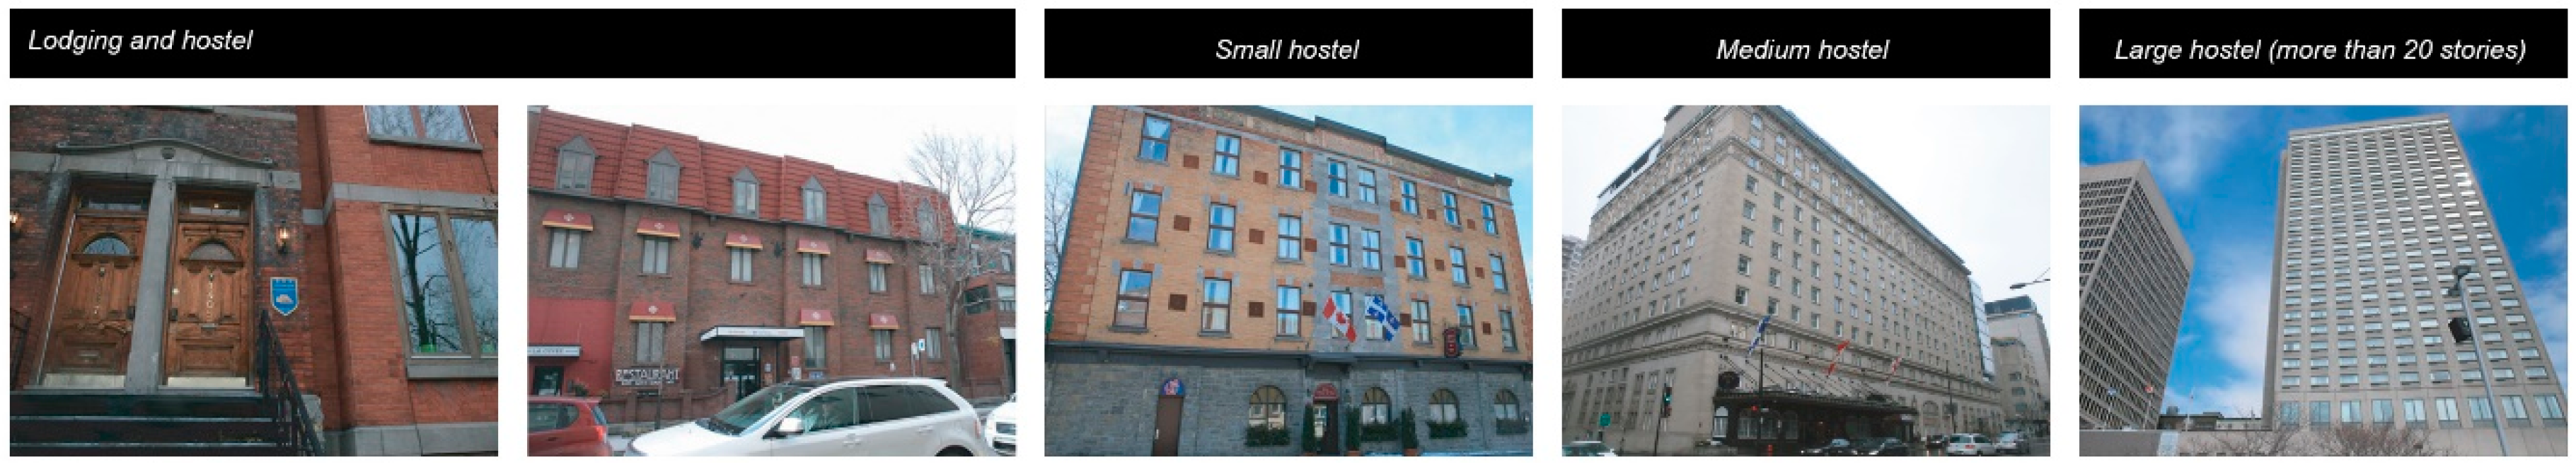
- Bed and breakfasts including lodging houses and youth hostels. These often consist of individual or multiple wood frame dwellings. The hostels are larger than private lodgings, which have 3 to 5 floors.
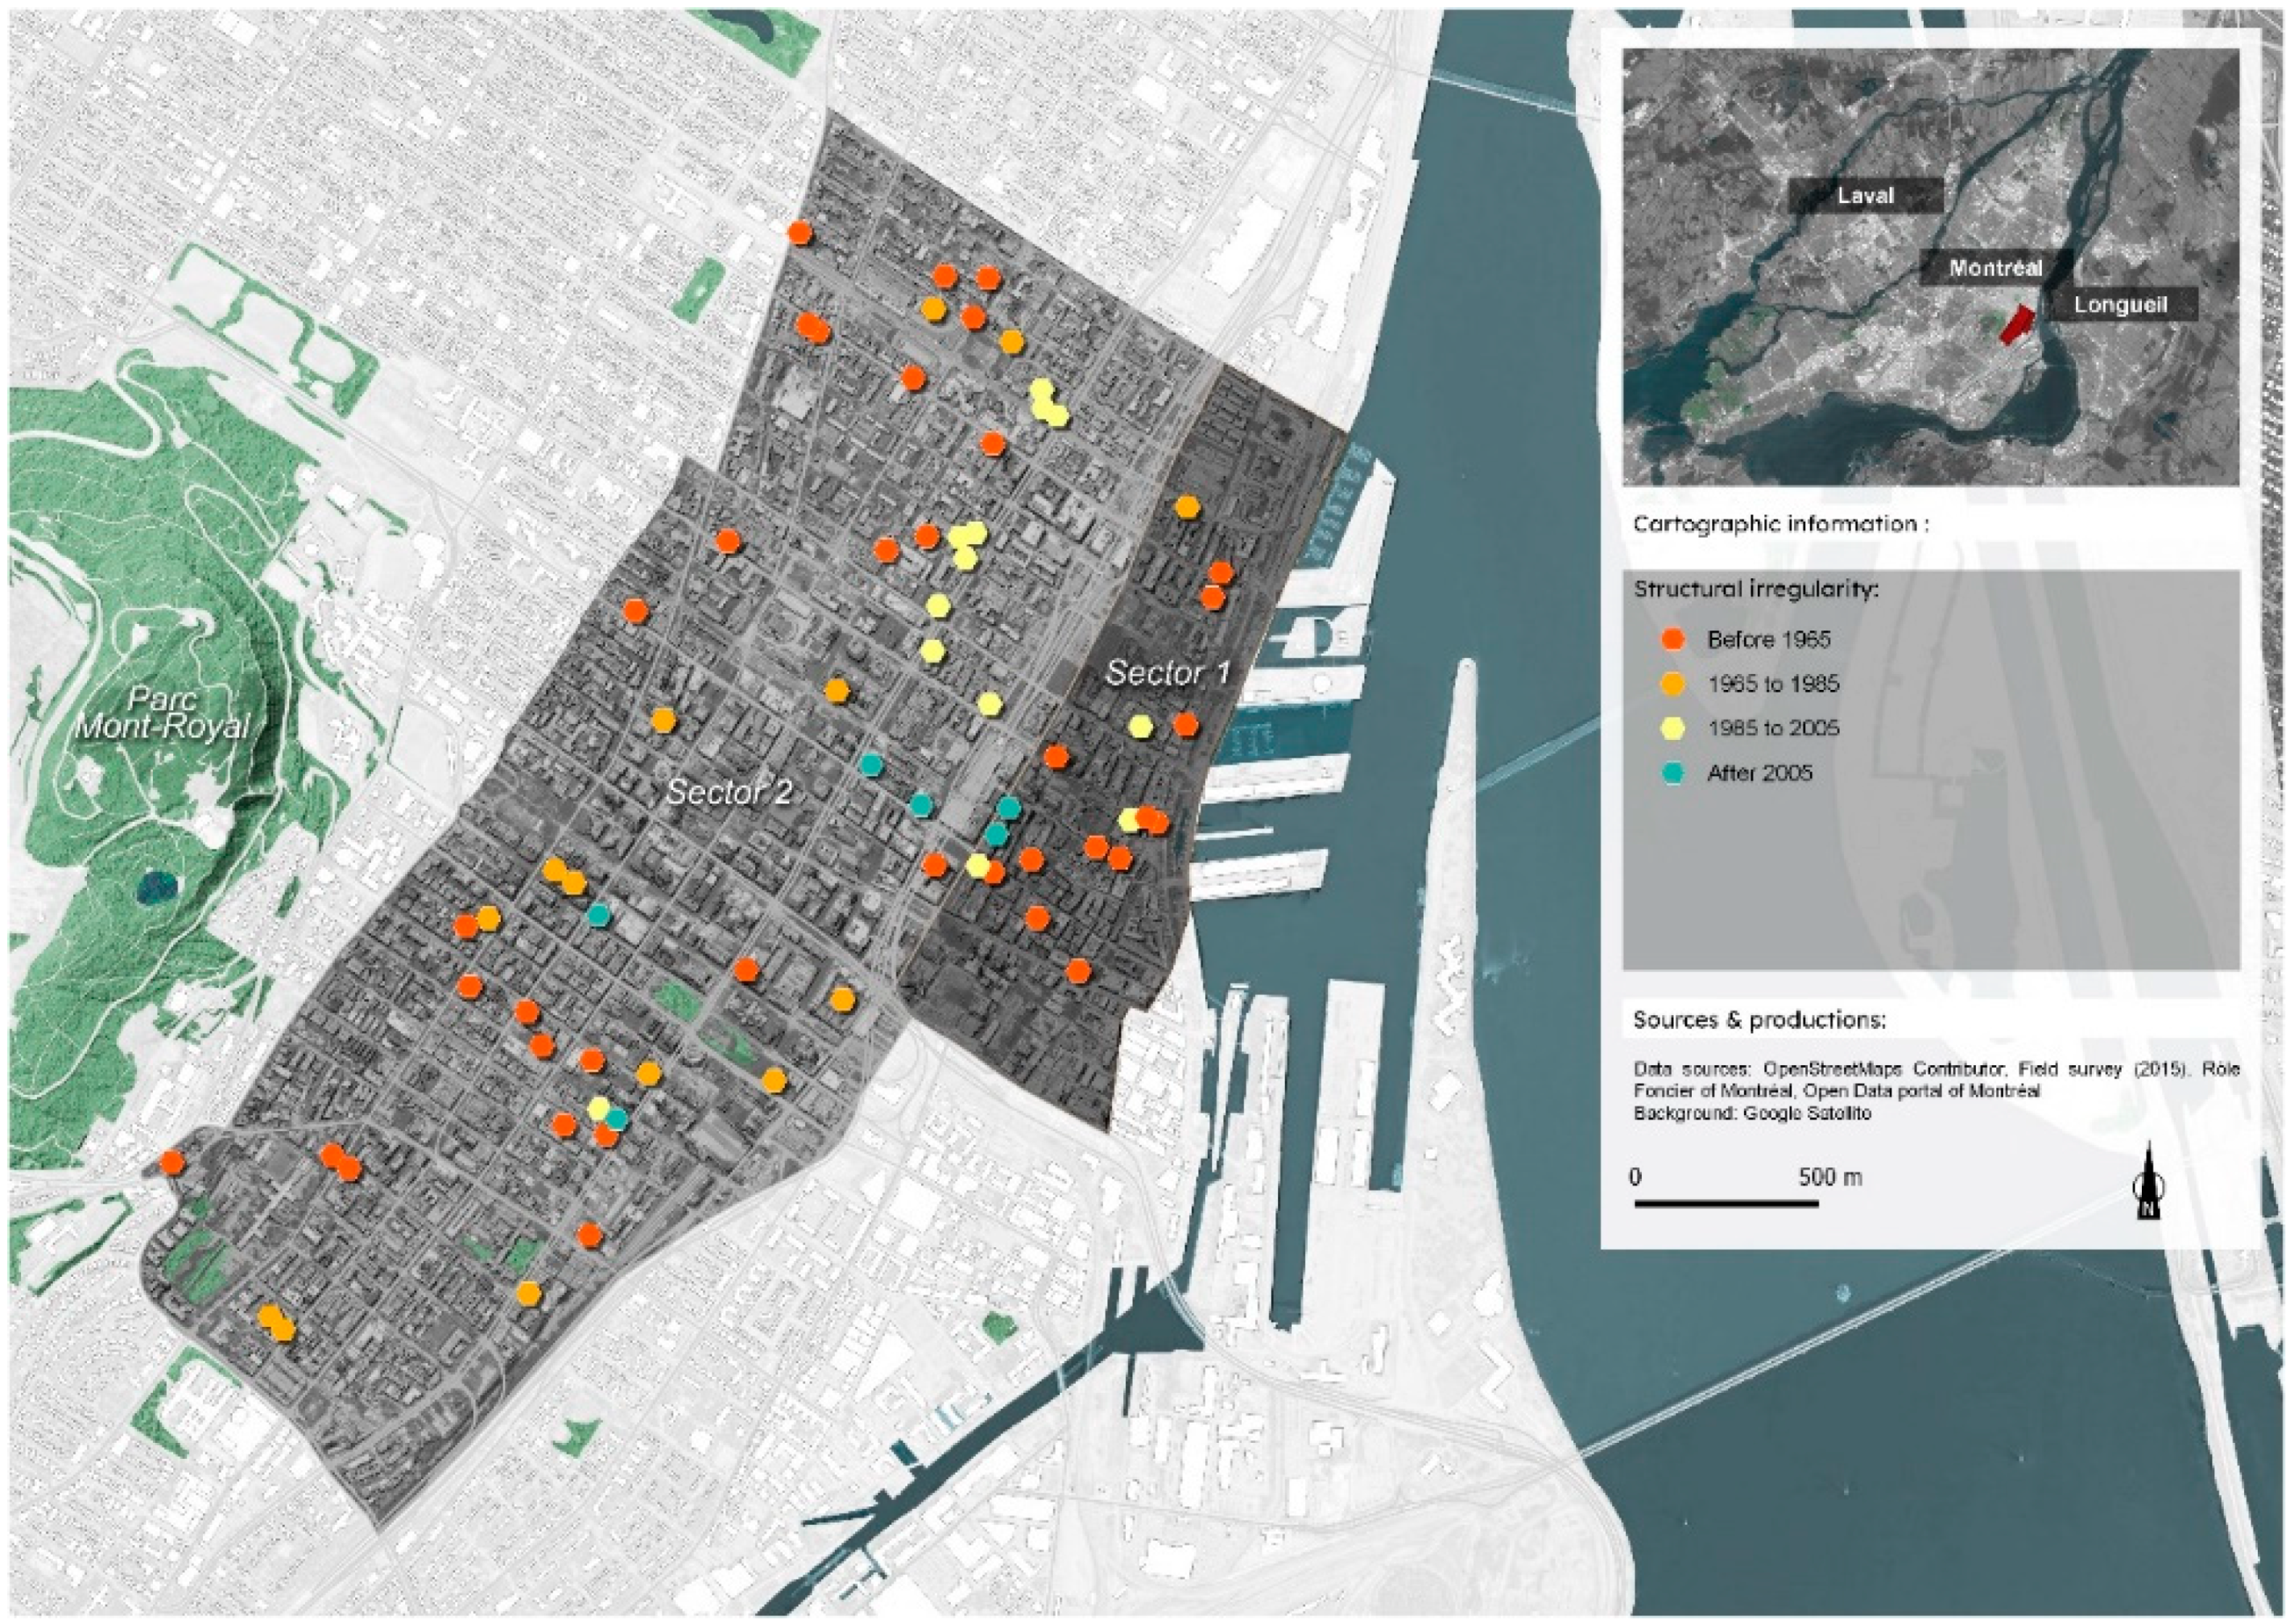
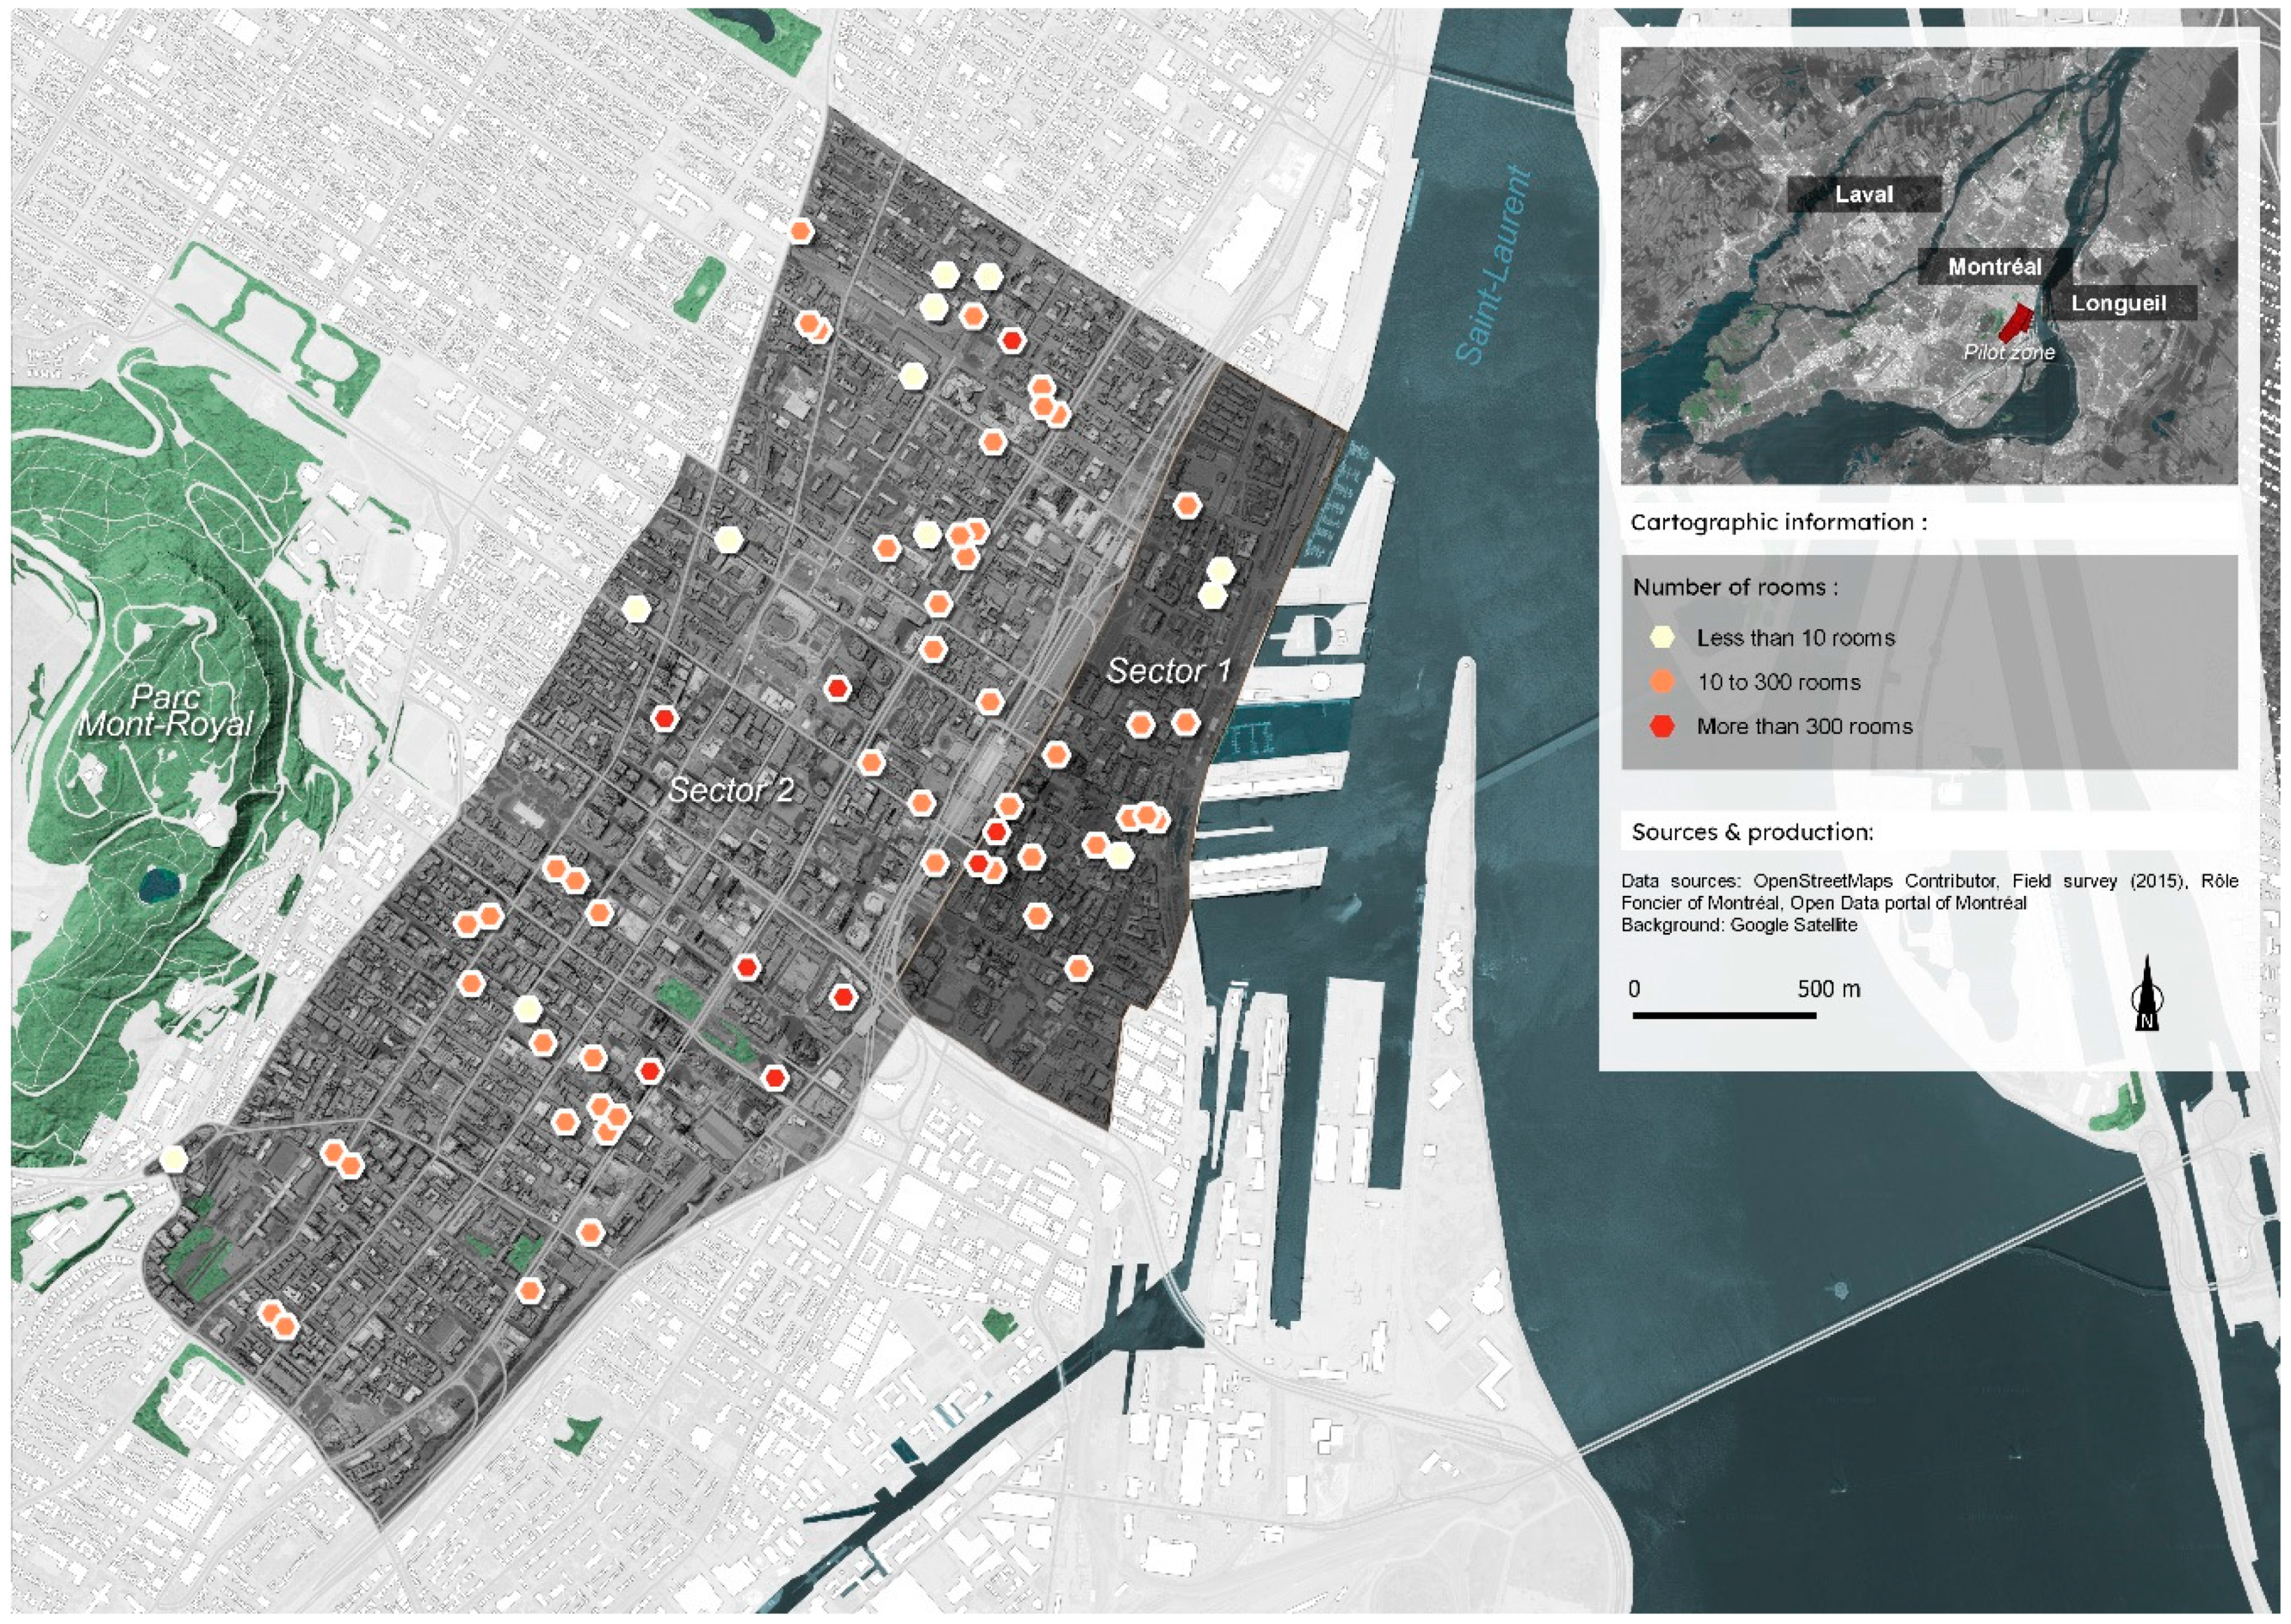
- Small hotels. These have less than four floors and a maximum of 30 rooms. They are mostly located in the sector-1 old-port area and were generally built before 1965, predating the first modern building seismic code. The economic value of each building depends on the age of the building, the star rating of the accommodations, and the average occupancy rate.
- Intermediate hotels. These have more than 30 rooms and often with a number of floors between 4 and 7. The construction type is mainly reinforced masonry with construction dates between 1900 and 2010. They are classified as hotels with three to four stars.
- Large hotels. These are tall buildings with more than 20 floors of steel and concrete frame types.
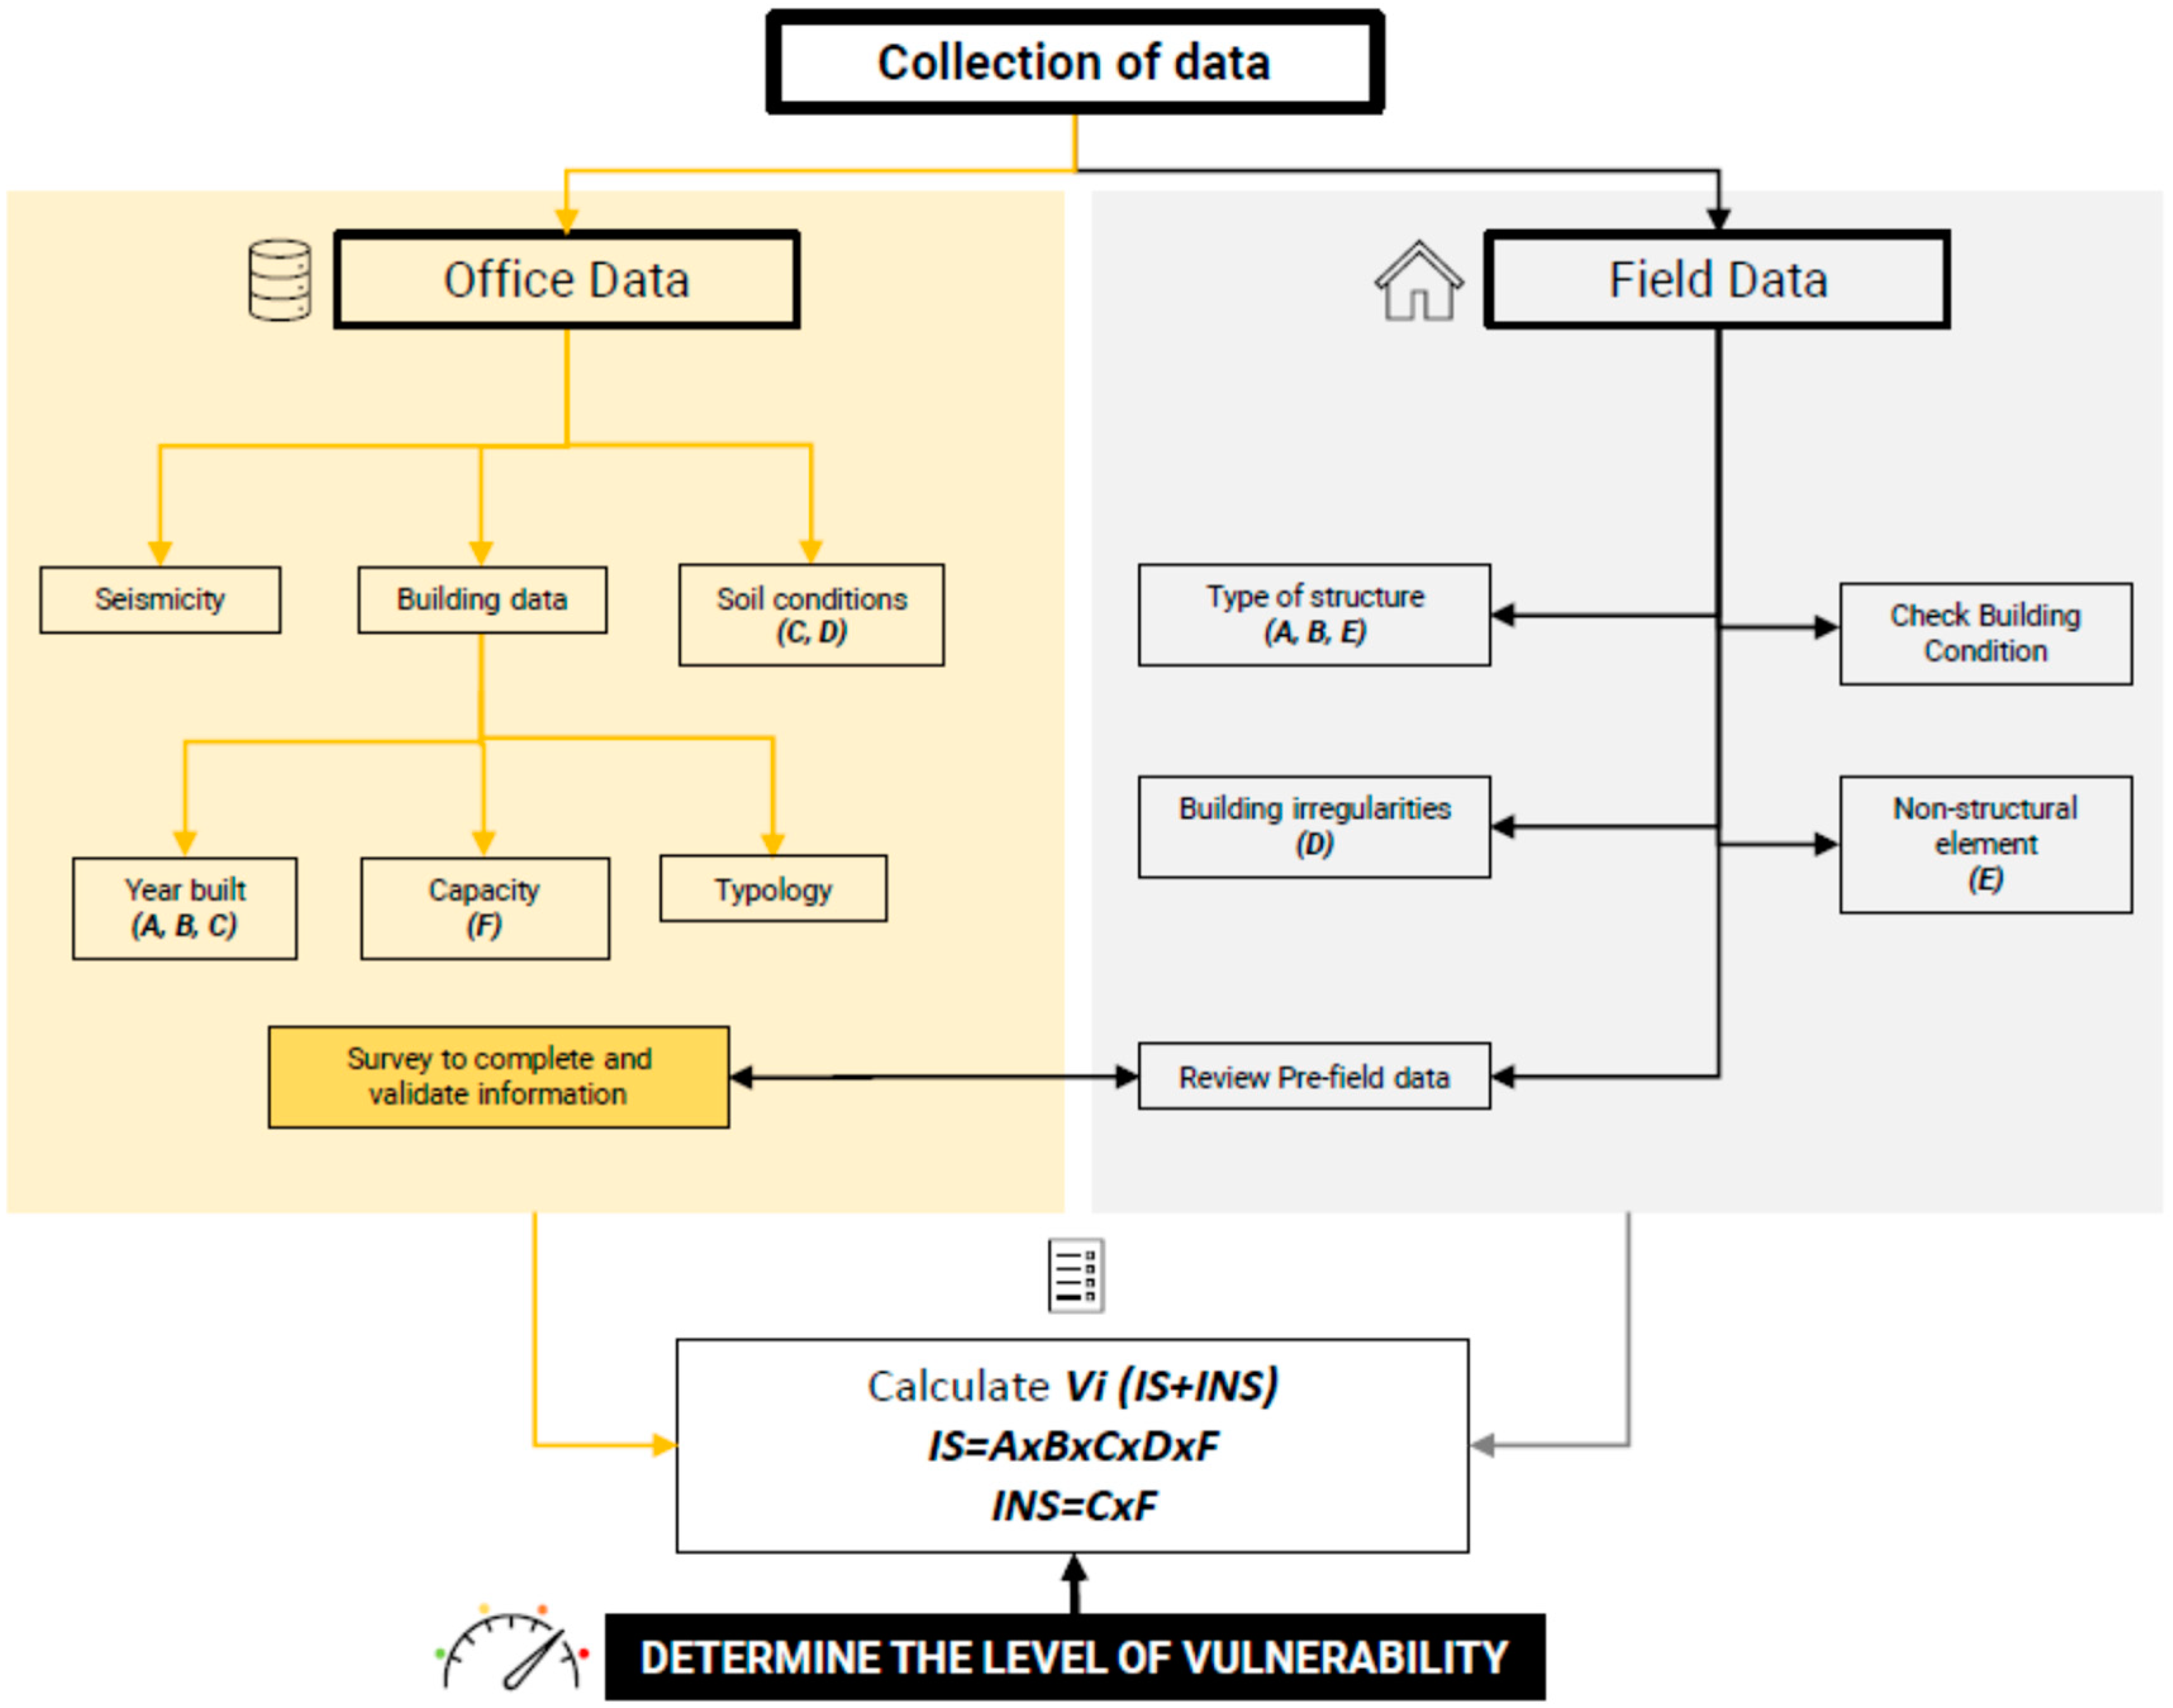
2.2. Method to Assess the Vulnerability of the Hotel Sector
3. Results
3.1. Estimated Vulnerability index of Hotels in the Pilot Zone
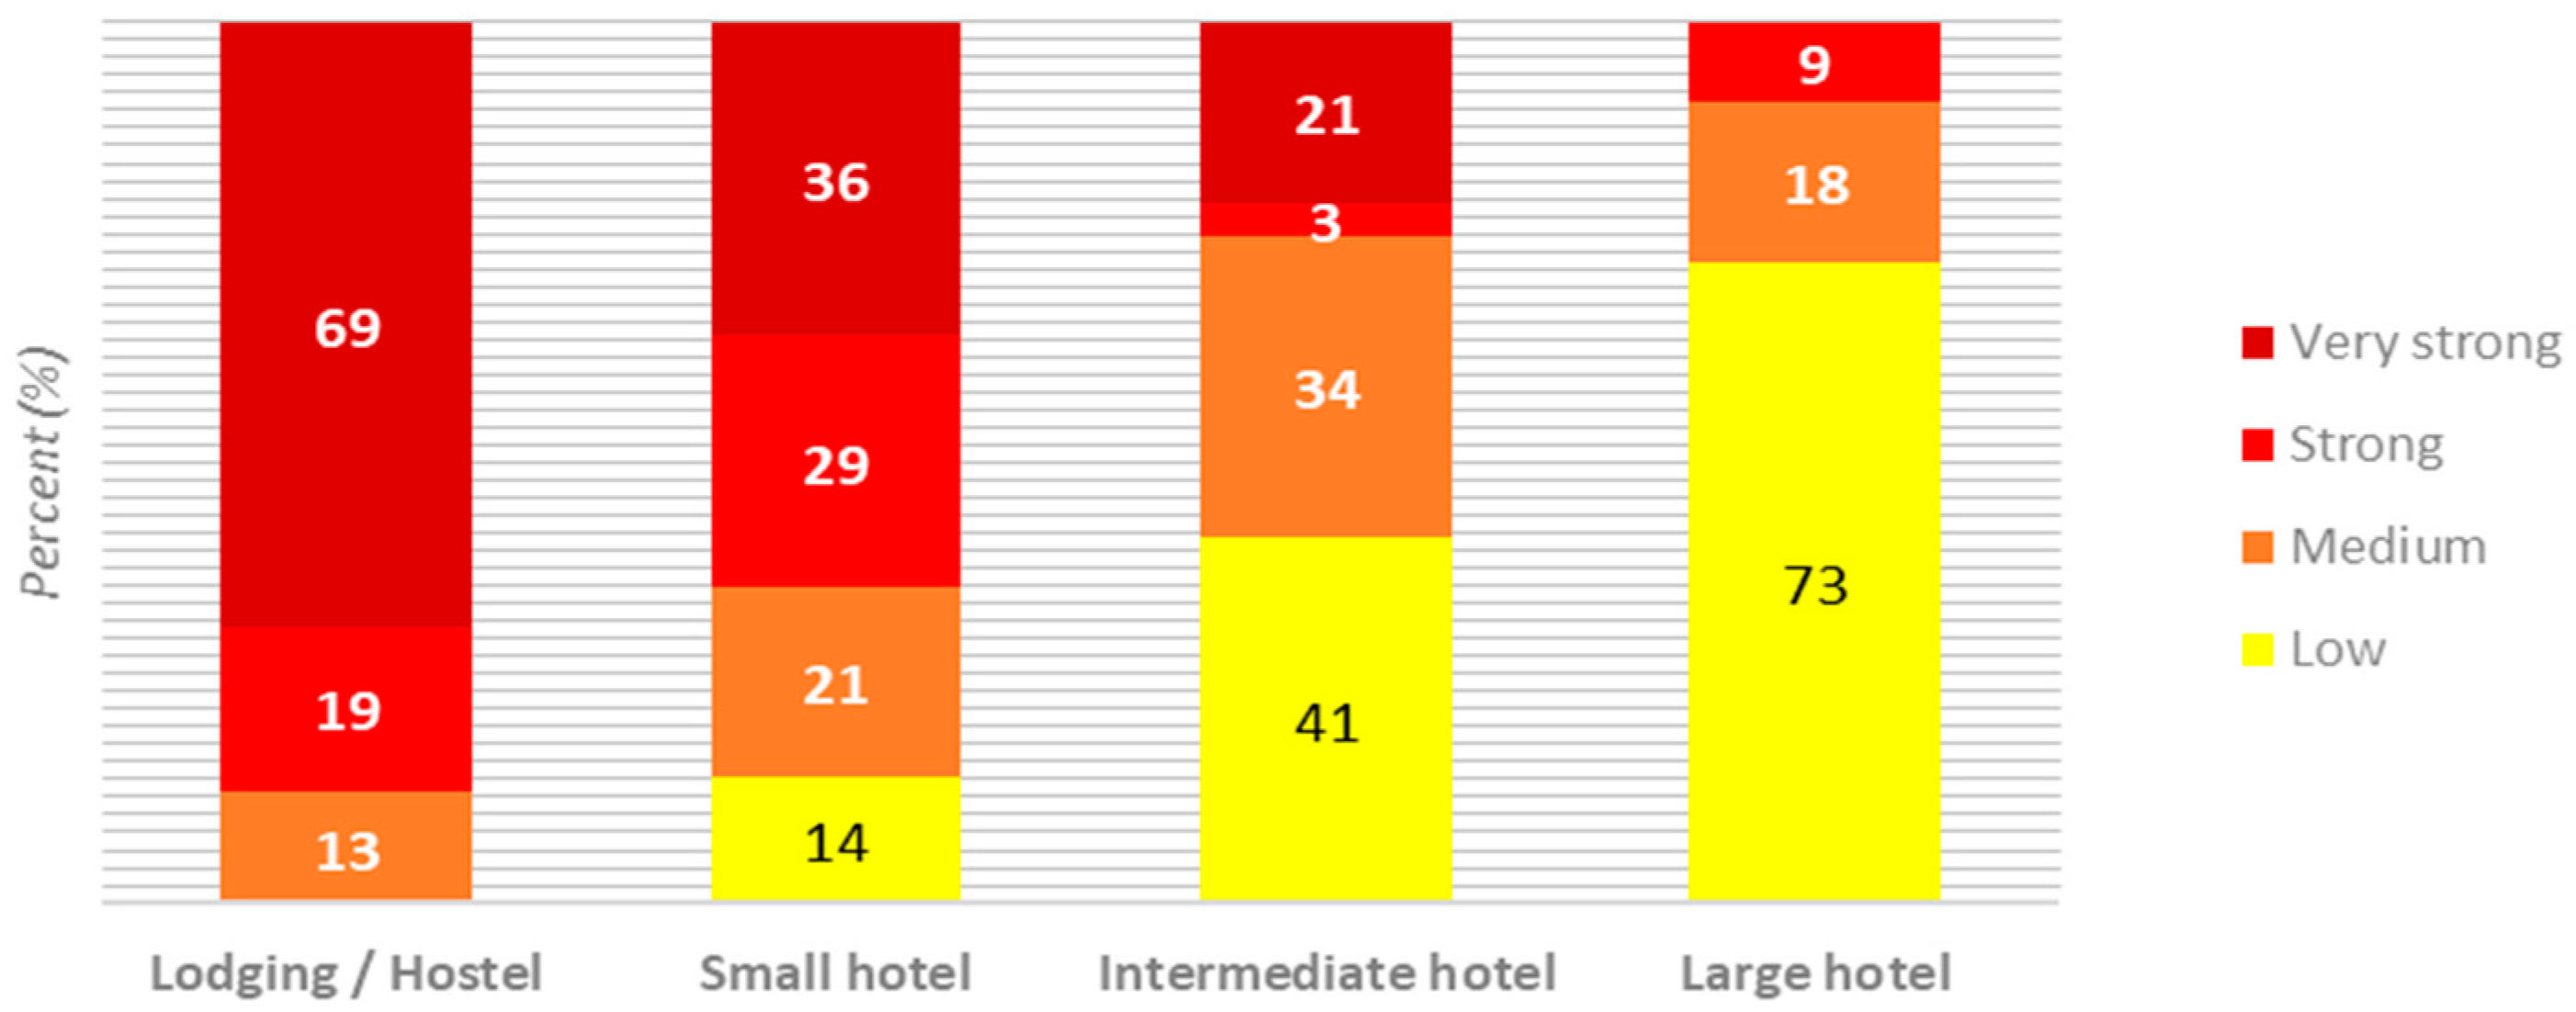
3.2. Correlation between Structural Vulnerability and the Preparedness Capacity
4. Discussion
5. Conclusions
Author Contributions
Funding
Institutional Review Board Statement
Informed Consent Statement
Data Availability Statement
Acknowledgments
Conflicts of Interest
Appendix A
References
- Mazzocchi, M.; Montini, A. Earthquake Effects on Tourism in Central Italy. Ann. Tour. Res. 2001, 28, 1031–1046. [Google Scholar] [CrossRef]
- Yang, W.; Wang, D.; Chen, G. Reconstruction Strategies after the Wenchuan Earthquake in Sichuan, China. Tour. Manag. 2011, 32, 949–956. [Google Scholar] [CrossRef]
- Delamotte, G. L’économie Japonaise Après Fukushima. SciencesPo CERI CNRS 2012, 7. [Google Scholar]
- Filimonau, V.; De Coteau, D. Tourism Resilience in the Context of Integrated Destination and Disaster Management (DM2). Int. J. Tour. Res. 2020, 22, 202–222. [Google Scholar] [CrossRef] [Green Version]
- Tsai, C.-H.; Chen, C.-W. Development of a Mechanism for Typhoon-and Flood-Risk Assessment and Disaster Management in the Hotel Industry–A Case Study of the Hualien Area. Scand. J. Hosp. Tour. 2011, 11, 324–341. [Google Scholar] [CrossRef]
- Mair, J.; Ritchie, B.W.; Walters, G. Towards a Research Agenda for Post-Disaster and Post-Crisis Recovery Strategies for Tourist Destinations: A Narrative Review. Curr. Issues Tour. 2016, 19, 1–26. [Google Scholar] [CrossRef]
- Wilkinson, E.; Twigg, J.; Few, R. Building Back Better: A Resilience Caribbean after the 2017 Hurricanes; Overseas Development Institute (ODI): London, UK, 2018. [Google Scholar]
- Mackay, E.A.; Spencer, A. The Future of Caribbean Tourism: Competition and Climate Change Implications. Worldw. Hosp. Tour. Themes 2017, 9, 44–59. [Google Scholar] [CrossRef]
- Gross, M. After Maria’s Devastation, Can Dominica Be a Destination Again. New York Times, 19 March 2018; 19. [Google Scholar]
- Orchiston, C.H. Tourism and Seismic Risk: Perceptions, Preparedness and Resilience in the Zone of the Alpine Fault, Southern Alps, New Zealand. Curr. Issues Tour. 2013, 16, 477–494. [Google Scholar] [CrossRef]
- Dhellemmes, A. Vulnérabilité et Résilience du Secteur Touristique de San Francisco Face à un Séisme Majeur; Département de Géographie, Université de Paul-Valéry: Montpellier, France, 2014; Volume 3, p. 131. [Google Scholar]
- Rosa, D. The Boxing Day Tsunami and Its Effects on Thailand’s Tourism. 2012. Available online: http://www.neumann.edu/academics/divisions/business/journal/review2012/rosa.pdf (accessed on 1 June 2016).
- FEMA. Rapid Visual Screening of Buildings for Potential Seismic Hazards: A Handbook; FEMA: Washington, DC, USA, 2015; p. 388. [Google Scholar]
- National Research Council of Canada. Construction Research Centre. Manual for Screening of Buildings for Seismic Investigation, Institute for Research in Construction; National Research Council Canada: Ottawa, OT, Canada, 1992; p. 107. [Google Scholar]
- Canadian Commission on Building and Fire Codes. National Building Code of Canada: 2005; Canadian Commission on Building and Fire Codes National Research Council of Canada: Ottawa, ON, Canada, 2005. [Google Scholar]
- Alam, N.; Alam, M.S.; Tesfamariam, S. Buildings’ seismic vulnerability assessment methods: A comparative study. Nat. Hazards 2012, 62, 405–424. [Google Scholar] [CrossRef]
- Harirchian, E.; Hosseini, S.E.A.; Jadhav, K.; Kumari, V.; Rasulzade, S.; Işık, E.; Wasif, M.; Lahmer, T. A review on application of soft computing techniques for the rapid visual safety evaluation and damage classification of existing buildings. J. Build. Eng. 2021, 43, 102536. [Google Scholar] [CrossRef]
- Perrone, D.; O’Reilly, G.J.; Monteiro, R.; Filiatrault, A. Assessing seismic risk in typical italian school buildings: From in-situ survey to loss estimation. Int. J. Disaster Risk Reduct. 2020, 44, 101448. [Google Scholar] [CrossRef]
- Tourism Montreal. 2019. Annual Report. Available online: https://toolkit.mtl.org/bynder/media/4977E233-0251-4345-8F64E9CB5449D5DE/download?filename=2019-Annual-report&extension=pdf (accessed on 1 June 2020).
- Leblanc, G. A Closer Look at the 16 September 1732, Montreal Earthquake. Can. J. Earth Sci. 1981, 18, 539–550. [Google Scholar] [CrossRef]
- Bent, A.L. Am Improved Source Mechanism for the 1935 Timiskaming, Quebec Earthquake from Regional Waveforms. Pure Appl. Geophys. 1996, 146, 5–20. [Google Scholar] [CrossRef]
- Bent, A.L. Source Parameters of the Damaging Cornwall-Massena Earthquake of 1944 from Regional Waveforms. Bull. Seismol. Soc. Am. 1996, 86, 489–497. [Google Scholar]
- Adams, J.; Basham, P. The Seismicity and Seismotectonics of Eastern Canada. Neotectonics N. Am. 1991, 1, 261–276. [Google Scholar]
- Adams, J.; Rogers, G.; Halchuk, S.; McCormack, D.; Cassidy, J. The Case for an Advanced National Earthquake Monitoring System for Canada’s Cities at Risk. In Proceedings of the 7th US Conference on Earthquake Engineering, Boston, MA, USA, 21–25 July 2002; Volume 42, p. 10. [Google Scholar]
- Rosset, P.; Bour-Belvaux, M.; Chouinard, L. Estimation and Comparison of Vs30; Microzonation Maps for Montreal Using Multiple Sources of Information. Bull. Earthq. Eng. 2015, 13, 2225–2239. [Google Scholar] [CrossRef]
- Rosset, P.; Chouinard, L. Characterization of Site Effects in Montreal, Canada. Nat. Hazards 2009, 48, 295–308. [Google Scholar] [CrossRef]
- Mitchell, D.; Tinawi, R.; Law, T. Damage Caused by the November 25, 1988, Saguenay Earthquake. Can. J. Civ. Eng. 1990, 17, 338–365. [Google Scholar] [CrossRef]
- Ghofrani, H.; Atkinson, G.M.; Chouinard, L.; Rosset, P.; Tiampo, K.F. Scenario Shakemaps for Montreal. Can. J. Civ. Eng. 2015, 42, 463–476. [Google Scholar] [CrossRef]
- Yu, K.; Chouinard, L.E.; Rosset, P. Seismic Vulnerability Assessment for Montreal. Georisk Assess. Manag. Risk Eng. Syst. Geohazards 2016, 10, 164–178. [Google Scholar] [CrossRef]
- Rosset, P.; Kert, M.; Youance, S.; Nollet, M.-J.; Chouinard, L. Could Montreal Residential Buildings Suffer Important Losses in Case of Major Earthquakes? In Proceedings of the 12th Canadian Conference on Earthquake Engineering, Quebec, QC, Canada, 17–20 June 2019; p. 7. [Google Scholar]
- Chouinard, L.; Rosset, P. On the Use of Single Station Ambient Noise Techniques for Microzonation Purposes: The Case of Montreal. In Shear Wave Velocity Measurement Guidelines for Canadian Seismic Site Characterization in Soil and Rock. Open File 7078; Hunter, J.A., Crow, H.L., Eds.; Geological Survey of Canada: Ottawa, ON, Canada, 2012; pp. 85–93. [Google Scholar]
- Lefebvre, K. Caractérisation Structurale et Évaluation de La Vulnérabilité Sismique Des Bâtiments Historiques En Maçonnerie Du Vieux-Montréal. Master’ s Thesis, École de technologie supérieure, Montréal, QC, Canada, 2004; p. 230. [Google Scholar]
- Uma, S.; Dhakal, R.P.; Nayyerloo, M. Vulnerability Assessment of Christchurch Buildings in Canterbury Earthquakes; GNS Science: Lower Hutt, New Zealand, 2013; ISBN 1-972192-55-8. [Google Scholar]
- Zacek, M. Construire Parasismique: Risque Sismique, Conception Parasismique Des Bâtiments; Ed. Parenthèses: Marseille, France, 1996; ISBN 2-86364-054-2. [Google Scholar]
- Mitchell, D.; Paultre, P.; Tinawi, R.; Saatcioglu, M.; Tremblay, R.; Elwood, K.; Adams, J.; DeVall, R. Evolution of Seismic Design Provisions in the National Building Code of Canada. Can. J. Civ. Eng. 2010, 37, 1157–1170. [Google Scholar] [CrossRef] [Green Version]
- Chouinard, L.; Rosset, P. Microzonation of Montreal, Variability in Soil Classification. In Proceedings of the 4th IASPEI/IAEE International Symposium, Santa Barbara, CA, USA, 23–26 August 2011; p. 5. [Google Scholar]
- Canadian Standards Association. Seismic Risk Reduction of Operational and Functional Components (OFCs) of Buildings; CSA Group: Toronto, ON, Canada, 2017; p. 134. [Google Scholar]
- Air Worldwide. Study of Impact and the Insurance and Economic Cost of Major Earthquakes in British Columbia and Ontario/Québec; Insurance Bureau of Canada: Boston, MA, USA, 2013; p. 264. [Google Scholar]
- Rosset, P.; Kert, M.; Youance, S.; Nollet, M.-J.; Chouinard, L. The Use of HAZCAN to Assess the Earthquake Risk of Residential Buildings in Montreal, Canada. In Proceedings of the Conference of the Canadian Society of Civil Engineering, Laval, QC, Canada, 12–15 June 2019; p. 4. [Google Scholar]
- SwissRe Le Risque Sismique Dans l’Est Canadien. Gare Aux Secousses; Swiss Re Institute: Zurich, Switzerland, 2017; p. 16. [Google Scholar]
- Rodrigues, C. Vulnérabilité de l’accessibilité de La Ville de Québec Face à l’aléa Sismique: Du Diagnostic Territorial à La Gestion de Crise; Département de Géographie, Université de Paul-Valéry: Montpellier, France, 2017; Volume 3, p. 134. [Google Scholar]
- Harirchian, E.; Lahmer, T. Developing a Hierarchical Type-2 Fuzzy Logic Model to Improve Rapid Evaluation of Earthquake Hazard Safety of Existing Buildings. Structures 2020, 28, 1384–1399. [Google Scholar] [CrossRef]
- Harirchian, E.; Jadhav, K.; Kifaytullah, M.; Ehsan, S.; Hosseini, A.; Lahmer, T. A Comparative Study of Mcdm Methods Integrated with Rapid Visual Seismic Vulnerability Assessment of Existing Rc Structures. Appl. Sci. 2020, 28, 1384. [Google Scholar] [CrossRef]
- Brown, N.A.; Rovins, J.E.; Orchiston, C.; Feldmann-Jensen, S.; Johnston, D. Disaster Resilience in Wellington’s Hotel Sector: Research Update and Summary. Aust. J. Disaster Trauma Stud. 2019, 23, 77–81. [Google Scholar]


| A | B | C | D | E | F |
|---|---|---|---|---|---|
| NBCC design | Type of structure | Soil conditions | Building characteristics | Nonstructural elements | Importance elements |
| Age and resonance period of the building | Concrete, steel, masonry, etc. | Hard rock, firm soil, soft soil | Structural irregularities, number of floors | Fireplace presence and balcony. Induced hazards | Occupancy rate and accommodation capacity |
| Ta: Period of the Building (in s) N: Number of Floors | Built Years | |||
|---|---|---|---|---|
| Before 1965 | 1965–1984 | 1985–2005 | After 2005 | |
| Ta ≤ 1.0; N ≤ 10 | 2.3 | 1.5 | 1.5 | 1 |
| 1.0 < Ta < 2.0; 10 < N < 20 | 1.3 | 0.9 | 0.9 | 1 |
| Ta ≥ 2.0; N ≥ 20 | 0.9 | 0.7 | 0.7 | 1 |
| Built Year | Structural Type | |||||||
|---|---|---|---|---|---|---|---|---|
| Wood | Steel | Steel Frame | Concrete | Concrete Frame | Precast Concrete | Reinforced Masonry | Unreinforced Masonry | |
| Before 1965 | 1.4 | 1 | 2 | 2 | 2.5 | 4.3 | 3.3 | 3.5 |
| 1965–1984 | 1.4 | 1 | 1.5 | 1.5 | 1.5 | 3.1 | 2.2 | 3.5 |
| 1985–2005 | 1.2 | 1 | 1 | 1 | 1 | 1.7 | 1.1 | 1.1 |
| After 2005 | 1 | 1 | 1 | 1 | 1 | 1 | 1 | 1 |
| Built Year | Soil Categories | ||||
|---|---|---|---|---|---|
| Hard Rock | Rock | Dense Soil | Soft Soil | Poor Soil | |
| Before 1965 | 0.8 | 0.9 | 1 | 1.1 | 1.2 |
| 1965–1984 | 0.8 | 0.9 | 0.8 | 0.8 | 0.9 |
| 1985–2005 | 0.8 | 0.9 | 0.8 | 0.8 | 0.9 |
| After 2005 | 1 | 1 | 1 | 1 | 1.5 |
| Age of the Building | Structural Irregularities | ||||||
|---|---|---|---|---|---|---|---|
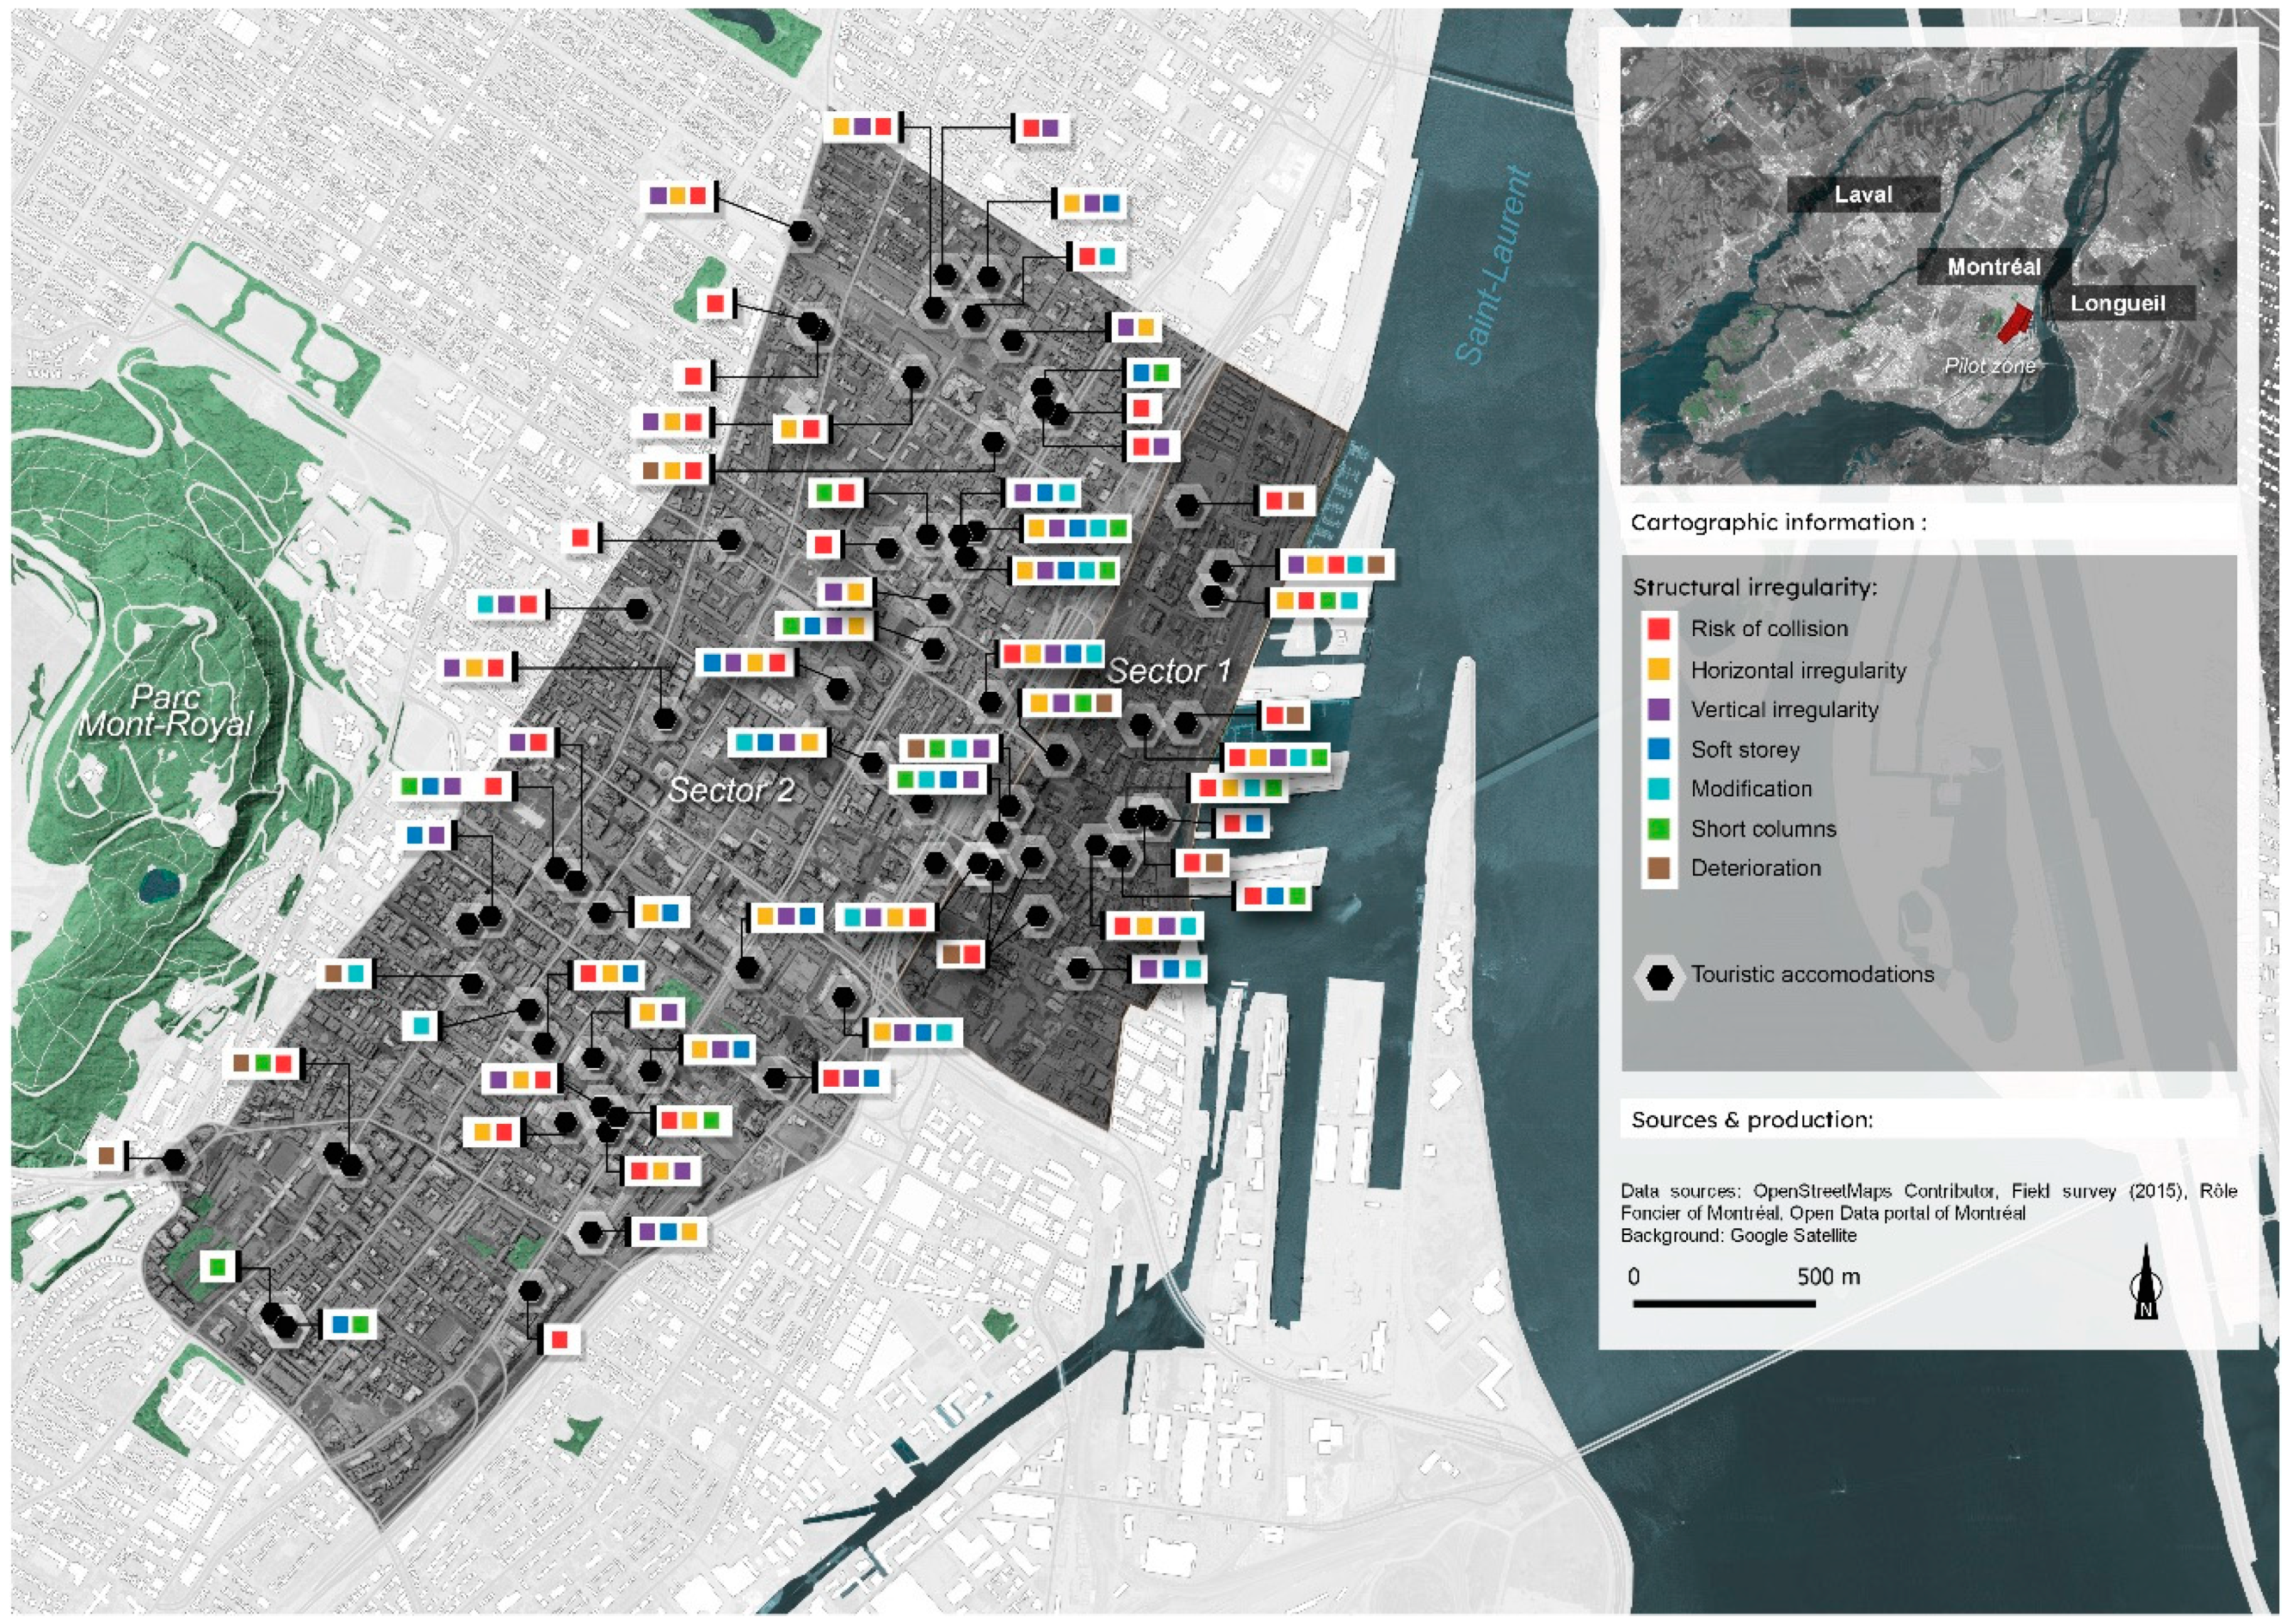
| Vertical Irregularities | Horizontal Irregularities | Soft-Story | Modification | Short Concrete Columns | Pounding Risk | Deterioration | |
| Before 1985 | 1.3 | 1.5 | 2 | 1.3 | 1.3 | 1.3 | 1.3 |
| After 1985 | 1.3 | 1.5 | 1.5 | 1 | 1.3 | 1.3 | 1.3 |
| Zones & Predominant Period T | Soil-Structure Interaction | ||
|---|---|---|---|
| Number of floors & Building Period Ta (in s) | |||
| 1–4 & 0.1–0.4 | 4–7 & 0.4–0.7 | >7 & >0.7 | |
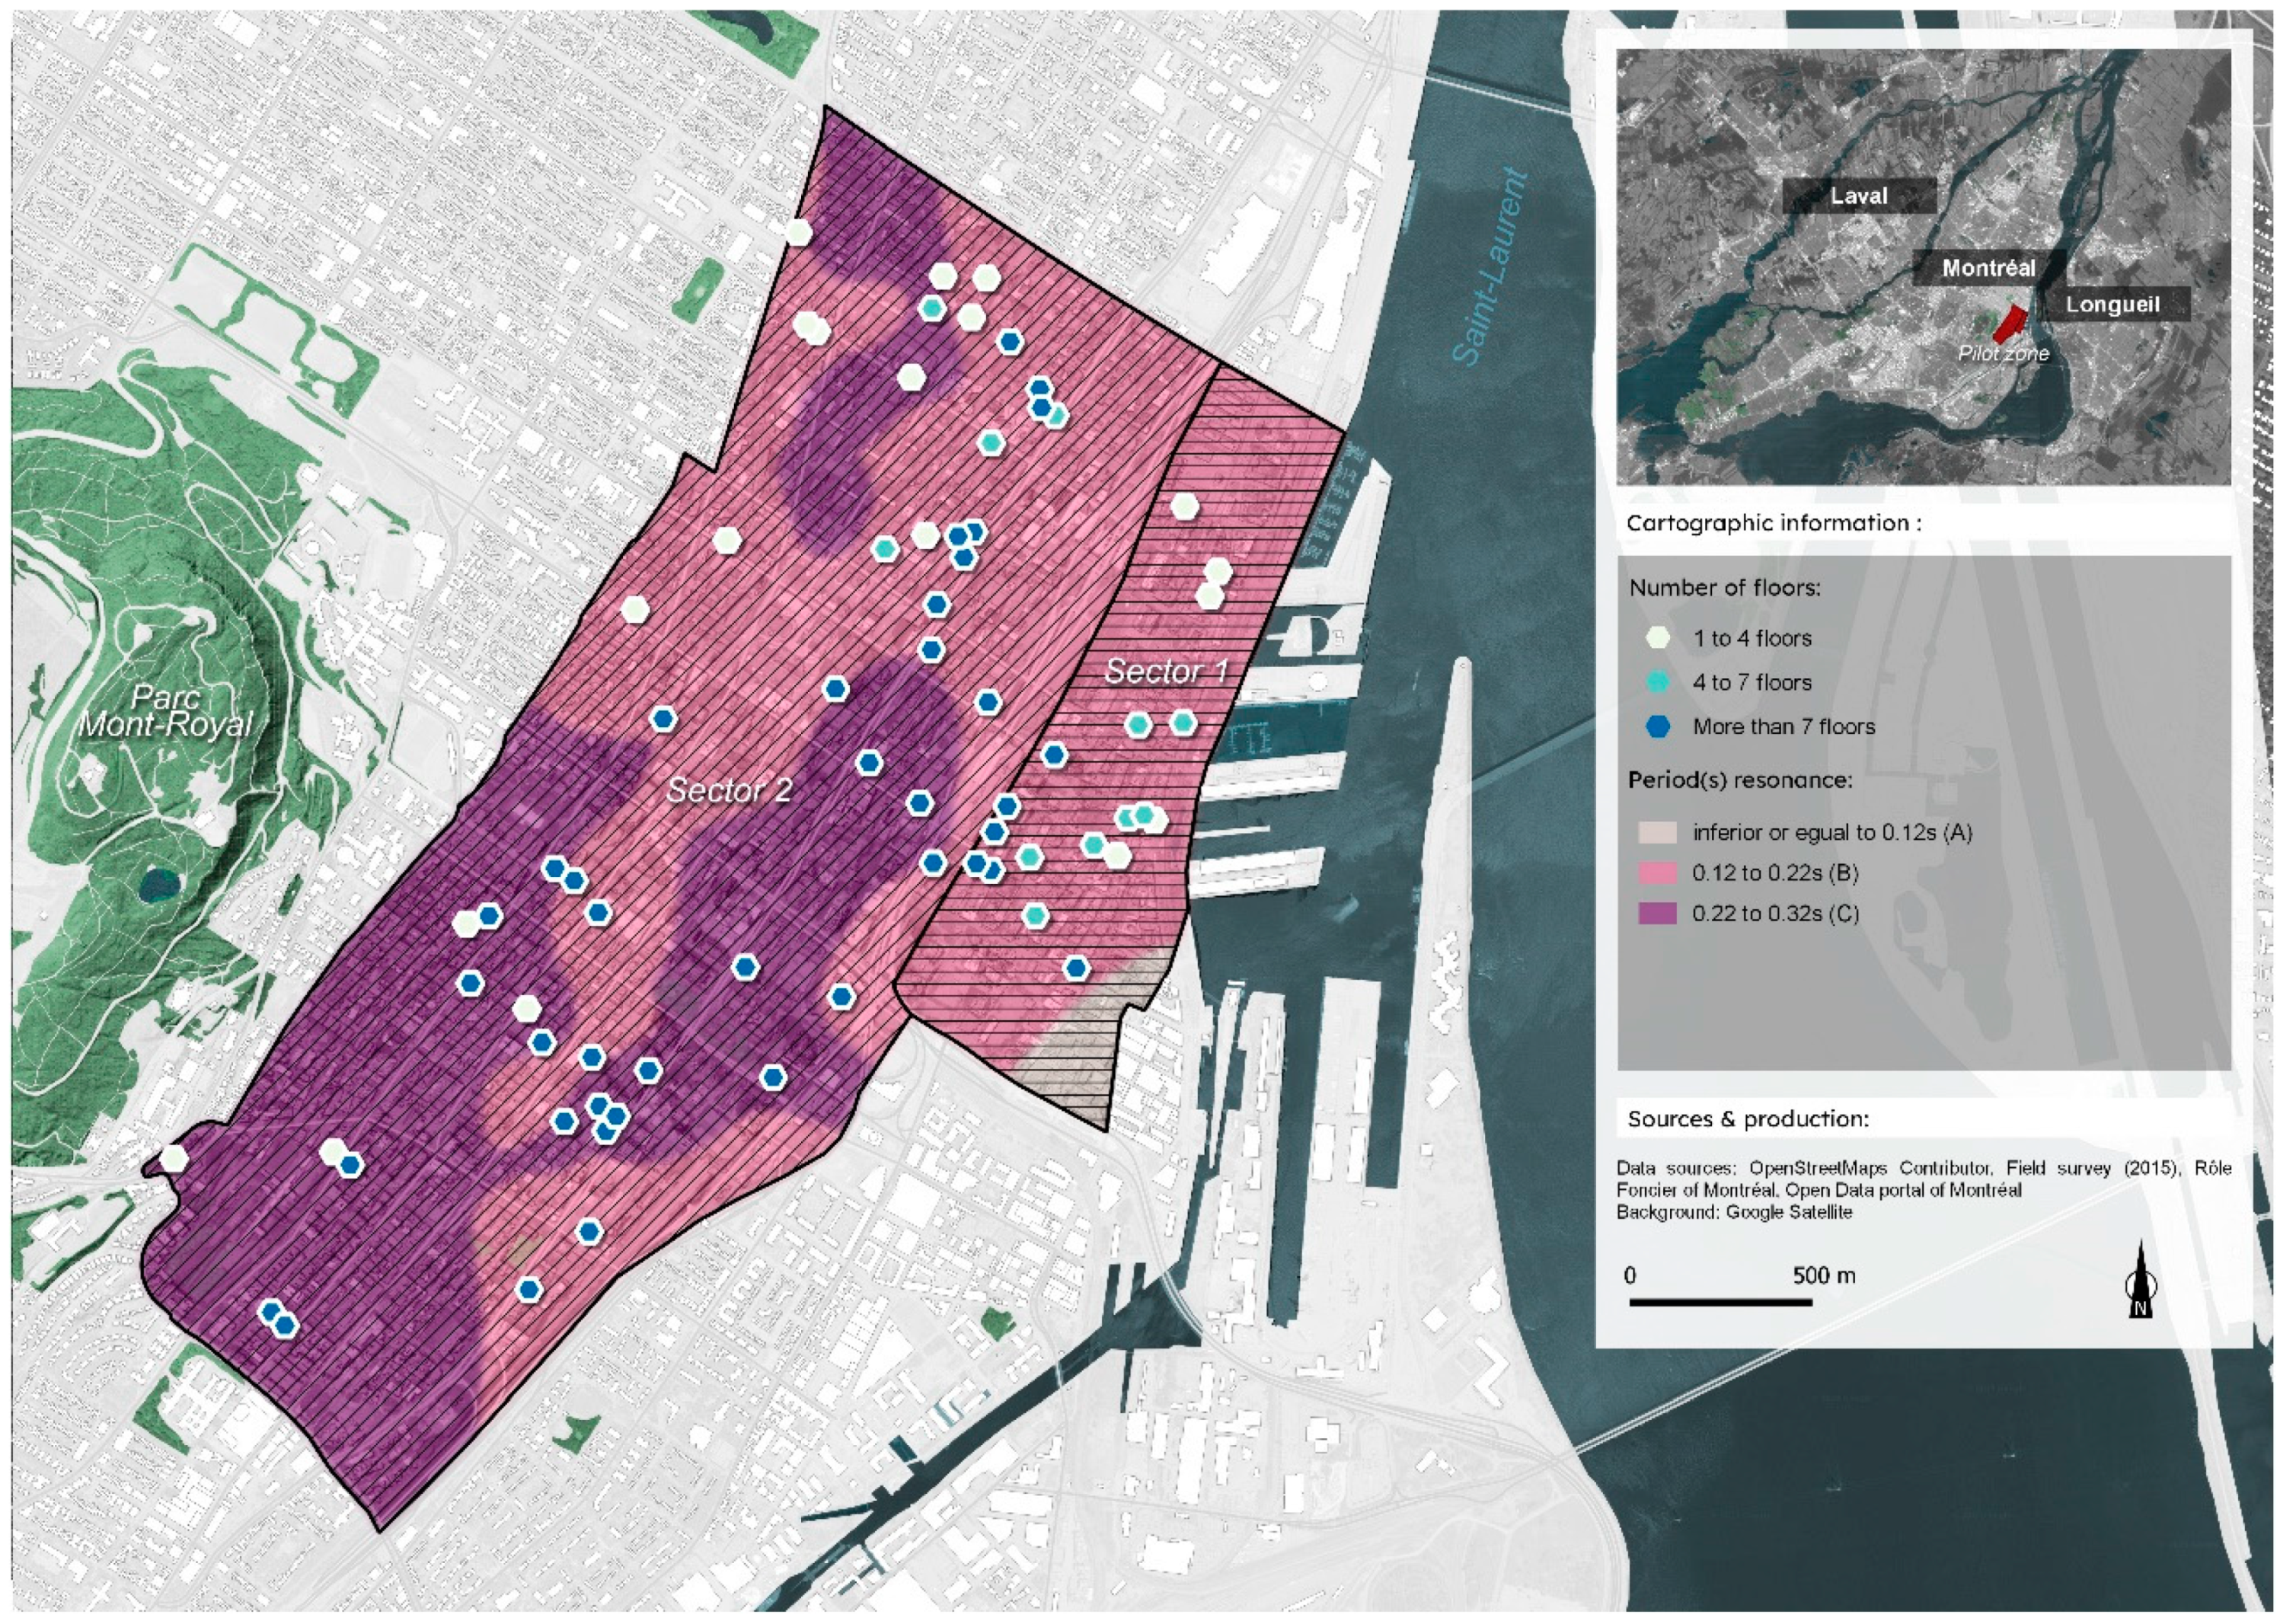
| Zone i (T ≤ 0.12 s) * | 1.5 | 1.1 | 1 |
| Zone ii (0.12 < T < 0.22 s) * | 2 | 1.2 | 1 |
| Zone iii (T ≥ 0.22 s) * | 2 | 1.5 | 1 |
| No | Yes | |
|---|---|---|
| Presence of nonstructural elements (i.e., chimney, external wall, balcony) | 1 | 2 |
| Importance of the Building | Low | Medium | Important |
|---|---|---|---|
| Frequentation (number of persons accommodated per night) | 1 (0–10) | 1.2 (10–100) | 1.5 (100–1000) |
| Accommodation capacity (expressed in CAD) | 1.2 (100–5000 k) | 1.3 (5000–10,000 k) | 1.5 (>10,000 k) |
| Vulnerability Index Vi | <10 | 10–20 | 20–30 | >30 |
| Level of vulnerability | Low | Intermediate | High | Very High |
| Criteria | Types of Accommodation | ||||
|---|---|---|---|---|---|
| Bed and Breakfasts | Small Hotel | Intermediate Hotel | Large Hotel | ||
| Average built year | 1982 | 1924 | 1962 | 1982 | |
| A and E | Number of floors | <4 | 4 | 10 | 26 |
| B | Structural type | Nonreinforced masonry | Reinforced masonry | Concrete Concrete-masonry | Concrete steel-concrete |
| C and F | Geologic conditions | Soft soil | Dense soil/Soft soil | Dense soil | Dense soil |
| D | Building characteristics | Collision, deterioration, horizontal and vertical irregularities | Collision, soft story, vertical irregularity, modification | Vertical and horizontal irregularities, collision | Vertical and horizontal irregularities, collision |
| E | Nonstructural elements | Yes | Yes | No | No |
| F1 | Frequentation | Low/Medium | Low/Medium | Important | Important |
| F2 | Accommodation capacity | Low/Medium | Low/Medium | Medium/Important | Important |
| Geographical sector | 1 (principally) and 2 | 2 (principally) and 1 | 2 | 2 | |
| Average Vulnerability Index Vi | 32 | 27 | 14 | 9 | |
| Average level of vulnerability | Very high | High | Intermediate | Low | |
| Average Vi for all types | 20 (Intermediate-High) | ||||
Publisher’s Note: MDPI stays neutral with regard to jurisdictional claims in published maps and institutional affiliations. |
© 2021 by the authors. Licensee MDPI, Basel, Switzerland. This article is an open access article distributed under the terms and conditions of the Creative Commons Attribution (CC BY) license (https://creativecommons.org/licenses/by/4.0/).
Share and Cite
Candela, T.; Rosset, P.; Chouinard, L. A Quantitative Approach to Assess Seismic Vulnerability of Touristic Accommodations: Case Study in Montreal, Canada. GeoHazards 2021, 2, 137-152. https://doi.org/10.3390/geohazards2020008
Candela T, Rosset P, Chouinard L. A Quantitative Approach to Assess Seismic Vulnerability of Touristic Accommodations: Case Study in Montreal, Canada. GeoHazards. 2021; 2(2):137-152. https://doi.org/10.3390/geohazards2020008
Chicago/Turabian StyleCandela, Thomas, Philippe Rosset, and Luc Chouinard. 2021. "A Quantitative Approach to Assess Seismic Vulnerability of Touristic Accommodations: Case Study in Montreal, Canada" GeoHazards 2, no. 2: 137-152. https://doi.org/10.3390/geohazards2020008
APA StyleCandela, T., Rosset, P., & Chouinard, L. (2021). A Quantitative Approach to Assess Seismic Vulnerability of Touristic Accommodations: Case Study in Montreal, Canada. GeoHazards, 2(2), 137-152. https://doi.org/10.3390/geohazards2020008