Article

Eco-Friendly Synthesis of Cerium Oxide Nanoparticles from Lycium cooperi

by
Jhonathan Castillo-Saenz
,
Jorge Salomón-Carlos
,
Ernesto Beltrán-Partida
* and
Benjamín Valdez-Salas
*
Core Facilities of Chemistry and Advanced Materials, Instituto de Ingeniería, Universidad Autónoma de Baja California, Mexicali 21280, Baja California, Mexico
*
Authors to whom correspondence should be addressed.
Reactions 2025, 6(1), 14; https://doi.org/10.3390/reactions6010014
Submission received: 29 October 2024 / Revised: 14 January 2025 / Accepted: 7 February 2025 / Published: 11 February 2025

Abstract

:
Cerium oxide nanoparticles (CeO2-NPs) offer promising advantages in semiconductors and biomedical applications due to their optical, electrical, antioxidant, and antibacterial properties. However, the widely reported synthetic strategies for CeO2-NPs demand toxic precursors and intermediary pollutants, representing a major limitation to CeO2-NPs applications. Therefore, it is necessary to develop greener strategies that implicate ecological precursors to reduce the negative impact on the scalability of CeO2-NPs. In this regard, we applied Lycium cooperi (L. cooperi) aqueous extracts as an unexplored potential green reducing agent for the eco-friendly synthesis of CeO2-NPs. The L. cooperi extract showed the presence of alkaloids, flavonoids, cardiac glycosides, and carbohydrate-derived families, which were assessed for spherical monodispersed CeO2-NPs under a rapid chemical reduction. Moreover, the elemental composition revealed Ce and O, indicating highly pure CeO2-NPs characterized by an interplanar cubic crystalline structure. Furthermore, we detected the presence of stabilizing functional groups from L. cooperi, which, after a controlled annealing process, resulted in a band gap energy of 3.9 eV, which was optimal for the CeO2-NPs. Thus, the results indicate that L. cooperi is an environmentally friendly synthesis method that can open a new route for CeO2-NPs in biomedical and industrial applications.

1. Introduction

Cerium oxide (CeO2) is an n-type semiconductor material with a band gap of approximately 3.3 eV [1]. Interestingly, CeO2-NPs have garnered significant attention due to their improved optical, electrical, catalytic, and thermal properties, along with greater chemical stability compared with non-nanostructured CeO2 precursors [2]. Moreover, CeO2-NPs are considered a highly promising material for various applications, including optoelectronic devices [3], energy conversion and storage [4], catalysis [5], tissue engineering [6], biotechnology [7], and nanomedicine and antioxidants in biological systems [8]. In this regard, CeO2-NPs have been synthesized using different chemical strategies, such as sol-gel, colloidal synthesis, hydrothermal, and precipitation methods [9,10]. These synthetic approaches allow precise control of nanoparticle size, morphology, and chemical composition. However, an important disadvantage of the chemical method is that it often involves toxic solvents and significant pollutant substances. Thus, considering these detrimental issues, green precipitation mechanisms have been widely applied using plant extracts for a facile, economic technique, which is commonly used for CeO2-NPs. On the other hand, plant extracts contain secondary metabolites (e.g., flavonoids, catechins, coumarins, and more) that act as chelating, reducing, and stabilizing agents to obtain controlled metallic nanoparticles [11,12,13]. In addition, many of these secondary metabolites exhibit antioxidant, anti-inflammatory, and antimicrobial activity, with significant potential biomedical applications.
Considering a novel, greener strategy, the genus Lycium, which belongs to the Solanaceae family with 80 species in different regions worldwide [14,15], is a promising choice for the synthesis of CeO2-NPs. In recent years, several studies have explored the chemical composition and pharmacology of this genus, leading to the identification and isolation of over 200 compounds. These compounds include flavonoids, alkaloids, polysaccharides, steroids, terpenoids, carotenoids, amides, and essential oils [14]. This diversity of phytochemicals suggests that the Lycium genus is highly promising for the green synthesis of nanoparticles, but it has been scarcely explored for this application. It was recently reported that CeO2-NPs were synthesized using the green precipitation method, employing various plant extracts such as Origanum majorana L. leaf extract [16], Acorus calamus [17], Calotropis procera flower extract [18], Azadirachta indica [19], Artabotrys hexapetalus leaf extract [20], Abelmoschus esculentus [21], Moringa oleifera leaf extract [22], and Rheum turkestanicum extract [23]. However, these methods require extended synthesis periods, the use of ammonium and sodium hydroxides as precipitants, and show large physicochemical variation, highlighting the importance of green precursor agents. Our methodology presents several notable advantages compared to those reported in literature including minimizing synthesis times to contribute to reduced energy consumption, excluding harmful chemical precursors, and reducing toxic waste generation. These attributes serve to underscore the ecological sustainability of this synthesis process.
The main objective of this work was to synthesize controlled, well-dispersed, homogenous spherical CeO2-NPs from secondary metabolites of L. cooperi aqueous extract, taking advantage of its chelating and reducing properties [11,12,13]. The morphological, optical, and structural properties were characterized. To the best of our knowledge, no information exists about the use of this plant for the green synthesis of nanoparticles.

2. Experimental Details

2.1. Morphological Characteristic of L. cooperi Plant

Figure 1a displays the L. cooperi plant specimen harvested under controlled conditions in a greenhouse at the Instituto de Ingeniería, Universidad Autónoma de Baja California, in Mexicali, Baja California, Mexico. Figure 1b shows the characteristics of the leaves and flowers. According to the voucher specimen from the databases of the University of California, Berkeley (Figure 1c), the taxonomic identification is in accordance with L. cooperi [24]. Table 1 presents the main morphological characteristics of the plant, along with information about its habitat and geographical distribution [24].

2.2. Preparation of L. cooperi Extract

The L. cooperi leaves were harvested to obtain an aqueous extract. Initially, the leaves were washed with abundant ultrapure deionized (DI) water (milli-Q, type 1) and then left to air-dry at room temperature for one day. Then, 10 g of dry leaves was pulverized and mixed with 100 mL of DI. The mixture was then heated to 60 °C for 30 min with constant stirring at 500 rpm. Finally, the L. cooperi aqueous extract was filtered using filter paper (Whatman N°4, 55 mm) and stored at 4 °C for later use. Figure 2 shows the preparation process of the L. cooperi aqueous extract.

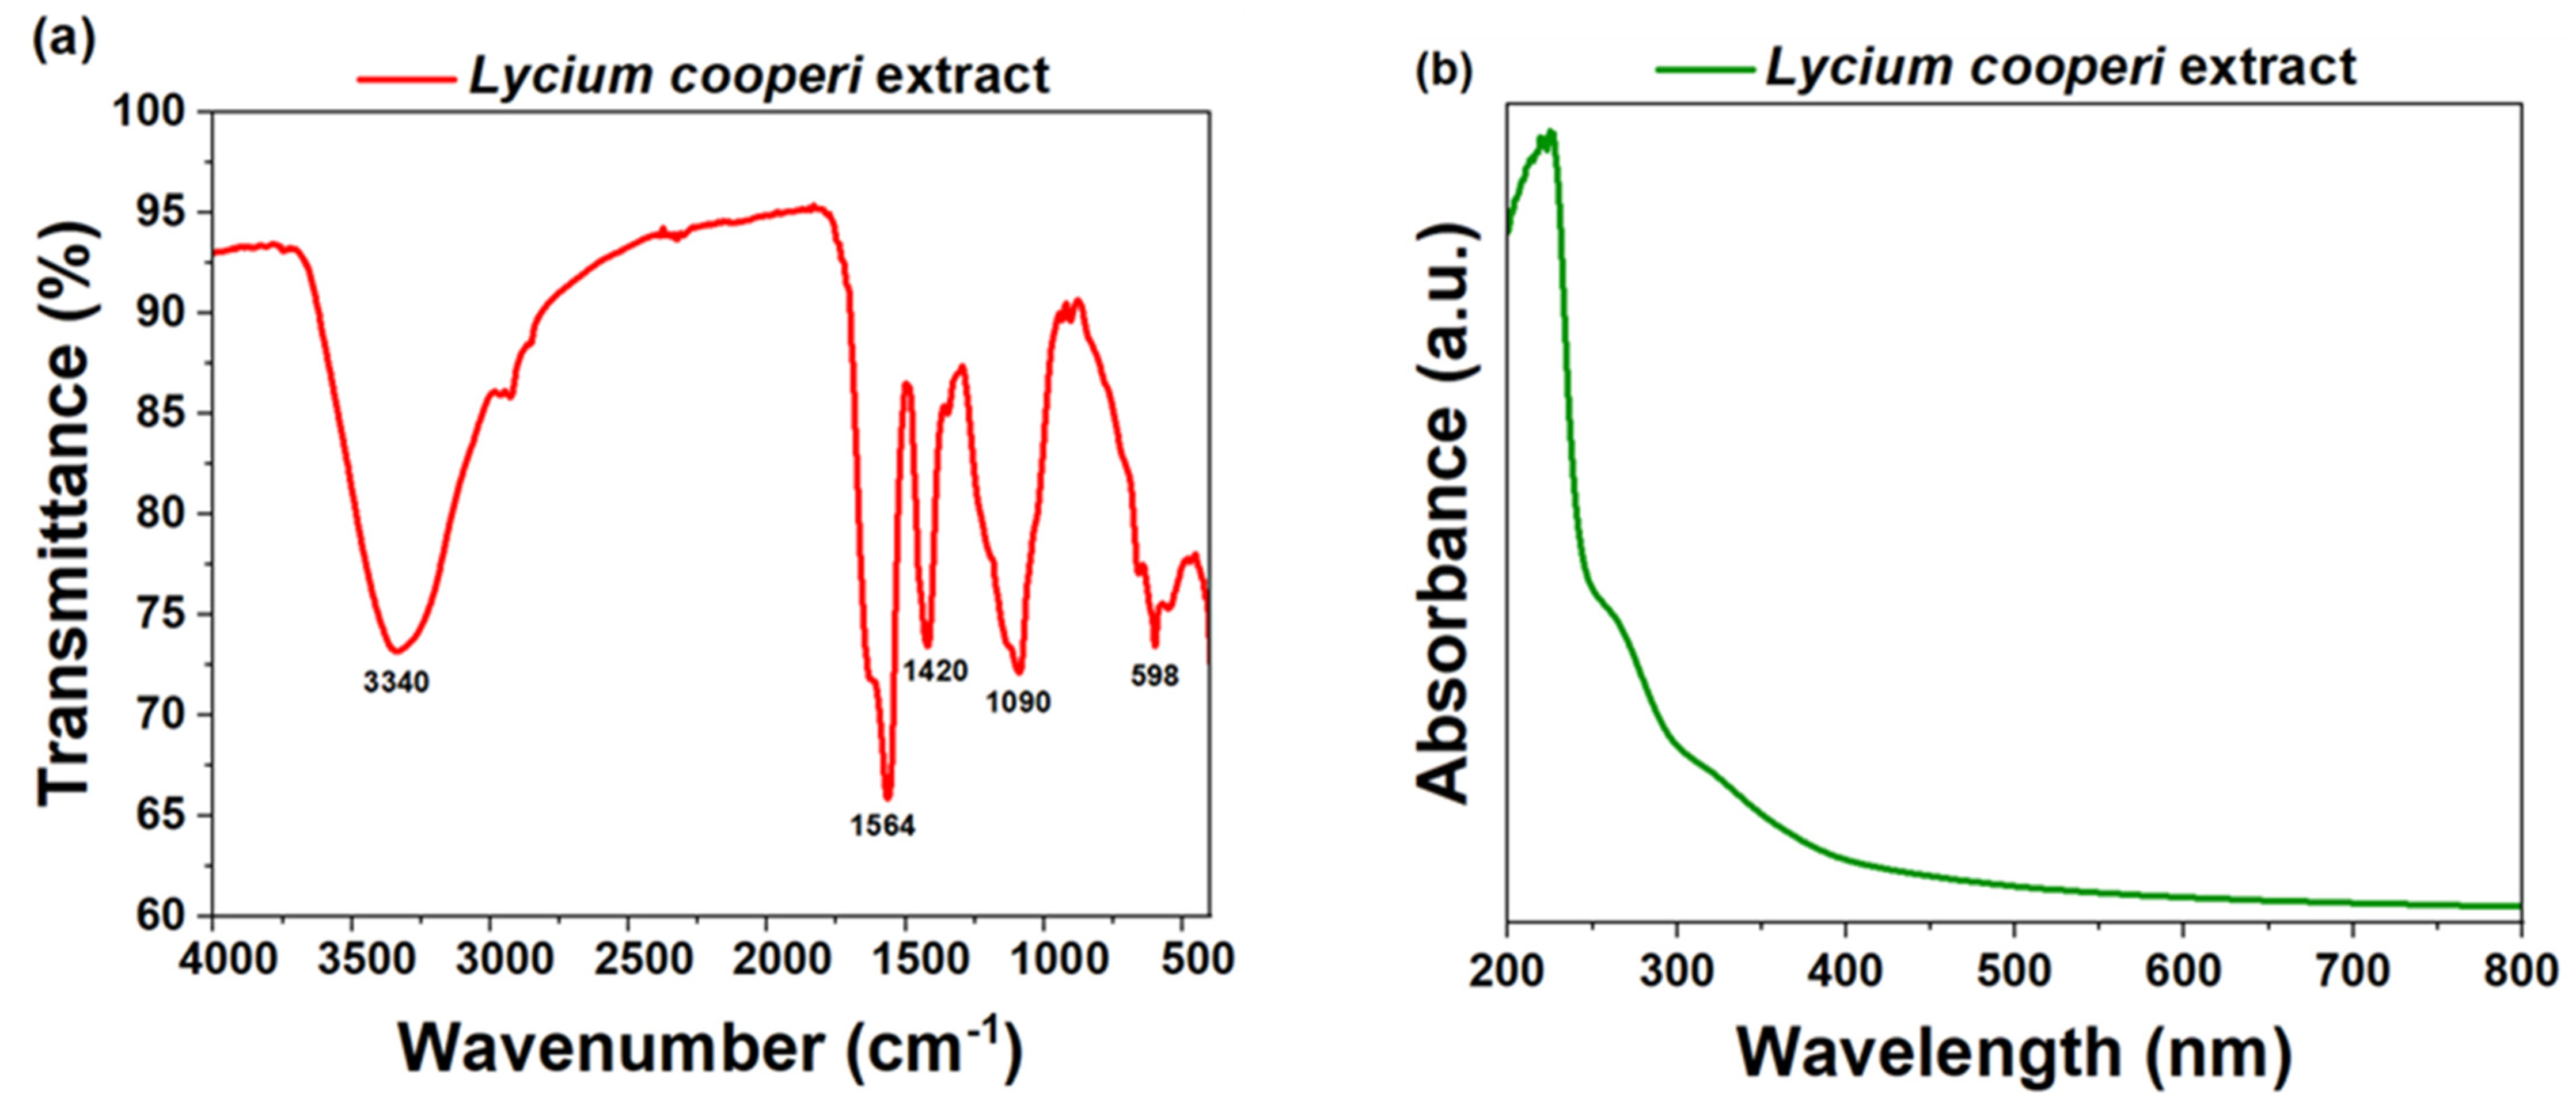
2.3. Phytochemical Characterization of L. cooperi Extract

Phytochemical tests were conducted to identify the secondary metabolites in the aqueous extract of L. cooperi, as follows:
  • Alkaloids
A few drops of Hager’s reagent (picric acid) were added to 2 mL of extract. The formation of a yellow color crystalline precipitate indicated the presence of alkaloids.
  • Flavonoids
To evaluate flavonoids, we prepared two test tubes containing 2 mL of L. cooperi and 2 mL of DI. Then, for comparison of the samples, 2 mL of NaOH (0.1 M) was added. A change in the color solution to yellow indicated the presence of flavonoids.
  • Saponins
A quantity of 5 mL of extract was vigorously shaken and then kept static for 10 min. The presence of a stable froth indicated that saponins were in the extract.
  • Tannins
A few drops of FeCl3 were added to 2 mL of L. cooperi extract. A green condensed formation indicated the presence of tannins.
  • Terpenoids
A quantity of 5 mL of aqueous extract was mixed with 2 mL of chloroform and 1 mL of concentrated H2SO4. If positive, a red-brown color ring appeared in the lower chloroform layer phase.
  • Cardiac glycosides
The aqueous extract (5 mL) was mixed in 2 mL of ferric chloride-glacial acetic acid solution and 1 mL of concentrated H2SO4. The appearance of a brown ring at the interface indicated the presence of glycosides.
  • Carbohydrates
To the aqueous extract (5 mL), 2 mL of acetic acid and 2 mL of chloroform were added. Subsequently, three drops of concentrated H2SO4 were added to the mixture. The presence of an orange precipitate indicated the presence of carbohydrates.
The functional groups of the secondary metabolites and certain chromophore groups within the aqueous extract of L. cooperi were characterized by FT-IR (PerkinElmer Frontier FT-IR; 400–4000 cm−1) and UV–Vis (Shimadzu 260; 200–800 nm) analyses.

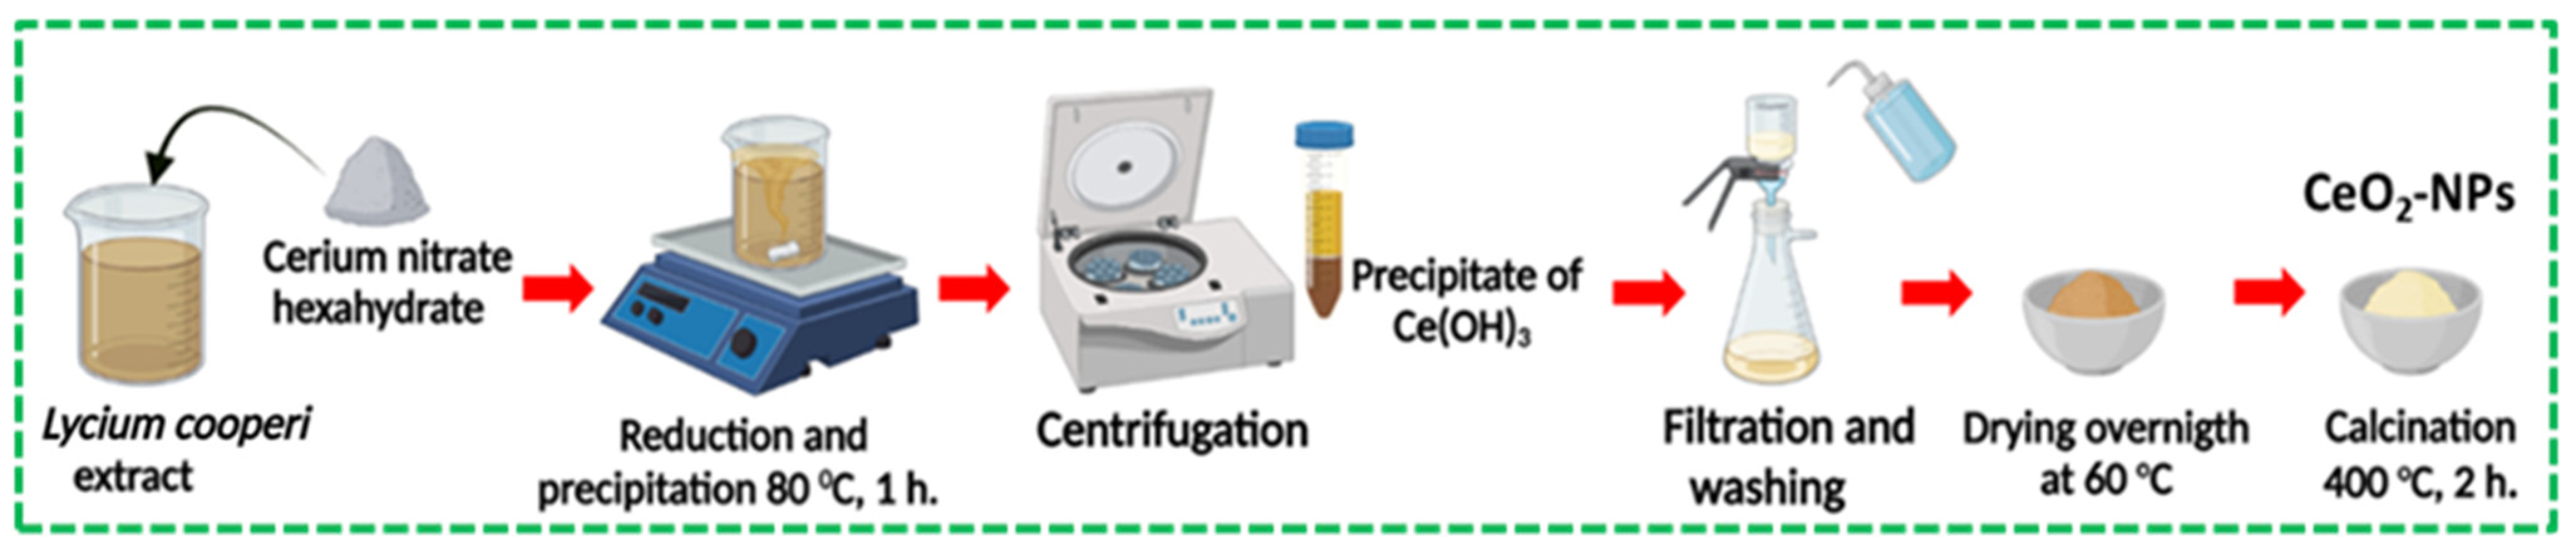
2.4. Green Synthesis of CeO2-NPs

A precursor solution of 0.1 M Ce3+ was prepared by dissolving 2.17 g of cerium nitrate hexahydrate (Ce(NO3)3·6H2O) in 50 mL of L. cooperi aqueous extract. The mixture was heated to 80 °C for 1 h with constant stirring at 500 rpm to produce cerium hydroxide (Ce(OH)3) precipitates. Ce(OH)3 precipitate was centrifuged at 4000 rpm, then vacuum filtered, washed at environmental conditions with DI and absolute ethanol, and dried overnight at 60 °C. Finally, Ce(OH)3 was calcined at 400 °C in a muffle furnace for two hours in the air to obtain CeO2-NPs. Figure 3 illustrates the synthesis process of CeO2-NPs using the green precipitation method.

2.5. Characterization of CeO2-NPs

The morphology, particle size, and chemical composition were determined using SEM (Tescan LYRA 3 XMH, Tescan, Brno–Kohoutovice, Brno, Czech Republic) equipped with an EDS (Quantax Bruker X-Flash 6160, Tescan, Brno, Czech Republic) and HR-TEM (JEOL 2010, Japan Electron Optics Laboratory, Mitaka, Tokyo, Japan). The SEM micrograph was acquired using an accelerating voltage of 10 kV and a magnification of 40 kX. The mounting conditions for CeO2 nanoparticles consisted of dispersing 1 mg of CeO2-NPs in 5 mL of absolute ethanol. This process was conducted using an ultrasonic homogenizer (OMNI Sonic Ruptor 400, OMNI International, Kennesaw GA, USA) for 15 min at a power output of 160 watts and a frequency of 20 kHz. Subsequently, a 10 μL aliquot was extracted, and the dispersion was deposited onto a TEM grid or carbon tape (SEM) for further study. The TEM image was captured using an accelerating voltage of 200 kV. The structural and crystallographic information of the CeO2-NPs was obtained using TEM and XRD (Panalytical Empyrean, Malvern, Worcestershire, UK) with a Cu Kα radiation source (λ = 0.15406 nm) and a real-time multipass detector X’Celerator, with scanning over the 2–theta range 20–90 at room temperature. FT–IR spectra were recorded in the 400–4000 cm−1 range (Frontier Perkin Elmer, Waltham, MA, USA)) in attenuated total reflection (ATR) mode. For accurate FT–IR analysis of the aqueous extract of Lycium cooperi, aliquots were deposited onto the ATR platform and allowed to dry under ambient conditions until sufficiently dry material was obtained.
The optical properties of the CeO2-NPs were characterized using UV–Vis analysis from 200 to 800 nm (Shimadzu 260, Shimadzu, Kyoto, Japan). For the UV–Vis analysis, a CeO2-NPs dispersion was prepared in water, following TEM protocols. An aliquot of 500 μL was then diluted in 5 mL of deionized water (DI) for the measurements.

3. Results and Discussion

3.1. Phytochemical Analysis of L. cooperi Aqueous Extract

In Table 2, we present the results of the phytochemical tests. Initially, the Hager, ammonia, Keller–Kellani, and Benedict tests showed positive results, indicating the presence of alkaloids, flavonoids, cardiac glycosides, and carbohydrates, respectively. On the other hand, the analyses for saponins, tannins, and terpenoids were negative. The findings demonstrate that the aqueous extract of L. cooperi contains the metabolites flavonoids and carbohydrates, which are chemically highlighted due to the numerous hydroxyl groups (-OH).
These metabolites are known for their ability to act as chelating and reducing agents in the formation of nanoparticles in aqueous solutions [25], eliminating the need to add acids or bases. Carbohydrates and flavonoids play multiple roles in the synthesis of nanoparticles acting as chelating, stabilizing, and reducing agents. They can release electrons by breaking the O–H bond, which allows the released electrons to reduce Ce3+ ions to Ce0, initiating the nucleation process for Ce(OH)3 formation, which is then calcined to obtain oxidized CeO2-NPs.
Figure 4a illustrates the FT-IR spectrum of L. cooperi extract. The 3340 cm−1 and 1420 cm−1 peaks correspond to O-H bond stretching and bending; the 2928 cm−1 and 2850 cm−1 peaks correspond to –CH, –CH2, and –CH3 stretching vibrations associated with carbohydrates [26]. Moreover, the peak at 1564 cm−1 shows the stretching behavior of the aromatic ring’s C-C bond, the band at 1090 cm−1 is attributed to the C-O stretching, and the shoulder band at 1626 cm−1 is attributed to the stretching vibration of the carbon-oxygen double bond [26]. Finally, a peak is observed at 598 cm−1, suggesting the presence of halide groups in the extract. The families of secondary metabolites identified by the phytochemical reactions in the L. cooperi extract correspond to the functional groups reported in the molecular structure by FT–IR.
The absorption band observed at 225 nm in the UV–Vis spectrum of the L. cooperi extract (Figure 4b) is attributed to the electronic transitions of π → π* orbitals, which occur in the structure of the chromophore groups present in the sample.
The FT–IR and UV–Vis analyses confirm the presence of green-derived metabolites, corresponding to a mixture of flavonoids, cardiac carbohydrates, alkaloids, and polymeric carbohydrates identified through phytochemical tests.

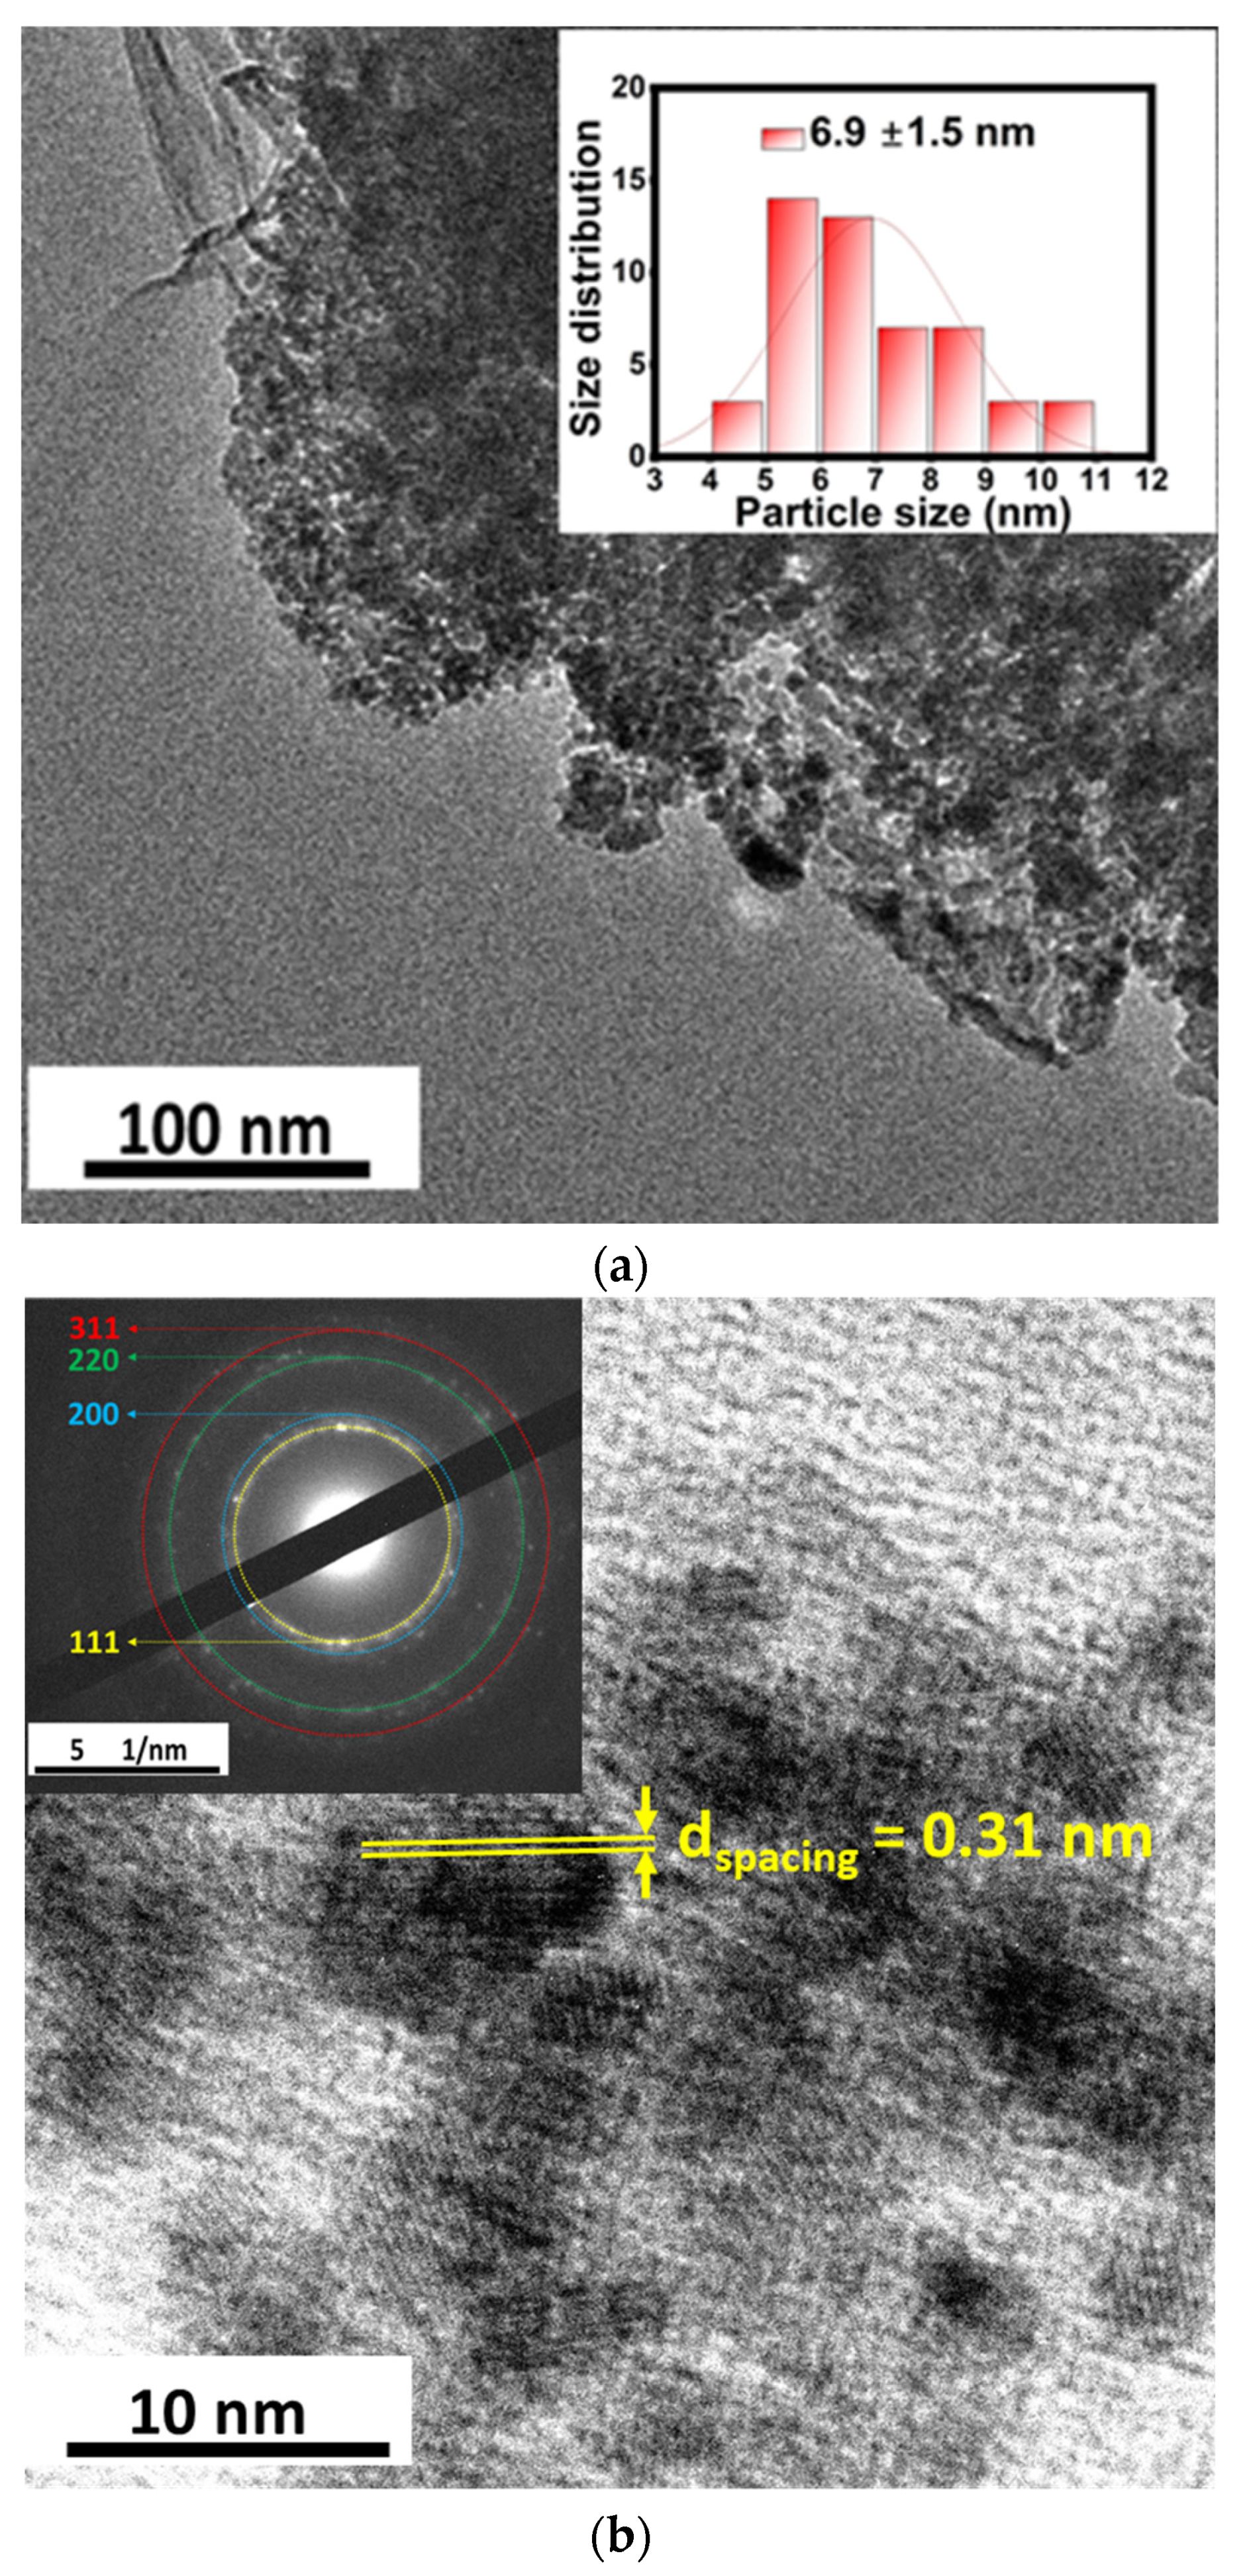
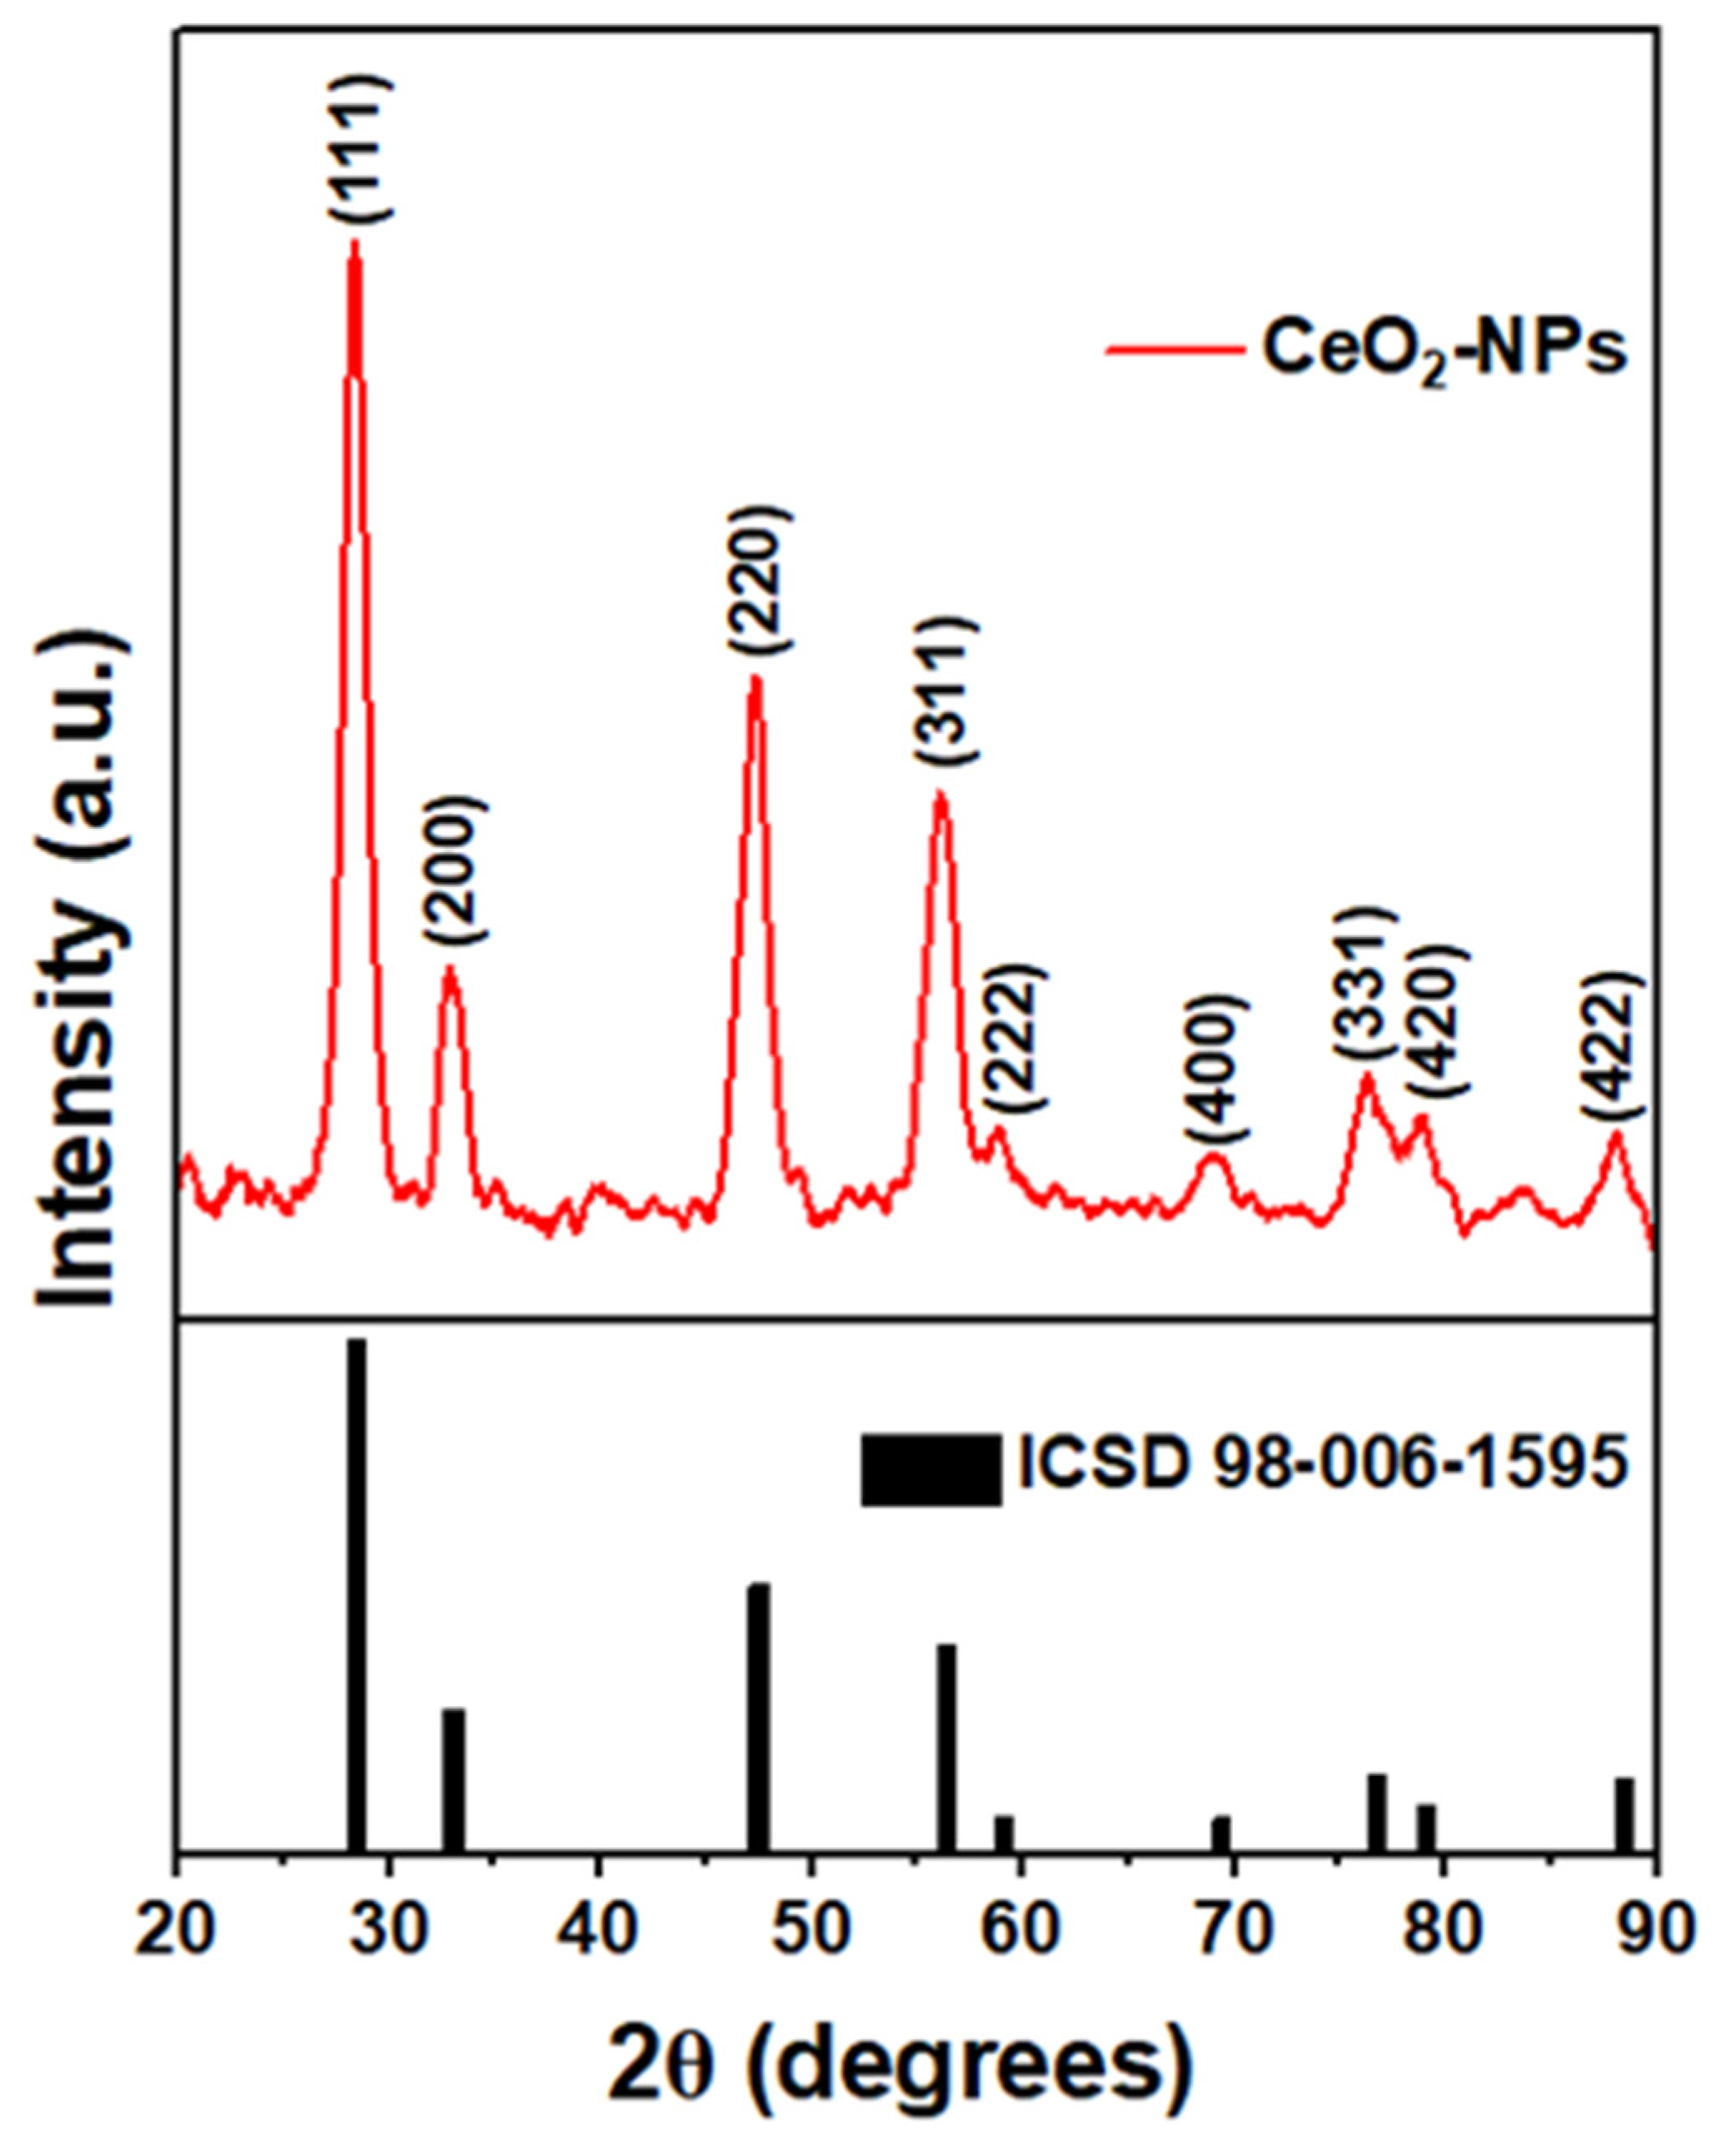
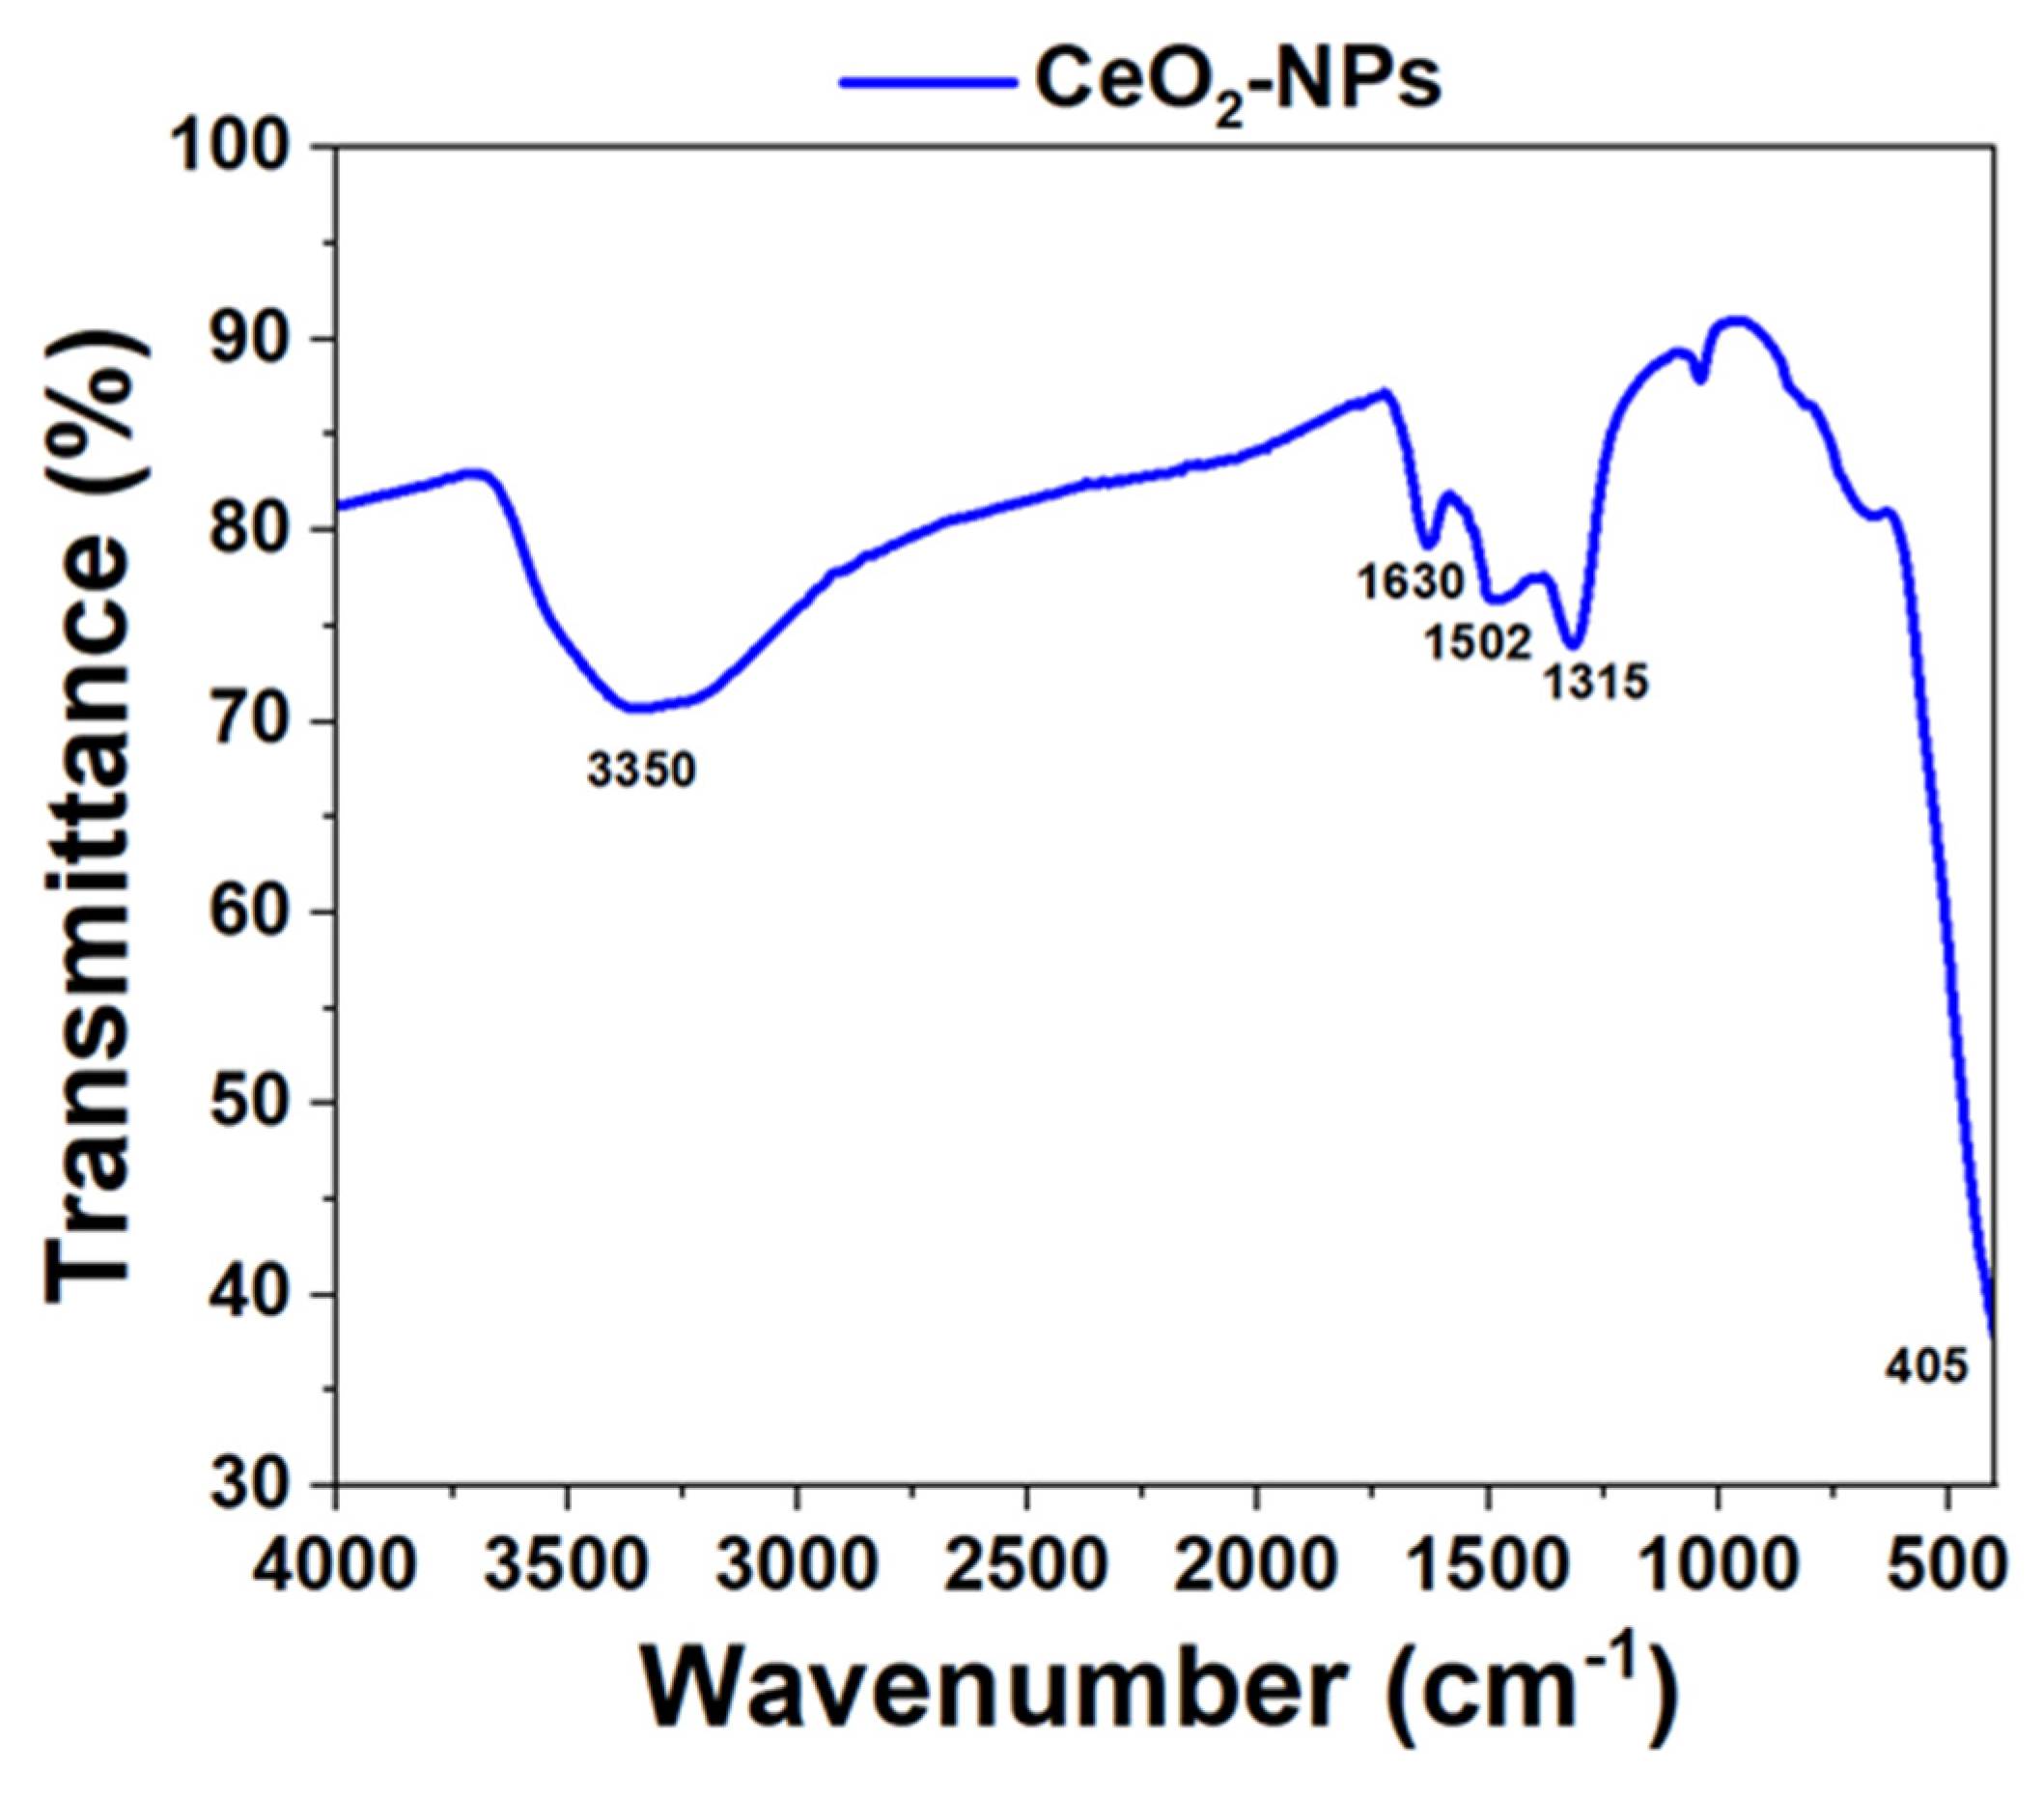
3.2. Physicochemical Analysis of CeO2-NPs

The SEM micrographs show the agglomeration of CeO2-NPs, highlighting a homogenous spherical morphology and showing an average size of 86 ± 10 nm (Figure 5a). On the other hand, the chemical composition of the CeO2-NPs by means of EDS illustrated the presence of Ce and O, suggesting the formation of highly pure CeO2-NPs (Figure 5b).
Figure 6a displays the TEM micrographs of the CeO2-NPs, showing a spherical morphology and a size distribution of 6.9 ± 1.5 nm (inset Figure 6a). Compared with the results obtained using SEM (Figure 5a), this size reduction is attributed to the process of dispersion and sample preparation by ultrasound. The nanoparticles size significantly influences their physicochemical properties. For example, the catalytic activity of 7 nm CeO2 nanoparticles is likely to be enhanced in comparison to that of 86 nm particles, primarily due to the increased surface area associated with the smaller size.
The high-resolution image (Figure 6b) confirms the crystalline structure of CeO2. We detected an interplanar distance of 0.31 nm on the (111) plane, which is in accordance with previous work [27]. Additionally, the electron diffraction image confirmed the presence of the cubic phase structure of CeO2, as expected.
In Figure 7, the XRD patterns of the CeO2-NPs exhibit peaks values (2θ) of 28.35°, 32.85°, 47.39°, 56.09°, 58.79°, 69.09°, 76.37°, 78.96°, and 88.15°, corresponding to the (111), (200), (220), (311), (222), (400), (331), (420), and (422) planes, respectively. These peaks agree with the typical signals of CeO2-NPs showing a cubic crystalline structure (ICSD 98-006-1595), as demonstrated in previous studies [17,18,19,20,21,22]. The crystallite size (D) was calculated by Scherrer’s equation:
D = 0.9   λ β cos θ
where λ is the wavelength, β is the full width at half maximum (FWHM), and θ is the Bragg’s angle expressed in radians. The calculated crystal size was ~6.5 nm.
Additionally, the interplanar distance ( d ) for plane (111) was determined by Bragg’s equation:
d = n λ 2 sin θ  
where n is the order of diffraction. The results indicated that the interplanar distance was 0.31 nm for plane (111), consistent with the HR-TEM findings and supported by previous work on green strategies and thermal CeO2-NPs [27].
The FT-IR spectrum (Figure 8) exhibited a peak at 405 cm−1, which corresponds to the Ce–O stretching vibrational mode [19]. Low-intensity peaks were displayed at 1315, 1502, and 1630 cm−1 and are attributed to traces of organic matter from the phytocompounds of the extract. The peak at 3350 cm−1 indicates the presence of O–H groups; nonetheless, it was a low-intensity peak [17,22].
The optical bandgap of the CeO2-NPs was determined using the Tauc plot method (Figure 9) from the UV–Vis absorption spectrum (Figure 9 inset). The Tauc expression relates the optical band gap, Eg, and absorption coefficient, α, in the following expression:
αhν = B [(Eg)]n
where is the photon energy, B is the proportionality constant, and n is a number that depends on the nature of the electronic transitions responsible for the absorption. Eg was determined by fitting the linear zone of (αhν)2 vs. dependence and extrapolating to the energy. The optical band gap obtained for CeO2-NPs was ~3.29 eV. This value corresponds to the band gap energy reported in the literature for CeO2-NPs [1,18]. The bandgap energy of CeO2-NPs indicates their potential for photocatalytic applications. Under the influence of UVA light, these nanoparticles can generate reactive oxygen species, which facilitate the degradation of contaminants in water. Moreover, CeO2-NPs could be used in sensors to detect UVA light.
Table 3 compares the results reported in the literature with our findings regarding size and optical properties, as well as the reaction time of the CeO2-NPs obtained through green synthesis using various plant extracts. Our method results in shorter synthesis times compared with those reported in the literature [16,17,18,19,20,21,22,23].

4. Conclusions

CeO2 nanoparticles were synthesized by the green precipitation method from an aqueous extract of Lycium cooperi. The SEM and EDS results indicate the formation of spherical CeO2-NPs, with an average size of ~85 nm and an elemental composition of Ce and O atoms. However, the TEM results indicate an average size of ~7 nm; this reduction in the CeO2-NPs’ size is attributed to the ultrasonic dispersion process. Thus far, this extract has shown great potential as a green precursor for controlling the synthesis of spherical CeO2-NPs.
The XRD and HR-TEM analyses revealed the formation of cubic-structured CeO2-NP crystals, and the FT-IR spectrum confirmed the presence of the Ce-O stretching bond. Moreover, the calculated CeO2-NPs bandgap was ~3.29 eV, determined from the UV–Vis absorbance spectra and Tauc plot method.
This study demonstrates an affordable and eco-friendly method for obtaining CeO2-NPs. Notably, it reports for the first time the application of L. cooperi extract as a green-derived strategy for controlling the size, morphology, and distribution of cerium oxide nanoparticles. The environmentally friendly synthesis method and the characteristics of the resulting CeO2-NPs can open a new route for extensive biomedical and industrial applications.

Author Contributions

Conceptualization, J.C.-S.; methodology, J.C.-S., J.S.-C., B.V.-S. and E.B.-P.; formal analysis, J.C.-S., J.S.-C., B.V.-S. and E.B.-P.; investigation, J.C.-S., J.S.-C., B.V.-S. and E.B.-P.; data curation, J.C.-S. and J.S.-C.; writing—original draft preparation, J.C.-S., J.S.-C., B.V.-S. and E.B.-P.; writing—review and editing, J.C.-S., B.V.-S. and E.B.-P.; visualization, J.C.-S., B.V.-S. and E.B.-P.; supervision, B.V.-S. and E.B.-P.; project administration, B.V.-S. and E.B.-P.; funding acquisition, B.V.-S. and E.B.-P. All authors have read and agreed to the published version of the manuscript.

Funding

This research was funded by SEP-CONACYT “Proyecto Apoyado por el Fondo Sectorial de Investigación para la Educación” CB2017–2018, grant number A1-S-38368, and Program No. 317330 FOP02 CONACYT, for financial support.

Data Availability Statement

The data from the current study are available in this paper.

Acknowledgments

We thank the Instituto de Ingeniería of Universidad Autónoma de Baja California.

Conflicts of Interest

The authors declare no conflicts of interest.

References

  1. Yan, Y.Q.; Wu, Y.Z.; Wu, Y.H.; Weng, Z.L.; Liu, S.J.; Liu, Z.G.; Han, B. Recent Advances of CeO2-Based Composite Materials for Photocatalytic Applications. ChemSusChem 2024, 17, e202301778. [Google Scholar] [CrossRef] [PubMed]
  2. Othman, A.; Gowda, A.; Andreescu, D.; Hassan, M.H.; Babu, S.V.; Seo, J.; Andreescu, S. Two decades of ceria nanoparticles research: Structure, properties and emerging applications. Mater. Horiz. 2024, 11, 3213–3266. [Google Scholar] [CrossRef]
  3. Bakr, A.M.; Darwish, A.; Azab, A.A.; El Awady, M.E.; Hamed, A.A.; Elzwawy, A. Structural, dielectric, and antimicrobial evaluation of PMMA/CeO2 for optoelectronic devices. Sci. Rep. 2024, 14, 2548. [Google Scholar] [CrossRef]
  4. Motazedian, M.; Hosseinabadi, N.; Khosravifard, A. The ceria–Germania solid oxide hydrogen storage hollow porous nanoparticles. Mater. Chem. Phys. 2023, 307, 128100. [Google Scholar] [CrossRef]
  5. Kalaycıoğlu, Z.; Özuğur Uysal, B.; Pekcan, O.; Erim, F.B. Efficient photocatalytic degradation of methylene blue dye from aqueous solution with cerium oxide nanoparticles and graphene oxide-doped polyacrylamide. ACS Omega 2023, 8, 13004–13015. [Google Scholar] [CrossRef] [PubMed]
  6. Bhushan, S.; Singh, S.; Maiti, T.K.; Das, A.; Barui, A.; Chaudhari, L.R.; Meghnad, G.; Dutt, D. Cerium oxide nanoparticles disseminated chitosan gelatin scaffold for bone tissue engineering applications. Int. J. Biol. Macromol. 2023, 236, 123813. [Google Scholar] [CrossRef]
  7. Vijayan, A.; Ramadoss, S.; Sisubalan, N.; Gnanaraj, M.; Chandrasekaran, K.; Kokkarachedu, V. Cerium Oxide Nanoparticles for Biomedical Applications. In Nanoparticles in Modern Antimicrobial and Antiviral Applications; Springer International Publishing: Cham, Switzerland, 2024; pp. 175–200. [Google Scholar]
  8. Kim, Y.G.; Lee, Y.; Lee, N.; Soh, M.; Kim, D.; Hyeon, T. Ceria-based therapeutic antioxidants for biomedical applications. Adv. Mater. 2024, 36, 2210819. [Google Scholar] [CrossRef] [PubMed]
  9. Sonawane, L.D.; Mandawade, A.S.; Ahemad, H.I.; Aher, Y.B.; Gite, A.B.; Nikam, L.K.; Shinde, S.D.; Jain, G.H.; Patil, G.E.; Shinde, M.S. Sol-gel and hydrothermal synthesis of CeO2 NPs: Their physiochemical properties and applications for gas sensor with photocatalytic activities. Inorg. Chem. Commun. 2024, 164, 112313. [Google Scholar] [CrossRef]
  10. Nyoka, M.; Choonara, Y.E.; Kumar, P.; Kondiah, P.P.; Pillay, V. Synthesis of cerium oxide nanoparticles using various methods: Implications for biomedical applications. Nanomaterials 2020, 10, 242. [Google Scholar] [CrossRef] [PubMed]
  11. Miu, B.A.; Dinischiotu, A. New green approaches in nanoparticles synthesis: An overview. Molecules 2022, 27, 6472. [Google Scholar] [CrossRef] [PubMed]
  12. Nobahar, A.; Carlier, J.D.; Miguel, M.G.; Costa, M.C. A review of plant metabolites with metal interaction capacity: A green approach for industrial applications. BioMetals 2021, 34, 761–793. [Google Scholar] [CrossRef] [PubMed]
  13. Ahmed, S.F.; Mofijur, M.; Rafa, N.; Chowdhury, A.T.; Chowdhury, S.; Nahrin, M.; Saiful Islam, A.B.M.; Ong, H.C. Green approaches in synthesizing nanomaterials for environmental nanobioremediation: Technological advancements, applications, benefits, and challenges. Environ. Res. 2022, 204, 111967. [Google Scholar] [CrossRef] [PubMed]
  14. Yao, X.; Peng, Y.; Xu, L.J.; Li, L.; Wu, Q.L.; Xiao, P.G. Phytochemical and biological studies of Lycium medicinal plants. Chem. Biodivers. 2011, 8, 976–1010. [Google Scholar] [CrossRef] [PubMed]
  15. Yao, R.; Heinrich, M.; Weckerle, C. The genus Lycium as food and medicine: A botanical, ethnobotanical and historical review. J. Ethnopharmacol. 2018, 212, 50–66. [Google Scholar] [CrossRef] [PubMed]
  16. Aseyd Nezhad, S.; Es-haghi, A.; Tabrizi, M.H. Green synthesis of cerium oxide nanoparticle using Origanum majorana L. leaf extract, its characterization and biological activities. Appl. Organomet. Chem. 2020, 34, e5314. [Google Scholar] [CrossRef]
  17. Altaf, M.; Manoharadas, S.; Zeyad, M.T. Green synthesis of cerium oxide nanoparticles using Acorus calamus extract and their antibiofilm activity against bacterial pathogens. Microsc. Res. Tech. 2021, 84, 1638–1648. [Google Scholar] [CrossRef] [PubMed]
  18. Muthuvel, A.; Jothibas, M.; Mohana, V.; Manoharan, C.J.I.C.C. Green synthesis of cerium oxide nanoparticles using Calotropis procera flower extract and their photocatalytic degradation and antibacterial activity. Inorg. Chem. Commun. 2020, 119, 108086. [Google Scholar] [CrossRef]
  19. Manimaran, R. Optimization of Azadirachta indica leaf extract mediated cerium oxide nanoparticles synthesis, characterization, and its applications. Ind. Crops Prod. 2023, 204, 117304. [Google Scholar] [CrossRef]
  20. Parvathy, S.; Manjula, G.; Balachandar, R.; Subbaiya, R. Green synthesis and characterization of cerium oxide nanoparticles from Artabotrys hexapetalus leaf extract and its antibacterial and anticancer properties. Mater. Lett. 2022, 314, 131811. [Google Scholar] [CrossRef]
  21. Ahmed, H.E.; Iqbal, Y.; Aziz, M.H.; Atif, M.; Batool, Z.; Hanif, A.; Yaqub, N.; Farooq, W.A.; Ahmad, S.; Fatehmulla, A.; et al. Green synthesis of CeO2 nanoparticles from the Abelmoschus esculentus extract: Evaluation of antioxidant, anticancer, antibacterial, and wound-healing activities. Molecules 2021, 26, 4659. [Google Scholar] [CrossRef]
  22. Putri, G.E.; Rilda, Y.; Syukri, S.; Labanni, A.; Arief, S. Highly antimicrobial activity of cerium oxide nanoparticles synthesized using Moringa oleifera leaf extract by a rapid green precipitation method. J. Mater. Res. Technol. 2021, 15, 2355–2364. [Google Scholar] [CrossRef]
  23. Sabouri, Z.; Sabouri, M.; Amiri, M.S.; Khatami, M.; Darroudi, M. Plant-based synthesis of cerium oxide nanoparticles using Rheum turkestanicum extract and evaluation of their cytotoxicity and photocatalytic properties. Mater. Technol. 2022, 37, 555–568. [Google Scholar] [CrossRef]
  24. Michael, H. Nee. Lycium cooperi, in Jepson Flora Project (eds.) Jepson eFlora. 2021. Available online: https://ucjeps.berkeley.edu/eflora/eflora_display.php?tid=32210 (accessed on 20 October 2023).
  25. Marslin, G.; Siram, K.; Maqbool, Q.; Selvakesavan, R.K.; Kruszka, D.; Kachlicki, P.; Franklin, G. Secondary Metabolites in the Green Synthesis of Metallic Nanoparticles. Materials 2018, 11, 940. [Google Scholar] [CrossRef] [PubMed]
  26. Wongsa, P.; Phatikulrungsun, P.; Prathumthong, S. FT-IR characteristics, phenolic profiles and inhibitory potential against digestive enzymes of 25 herbal infusions. Sci. Rep. 2022, 12, 6631. [Google Scholar] [CrossRef] [PubMed]
  27. Bi, H.; Zhang, L.X.; Xing, Y.; Zhang, P.; Chen, J.J.; Yin, J.; Bie, L.J. Morphology-controlled synthesis of CeO2 nanocrystals and their facet-dependent gas sensing properties. Sens. Actuators B Chem. 2021, 330, 129374. [Google Scholar] [CrossRef]
Figure 1. (a) L. cooperi plant, (b) morphological characteristics of the leaf and flower, and (c) botanical illustration of the voucher specimen by the Regents of the University of California [24].
Reactions 06 00014 g001
Figure 2. Schematic diagram of L. cooperi aqueous extract preparation process.
Reactions 06 00014 g002
Figure 3. Schematic diagram of CeO2-NPs synthesis process.
Reactions 06 00014 g003
Figure 4. FT–IR (a) and UV–Vis (b) spectra of the L. cooperi aqueous extract.
Reactions 06 00014 g004
Figure 5. SEM (a) and (b) EDS of CeO2-NPs.
Reactions 06 00014 g005
Figure 6. TEM micrographs of CeO2-NPs and size distribution (a), highlighting the crystal structure (b) and interplanar distance (inset).
Reactions 06 00014 g006
Figure 7. XRD patterns of CeO2-NPs.
Reactions 06 00014 g007
Figure 8. FT-IR spectrum of CeO2-NPs.
Reactions 06 00014 g008
Figure 9. Optical bandgap for CeO2-NPs determined using the Tauc model and the UV–Vis spectrum of CeO2-NPs (inset).
Reactions 06 00014 g009
Table 1. Characteristics of L. cooperi plant [24].
L. cooperi Plant
Habit:Glandular-puberulent; branches rigidly ascending to erect, shrub, leafy.
Leaf:Size: 1–3 cm, shape: oblanceolate to obovate.
Flower:Calyx size: 8–15 mm, calyx shape: narrowly bell-shaped, lobe number: 4–5 mm, lobe shape: tube, lobe size: 1.5–3 mm, corolla shape: narrowly funnel-shaped, corolla color: white, corolla size: 9–12 mm.
Fruit:Size: 5–9 mm, color: yellow to orange.
Seed:Several
Distribution:California, Arizona, and Utah.
Table 2. Phytochemical test results of L. cooperi aqueous extract.
MetaboliteTestResult
AlkaloidsHager and tannic acid(+)
FlavonoidsAmmonia(+)
SaponinsFroth’s()
TanninsFeCl3()
TerpenoidsTerpenoid()
Cardiac glycosidesKeller–Kellani(+)
CarbohydratesBenedict(+)
Table 3. A comparison of the green precipitation method for the synthesis of CeO2-NPs reported in the literature with the results obtained in this work.
Plant ExtractSize of NPsBand GapSynthesis Time and TemperatureCalcination Temperature and TimeRef.
Origanum majorana L.~20 nm-48 h at 100 °C450 °C for 4 h[16]
Acorus calamus~22 nm-4 h at RT400 °C for 2 h[17]
Calotropis procera~21 nm~3.3 eV3 h at 85 °C400 °C for 2 h[18]
Azadirachta indica~28 nm---[19]
Artabotrys hexapetalus-~3.2 eV6 h at 80 °C-[20]
Abelmoschus esculentus~36 nm-6 h at 120 °C600 °C for 4 h[21]
Moringa oleifera~17 nm~2.6 eV2 h at 80 °C600 °C for 2 h[22]
Rheum turkestanicum~30 nm~3.3 eV24 h at 80 °C400–600 °C for 2 h[23]
Lycium cooperi~7 nm~3.3 eV1 h at 80 °C400 °C for 2 hThis work
Disclaimer/Publisher’s Note: The statements, opinions and data contained in all publications are solely those of the individual author(s) and contributor(s) and not of MDPI and/or the editor(s). MDPI and/or the editor(s) disclaim responsibility for any injury to people or property resulting from any ideas, methods, instructions or products referred to in the content.

