Article

Calcination Temperature Induced Structural, Optical and Magnetic Transformations in Titanium Ferrite Nanoparticles

1
Laser Spectroscopy and Nanomaterials Lab, Physics Department, University of Allahabad, Allahabad 211002, India
2
The Photonics Laboratory, Changchun Institute of Optics, Fine Mechanics and Physics, Chinese Academy of Sciences, Changchun 130033, China
3
The Institute of Optics, University of Rochester, Rochester, NY 14627, USA
4
Department of Environmental Science, Amity School of Life Sciences, Amity University, Gwalior 474001, India
5
Magnetic and Multiferroic, National Physical Laboratory (NPL), New Delhi 110016, India
*
Authors to whom correspondence should be addressed.
Reactions 2022, 3(1), 224-232; https://doi.org/10.3390/reactions3010017
Submission received: 29 December 2021 / Revised: 4 March 2022 / Accepted: 5 March 2022 / Published: 19 March 2022
(This article belongs to the Special Issue Feature Papers in Reactions in 2021)

Abstract

:
Titanium ferrite represents one of the most promising magnetic materials that exhibits optical absorption in both ultraviolet and visible spectral regions with a range of applications in photocatalysis, giant magnetoresistance, sensors, high-frequency modern power supplies, etc. Here in the present work, we report synthesizing titanium ferrite NPs via the co-precipitation method. As obtained ferrite nanopowders were characterized using XRD, UV-Visible absorption, Raman scattering, and variable sample magnetometer techniques. The crystalline size of NPs lies between 35 to 50 nm. The as-obtained nanopowder samples were calcined at 200, 500, 800 °C temperatures, and the resulting change in the optical, structural, and magnetic properties are investigated. The saturation magnetization of 500 °C calcined sample is higher than that calcined at 200 °C, but the magnetization value drastically becomes reduced for powder calcined at 800 °C temperature. The results of the present work can be used to understand the effects of annealing temperature on the structural and magnetic properties of other ferrite nanomaterials.

1. Introduction

Over the past decades, many efforts have been made by researchers all over the world to synthesize a variety of functional magnetic nanomaterials. Among all types of nanomaterials, magnetic nanomaterials have become one of the most investigated materials due to their unusual properties and wide range of applications including photocatalysis, giant magnetoresistance, sensors, high-frequency telecommunication, modern power supplies, etc. [1,2]. Iron and its mixed oxides bear multifunctional properties. For example, zinc doped iron–oxide or iron doped zinc–oxide have semiconducting, fluorescent, and magnetic properties. This means that the electrical conductivity and optical emission of these materials, generally known as spintronic materials, can be tailored by applying an external magnetic field [3]. These types of multi-functionalities have already been applied to sensing, biomedical, hyperthermia, energy storage, electrocatalysts, batteries, and environmental remediation [4]. To optimize the performance of magneto-optical, magneto-electronic, and other magnetism responsive switches and devices, various functionalities should be independently studied. Ferrite nanomaterials (MFe2O4; where M = Zn, Cu, Ni, Co, Ti, etc.), where a transition metal is doped into the standard spinel of magnetite (Fe3O4) have recently attracted great interest due to their wide applications in biomedical, wastewater treatment, catalysis, and electronic devices. Functionalizing non-magnetic oxides with magnetism can benefit magnetic field induced control and activation of chemical reaction and recycling of photocatalysts from the solution through the application of an external magnetic field [4].
Various physical and chemical approaches were researched to synthesize ferrite nanoparticles [4,5,6,7,8,9,10,11]. Among these, the chemical co-precipitation approach exhibits unique advantages owing to its simplicity, usage of low-cost equipment, and capability of mass production [12,13,14]. Here, we report synthesizing titanium ferrite (TiFe2O4) nanoparticles via co-precipitation reaction and calcined the as-obtained power at different temperatures. The effects of annealing temperature on optical, structural, and magnetic properties of nanopowders are studied.

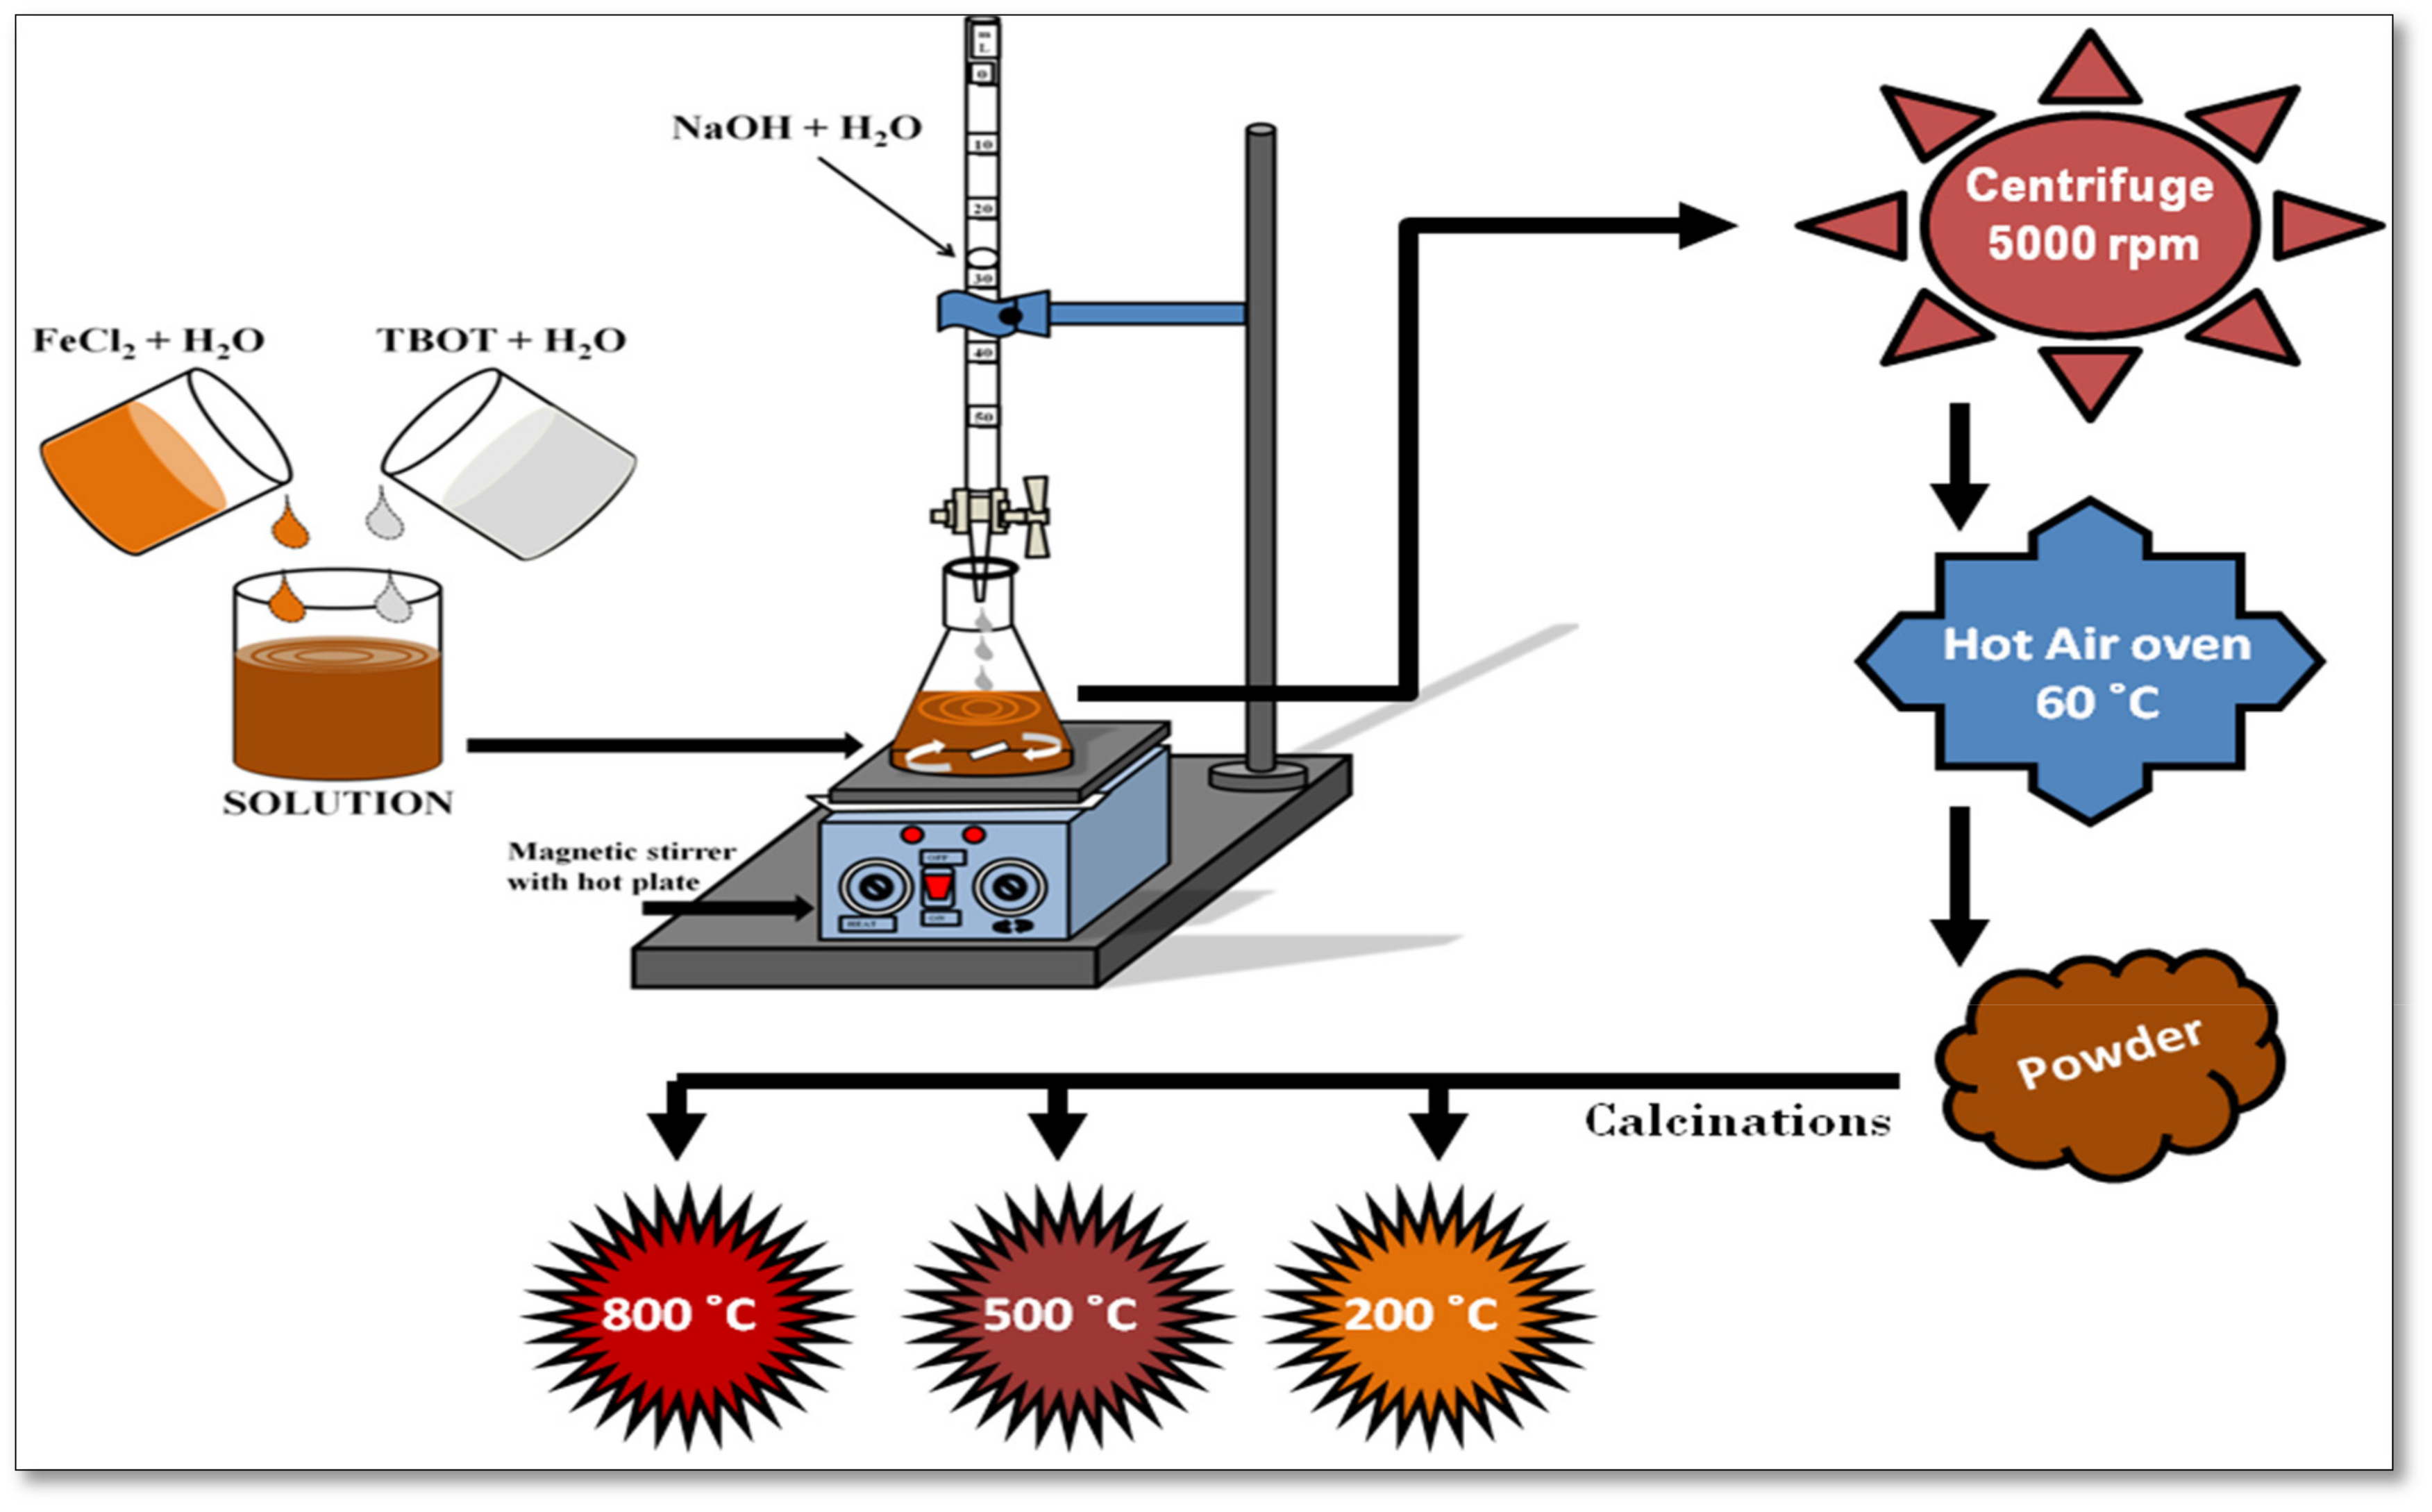
2. Synthesis and Characterizations

Titanium ferrite nanopowders (NPs) were synthesized using the co-precipitation method, as illustrated in Figure 1. In a typical process, 0.19 M FeCl2 (ferrous chloride) aqueous solution was stirred for 10 min at 50 °C temperature. One ml of TBOT (titanium n-butoxide) was added into 30 mL of doubled distilled water with continuous stirring for 10 min to form a translucent solution. The two solutions were transferred into a conical flask to make a reaction mixture. An aqueous solution of 0.2 M NaOH was added drop by drop into the reaction mixture with continuous stirring to form a precipitate. As obtained precipitate was separated from the reaction mixture through centrifugation at 5000 rpm followed by multiple rounds of washing with ethanol and distilled water. The precipitate was dried in a hot air oven at 60 °C for 12 h. Materials produced by chemical methods, such as co-precipitation, generally exhibit poor crystallinity, impurities, and thus low ferromagnetism, therefore they require thermal annealing to improve their quality. Therefore, the dried powder was calcined at 200, 500, and 800 °C temperatures into a muffle furnace for about 12 h. The samples calcined at 200, 500, and 800 temperatures are named CP-01-200, CP-01-500, and CP-01-800, respectively.
UV–visible absorption spectra of water dispersed calcined powder samples were recorded using PerkinElmer (Waltham, MA, USA) Lambda-35 double beam spectrophotometer. The morphology of CP-01-200 nanopowder was measured using a scanning electron microscope (SEM) model JSM 6490 attached with EDS. The effects of calcination temperature on structural and phase transformation were studied usi Billerica, MAng X-ray diffraction employing Cu Kα line (λ = 1.05406 Å) from a Brukar (Billerica, MA, USA) D8 Advance diffractometer operating at 45 kV. The structural properties and phase of the samples were confirmed for Raman spectroscopic measurements using UniRAM (UniNanoTech, Beijing, China) micro-Raman spectrometer equipped with 785 nm excitation laser and BX3 microscope system with eyepiece 10×. Raman spectra were recorded in the wavenumber region 0–2000 cm–1 at a resolution of 1 cm–1 using 10× optical zoom. Magnetization–Magnetic field (M-H) curves for all the three nanopowder samples were measured using Lakeshore (Westerville, OH, USA) vibrating sample magnetometer at room temperature.

3. Results & Discussions

3.1. UV-Visible Absorption and Crystallographic Properties of Titanium Ferrite Nanopowders

The XRD patterns of titanium ferrite nanopowder calcined at different temperatures are shown in Figure 2a The XRD peaks of all the calcined powders show the formation of the pseudobrookite (TiFe2O5−x) phase of titanium ferrite. This phase is possibly produced through a solid-state reaction (TiO2 + Fe2O3−x = TiFe2O5−x) between Fe2O3 and TiO2 nanopowders produced through co-precipitation. A careful analysis of the XRD pattern shows the presence of two systems of Fe2TiO5−x (pseudobrookite) in each of the powder samples. The XRD peaks marked with # are assigned to the orthorhombic system with crystalline parameters a = 9.79Å, b = 9.93 Å, and c = 3.72 Å (JCPDS No. 761743). The remaining intense XRD peaks are assigned to the monoclinic phase of Fe2TiO5 with lattice parameters a = 10.10 Å, b = 5.03 Å, and c = 7.02 Å (JCPDS No. 731898). In all three samples, the monoclinic system exhibits a higher abundance than the orthorhombic system. Scherrer’s equation (D = 0.9λ/βcosθ); where λ = 1.05406 Å is X-ray wavelength, β is FWHM of the XRD peak, θ is the Bragg angle for X-ray diffraction, is used to calculate crystalline size along (112) plane. For [112] growth direction, an increase in the calcination temperature from 200 to 500 degrees C decreases the crystalline size from 44 to 31 nm, but a further increase in the calcination temperature from 500 to 800 °C increases the crystalline size of nanoparticles from 31 to 48 nm. The effective ionic radii of Fe3+ and Ti4+ are 0.65 Å and 0.51 Å, respectively, due to which there may be fixed cationic distributions of Fe3+/ Ti4+ in the 4c and 8f sites concerning the main phase of titanium ferrite NPs compositions [15,16]. It was found that close contact of NPs with a temperature of more than 400 °C the average crystalline size tends to increase and there are various factors associated with them such as structure defects, crystal imperfections, tension, etc. [1]. The intensity ratio of (022) and (112) peaks are significantly affected by the calcination temperature. For instance, the intensity ratio is close to unity for the nanopowder sample calcined at 200 °C temperature, while it increases close to two for the nanopowder sample calcined at 500 °C temperature. Further, an increase in the calcination temperature to 800 °C abruptly decreases the ratio close to 0.1.
The UV-visible absorption spectra of water dispersed calcined powders are shown in Figure 2b. The nanopowder samples exhibit broad absorption from 300–700 nm where the position of the central intense peak shows a longer wavelength shift with an increase in the calcination temperature [17,18]. An increase in the optical absorption for samples produced at the higher temperature is possibly due to improved crystallinity. The longer wavelength shift in the optical absorption peak shows an increase in the particle size with calcination temperature [19,20,21,22,23]. Particle size generally increases with annealing temperature due to agglomeration/aggregation of smaller particles and formation of larger size particles. Similarly, larger size crystals are formed due to a decrease in imperfections. An increase in the particle size results in a decrease in the bandgap energy leading to a redshift in the optical absorption. The sample calcined at 800 °C shows the appearance of a shoulder at 375 nm and an intense peak at 625 nm. The lower wavelength peak displays the contribution from titanium dioxide while the longer wavelength is due to the presence of iron–oxide. At high-temperature calcination, some of the iron ferrite nanoparticles possibly become decomposed into constituent titanium dioxide and iron–oxide nanoparticles resulting in the appearance of their corresponding absorption peaks [24,25].
Following Beer’s law, the optical absorption coefficient of semiconductor nanoparticles is related to its bandgap energy by α = A h υ E g n / h υ , where A is constant, E g is bandgap energy of the material, and the exponent n may have values 1/2, 2, 3/2, and 3 corresponding to allowed direct, allowed indirect, forbidden direct, and forbidden indirect semiconductor, respectively [26]. The region of fundamental absorption, which corresponds to the electronic transition from the top of the valance band to the bottom of the conduction band can be used to calculate the bandgap energy of the material using the above expression. The h υ derivative of l n α h υ = n l n A h υ E g results in expression d l n α h υ / d h υ = n / h υ E g . When h υ = E g , the plot of d l n α h υ / d h υ versus h υ shows divergence. The d l n α h υ / d h υ versus h υ plots for samples annealed at 200 and 800 degrees C temperatures, are shown in Figure 3. The sample annealed at 200 °C shows bandgap energy of 2.3 eV, while the one annealed at 800 °C has a bandgap energy of 2 eV.

3.2. Morphological and Compositional Investigation of Nanopowder

The SEM image of the CP-01-200 nanopowder and corresponding EDS spectrum is shown in Figure 4. It is seen from the micrograph that the NPs are spheroidal in shape. However, due to the strong magnetic behavior of nanoparticles, they tend to form clusters. The nanoparticles range in size from 40 to 100 nm. The EDS spectrum (Figure 4b) also confirms the presence of Ti, Fe, and O in the nanopowder confirming the formation of titanium ferrite NPs.

3.3. Structural Characterization of Calcined Nanopowders Using Vibrational Spectroscopic Techniques

Raman spectroscopy is a contactless and non-destructive optical spectroscopy technique that is sensitive to structural disorders in materials. The room temperature micro-Raman spectra of titanium ferrite nanopowder calcined at different temperatures are shown in Figure 5. The Raman spectrum of each sample bears five first-order Raman active modes. The Raman peaks at 228, 409, and 517 cm−1 are assigned to F2g(1), F2g(2), and F2g(3) modes, respectively, of titanium ferrite. The Raman peaks at 295 and 646 cm−1 are assigned to Eg and A1g vibrational modes. The origin of A1g mode is symmetric stretching of oxygen atoms along with Ti-O or Fe-O tetrahedral bonds, while F2g(3) and Eg originate from asymmetric and symmetric bending of oxygen atoms, respectively. The F2g(2) band is due to asymmetric stretching of Ti-O or Fe-O bond while F2g(1) is due to the translational motion of the entire tetrahedron. These five vibrational bands combined (A1g + Eg + 3F2g) are characteristic of a typical spinel structure of a metal ferrite (MFe2O4) [4,27]. It is interesting to observe that each of the Raman peaks is composed of a closely spaced doublet, which is a typical characteristic of the inverse spinel structure [28,29].

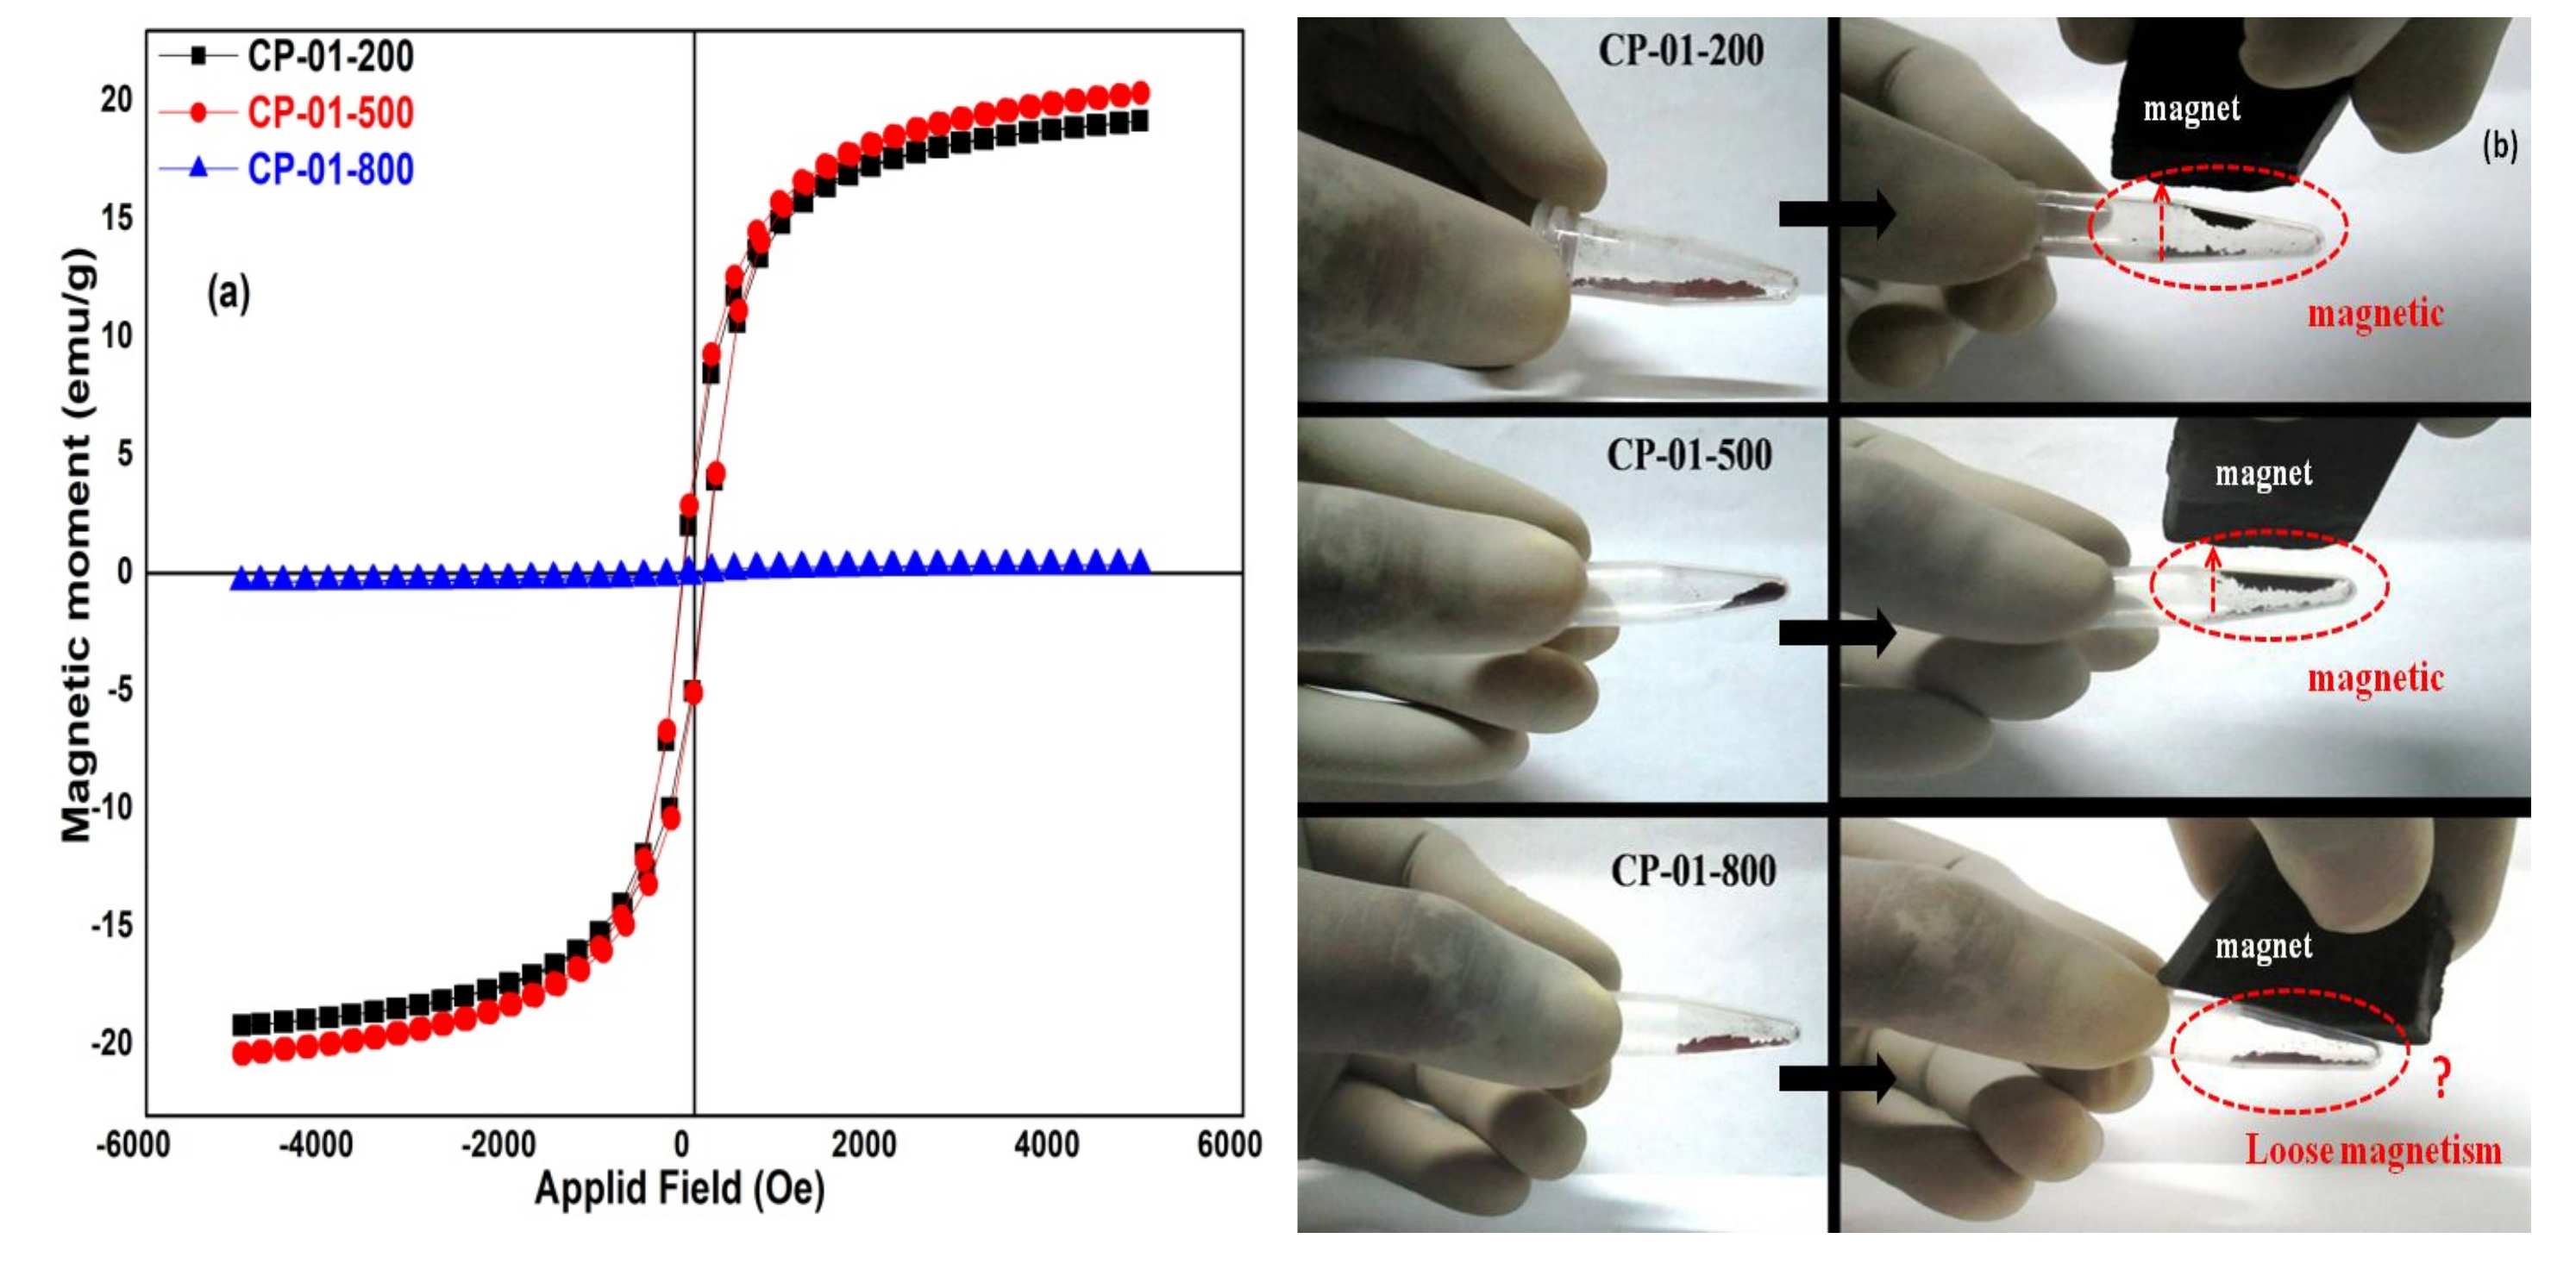
3.4. Magnetic Properties of Titanium Ferrite Nanopowder Calcined at Different Temperatures

The magnetic moment versus magnetic field (M-H) curves for titanium ferrite nanopowders calcined at different temperatures are shown in Figure 6a. Figure 6b represents their photographs demonstrating the response of different nanopowders against a permanent magnet. The nanopowder samples calcinated at 200 °C and 500 °C show ferromagnetic behavior while the one calcinated at 800 °C exhibits a paramagnetic nature. As observed from Table 1 and Figure 6a, as the calcinated temperature increases from 200 °C to 500 °C their remanence, saturation magnetization, and coercivity value increases. However, an increase in the calcination temperature to 800 °C abruptly decreases remanence and saturation magnetization but increases its coercivity value. A careful analysis of XRD and magnetization data together shows that the magnetic property of the titanium ferrite nanopowder is directly proportional to the growth of the crystal along [022] direction, while it is inversely proportional to the growth of the crystal along [112] direction. Moreover, the magnetic properties of nanopowders rely on their crystalline size in a particular direction, surface composition, and defects [30,31,32]. Singh et al. reported that the presence of oxygen vacancies generates spins and hence magnetization even in non-magnetic materials [33,34]. As we can see here, crystalline size along [112] direction decreases from 44 to 31 nm with an increase in the calcination temperature from 200 to 500 °C causes an increase in the magnetization properties. Opposite to this, the crystalline size increases from 31 to 48 nm for a change in the calcination temperature from 500 to 800 °C that results in an abrupt decrease in the saturation magnetization.
As can be seen from the XRD and magnetic measurements, an increase in the calcination temperature from 200 to 500 °C increases the size of the NPs, the intensity ratio for (022) and (112) XRD peaks, and the ferromagnetism. It seems that crystalline growth along [022] direction supports ferromagnetism, while the growth along [112] direction opposes. Therefore, the ratio of these two peaks can be used as a decisive parameter in the ferromagnetism of titanium ferrite nanoparticles. Calcination of the powder at 800 °C resulted in a decrease in the ferromagnetism possibly due to thermal decomposition of some of the titanium ferrite NPs into its components causing the appearance of optical absorption peaks at 375 and 625 nm. The second possibility is a loss in the long-range ferromagnetism in the sample when heated to a temperature (1373 K) larger than the Curie temperature (577 K) as a consequence of spin disordering [35].

3.5. Reactions during Synthesis and Calcination

We employed FeCl2 as an iron precursor and titanium (IV) butoxide (Ti(C4H9O)4), termed as Ti(OBu)4, as titanium precursor for the synthesis of TiFe2O4 nanomaterials. Analogous to alkoxide exchange, titanium butoxide readily hydrolyzes to titanium dioxide using the following reaction:
Ti(OBu)4 + H2O→TiO2 + 4HOBu
Ti(OBu)4 also reacts with NaOH to produce Ti(OH)4 nanoparticles followed by their hydrothermal conversion to final TiO2 Nanoparticles as follows:
Ti(OBu)4 + 4NaOH→Ti(OH)4 + 4NaOBu
Ti(OH)4→TiO2 + 2H2O
The hydrolysis of Ti(OBu)4 following the reaction (1) possibly forms seeds or suspensions of TiO2 NPs. The seeds or small nanoparticles grow following step (3) and become sedimented at the bottom of the reaction chamber.
Similarly, FeCl2 reacts with NaOH to produce Fe(OH)2 intermediate nanoparticles followed by hydrothermal conversion of Fe(OH)2 NPs to FeO nanoparticles. The reactions are as follows:
FeCl2 + 2NaOH→Fe(OH)2 + 2NaCl
2Fe(OH)2→2FeO + 2H2O
The solid-state reaction between TiO2 and FeO NPs, when the sediment mixture becomes calcined at different temperatures, results in TiFe2O4 nanoparticles as follows:
TiO2 + 2FeO→TiFe2O4
The temperature used for the calcination of NPs can control the amount of oxygen thus magnetic properties of the product nanoparticles as follows:
2TiFe2O4 + O2→2TiFe2O5

4. Conclusions

Titanium ferrite NPs were successfully synthesized using a chemical co-precipitation technique. Variation of the calcinated temperature on the samples provides a good impact on the size, structural, bonding nature, optical and magnetic properties. X-ray diffraction pattern confirms the formation of titanium ferrite NPs in which one of its phases Fe2TiO5 emerges prominently in higher calcinated temperature 800 °C sample. The bandgap energy decreases with an increase in the calcination temperature on the samples which are concluded by UV–Vis analysis. Raman and XRD measurements show the formation of titanium ferrite NPs and the involvement of defects in the system. The magnetic properties of the resulting samples show the direct impact of calcination temperature in the magnetic values up to the 500 °C samples by exhibiting ferromagnetic behavior and beyond 500 °C when the temperature reaches 800 °C revealing paramagnetic behavior. We hypothesize that the growth of the nanocrystal along [022] direction supports ferromagnetism, while the growth along [112] direction opposes. Therefore, the ratio of these two peaks can be employed as a decisive parameter in the ferromagnetism of titanium ferrite nanoparticles. The results of the present work can be used to understand the effect of annealing temperature on the structural and ferromagnetic properties of other ferrite nanomaterials.

Author Contributions

Conceptualization, A.S., S.C.S. and R.G.; methodology, A.S. and A.B.; formal analysis, A.S., S.C.S. and R.G.; investigation, R.G; resources, R.G., K.N.U., R.K.K.; writing—original draft preparation, A.S.; writing—review and editing, S.C.S. and C.G.; supervision, R.G., K.N.U. and S.C.S.; project administration, R.G.; funding acquisition, R.G. All authors have read and agreed to the published version of the manuscript.

Funding

This research was funded by Board of Research in Nuclear Sciences, Mumbai, Grant number: 2012/34/29 and Science and Engineering Research Board, New Delhi, Grant No. DST-FPS/PS-106/12.

Institutional Review Board Statement

Not applicable for studies not involving humans or animals.

Informed Consent Statement

Not applicable for studies not involving humans.

Data Availability Statement

The data presented in this study are available on request from the corresponding author.

Conflicts of Interest

The authors declare no conflict of interest. The funders had no role in the design of the study; in the collection, analyses, or interpretation of data; in the writing of the manuscript, or in the decision to publish the results.

References

  1. Kalska-Szostko, B.; Wykowska, U.; Satula, D.; Nordblad, P. Thermal treatment of magnetite nanoparticles. Beilstein J. Nanotechnol. 2015, 6, 1385–1396. [Google Scholar] [CrossRef] [Green Version]
  2. Go’mez-Polo, C.; Larumbe, S.; Barquín, L.F.; Fernández, L.R. Magnetic induction heating as a new tool for the synthesis of Fe3O4–TiO2 nanoparticle systems. J. Nanopart. Res. 2016, 18, 118–127. [Google Scholar] [CrossRef]
  3. Küchler, R.; Hiergeist, P.; Abstreiter, G.; Reithmaier, J.-P.; Riechert, H.; Lösch, R. Magneto-Luminescence and Magneto-Luminescence Excitation Spectroscopy in Strained Layer Heterostructures. In High Magnetic Fields in Semiconductor Physics III. Springer Series in Solid-State Sciences; Landwehr, G., Ed.; Springer: Berlin/Heidelberg, Germany, 1992. [Google Scholar] [CrossRef]
  4. Shukla, A.; Pandey, B.K.; Singh, S.C.; Uttam, K.N.; Shah, J.; Kotnala, R.K.; Kumar, A.; Gopal, R. Liquid-Assisted Pulsed Laser Ablation Synthesis of Titanium Ferrite Nanomaterials. Mater. Focus 2015, 4, 327–332. [Google Scholar] [CrossRef]
  5. Fu, Z.; Jiang, T.; Liu, Z. Highly photoactive Ti-doped α-Fe2O3 nanorod arrays photoanode prepared by a hydrothermal method for photoelectrochemical water splitting. Electrochim. Acta 2014, 129, 358–363. [Google Scholar] [CrossRef]
  6. Maaz, K.; Karim, S.; Mumtaz, A.; Hasanain, S.K. Synthesis and magnetic characterization of nickel ferrite nanoparticles prepared by co-precipitation route. J. Magn. Magn. Mater. 2009, 321, 1838–1842. [Google Scholar] [CrossRef]
  7. Ziarati, A.; Sobhani-Nasab, A.; Rahimi-Nasrabadi, M.; Ganjali, M.R.; Badiei, A. Sonication method synergism with rare earth based nanocatalyst: Preparation of NiFe2–xEuxO4 nanostructures and its catalytic applications for the synthesis of benzimidazoles, benzoxazoles, and benzothiazoles under ultrasonic irradiation. J. Rare Earths 2017, 35, 374–381. [Google Scholar] [CrossRef]
  8. Sobhani-Nasab, A.; Zahraei, Z.; Akbari, M.; Maddahfar, M.; Hosseinpour-Mashkani, S.M. Synthesis, characterization, and antibacterial activities of ZnLaFe2O4/NiTiO3 nanocomposite. J. Mol. Struct. 2017, 1139, 430–435. [Google Scholar] [CrossRef]
  9. Hosseinpour-Mashkani, S.M.; Maddahfar, M.; Sobhani-Nasab, A. Novel Silver-doped NiTiO3: Auto-combustion Synthesis, Characterization and Photovoltaic Measurements. S. Afr. J. Chem. 2017, 70, 44. [Google Scholar] [CrossRef] [Green Version]
  10. Cheng, T.C.; Yao, K.S.; Yeh, N.; Chang, C.I.; Hsu, H.C.; Chien, Y.T.; Chang, C.Y. Visible light activated bactericidal effect of TiO2/Fe3O4 magnetic particles on fish pathogens. Surf. Coat. Technol. 2009, 204, 1141. [Google Scholar] [CrossRef]
  11. Elhami, V.; Karimi, A. Preparation of Kissiris/TiO2/Fe3O4/GOx Biocatalyst: Feasibility study of MG decolorization. Adv. Environ. Technol. 2016, 2, 111. [Google Scholar]
  12. Jiang, W.; Zhang, X.; Gong, X.; Yan, F.; Zhang, Z. Sonochemical synthesis and characterization of magnetic separable Fe3O4-TiO2 nanocomposites and their catalytic properties. Int. J. Smart Nano Mater. 2010, 1, 278–287. [Google Scholar] [CrossRef]
  13. Gul, I.H.; Ahmed, W.; Maqsood, A. Electrical and magnetic characterization of nanocrystalline Ni–Zn ferrite synthesis by co-precipitation route. J. Magn. Magn. Mater. 2008, 320, 270–275. [Google Scholar] [CrossRef]
  14. Peña-Flores, J.I.; Palomec-Garfias, A.F.; Márquez-Beltrán, C.; Sánchez-Mora, E.; Gómez-Barojas, E.; Pérez-Rodríguez, F. Fe effect on the optical properties of TiO2:Fe2O3 nanostructured composites supported on SiO2 microsphere assemblies. Nanoscale Res. Lett. 2014, 9, 499. [Google Scholar] [CrossRef] [PubMed] [Green Version]
  15. Guo, W.Q.; Malus, S.; Ryan, D.H.; Altounian, Z. Crystal structure and cation distributions in the FeTi2O5–Fe2TiO5 solid solution series. J. Phys. Condens. Matter 1999, 11, 6337–6346. [Google Scholar] [CrossRef]
  16. Shukla, A.; Singh, S.C.; Pandey, B.K.; Uttam, K.N.; Shah, J.; Kotnala, R.K.; Gopal, R. Liquid-assisted pulsed laser ablation synthesized titanium ferrite nanoparticles: Structural, optical and magnetic properties. Adv. Mater. Lett. 2015, 6, 1066–1072. [Google Scholar]
  17. Seitz, G.; Penin, N.; Decoux, L.; Wattiaux, A.; Duttine, M.; Gaudon, M. Near the Ferric Pseudobrookite Composition (Fe2TiO5). Inorg. Chem. 2016, 55, 2499–2507. [Google Scholar]
  18. Singh, S.C.; Gopal, R. Laser irradiance and wavelength-dependent compositional evolution of inorganic ZnO and ZnOOH/organic SDS nanocomposite material. J. Phys. Chem. C 2008, 112, 2812–2819. [Google Scholar]
  19. Yu, W.; Yin, J.; Li, Y.; Lai, B.; Jiang, T.; Li, Y.; Liu, H.; Liu, J.; Zhao, C.; Singh, S.C.; et al. Ag2S quantum dots as an infrared excited photocatalyst for hydrogen production. Appl. Energy Mater. 2019, 4, 2751–2759. [Google Scholar] [CrossRef]
  20. Bhardwaj, A.K.; Shukla, A.K.; Maurya, S.; Singh, S.C.; Uttam, K.N.; Sundaram, S.; Singh, M.P.; Gopal, R. Direct sunlight enabled photo-biochemical synthesis of silver nanoparticles and their Bactericidal Efficacy: Photon energy as key for size and distribution control. J. Photochem. Photobiol. B Biol. 2018, 188, 42–49. [Google Scholar] [CrossRef]
  21. Singh, S.C.; Li, H.; Yao, C.; Zhan, Z.; Yu, W.; Yu, Z.; Guo, C. Structural and compositional control in copper selenide nanocrystals for light-induced self-repairable electrodes. Nano Energy 2018, 51, 774–785. [Google Scholar] [CrossRef]
  22. Singh, S.C. Zinc Oxide Nanostructures: Synthesis, Characterizations and Device Applications. J. Nanoeng. Nanomanufact. 2012, 3, 283–310. [Google Scholar] [CrossRef]
  23. Singh, S.C. Effect of oxygen injection on the size and compositional evolution of ZnO/Zn(OH)2 nanocomposite synthesized by pulsed laser ablation in distilled water. J. Nanopart. Res. 2011, 13, 4143–4152. [Google Scholar] [CrossRef]
  24. Reyes-Coronado, D.; Rodríguez-Gattorno, G.; Espinosa-Pesqueira, M.E.; Cab, C.; de Coss, R.; Oskam, G. Nanotechnology Phase-pure TiO2 nanoparticles: Anatase, brookite and rutile. Nanotechnology 2008, 19, 145605. [Google Scholar] [CrossRef]
  25. Maiti, D.; Manju, U.; Velaga, S.; Devi, P.S. Phase Evolution and Growth of Iron Oxide Nanoparticles: Effect of Hydrazine Addition During Sonication. Cryst. Growth Des. 2013, 13, 3637–3644. [Google Scholar] [CrossRef]
  26. Singh, S.C.; Gopal, R. Drop shaped zinc oxide quantum dots and their self-assembly into dendritic nanostructures: Liquid assisted pulsed laser ablation and characterizations. Appl. Surf. Sci. 2012, 258, 2211–2218. [Google Scholar] [CrossRef]
  27. Lazarević, Z.Ž.; Jovalekić, Č.; Milutinović, A.; Sekulić, D.; Slankamenac, M.; Romčević, M.; Romčević, N.Ž. Study of NiFe2O4 and ZnFe2O4 Spinel Ferrites Prepared by Soft Mechanochemical Synthesis. Ferroelectrics 2013, 448, 1–11. [Google Scholar] [CrossRef]
  28. Ahlawat, A.; Sathe, V.G. Raman study of NiFe2O4 nanoparticles, bulk and films: Effect of laser power. J. Raman Spectrosc. 2011, 42, 1087. [Google Scholar] [CrossRef]
  29. Sousa, M.H.; Tourinho, F.A.; Rubim, J.C. Use of Raman micro-spectroscopy in the characterization of MIIFe2O4 (M = Fe, Zn) electric double layer ferrofluids. J. Raman Spectrosc. 2000, 31, 185. [Google Scholar] [CrossRef]
  30. Camargo, P.H.; Nunes, G.G.; Sá, E.L.D.; Tremiliosi-Filho, G.; Evans, D.J.; Zarbin, A.J.; Soares, J.F. Synthesis of Fe/Ti Oxides from a Single Source Alkoxide Precursor under Inert Atmosphere. J. Braz. Chem. Soc. 2008, 8, 1501–1512. [Google Scholar] [CrossRef]
  31. Camargo, P.H.C.; Nunes, G.G.; Friedermann, G.R.; Evans, D.J.; Leigh, G.J.; Tremiliosi-Filho, G.; de Sa, E.L.; Zarbin, A.J.G.; Soares, J.F. Titanium and iron oxides produced by sol–gel processing of [FeCl{Ti2(OPri)9}]: Structural, spectroscopic and morphological features. Mater. Res. Bull. 2003, 38, 1915–1928. [Google Scholar] [CrossRef]
  32. Zhu, S.; Yao, F. Fe2O3/TiO2 photocatalyst of hierarchical structure for H2 production from water under visible light irradiation. Microporous Mesoporous Mater. 2014, 190, 10–16. [Google Scholar] [CrossRef]
  33. Singh, S.C.; Kotnala, R.K.; Gopal, R. Room temperature ferromagnetism in liquid-phase pulsed laser ablation synthesized nanoparticles of nonmagnetic oxides. J. Appl. Phys. 2015, 118, 064305. [Google Scholar] [CrossRef] [Green Version]
  34. Shukla, A.; Bhardwaj, A.K.; Singh, S.C.; Uttam, K.N.; Gautam, N.; Himanshu, A.K.; Shah, J.; Kotnala, R.K.; Gopal, R. Microwave assisted scalable synthesis of titanium ferrite nanomaterials. J. Appl. Phys. 2018, 123, 161411. [Google Scholar] [CrossRef]
  35. Amyn, S.T.; Pei-Yoong, K. Synthesis, Properties, and Applications of Magnetic Iron Oxide Nanoparticles. Prog. Cryst. Growth Charact. Mater. 2009, 55, 22–45. [Google Scholar]
Figure 1. Procedure illustration for the synthesis of titanium ferrite NPs using the co-precipitation method.
Reactions 03 00017 g001
Figure 2. (a) XRD and (b) UV–visible absorption measurements of titanium ferrite nanopowder calcined at different temperatures. XRD peaks marked with # are assigned to the orthorhombic system.
Reactions 03 00017 g002
Figure 3. Determination of bandgap energy using of titanium ferrite nanopowder calcined at (a) 200 and (b) 800 °C temperatures using dln(αhν)/dhν plot of corresponding UV–visible absorption data.
Reactions 03 00017 g003
Figure 4. (a) Scanning electron microscopic image and (b) EDS spectrum of CP-01-200 nanopowder. A strong EDS peak of Al is from the Al coated carbon tape.
Reactions 03 00017 g004
Figure 5. Raman spectra of NPs calcined at different temperatures.
Reactions 03 00017 g005
Figure 6. M-H loop of titanium ferrite NPs synthesized with (a) different calcined temperatures and (b) magnetism behavior of samples in physical mode.
Reactions 03 00017 g006
Table 1. Magnetic parameter of titanium ferrite NPs calcined at different temperatures.
S. NoSampleMs (emu/g)Mr (emu/g)Hc (Oe)
1.CP-01-20019.1693.897115.461
2.CP-01-50020.3584.564133.095
3.CP-01-8000.3760.085225.966
Publisher’s Note: MDPI stays neutral with regard to jurisdictional claims in published maps and institutional affiliations.

